Article

Optical-Sensor-Based Nitrogen Management in Oat for Yield Enhancement

1
Department of Agronomy, The University of Haripur, Haripur 22620, Pakistan
2
College of Life Sciences, Yanan University, Yanan 716000, China
3
Fodder Research Programme, Crop Sciences Institute, National Agriculture Research Center, Islamabad 44000, Pakistan
4
Department of Plant Breeding & Genetics, The University of Haripur, Haripur 22620, Pakistan
*
Authors to whom correspondence should be addressed.
Sustainability 2021, 13(12), 6955; https://doi.org/10.3390/su13126955
Submission received: 11 May 2021 / Revised: 10 June 2021 / Accepted: 15 June 2021 / Published: 21 June 2021

Abstract

:
The deficiency of nitrogen (N) in soil restricts agricultural productivity and its overdosage pollutes the atmosphere. Nitrogen is a vital component of protein, chlorophyll and various physiological processes. When it is applied at a recommended dose, it may be lost through fixation, leaching, volatilization and denitrification, etc. Therefore, there is a dire need to harmonize the supply of nitrogen according to crop and soil requirements. Under this situation, precision nitrogen management is one of the best options. GreenSeekerTM is an integrated optical sensor with a variable application rate and mapping system that measures crops’ nitrogen requirements. To ascertain the abovementioned facts, a research study was conducted at the National Agriculture Research Center, Islamabad, Pakistan, to examine the response of fodder oat to nitrogen management (N0 = control, N1 = 80 kg ha−1 basal dose, N2 = 40 + 40 kg ha−1 split doses, N3 = 40 kg ha−1 with one-time management with GreenSeekerTM and N4 = 20 kg ha−1 with two-time management with GreenSeekerTM) and seed rate (S1 = 80, S2 = 100, S3 = 120 and S4 = 140 kg ha−1). Data were recorded on the agronomic and physiological aspects of the crop and economic analysis was performed for GreenSeekerTM-based N application against the conventional recommended dose of nitrogen application. Mean values showed that greater number of tillers plant−1 (6), fresh weight (16572 kg) and photosynthetic rate (11.64 mmol m−2 s−1) were noted in the treatment N4 (20 kg ha−1 and two-time management with GreenSeekerTM). Greater plant height (70.8 cm) and leaf area (64.14 cm2) were recorded in treatment N2 (40 + 40 kg ha−1 split doses) as compared to the control. The effects of nitrogen on fodder oat were forecasted through NDVI. The results suggested that nitrogen treatment N4 (18 kg ha−1) managed by GreenSeeker in the PARC Oat cultivar produced the maximum NDVI value (0.68) at the booting stage among all treatments. The correlation of NDVI at the tillering and booting stages with green fodder yield was positive (R2 = 0.80). Therefore, the tillering and booting stages can be good depictive stages at early and later growth stages of fodder oat under the agro-climatic conditions of Islamabad, Pakistan. Based on the results, it is recommended to apply an initial dose of 20 kg ha−1 nitrogen along with two-time management with GreenSeekerTM for obtaining more green fodder yield in fodder oat. In Crux, with N1, a total of 80 kg ha−1 nitrogen was applied to achieve an estimated net profitability of USD 582.13. With N4, a total 58 kg ha−1 nitrogen was used to achieve a net profitability of USD 836.16; therefore, this treatment was found to be environmentally safe as compared to N1 (80 kg ha−1).

1. Introduction

The productivity of agricultural crops is affected by various factors, of which proper nutrition and optimum seed rate cause major constraints [1]. Among the many other reasons for the lower production of oat, low fertility status of soil is also a major problem. Moreover, less N is available in the cultivated soils of the world, and its adequate application is essential to maintain crop quality and maximize the production of fodder crops [2]. Nitrogen plays a key role in photosynthesis and is also an essential constituent of proteins and nucleic acids. It is of great importance due to its special status as a prominent limiting nutrient in crop production [3]. In this condition, site-specific N application can successfully replace the extensive fertilizer N endorsements for achieving high N-use efficiency and also reduce the possibility of fertilizer N-related environmental pollution [4]. Currently, one of the possible solutions for improving the N-use efficiency of fertilizers comprises taking into account the spatial and temporal crop and soil variability within a field, in an approach called “precision farming management” [5]. This method is based on the development and application of various technologies, such as the Geographic Information System (GIS), Global Positioning System (GPS), variable rate technologies, automatic control, proximal and remote sensing, computer-based control devices and telecommunications [6]. Adjustable rate technologies are applicable to any input factor or crop but have often been recommended for grain crops and fertilization procedures [7]. The variable techniques are based on two methods of managing field variability, viz. prescription maps based on historical field information and real-time sensing. The first approach is more popular among farmers, although the real-time method is currently receiving attention due to recent developments in proximal sensing technologies. There are various methods of nitrogen application in real time, such as soil plant analysis, leaf color chart, or chlorophyll meter and GreenSeeker. GreenSeekerTM is an optical sensor provided with variable rate application and a mapping system that measures a crop’s nitrogen requirements. The technology was developed at Oklahoma State University, USA, and licensed to NTech Industries in 2001 (www.ntechindustries.com). GreenSeeker measures target reflected energy emitted from the sun [8]. GreenSeekerTM uses light-emitting diodes to generate red light (660 nm) and near-infrared light (780 nm). Red light is absorbed by plant chlorophyll as an energy source during photosynthesis. Healthy plants absorb more red light and reflect greater amounts of near-infrared light [9]. The light produced is reflected off the crop and measured by a photodiode located at the front of the sensor head. The unit generates light at two specific wavelengths and measures the light reflected off the target (usually plants in soil). The microprocessor within the sensor analyzes the reflected light and calculates the results. The data from the sensor are transmitted serially to an HP iPAQ Personal Digital Assistant and can later be transferred to a desktop computer for analysis. Several problems exist when using the sun as a light source. The intensity of the sun is affected by sun angle, cloudiness, haziness and conditions, which can cause inconsistent NDVI measurements. The biomass produced day−1 as assessed through NDVI measurement using GreenSeekerTM is a reliable predictor of yield potential [10]. Nitrogen management using GreenSeekerTM can help to produce the expected yield more effectively than the traditional method of nitrogen application can. In addition, it may help to reduce pollution and to increase the nitrogen-use efficiency (NUE). In recent years, numerous research studies have been conducted on the use of precision farming techniques to assess crops’ agronomic characteristics as well as for stress quantification and recognition. Naser et al. [11] used proximal-sensor-derived Normalized Difference Vegetation Index (NDVI) to determine the yield difference between diverse wheat genotypes. A machine learning model and vegetation indices extracted by an Unmanned Aerial Vehicle (UAV) were used by Randelovic et al. [12] to predict soybean plant density. Guo et al. [13] used hyperspectral images to detect wheat yellow rust infection, while Sandino et al. [14] used remote sensing to detect deterioration by fungal pathogens in forests. In addition, a lot of research has been focused on the use of precision devices to predict crop parameters such as plant nutrient content, biomass production and yield [15] and nitrogen management [16].
There is an urgent requirement to find environmentally friendly crop production practices that could improve N-use efficiency in plants [17]. For optimum crop nutrition, use of correct seed rate also plays a very essential role in improving the overall fodder productivity of oat. With increasing or decreasing the seed rate, the oat productivity is affected accordingly. Increasing the seed rate may result in increased intercrop competition for space, water, food and sunlight, etc., and by decreasing the seed rate, the germination percentage of the seeds may decline, which needs to be avoided. Usually, unskilled farmers use traditional seed rates, which, in late planting conditions, decrease the yield and cannot bridge the yield gap. Therefore, a proper seed rate can help to achieve a yield close to the crop’s potential on the farmer’s field. Hence, proper guidance of the farmers is needed to provide an optimum seed rate and produce higher crop yield. Furthermore, site-specific nitrogen management in fodder oat is direly needed using GreenSeekerTM to increase the NUE, reduce environmental pollution and produce higher biomass. The current research study aimed to explore (i) GreenSeekerTM-based N management in fodder oat, and (ii) use of the correct seed rate of fodder oat to maximize fodder yield and reduce the overall cost of production.

2. Materials and Methods

2.1. Experimental Site

The research study was conducted at the National Agricultural Research Center (NARC), Islamabad Pakistan, during the Rabi crop season in 2018–2019. The experimental site is located at 33°43 N and 73°04 E at a height of 540 m from sea level in Potohar plateau in the northeast of Pakistan. The experimental site has a humid sub-tropical climate with mean annual rainfall of 790 mm. The soil of the experimental site is silty clay with pH in the range 7.0–8.4. The nitrogen level in this location is low and constitutes less than one percent organic matter.

2.2. Experimental Material

The experiment was laid out in a randomized complete block design a with split-plot arrangement having three replications using a plot size of 6 × 1.2 m. The oat variety “PARC Oat” was planted with five nitrogen application treatments (N0 = control, N1 = 80 kg ha−1 basal dose, N2 = 40 + 40 kg ha−1 split doses, N3 = 40 kg ha−1 with one-time management with GreenSeekerTM and N4 = 20 kg ha−1 with two-time management with GreenSeekerTM) and different seed rates (S1 = 80, S2 = 100, S3 = 120 and S4 = 140 kg ha−1). Data on various agronomic and physiological aspects of the crop were recorded and economic analysis was conducted to calculate the profitability of the crop using GreenSeekerTM.

2.3. Data Collection and Methodology

Days to tillering, tiller plant−1, plant height, leaf area, plant population ha−1, days to booting stage and green fodder yield were measured after the harvesting of each plot manually. The fodder yield of the oat was calculated by harvesting a 2 m2 area of each plot and converting it to kg ha−1.
The GreenSeekerTM (GS) active optical sensor (Handheld optical sensor Model 505, NTech Industries Incorporation, Ukiah, CA, USA) was employed to find the spectral reflectance from the plant canopy and the result was expressed as Normalized Difference Vegetation Index (NDVI). The sensor has a self-illumination system in red (656 nm) and near-infrared (774 nm) wavelengths. Following the manufacturer’s instructions, readings were recorded at a vertical viewing angle from a distance of 0.5 m above the crop to ensure accurate analyses. To prevent data fluctuation in leaves and within the canopy, NDVI readings were taken from 11:00 h to 14:00 h in a still environment (without wind) under a stable and clear sky. The area of the sampled plot−1 was 7.2 m2, conforming to 9.8 m of displacement, with a width of 0.6 m captured by the sensor, producing an average value of 15 to 20 measurements of NDVI per repetition, with GreenSeekerTM adjustment achieved on soil without vegetation. The sensor’s field of view was an oval, and it widened as the height of the sensor above the ground increased. A completely randomized design of 30 field-testing zones was used to perform the NDVI measurements. The data were recorded at two principal growth stages, 2 (tillering) and 4 (booting), according to the BBCH scale [18]. The NDVI was calculated using the following formula.
NDVI = (NIRref − Redref)/(NIRref + Redref)
where NIRref and Redref represent the reflectance in the near-infrared and red bands, respectively [19]. Each replicate presented the mean value of NDVI that correlated with the fodder yield of each plot for the analysis of simple linear regression. The fitting quality of the model was assessed by the adjusted determination coefficient (R2) [20], root mean square error (RMSE) and mean bias error (MBE) [21]. The outlier values were discarded as described [22]. The variance analysis of the model was performed using the F test (1% of probability). Adjusted determination coefficient values above 0.75 were considered high.

2.4. Standard Setting Condition for CID-340 Portable Photosynthesis System

The CID-340 Portable Photosynthesis System (CID Inc., Camas, WA, USA) was used to measure physiological parameters, i.e., photosynthetic rate, transpiration rate and stomatal conductance. The measurements were taken on a bright sunny day at 10:00 to 14:00 h. Measurements were taken by randomly selecting five plants plot−1 and the flag leaf was used for recording the data. The measurement conditions were as follows: ambient CO2 concentration, 372 mmol mol−1; ambient pressure, 99.0 kPa; average water vapor pressure in the chamber, 3.45 kPa; air flow unit−1 leaf area, 205.5 mol m−2 s−1; and maximum photo-synthetically active radiation (PAR), up to 1300 mmol m−2 s−1.

2.5. Economic Analysis

Experimental data for the study period were analyzed economically (CIMMYT Economics Program, 1988) [23]. Through this analysis, an estimate of economic return for each level of productivity was performed. Total expenditure incurred on crop production vs. net income in terms of USD was computed between plots where nitrogen was applied manually at the recommended dose through the conventional method against nitrogen applied using GreenSeekerTM.

2.6. Statistical Analysis

The collected data were analyzed using Fisher’s analysis of variance on Statistix 8.1. (User’s Manual, Analytical Software, Tallahassee, FL, USA, 2003) [24], and treatment means were compared using the Least Significant Difference (LSD) test at a 5% level of probability [25].

3. Results and Discussion

3.1. Days to Tillering

Statistical analysis of the data revealed that the variable of days to tillering was significantly influenced by N management, but there was no effect of seed rate (Table 1). The least days to tillering (38.1 days) were found in the plot where nitrogen was applied at a quarter of the recommended amount with management twice by GreenSeekerTM (20 + GS + GS kg ha−1). Greater days to tillering (41.9) were recorded in the control plot where no nitrogen was provided. Regarding seed rate, less days to tillering (38.5 days) were recorded when seeds were used at 140 kg ha−1. Similarly, more days to tillering (41.7 days) were recorded in plots where a seed rate of 100 kg ha−1 was used. Interaction also revealed a non-significant effect on time for tillering. Comparing total means for control vs. the rest, the maximum time to tillering (41.9 days) was found in the control, while fewer days to tillering (39.7) were observed in the other plots. The lower number of days to tillering might be due to proper nitrogen management and timely nitrogen application. The results of the current research are in line with [26], which revealed that nitrogen application at 120 kg ha−1 decreased days to tillering in wheat.

3.2. Tiller Plant−1

The data showed significant effects on tiller plant−1 of nitrogen management and seed rate (Table 2). Maximum tillers plant−1 (6) were noted in the plots where the recommended dose of nitrogen was applied (80 kg ha−1), half of the recommended dose was applied with management once by GreenSeekerTM (40 kg ha−1 + GS), a quarter of the recommended dose was applied with management twice by GreenSeekerTM (20 kg ha−1 + GS + GS). Minimum tillers plant−1 (5) were noted in the plots where N was applied in split doses (40 + 40 kg ha−1). Regarding seed rate, more tillers plant−1 (6) were noted when the seed rate was kept at 120 kg ha−1 and fewer tillers plant−1 (5) were observed when a seed rate of 140 kg ha−1 was used. The interactive effect among nitrogen management and seed rate revealed no impact on the tillers plant−1. Comparing overall means for control vs. rest, maximum tillers plant−1 (6) were noted in rest plots, whereas fewer tillers plant−1 (5) were observed in the control treatment. The amount of tillers plant−1 was increased because N application extends the vegetative phase of the crop. The above findings are consistent with [27]. Since nitrogen is an essential constituent of chlorophyll and its proper application favors vegetative growth of crops, that might be the cause of the increase in tillers plant−1.

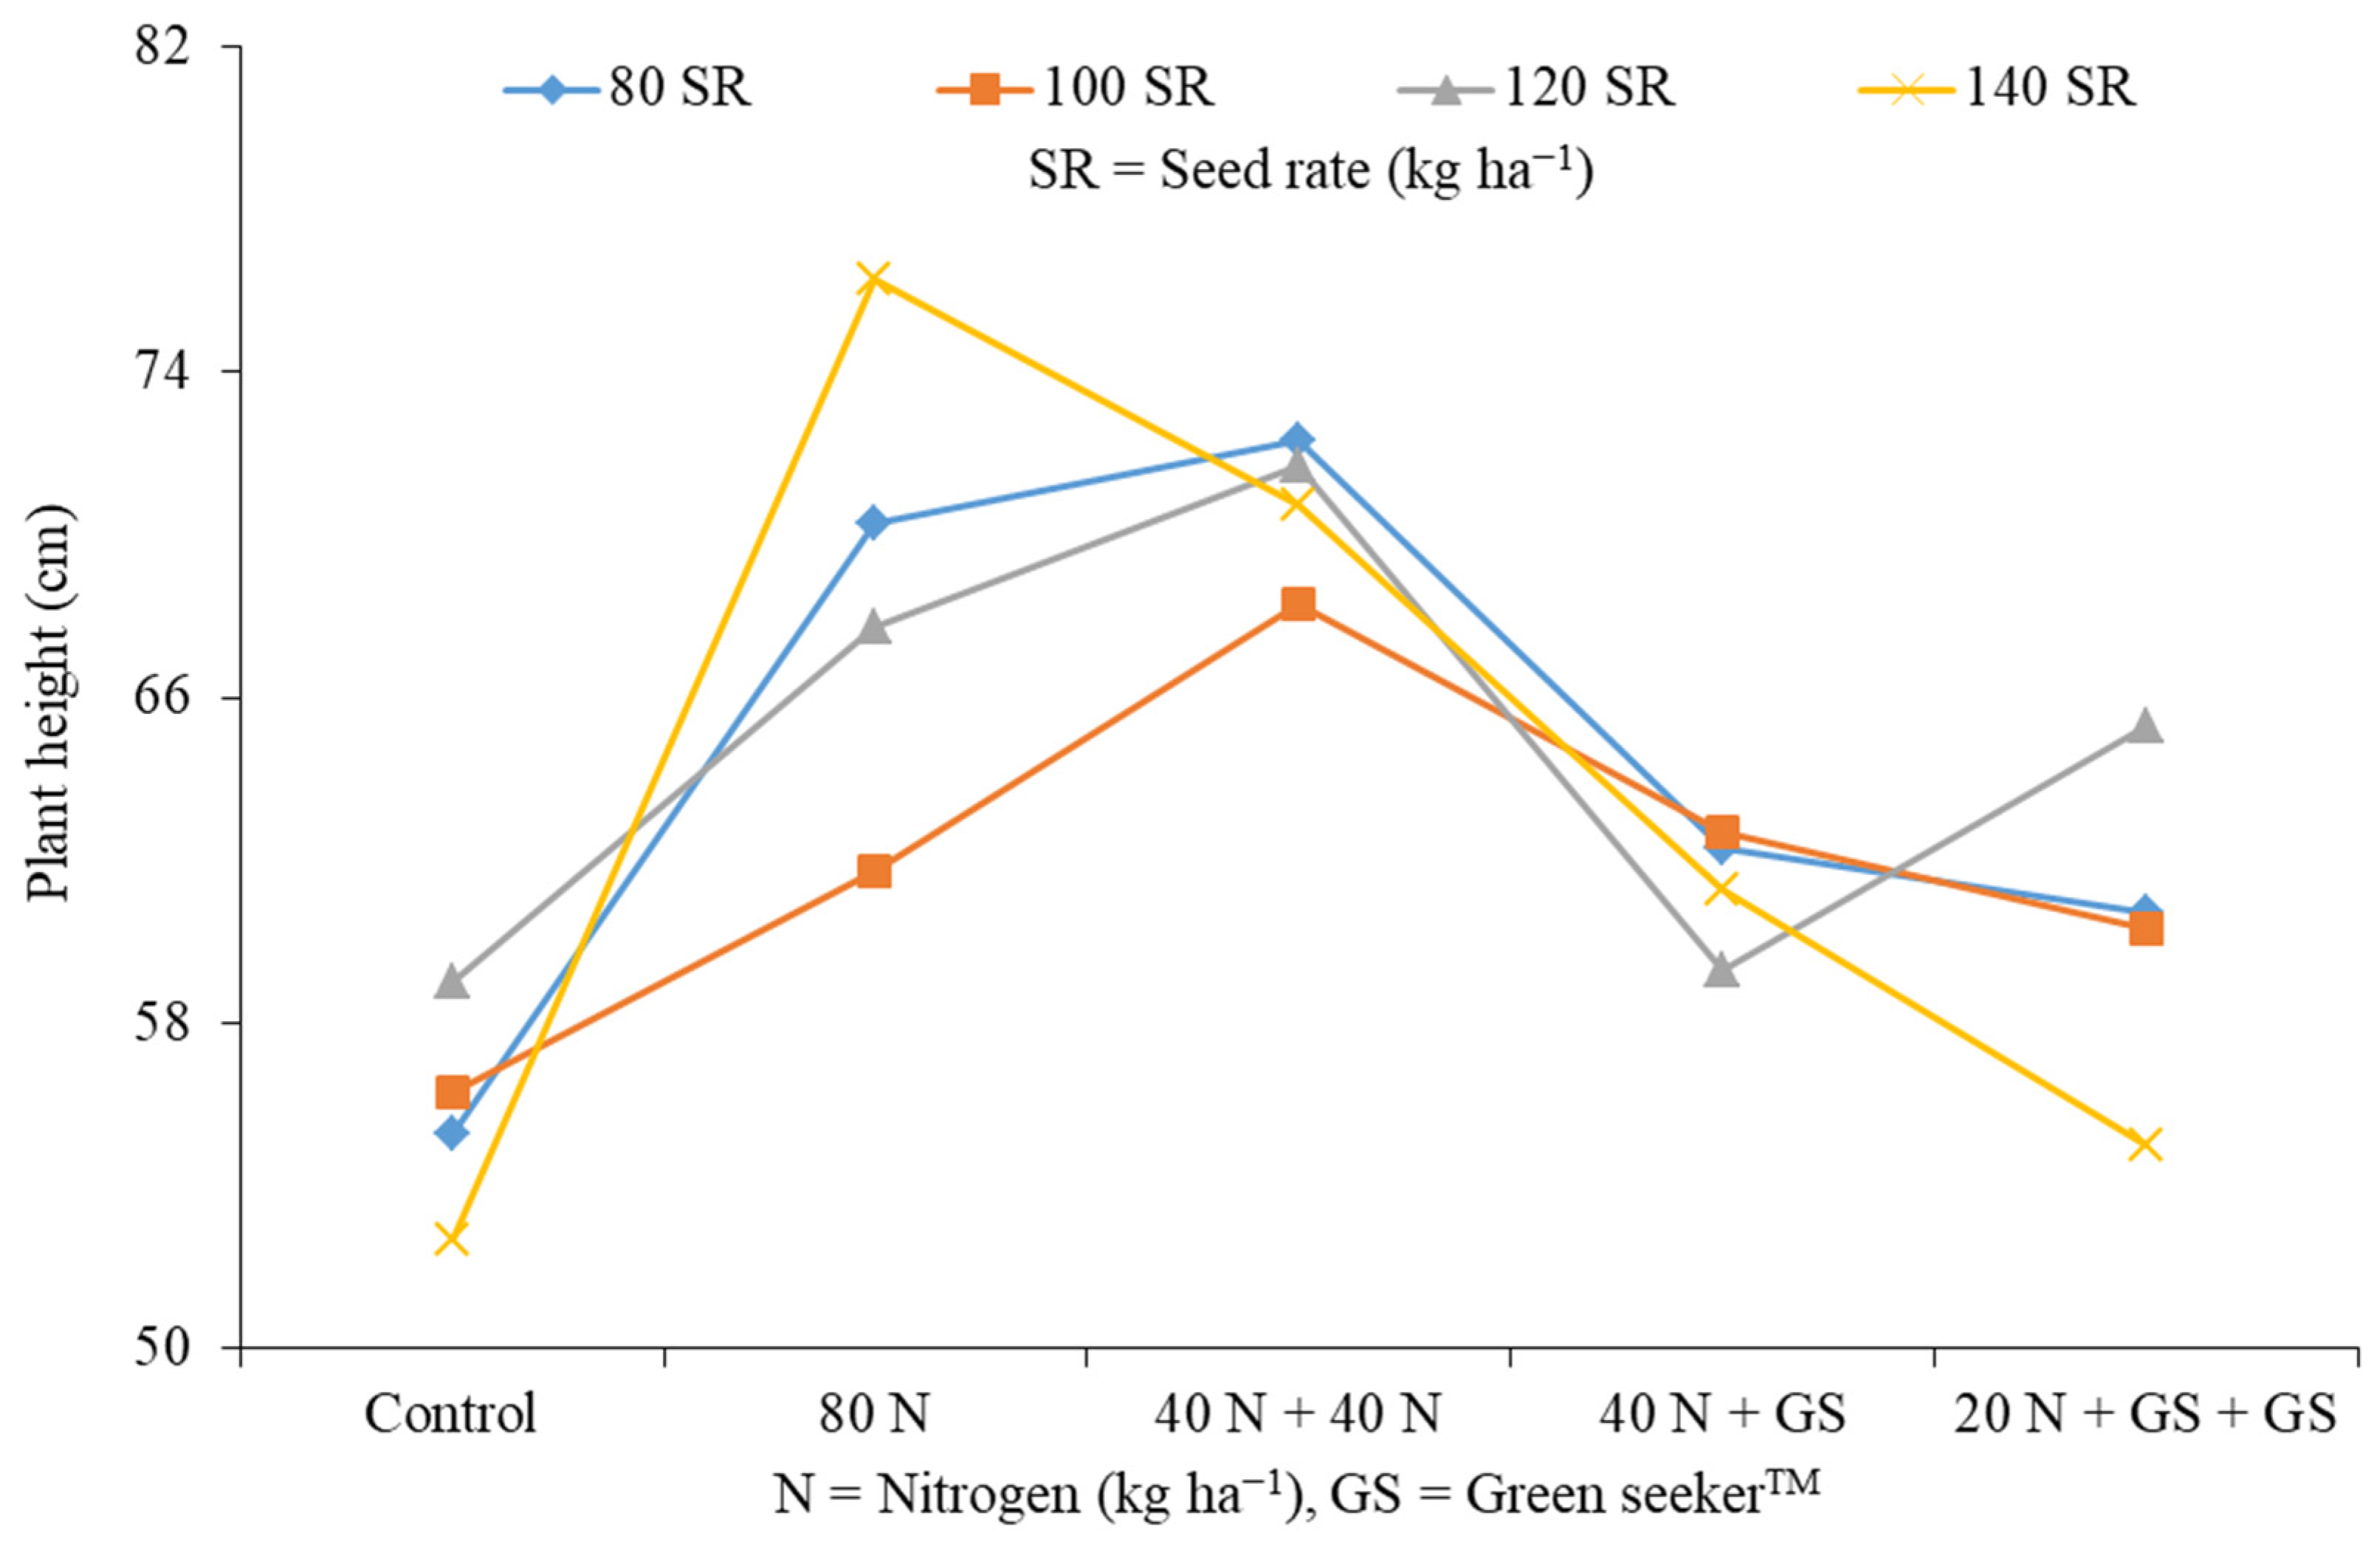
3.3. Plant Height (cm)

Plant height was significantly influenced by nitrogen management while seed rate was statistically non-significant regarding plant height (Table 3; Figure 1). The data for N management showed that taller oat plants (70.8 cm) were recorded where nitrogen was provided in split doses (40 + 40 kg ha−1) and shorter (55.8 cm) plants were produced in control experimental plots. The mean data for seed rate showed that higher plant height (64.6 cm) was observed when the seeding rate was kept at 120 kg ha−1, while lower plant height (61.9 cm) was recorded when a seed rate of 100 kg ha−1 was used. The interaction of seed rate and nitrogen was significant for plant height. Higher plant heights (76.3 cm) were recorded at a 120 kg ha−1 seed rate with 80 kg ha−1 nitrogen, while minimum plant (55 cm) heights were observed at a seed rate of 120 kg ha−1 with nitrogen applied at 20 kg ha−1 using GreenSeekerTM (managed two times). Comparing overall means for control vs. rest, higher plant heights (65.4 cm) were noted in rest while lower plant heights (55.6 cm) were observed in the control treatment. The increased plant height with N application is due to the fact that it plays an important role in vegetative growth [28]. These findings are in concurrence with [29], which found that the plant height of oat increased when applying N at 225 kg ha−1.

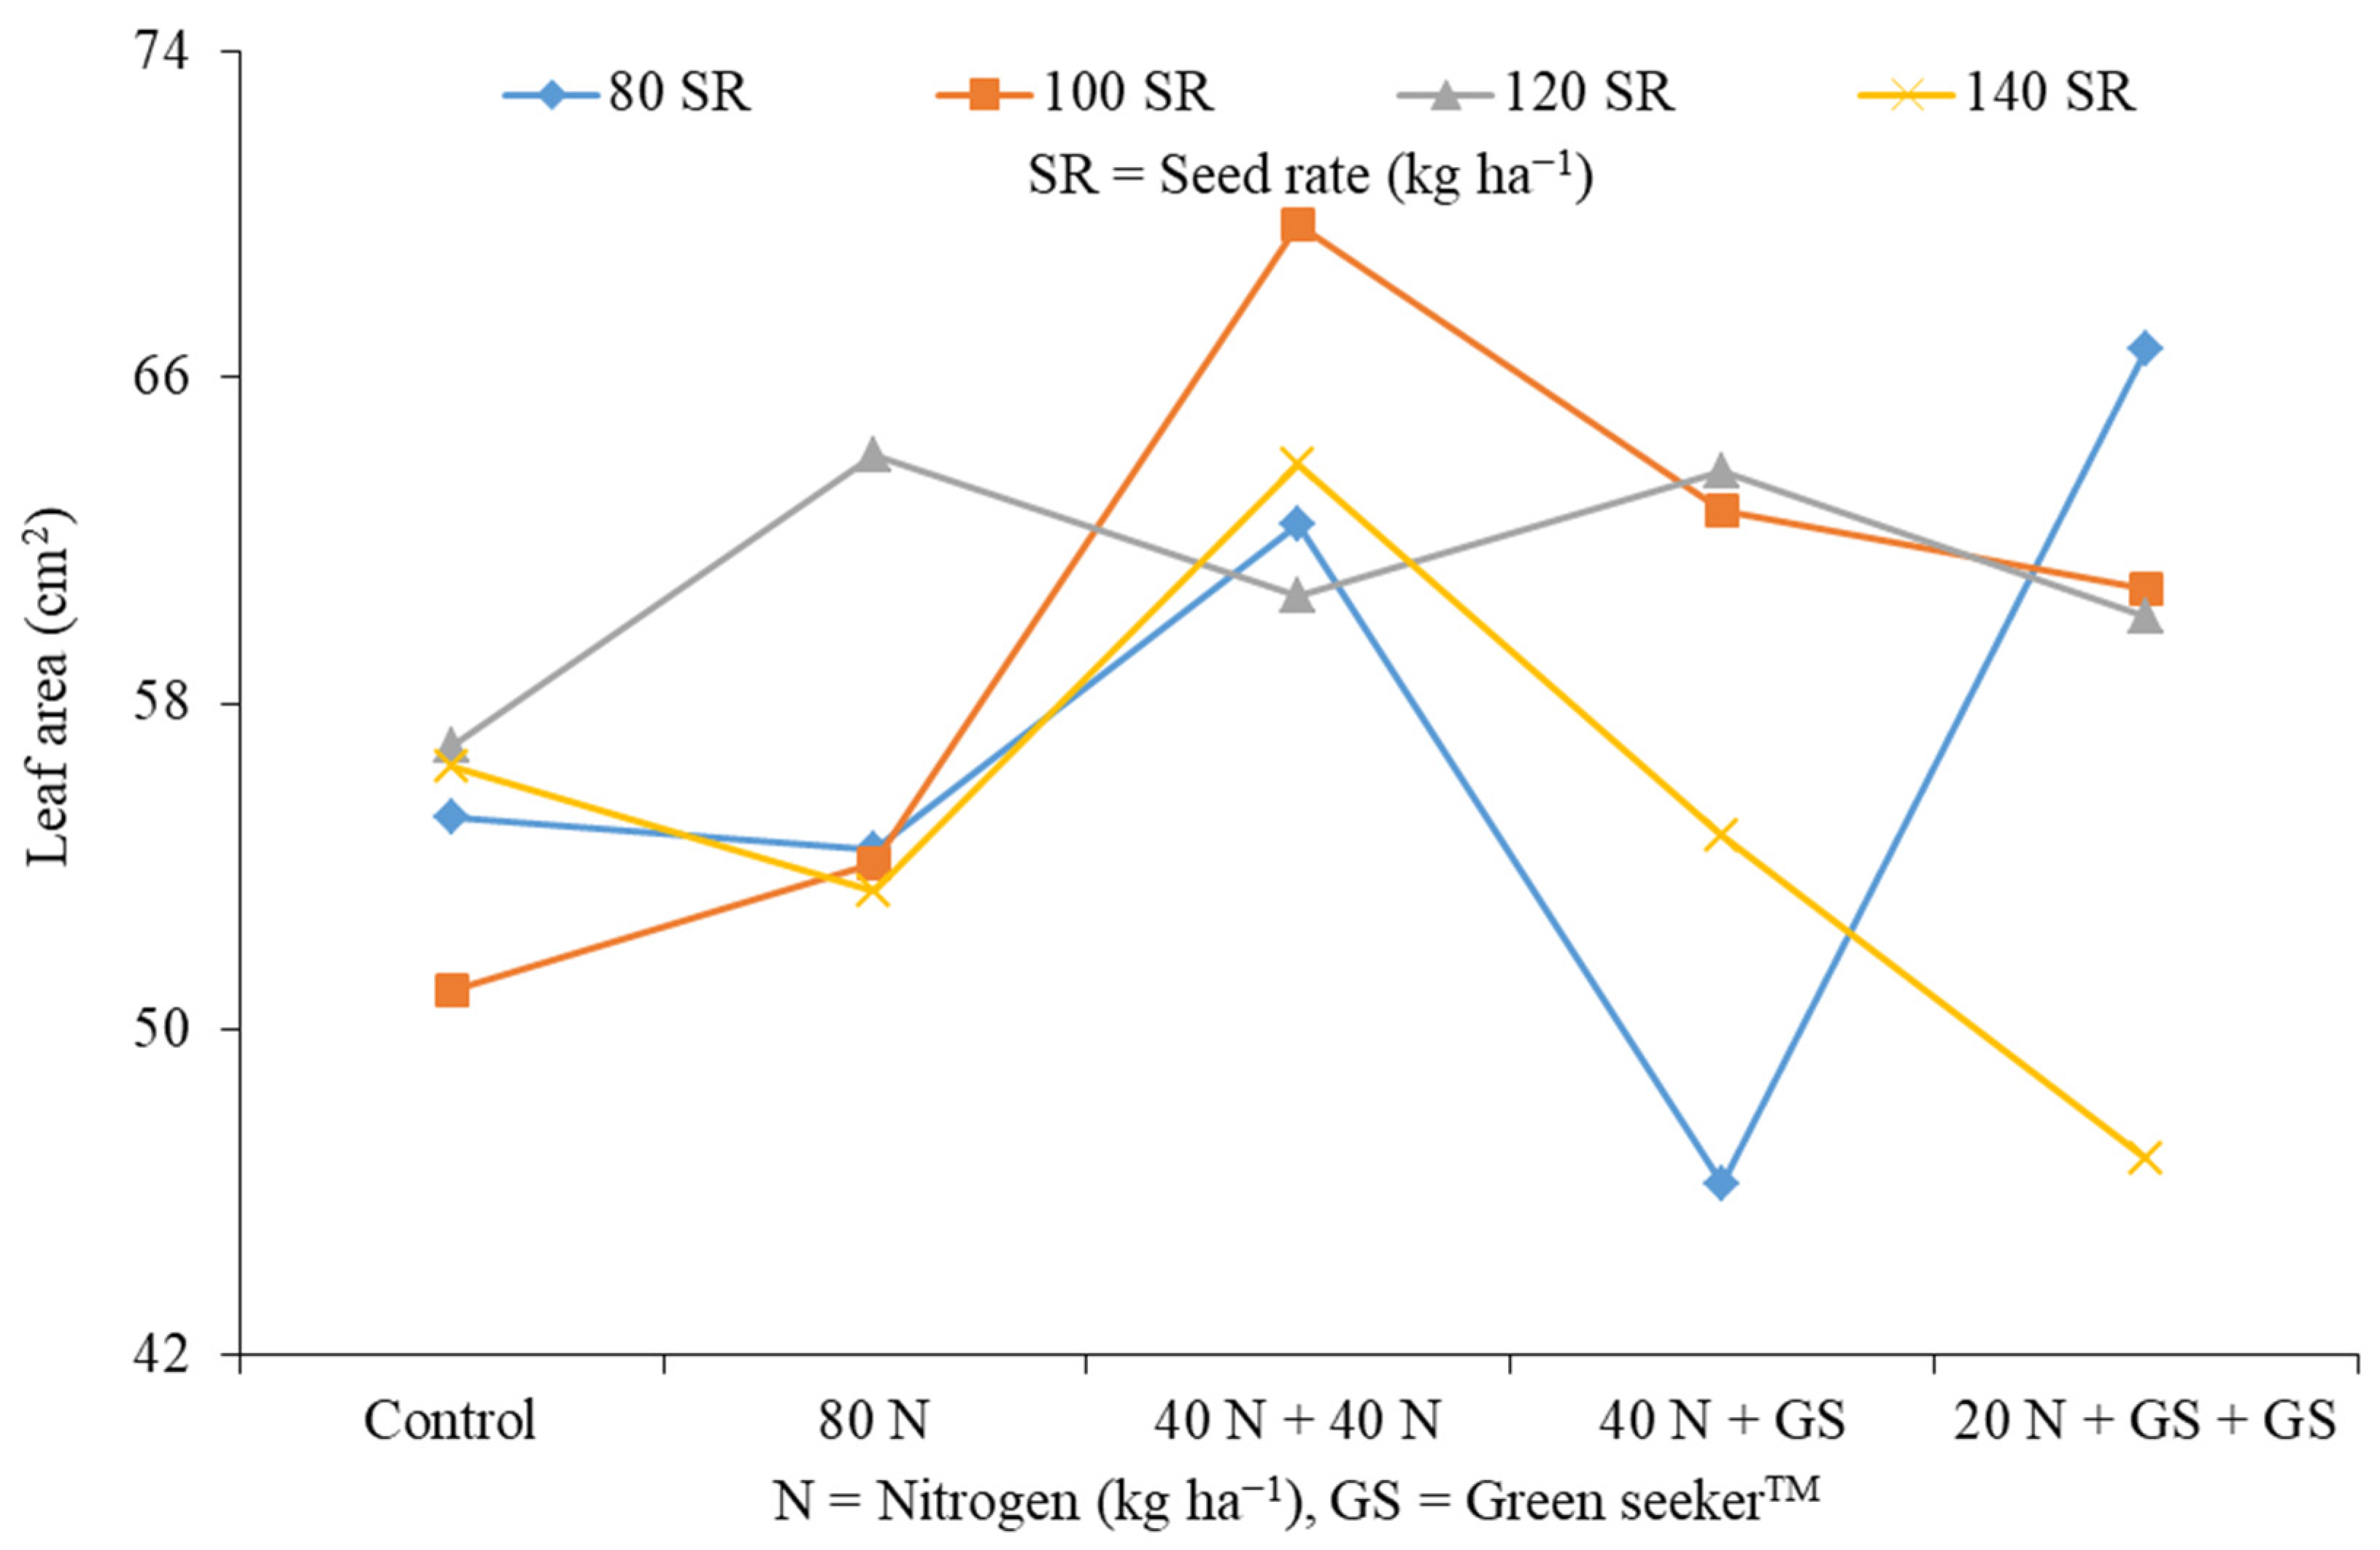
3.4. Leaf Area (cm2)

Leaf area was significantly affected by nitrogen management while seed rate had no effect on leaf area (Table 4). A higher leaf area (64.14 cm2) was recoded where nitrogen was given in split doses (40 + 40 kgha−1) and a lower leaf area (54.88 cm2) was measured in control plots. For seed rate, a higher leaf area (61.09 cm2) was recorded where the applied seed rate was 100 kg ha−1, while a lower leaf area (55.05 cm2) was recorded when the seed rate was 120 kg ha−1. The interaction of seed rate and nitrogen significantly affected the leaf area (Figure 2). The maximum leaf area (69.74 cm2) was recorded where the seed rate was 80 kg ha−1 and nitrogen was applied in split doses (40 + 40 kg ha−1), while the minimum leaf area (46.19 cm2) was recorded where the seed rate was 60 kg ha−1 and nitrogen was applied at half of the recommended dose and managed once using GreenSeekerTM (40 kg ha−1 +GS). Comparing overall means for control vs. rest, the maximum leaf area (59.02 cm2) was observed in rest while the minimum leaf area (54.88 cm2) was noted in control plots. The increase in leaf area with nitrogen application is due to the fact that good crop growth depends on an adequate level of fertilizer application at the right time [30]. The results of the current research are in agreement with those of Labra et al. [31], who stated that nitrogen is responsible for producing high crop canopy in oilseed rape.

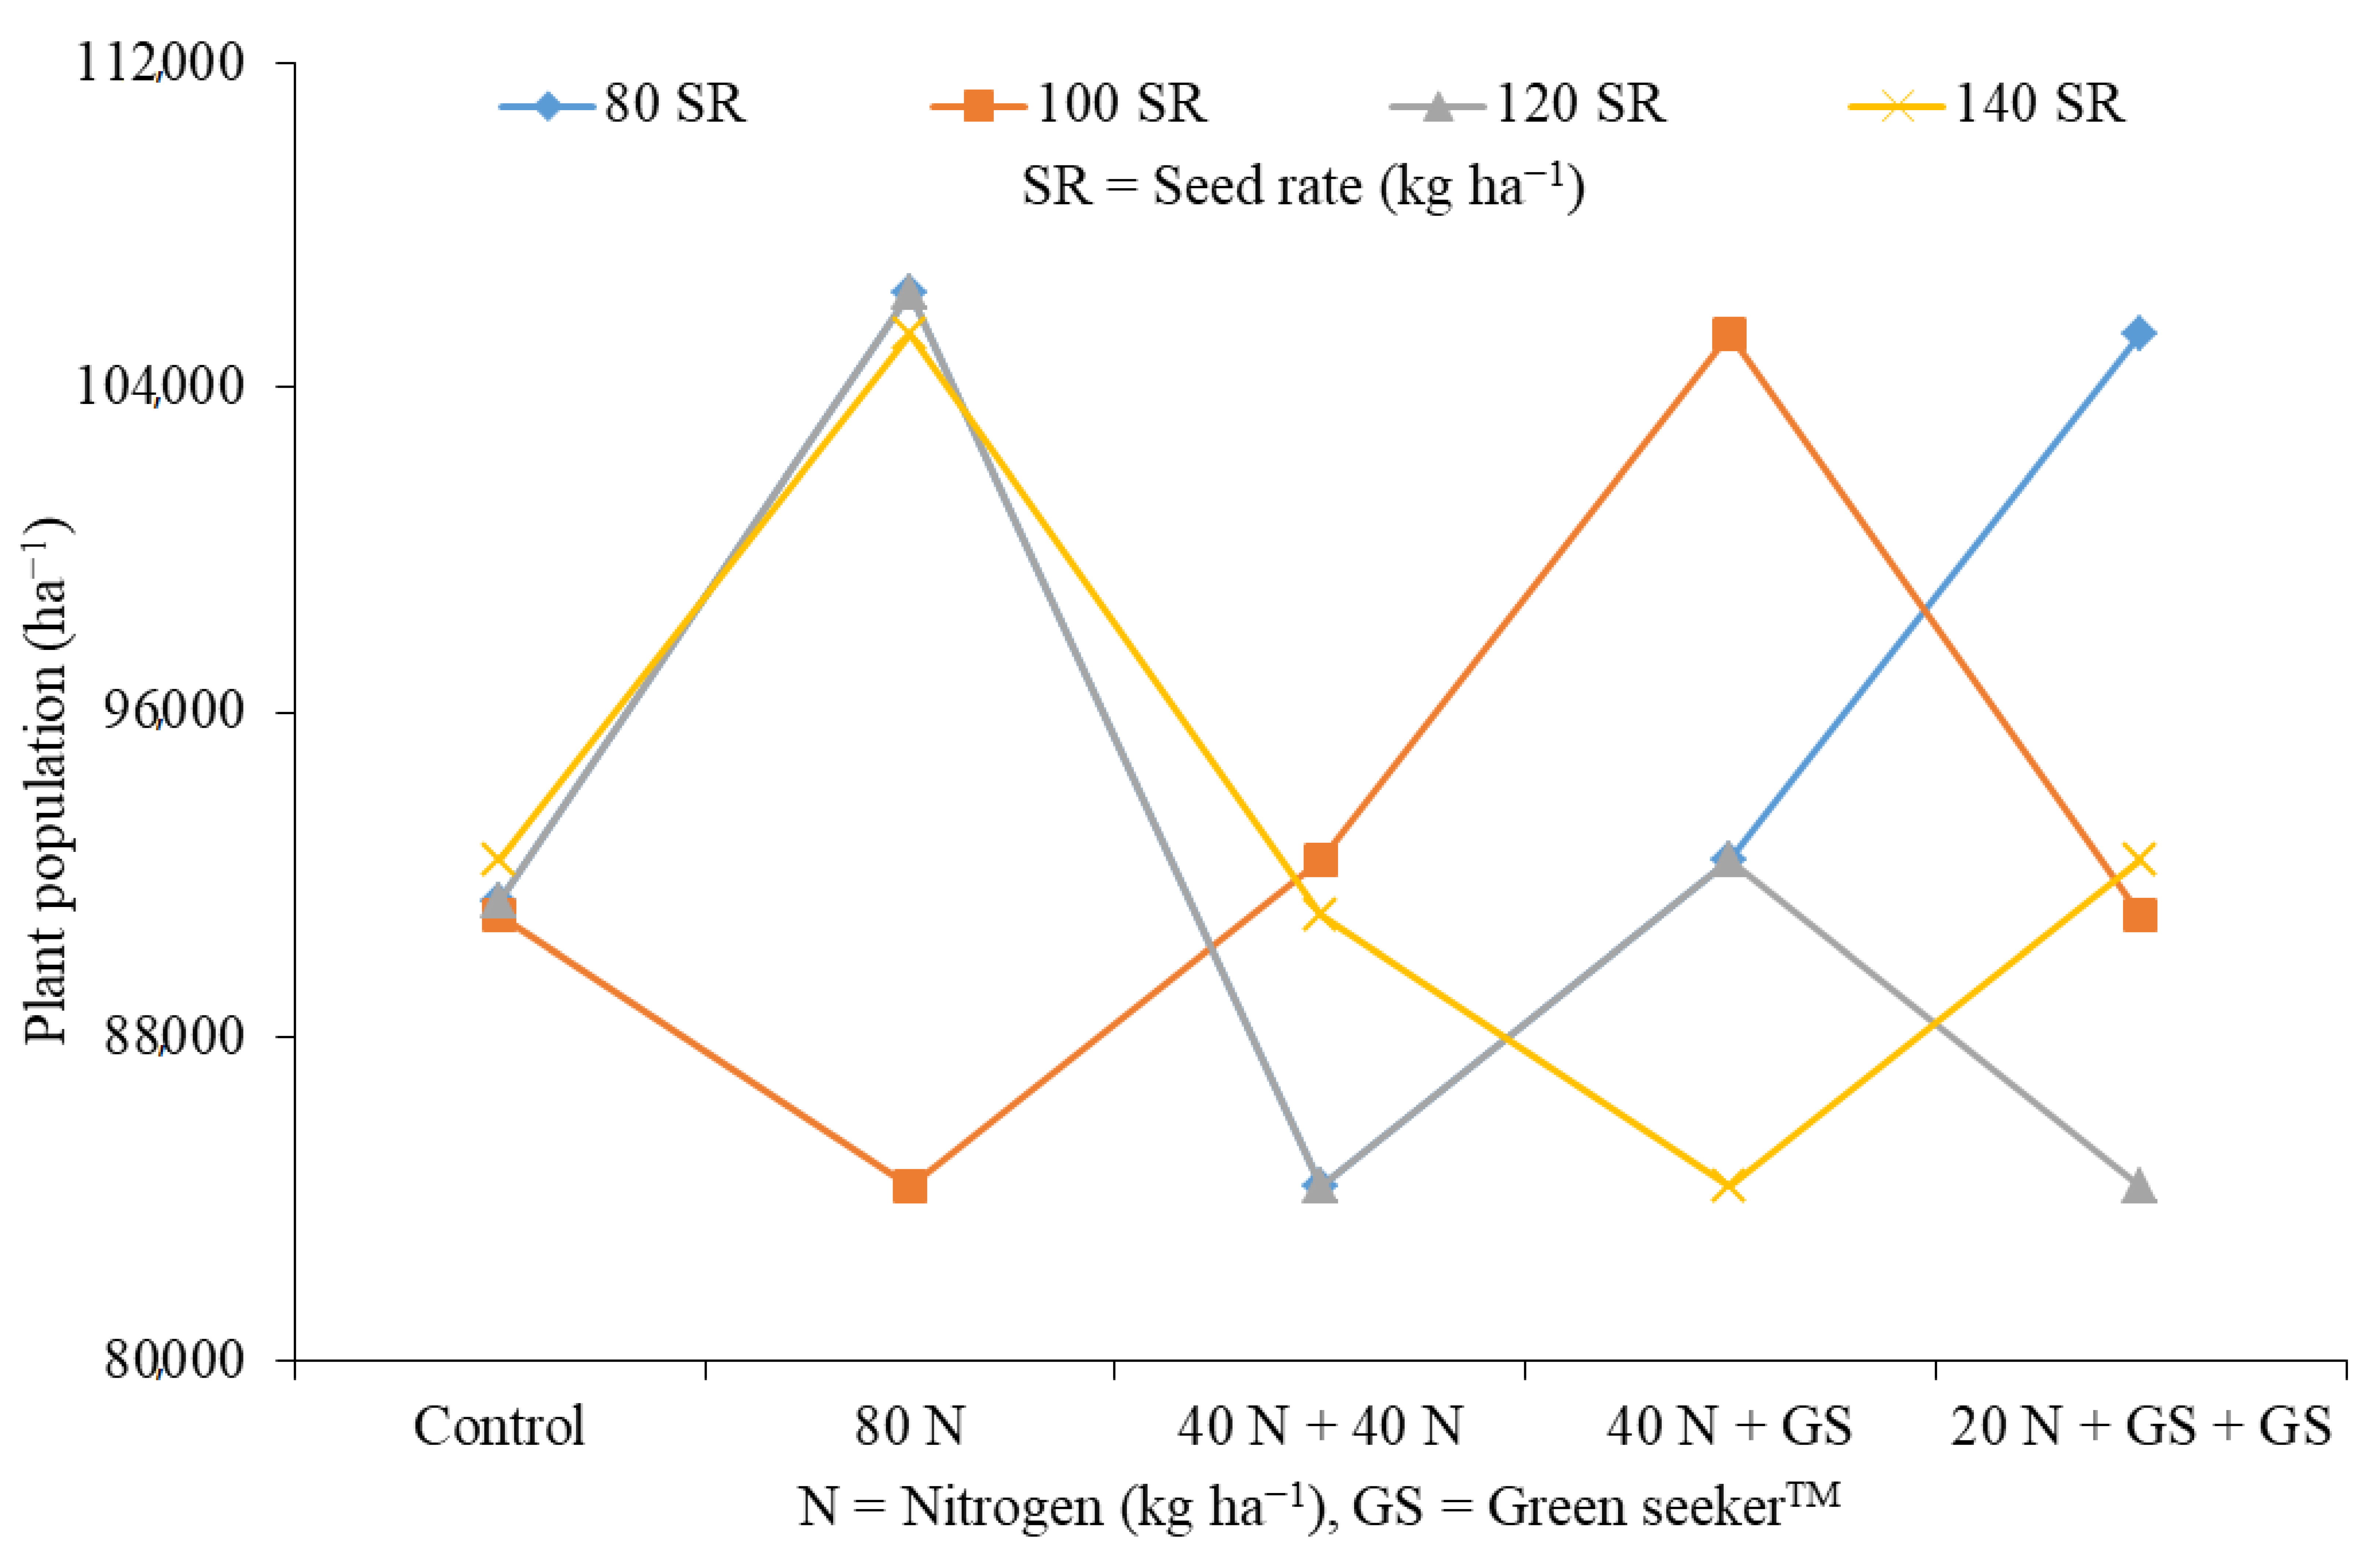
3.5. Plant Population (ha−1)

The data showed that (Table 5; Figure 3) the maximum plant population ha−1 (100583) was observed in the treatments where the recommended dose of nitrogen (80 kg ha−1) was given, whereas smaller plant populations ha−1 (88,000) were observed in plots where N was provided in split doses (40 + 40 kg ha−1). Seed rate was non-significant for plant population, and a higher plant population ha−1 (95,933) was recorded in the plots where a lower seed rate (80 kg ha−1) than recommended was used, whereas a low plant population ha−1 (91,733) was recorded in the plots where a higher seed rate than recommended (120 kg ha−1) was applied. The interaction showed a significant effect on plant population. A greater plant population ha−1 (106,333) was recorded in two treatments: one where nitrogen was applied at the recommended dose (80 kg ha−1) with a low seed rate (80 kg ha−1) and a second treatment where the seeding rate was above the recommended (120 kg ha−1) rate with the recommended dose of nitrogen (80 kg ha−1). The minimum plant population ha−1 (84,333) was recorded in more than two treatments. Comparing overall means for control vs. rest, the maximum plant population ha−1 (93,854) was recorded in rest while the minimum plant population ha−1 (91,500) was noted in control plots. The larger crop population ha−1 might be due to the fact that nitrogen is a major plant nutrient, and due to its timely availability to the crop, it produced greater plants unit−1 area. Our results are in line with those of Devi et al. [32], who already found that plant population ha−1 increased concurrently by increasing the nitrogen rate.

3.6. Days to Boot Stage

The data showed that nitrogen had a significant effect on days to booting (Table 6). The minimum number of days to booting (129) was recorded in two plots where the recommended dose (80 kg ha−1) and split doses (40 + 40 kg ha−1) of nitrogen were given. Seed rate was non-significant for days to boot stage. A shorter time to booting stage (129) was noted in two plots where the seed rate was below (80 kg ha−1) and above (120 kg ha−1) the recommended rate. The interaction showed a non-significant effect on days to boot stage. Comparing the overall means for control vs. rest, the minimum number of days to booting (129.5) was recorded in rest while the maximum number of days to boot stage (131) was recorded in control plots. The fewer days to booting might be due to the less time available for assimilate portioning to the sink because the temperature in the growing region increased (above 35 °C) after, and this sudden increase in temperature triggered early physiological maturity of oat. These research findings are in line with [33], which reported that temperature was the factor causing early maturity.

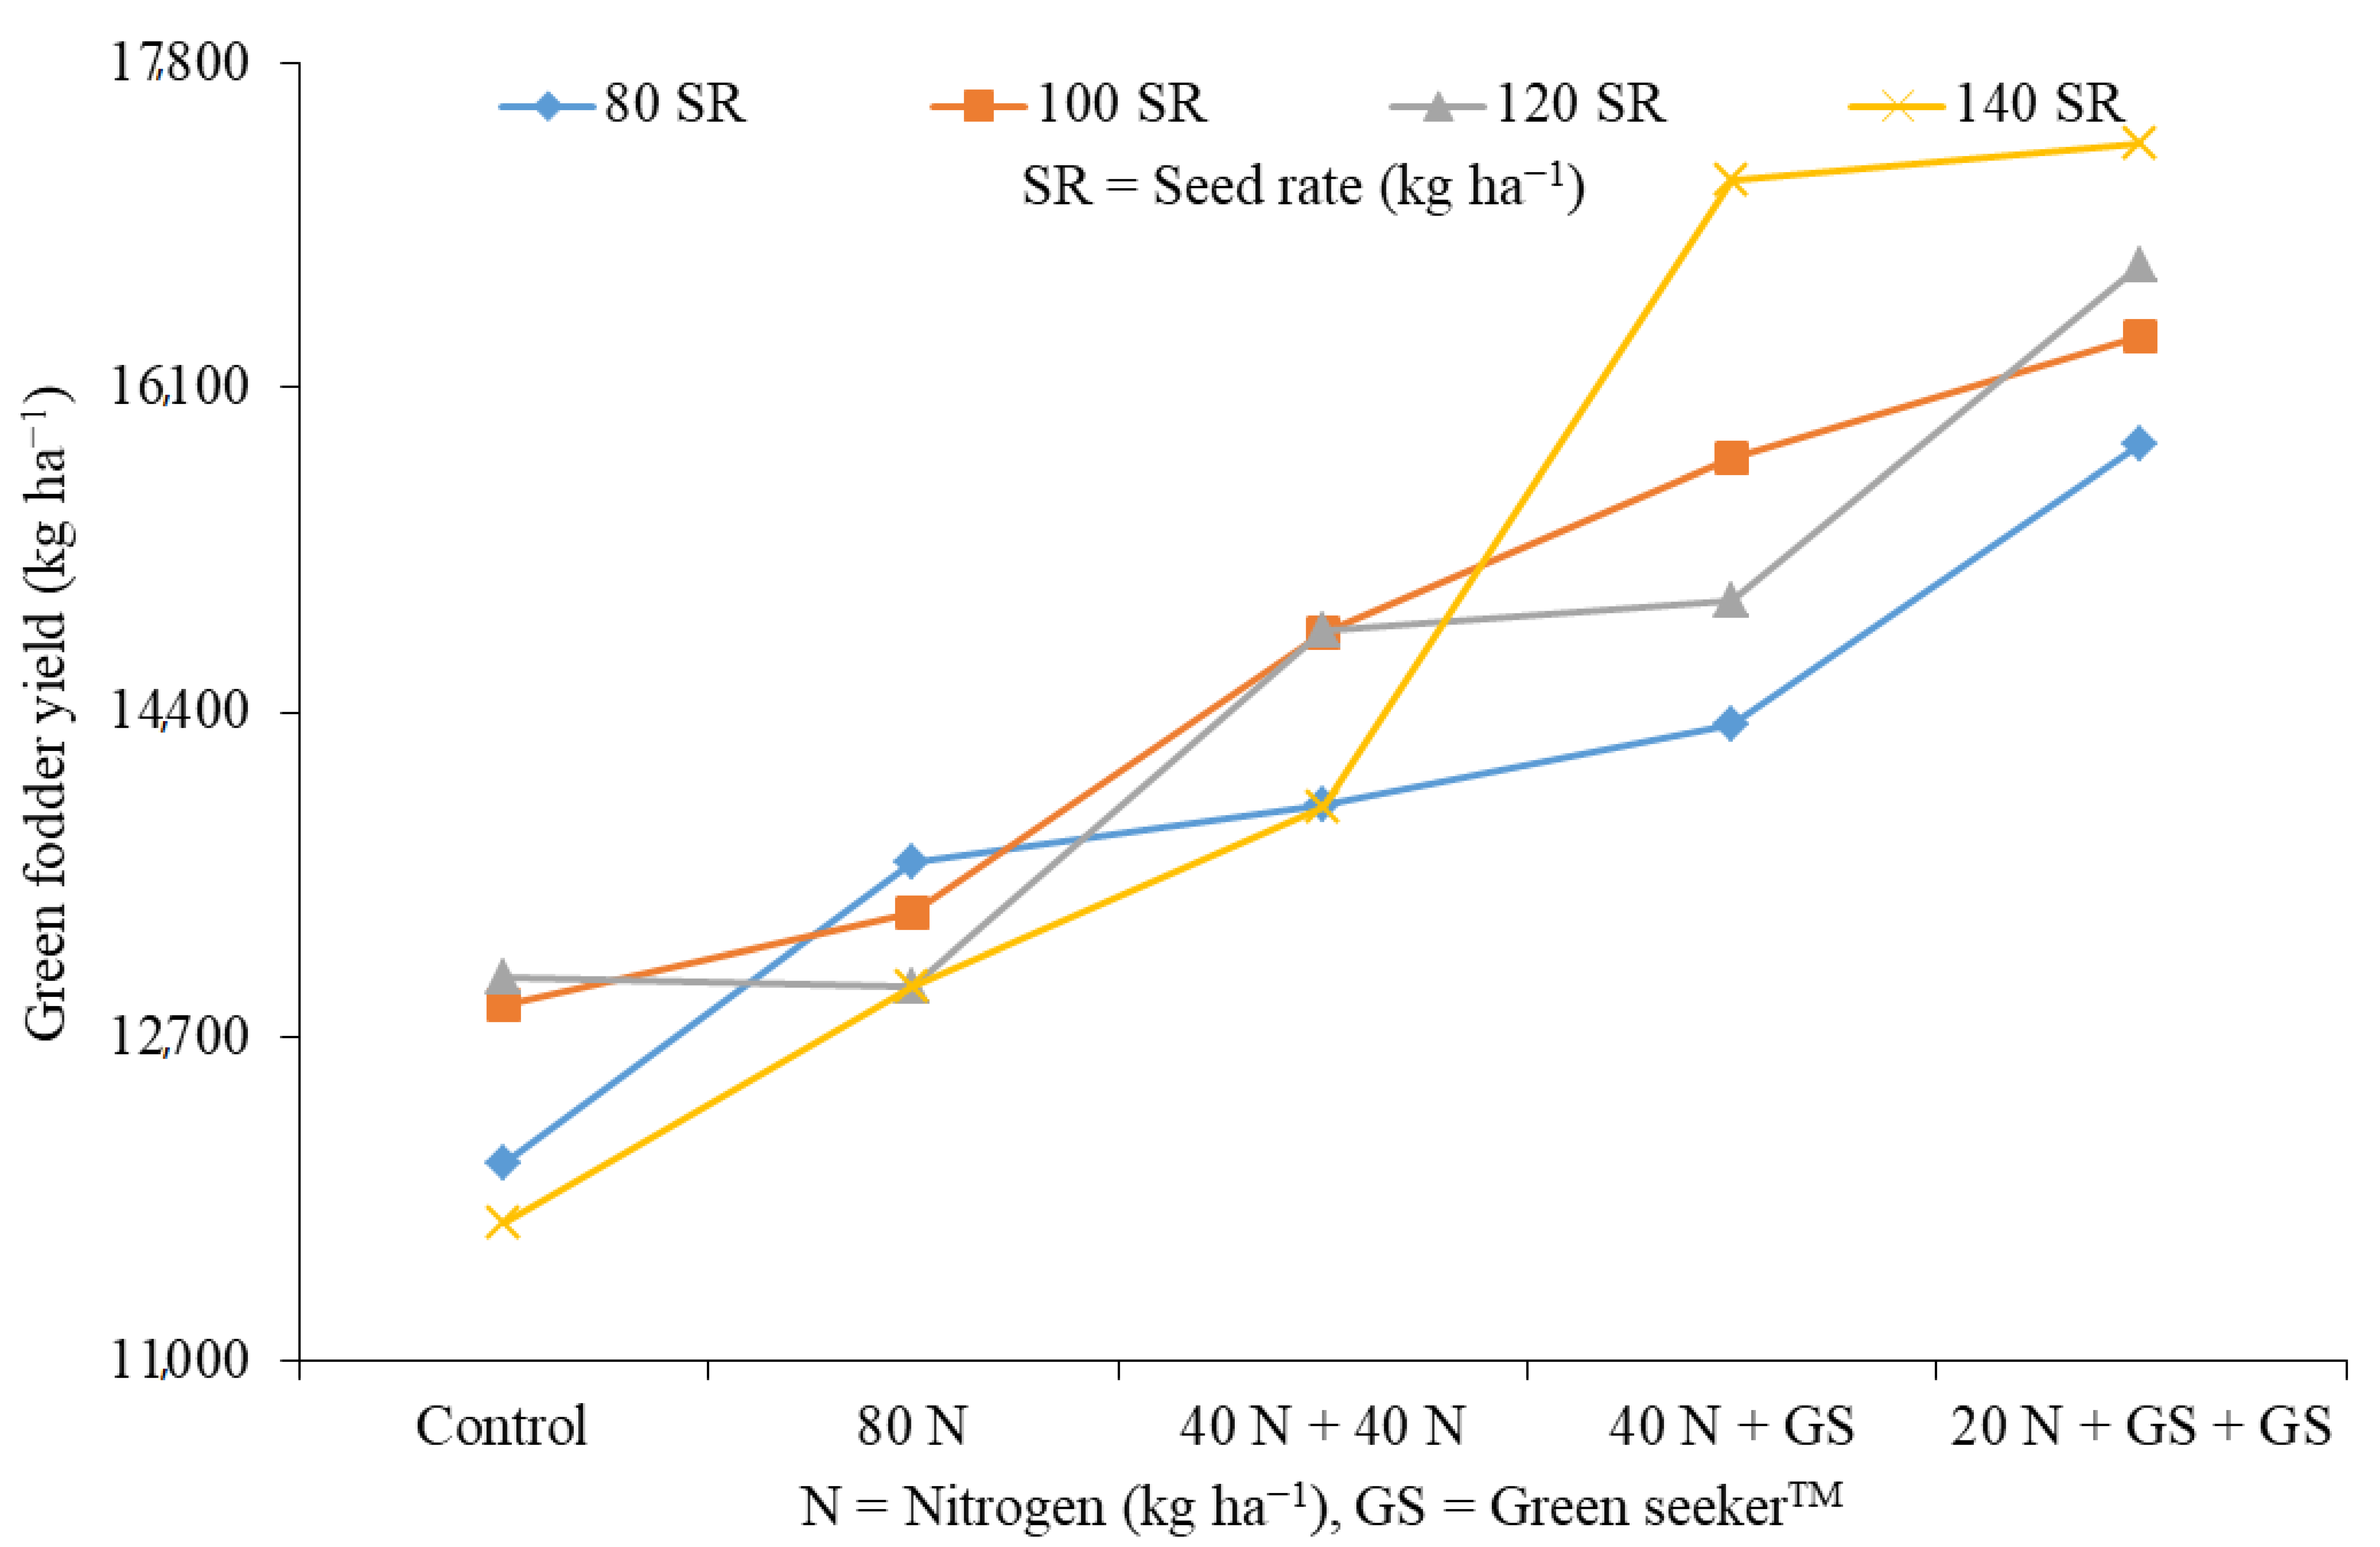
3.7. Green Fodder Yield (kg ha−1)

The green fodder yield of oat was significantly affected by nitrogen management (Table 7). The data showed that the maximum fresh weight (16572.85 kg ha−1) was noted in the treatments in which nitrogen was given at a quarter of the recommended dose and managed twice with GreenSeekerTM (20 kg ha−1 + GS + GS), while a lower green fodder yield (12411.64 kg ha−1) was recorded in the control plot. For seed rate, high green fodder yield (14634.29 kg ha−1) was noted in experimental units where an above-standard seed rate (140 kg ha−1) was used, whereas low green fodder yield (13939.09 kg ha−1) was recorded in the treatments where a seed rate below that recommended (80 kg ha−1) was practiced. The interaction of seed rate with nitrogen management (Figure 4) showed a significant effect on green fodder yield. Maximum values of green fodder yield (17,380 kg ha−1) were noted in plots where N was given at a quarter of the recommended dose and managed twice with GreenSeekerTM (20 kg ha−1 + GS + GS) with a high seed rate (140 kg ha−1), while low green fodder yields (11,728 kg ha−1) were noted in no-nitrogen-provided treatments and those with a high seed rate (140 kg ha−1). Comparing the overall means for control vs. rest, the maximum green fodder yield (14,929.69 kg ha−1) was recorded in rest while the minimum green fodder yield (12,411.6 kg ha−1) was noted in control plots. Green fodder yield was higher due to the fact that it is directly proportional to N application. These results were in agreement with those in [34], in which green fodder yield was highly linked with nitrogen levels up to 160 kg ha−1 and the regression coefficient was 0.997.

3.8. Photosynthetic Rate (µmol m−2 s−1)

Nitrogen management using GreenSeekerTM significantly affected photosynthetic rate (Table 8). The maximum photosynthetic rates (11.64 µmol m−2 s−1) were observed for treatments where nitrogen was given at a quarter of the recommended dose and managed two times with GreenSeekerTM (20 kg ha−1 + GS + GS); a low photosynthetic rate (9.26 µmol m−2 s−1) was noted in the treatments where nitrogen was provided at the recommended dose (80 kg ha−1). Seed rate showed a non-significant effect on photosynthetic rate. The maximum photosynthetic rate (11.58 µmol m−2 s−1) was recorded in the treatment where the seed rate used was below the recommended rate (80 kg ha−1), whereas the minimum photosynthetic rate (10.18 µmol m−2 s−1) was observed in the experimental units where the recommended seed rate was used (100 kg ha−1). The interaction of nitrogen application and seed rate had a non-significant effect on photosynthetic rate. Comparing the overall means for control vs. rest, the maximum photosynthetic rate (11.12 µmol m−2 s−1) was recorded in control while the minimum photosynthetic rate (10.78 µmol m−2 s−1) was recorded in rest plots. The most likely cause of increase in the photosynthetic rate might be due to the fact that nitrogen is an integral part of chlorophyll, and the broader a leaf is, the higher the photosynthetic rate will be, and vice versa. Our findings are in line with those in [35] showing that N is integral part of chlorophyll and the building blocks of protein.

3.9. Stomatal Conductance (mmol m−2 s−1)

Statistical analysis of the data (Table 9) revealed that stomatal conductance was not significantly affected by N management. Higher stomatal conductance (210.88 mmol m−2 s−1) was noted in the experimental units where N was provided at half of the recommended dose and managed once by GreenSeekerTM (40 kg ha−1 + GS), whereas low stomatal conductance (185.39 mmol m−2 s−1) was noted in the plot in which the recommended dose of nitrogen (80 kg ha−1) was provided. Seed rate had a non-significant effect on stomatal conductance. High values (206.07 mmol m−2 s−1) were noted in the treatments where the recommended seed rate was used (100 kg ha−1), while low values (192.08 mmol m−2 s−1) were found in the plots where the seed rate (120 kg ha−1) used was above the recommended seed rate. The interaction among nitrogen management and seed rate revealed a non-significant effect on stomatal conductance. Comparing the overall means for control vs. rest, the maximum stomatal conductance (200.80 mmol m−2 s−1) was noted with rest while the minimum stomatal conductance (185.65 mmol m−2 s−1) was observed in control plots. The low value of stomatal conductance in PARC Oat is attributed to the possibility that the higher seed rate and lower nitrogen application may have increased competition among the oat crop plants. Similar to our results, Song et al. [36] found that nitrogen application increased the stomatal conductance of fodder oat genotypes. Seed rate is directly correlated with canopy expansion and solar radiation interception, thus strongly influencing the use of various resources by changing the relative importance of intra- and interplant competition for water, light and nutrients during crop development and thereby affecting wheat yield [37].

3.10. Economic Analysis

Economic analysis (Table 10) of the present study showed that using GreenSeekerTM, the cost of nitrogen fertilizer per hectare was reduced by 15% where N was managed one time with GreenSeekerTM with application of half of the standard dose (40 kg ha−1), and by 27.5% when managed two times with GreenSeekerTM along with application of a quarter of the recommended dose (20 kg ha−1) as compared to the recommended dose (80 kg ha−1). In terms of net profitability per hectare, increases of 25% and 37.5% were noted in treatments where N was managed one time with GreenSeekerTM along with half of the recommended nitrogen dose (40 kg ha−1) and managed two times with GreenSeekerTM along with a quarter of the recommended nitrogen dose (20 kg ha−1), respectively, as compared to the recommended dose. Our findings are in agreement with [38], which indicated that nitrogen management was helpful to reduce the cost of production.

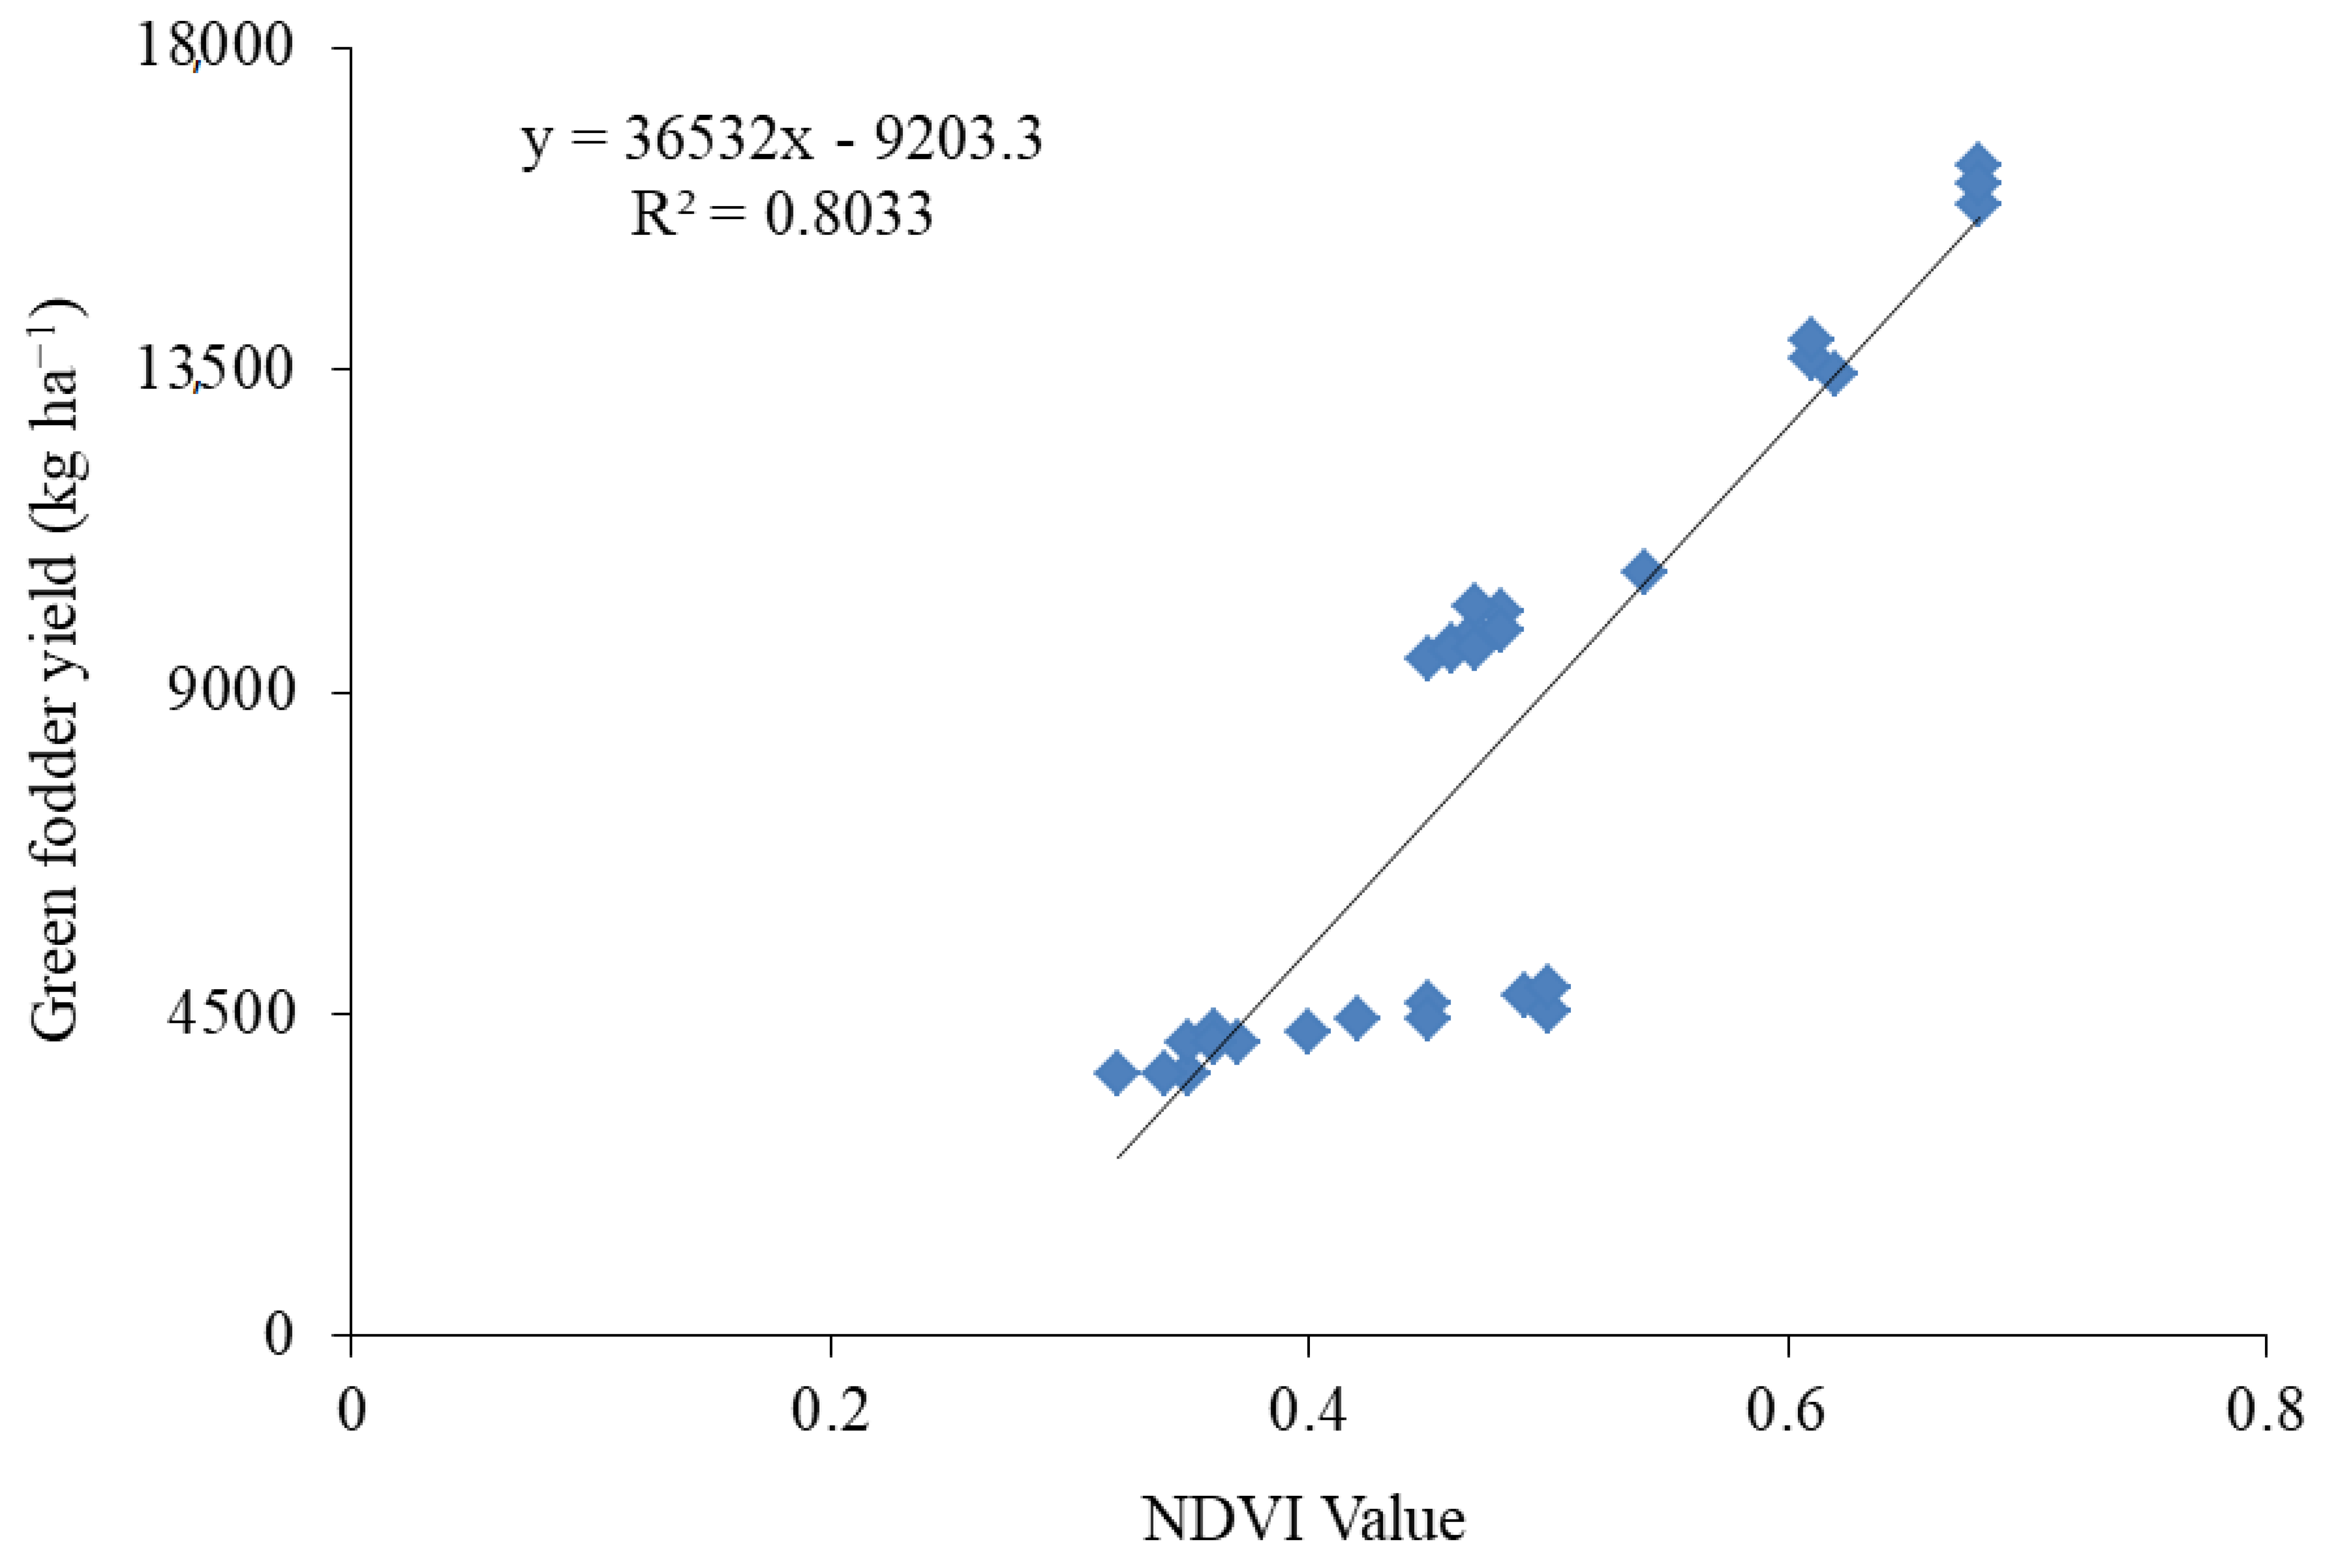
3.11. Normalized Difference Vegetative Index (NDVI)

The NDVI values under the control, N3 (40 kg ha−1 nitrogen application at sowing time through broad cast and remaining managed through GreenSeekerTM) and N4 (20 kg ha−1 applied at sowing time through broad cast and remaining managed through GreenSeekerTM) treatments at the tillering and booting stages were highly significant in PARC fodder oat at the 5% probability level (Table 11). Overall, an increasing trend in NDVI value was recorded from the tillering to the booting growth stage in control, N3 and N4. The correlation between NDVI at the tillering and booting stages with green fodder yield was positive (R2 = 0.80) (Figure 5). Consistent with the results of our research study, Wang et al [39] and Sultana et al. [40] also reported similar results of the NDVI value of diverse wheat cultivars at different growth stages in Faisalabad, Pakistan. A positive and significant correlation between NDVI value and different yield parameters was reported by [41] in durum wheat cultivars.

4. Conclusions

Oat yield and related parameters were responsive to nitrogen application using GreenSeekerTM, allowing to reduce the overall use of nitrogen and to provide possible protection from atmospheric pollution due to recommended use of nitrogen in fodder oat. Nitrogen application at 20 kg ha−1 managed two times with GreenSeekerTM and a seed rate of 80 kg ha−1 were found as the best practices to increase the oat fodder yield and to reduce the possible environmental pollution under the agro-ecology conditions of Islamabad, Pakistan. Instead of relying on traditional methods of nitrogen application, local growers should use GreenSeekerTM to increase fodder yield with reduced cost of production, which is a limiting factor in the study area. The suitable portable handheld optical sensor GreenSeekerTM (NTech Industries Incorporation, Ukiah, CA, USA) could be used by local farmers to predict the required nitrogen application for their crops. We recommend repeating the research study in diverse locations or regions of oat production in the country to provide final recommendations to the growers.

Author Contributions

S.U.K. conceived the idea. J.S., S.K. and Z.A.G. conducted the experiment and performed the literature review. A.Q. and S.U.K. provided technical expertise to strengthen the basic idea. S.F., X.W. and A.Q. helped in the statistical analysis. S.U.K. and A.Q. proofread the manuscript and provided intellectual guidance. All authors read the first draft, helped in revision and approved the article. All authors have read and agreed to the published version of the manuscript.

Funding

The publication of the present work is supported by the Natural Science Basic Research Program of Shaanxi Province (grant no. 2018JQ5218) and the National Natural Science Foundation of China (51809224), Top Young Talents of Shaanxi Special Support Program.

Institutional Review Board Statement

Not applicable.

Informed Consent Statement

Not applicable.

Data Availability Statement

Not applicable.

Conflicts of Interest

The authors declare that there are no conflicts of interest.

References

  1. Mohr, R.; Grant, C.; May, W. Nitrogen, phosphorus and KCl management for oat. In Proceedings of the 4th Annual Manitoba Agronomists Conference, Winnipeg, MB, Canada, 9–10 December 2003; p. 254. [Google Scholar]
  2. Fageria, N.K.; Moreira, A. The role of mineral nutrition on root growth of crop plants. Adv. Agron. 2011, 110, 251–331. [Google Scholar]
  3. Delevatti, L.M.; Cardoso, A.S.; Barbero, R.P.; Leite, R.G.; Romanzini, E.P.; Ruggieri, A.C.; Reis, R.A. Effect of nitrogen application rate on yield, forage quality, and animal performance in a tropical pasture. Sci. Rep. 2019, 9, 7596. [Google Scholar] [CrossRef] [PubMed]
  4. Khosla, R.; Alley, M.M. Soil-specific nitrogen management on mid-Atlantic coastal plain soils. Better Crop. 1999, 83, 6–7. [Google Scholar]
  5. Lindblom, J.; Lundström, C.; Ljung, M.; Jonsson, A. Promoting sustainable intensification in precision agriculture: Review of decision support systems development and strategies. Precis. Agric. 2017, 18, 309–331. [Google Scholar] [CrossRef] [Green Version]
  6. Brisco, B.; Brown, R.J.; Hirose, T.; McNairn, H.; Staenz, K. Precision agriculture and the role of remote sensing: A review. Can. J. Remote Sens. 2014, 24, 315–327. [Google Scholar] [CrossRef]
  7. Robertson, M.J.; Llewellyn, R.S.; Mandel, R.; Lawes, R.; Bramley, R.G.V.; Swift, L.; Metz, N.; O’Callaghan, C. Adoption of variable rate fertilizer application in the Australian grains industry: Status, issues and prospects. Precis. Agric. 2012, 13, 181–199. [Google Scholar] [CrossRef]
  8. Padilla, F.M.; Gallardo, M.; Peña-Fleitas, M.T.; de Souza, R.; Thompson, R.B. Proximal optical sensors for nitrogen management of vegetable crops: A review. Sensors 2018, 18, 2083. [Google Scholar] [CrossRef] [PubMed] [Green Version]
  9. Marino, S.; Alvino, A. Proximal sensing and vegetation indices for site-specific evaluation on an irrigated crop tomato. Eur. J. Remote Sens. 2014, 47, 271–283. [Google Scholar] [CrossRef]
  10. De Souza, R.; Peña-Fleitas, M.T.; Thompson, R.B.; Gallardo, M.; Padilla, F.M. Assessing performance of vegetation indices to estimate nitrogen nutrition index in pepper. Remote Sens. 2020, 12, 763. [Google Scholar] [CrossRef] [Green Version]
  11. Naser, M.A.; Khosla, R.; Longchamps, L.; Dahal, S. Using NDVI to differentiate wheat genotypes productivity under dryland and irrigated conditions. Remote Sens. 2020, 12, 824. [Google Scholar] [CrossRef] [Green Version]
  12. Randelovic, P.; Ðordevic, V.; Milic, S.; Baleševic-Tubic, S.; Petrovic, K.; Miladinovic, J.; Ðukic, V. Prediction of soybean plant density using a machine learning model and vegetation indices extracted from RGB images taken with a UAV. Agronomy 2020, 10, 1108. [Google Scholar] [CrossRef]
  13. Guo, A.; Huang, W.; Ye, H.; Dong, Y.; Ma, H.; Ren, Y.; Ruan, C. Identification of wheat yellow rust using spectral and texture features of hyperspectral images. Remote Sens. 2020, 12, 1419. [Google Scholar] [CrossRef]
  14. Sandino, J.; Pegg, G.; Gonzalez, F.; Smith, G. Aerial mapping of forests affected by pathogens using UAVs, hyperspectral sensors, and artificial intelligence. Sensors 2018, 18, 944. [Google Scholar] [CrossRef] [Green Version]
  15. Siqueira, R.; Longchamps, L.; Dahal, S.; Khosla, R. Use of fluorescence sensing to detect nitrogen and potassium variability in maize. Remote Sens. 2020, 12, 1752. [Google Scholar] [CrossRef]
  16. Holland, K.H.; Schepers, J.S. Derivation of a variable rate nitrogen application model for in-season fertilization of corn. Agron. J. 2010, 102, 1415–1424. [Google Scholar] [CrossRef]
  17. Zhang, X.; Davidson, E.A.; Mauzerall, D.L.; Searchinger, T.D.; Dumas, P.; Shen, Y. Managing nitrogen for sustainable development. Nature 2015, 528, 51–59. [Google Scholar] [CrossRef] [Green Version]
  18. Lancashire, P.D.; Bleiholder, H.; Boom, T.V.D.; Langelüddeke, P.; Stauss, R.; Weber, E.; Witzenberger, A. A uniform decimal code for growth stages of crops and weeds. Ann. Appl. Biol. 1991, 119, 561–601. [Google Scholar] [CrossRef]
  19. Gutiérez-Soto, M.V.; Cadet-Piedra, E.; Rodríguez-Montero, W.; Araya-Alfaro, J.M. GreenSeeker and the diagnosis of crop health. Agron. Mesoam. 2011, 22, 397–403. [Google Scholar]
  20. Cornell, J.A.; Berger, R.D. Factors that influence the value of the coefficient of determination in simple linear and nonlinear regression models. Phytopathology 1987, 77, 63–70. [Google Scholar] [CrossRef]
  21. Ghilani, C.D. Adjustment Computations: Spatial Data Analysis; John Wiley & Sons: Hoboken, NJ, USA, 2017. [Google Scholar]
  22. Belsley, D.A.; Edwin, K.; Welsch, R.E. Regression Diagnostics: Identifying Influential Data and Sources of Collinearity; John Wiley & Sons: Hoboken, NJ, USA, 2005; Volume 571. [Google Scholar]
  23. CIMMYT. From Agronomic Data to Farmer Recommendations: An Economics Training Manual; Completely revised edition; CIMMYT: Mexico City, Mexico, 1988; pp. 31–33. [Google Scholar]
  24. Statistix 8.1. User’s Manual; Analytical Software: Tallahassee, FL, USA, 2003.
  25. Steel, R.G.D.; Torrie, J.H.; Dicky, D.A. Principles and Procedures of Statistics: A Biometrical Approach, 3rd ed.; McGraw Hill, Inc.: New York, NY, USA, 1997; pp. 352–358. [Google Scholar]
  26. Patel, T.U.; Arvadia, M.K.; Malik, P.K.; Patel, D.D.; Patel, P.S. Productivity of oat (Avena sativa) under different cutting management and split application of nitrogen. Indian J. Agron. 2011, 56, 164–167. [Google Scholar]
  27. Malik, P.R.E.E.T.I.; Duhan, B.S.; Midha, L.K. Effect of fertilizer application and cutting schedule on growth and yield parameters in oat (Avena sativa L.). Forage Res. 2015, 40, 264–267. [Google Scholar]
  28. Luikham, E.; Kamei, S.; Mariam, A.P.S. Yield, quality and economics of oat fodder (Avena sativa L.) as influenced by nitrogen and varieties. Forage Res. 2012, 38, 112–114. [Google Scholar]
  29. Nawaz, M.Q. Effect of different sowing methods and nitrogen levels on fodder yield of oat in salt affected soil. Pak. J. Agric. Res. 2017, 30, 323–328. [Google Scholar] [CrossRef]
  30. Pathan, S.H.; Bhilare, R.L.; Nawale, K.B.; Jadhav, V.T. Response of multicut oat varieties to nitrogen levels. Forage Res. 2007, 32, 269–270. [Google Scholar]
  31. Labra, M.H.; Struik, P.C.; Calderini, D.F.; Evers, J.B. Leaf nitrogen traits in response to plant density and nitrogen supply in oilseed rape. Agronomy 2020, 10, 1780. [Google Scholar] [CrossRef]
  32. Devi, U.; Panghaal, D.; Kumar, P.; Sewhag, M.; Kumar, P. Effect of nitrogen fertilizers on yield and quality of oats: A review. Int. J. Chem. Stud. 2019, 7, 1999–2005. [Google Scholar]
  33. Khattak, S.I.; Nadim, M.A.; Baloch, M.S.; Waseem, K.; Sohail, M. Impact of variable seeding dates on cereals’ performance under agro-ecological conditions of Dera Ismail Khan. Pak. J. Agric. Res. 2016, 29, 236–243. [Google Scholar]
  34. Kumar, B.S.; Singh, R.V.; Gupta, A.K.; Ravinder, J. Effect of nitrogen levels and cutting management on green forage yield of fodder oat (Avena sativa L.). J. Pharmacogn. Phytochem. 2017, 6, 635–637. [Google Scholar]
  35. Joshi, R.V.; Patel, B.J.; Patel, K.M. Effect of nitrogen levels and time of application on growth, yield, quality, nitrogen, phosphorus content and uptake for seed production of oat (Avena sativa L.). Forage Res. 2015, 41, 104–108. [Google Scholar]
  36. Song, X.; Zhou, G.; Ma, B.L.; Wu, W.; Ahmad, I.; Zhu, G.; Yan, W.; Jiao, X. Nitrogen application improved photosynthetic productivity, chlorophyll fluorescence, yield and yield components of two oat genotypes under saline conditions. Agronomy 2019, 9, 115. [Google Scholar] [CrossRef] [Green Version]
  37. Ranjan, R.D.; Gontia, A.S.; Pal, A.K.; Kumar, S.; Kumar, B.; Bhamini, K.; Kumari, N. Morphological and physiological responses of dual purpose wheat (Triticum aestivum L.) to nitrogen and seed rates: A review. Agric. Rev. 2016, 37, 279–289. [Google Scholar]
  38. Iqbal, A.; Iqbal, M.A.; Nabeel, F.; Khan, H.Z.; Akbar, N.; Abbas, R.N. Economic and sustainable forage oat (Avena sativa L.) production as influenced by different sowing techniques and sources of nitrogen. Agric. Environ. Sci. 2014, 14, 1035–1040. [Google Scholar]
  39. Wang, X.; Wang, G.; Guo, T.; Xing, Y.; Mo, F.; Wang, H.; Fan, J.; Zhang, F. Effects of plastic mulch and nitrogen fertilizer on the soil microbial community, enzymatic activity and yield performance in a dryland maize cropping system. Eur. J. Soil Sci. 2021, 72, 400–412. [Google Scholar] [CrossRef]
  40. Sultana, S.R.; Ali, A.; Ahmad, A.; Mubeen, M.; Zia-Ul-Haq, M.; Ahmad, S.; Ercisli, S.; Jaafar, H.Z.E. Normalized difference vegetation index as a tool for wheat yield estimation: A case study from Faisalabad, Pakistan. Sci. World J. 2014, 1–8. [Google Scholar] [CrossRef] [Green Version]
  41. Fu, Z.; Jiang, J.; Gao, Y.; Krienke, B.; Wang, M.; Zhong, K.; Cao, Q.; Tian, Y.; Zhu, Y.; Cao, W.; et al. Wheat growth monitoring and yield estimation based on multi-rotor unmanned aerial vehicle. Remote Sens. 2020, 12, 508. [Google Scholar] [CrossRef] [Green Version]
Figure 1. Interaction of nitrogen management and seed rate for plant height (cm) of oat.
Sustainability 13 06955 g001
Figure 2. Interaction of nitrogen management and seed rate for leaf area (cm2) of oat.
Sustainability 13 06955 g002
Figure 3. Interaction of nitrogen management and seed rate for plant population (ha−1) of oat.
Sustainability 13 06955 g003
Figure 4. Interaction of nitrogen management and seed rate for green fodder yield (kg ha−1) of oat.
Sustainability 13 06955 g004
Figure 5. Relationship between NDVI value and green fodder yield (kg ha−1) of fodder oat.
Sustainability 13 06955 g005
Table 1. Days to tillering of oat as influenced by nitrogen management and seed rate.
Nitrogen Dose
(kg ha−1)
Seed Rate (kg ha−1)Mean
80100120140
Control43.040.742.041.741.9 NS
80 (one dose)41.743.340.042.041.8 NS
80 (two split doses)42.042.334.340.039.7 NS
40 + GS40.042.040.734.339.3 NS
20 + GS + GS34.340.343.334.338.1 NS
Mean40.3 ab41.7 a40.1 ab38.5 b
Control41.9
Rest39.7
Mean followed by different letters in a column/row is significant at p ≤ 0.05. GS = GreenSeekerTM; LSD for S = 0.1884; LSD for N = 0.5953; NS = Non-significant.
Table 2. Tillers plant−1 of oat as influenced by nitrogen management and seed rate.
Nitrogen Dose
(kg ha−1)
Seed Rate (kg ha−1)Mean
80100120140
Control4.74.75.34.75 b
80 (one dose)6.35.35.75.76 a
80 (two split doses)5.05.35.35.05 b
40 + GS5.35.75.75.36 a
20 + GS + GS6.05.76.05.36 a
Mean5 b5 b6 a5 b
Control5 b
Rest6 a
Mean followed by a different letter in a column/row is significant at p ≤ 0.05. GS = GreenSeekerTM; LSD for S = 0.1884; LSD for N = 0.5953.
Table 3. Plant height (cm) of oat as affected by nitrogen management and seed rate.
Nitrogen Dose
(kg ha−1)
Seed Rate (kg ha−1)Mean
80100120140
Control55.356.35952.755.8 b
80 (one dose)70.361.767.776.369 a
80 (two split doses)72.368.371.770.770.8 a
40 + GS62.362.759.361.361.4 b
20 + GS + GS60.760.365.35560.3 b
Mean64.2 NS61.9 NS64.6 NS63.2 NS
Control55.8
Rest65.17
Mean followed by a different letter in a column/row is significant at p ≤ 0.05. GS = GreenSeekerTM; LSD for N = 6.7575; NS = Non-significant.
Table 4. Leaf area (cm2) of oat influenced by nitrogen management and seed rate.
Nitrogen Dose
(kg ha−1)
Seed Rate (kg ha−1)Mean
80100120140
Control55.2 abcd50.93 cd56.95 abcd56.43 abcd54.88 b
80 (one dose)54.43 bcd54.05 bcd64.10 abc53.37 bcd56.49 b
80 (two split doses)62.37 abc69.74 a60.61 abcd63.86 abc64.14 a
40 + GS46.19 d62.71 abc63.68 abc54.76 bcd56.84 b
20 + GS + GS66.69 ab60.80 abcd60.11 abcd46.81 d58.60 ab
Mean56.97 NS59.65 NS61.09 NS55.05 NS
Control54.88
Rest59.02
Mean followed by different letters in a column/row is significant at p ≤ 0.05. GS = GreenSeekerTM; LSD for N = 6.1602; LSD for N × S = 14.8; NS = Non-significant.
Table 5. Plant population (ha−1) of oat as affected by nitrogen management and seed rate.
Nitrogen Dose
(kg ha−1)
Seed Rate (kg ha−1)Mean
80100120140
Control91,33391,00091,33392,33391,500 bc
80 (one dose)106,33384,333106,333105,333100,583 a
80 (two split doses)84,33392,33384,33391,00088,000 c
40 + GS92,333105,33392,33384,33393,583 b
20 + GS + GS105,33391,00084,33392,33393,250 bc
Mean95,933 NS92,800 NS91,733 NS93,067 NS
Control91,500
Rest93,854
Mean followed by different letters in a column/row is significant at p ≤ 0.05. GS = GreenSeekerTM; LSD for N = 5.2940; LSD for N × S = 10.283; NS = Non-significant.
Table 6. Days to boot stage of oat influenced by nitrogen management and seed rate.
Nitrogen Dose
(kg ha−1)
Seed Rate (kg ha−1)Mean
80100120140
Control130 NS130 NS131 NS132 NS131 a
80 (one dose)130 NS129 NS128 NS129 NS129 c
80 (two split doses)128 NS129 NS129 NS129 NS129 c
40 + GS129 NS129 NS130 NS130 NS130 b
20 + GS + GS129 NS131 NS129 NS130 NS130 bc
Mean129 NS130 NS129 NS130 NS
Control131
Rest129.5
Mean followed by different letters in a column/row is significant at p ≤ 0.05. GS = GreenSeekerTM; LSD for N = 0.8722; NS = Non-significant.
Table 7. Green fodder yield (kg ha−1) of oat as affected by nitrogen management and seed rate.
Nitrogen Dose
(kg ha−1)
Seed Rate (kg ha−1)Mean
80100120140
Control12,037 cde12,869 cde13,013 cd11,728 e12,411.64 e
80 (one dose)13,611 cd13,343 cd12,963 d12,967 d13,221.07 d
80 (two split doses)13,909 cd14,815 bcd14,824 bcd13,907 bcd14,363.88 c
40 + GS14,337 bcd15,732 dc14,986 bcd17,189 a15,560.93 b
20 + GS + GS15,801 bc16,366 b16,744 ab17,380 a16,572.85 a
Mean13,939.09 NS14,624.78 NS14,506.13 NS14,634.29 NS
Control12,411.6
Rest14,929.69
Mean followed by different letters in a column/row is significant at p ≤ 0.05. GS = GreenSeekerTM; LSD for N = 696.51; LSD for N × S = 2343; NS = Non-significant.
Table 8. Photosynthetic rate (µmol m−2 s−1) of oat as affected by nitrogen management and seed rate.
Nitrogen Dose
(kg ha−1)
Seed Rate (kg ha−1)Mean
80100120140
Control11.31 NS9.89 NS11.84 NS11.43 NS11.12 a
80 (one dose)9.60 NS9.56 NS9.28 NS8.57 NS9.26 b
80 (two split doses)13.53 NS12.01 NS9.81 NS10.87 NS11.55 a
40 + GS10.46 NS9.48 NS10.93 NS12.06 NS10.73 ab
20 + GS + GS12.97 NS9.97 NS11.54 NS12.09 NS11.64 a
Mean11.58 NS10.18 NS10.68 NS11.00 NS
Control11.12
Rest10.78
Mean followed by different letters in a column/row is significant at p ≤ 0.05. GS = GreenSeekerTM; LSD for N = 1.6081; NS = Non-significant.
Table 9. Stomatal conductance (mmol m−2 s−1) of oat influenced by nitrogen management and seed rate.
Nitrogen Dose
(kg ha−1)
Seed Rate (kg ha−1)Mean
80100120140
Control201.62 NS172.62 NS147.56 NS220.81 NS185.65 NS
80 (one dose)158.54 NS197.98 NS166.06 NS218.97 NS185.39 NS
80 (two split doses)191.45 NS233.76 NS202.82 NS183.41 NS202.86 NS
40 + GS214.42 NS218.03 NS245.30 NS165.76 NS210.88 NS
20 + GS + GS204.66 NS207.93 NS198.65 NS205.09 NS204.08 NS
Mean194.14 NS206.07 NS192.08 NS198.81 NS
Control185.65
Rest200.80
Mean followed by different letters in a column /row is significant at p ≤ 0.05. GS = GreenSeekerTM; LSD for N = 1.6081; LSD for N × S = Non-significant.
Table 10. Economic analysis of oat production as affected by nitrogen management with GreenSeekerTM and conventional methods of application.
Nitrogen Dose
(kg ha−1)
N (kg ha−1)
Actual Applied
Input Cost
(ha−1)
Income
(ha−1)
Net Income
N0 = Control0320.78895.81575.03
N1 = 100 % (80 kg ha−1) N in single dose80372.10954.24582.13
N2 = 80 kg ha−1 N in two split doses (40 kg ha−1 each)80372.101036.71664.61
N3 = 40 kg N by broad cast + GS (28 kg)68364.411123.11758.71
N4 = 20 kg N by broad cast + GS (20 kg N) + GS (18 kg N)58357.991196.15838.16
Values presented in the table are in USD for December 2018–June 2019.
Table 11. Effect of nitrogen dose on NDVI value of fodder oat at tillering and booting growth stages.
Nitrogen Doses (kg ha−1)Tillering StageBooting Stage
N0 = Control0.33 d0.45 c
N1 = 100 % (80 kg ha−1) N in single dose0.36 d0.47 c
N2 = 80 kg ha−1 N in two split doses (40 kg ha−1 each)0.37 d0.50 c
N3 = 40 kg N by broad cast + GS (28 kg)0.45 c0.61 b
N4 = 20 kg N by broad cast + GS (20 kg N ) + GS (18 kg N)0.48 c0.68 a
Mean0.40 b0.54 a
Mean followed by different letters in a column /row is significant at p ≤ 0.05. GS = GreenSeekerTM; LSD for N × GS = 0.0165.
Publisher’s Note: MDPI stays neutral with regard to jurisdictional claims in published maps and institutional affiliations.

