Article

δ2H and δ18O in Precipitation and Water Vapor Disentangle Seasonal Wind Directions on the Loess Plateau

1
State Key Laboratory of Grassland Agroecosystems, Institute of Arid Agroecology, School of Life Sciences, Lanzhou University, No. 222, South Tianshui Road, Lanzhou 730000, China
2
Centre for Quantitative Biology, College of Science, Gansu Agricultural University, Lanzhou 730070, China
3
Department of Agriculture and Rural Affairs of Gansu Province, Gansu Agricultural University, Lanzhou 730000, China
4
Department of Soil Science of Temperate Ecosystems, Department of Agricultural Soil Science, University of Göttingen, 37077 Göttingen, Germany
5
Agro-Technological Institute, RUDN University, 117198 Moscow, Russia
6
Institute of Environmental Sciences, Kazan Federal University, 420049 Kazan, Russia
*
Author to whom correspondence should be addressed.
Sustainability 2021, 13(12), 6938; https://doi.org/10.3390/su13126938
Submission received: 28 May 2021 / Revised: 17 June 2021 / Accepted: 17 June 2021 / Published: 20 June 2021
(This article belongs to the Section Resources and Sustainable Utilization)

Abstract

:
In many areas of the Loess Plateau, groundwater is too deep to extract, making meteoric water (snow and rain) the only viable water resource. Here we traced the rainwater and water vapor sources using the δ2H and δ18O signature of precipitation in the northern mountainous region of Yuzhong on the Loess Plateau. The local meteoric water line in 2016 and 2017 was defined as δ2H = 6.8 (±0.3)∙δ18O + 4.4 (±2.0) and δ2H = 7.1 (±0.2)∙δ18O + 1.5 (±1.6), respectively. The temperature and precipitation amount are considered to be the main factor controlling the δ2H and δ18O variation of precipitation, and consequently, relationships were first explored between δ18O and local surface air temperature and precipitation amount by linear regression analysis. The temperature effect was significant in the wet seasons but was irrelevant in the dry seasons on daily and seasonal scales. The amount effect was significant in the wet seasons on a daily scale but irrelevant in the dry seasons. However, based on the data of the Global Network of Isotopes in Precipitation (GNIP) (1985–1987, 1996–1999) of Lanzhou weather station, the amount effects were absent at seasonal scales and were not useful to discriminate either wetter or drier seasons or even wetter or drier decades. Over the whole year, the resulting air mass trajectories were consistent with the main sources of water vapor were from the Atlantic Ocean via westerlies and from the Arctic region, with 46%, 64%, and 40% of water vapor coming from the westerlies, and 54%, 36%, and 60% water vapor from the north in spring, autumn and winter, respectively. In the summer, however, the southeast monsoon (21%) was also an important water vapor source in the Loess Plateau. Concluding, using the δ2H and δ18O signatures of precipitation water, we disentangled and quantified the seasonal wind directions that are important for the prediction of water resources for local and regional land use.

1. Introduction

Understanding the precipitation sources is important for meteorological, hydrological, and ecological studies that underpin well-informed water resource management [1]. The combined measures of stable hydrogen (2H) and oxygen (18O) isotopes in precipitation enable analyzing local and global hydrologic cycles accurately. The composition of stable isotopes in precipitation is closely correlated with water vapor transport processes and the origin of the water vapor source region and, therefore, provides useful information about hydrogeological processes and atmospheric circulation [2,3,4].
The δ18O and δ2H signatures of precipitation can change due to isotope fractionation during evaporation and condensation [5]. The isotopically lighter molecules have a higher vapor pressure, while the heavier isotopic molecules generally have higher binding energy [6]. The water containing lighter isotopes thus evaporates at a slightly faster rate than water containing heavier isotopes. In turn, the heavier isotopes preferentially precipitate out in a series of condensations [7]. Therefore, during the evaporation, the remaining liquid phase is enriched with a heavier isotope. As the oceanic water vapor moves through the cycle, it becomes progressively lighter as the heavier isotopes preferentially precipitate out in a series of condensations [7]. In general, the δ18O and δ2H signatures of precipitation follow the Rayleigh-type fractionation model during the water cycle, influenced by meteorological factors, such as temperature, atmospheric humidity, precipitation amount, and residence time [8,9]. These effects of environmental factors on stable isotope signatures vary with geographical location, atmospheric circulation, weather, and terrain [10]. The δ18O and δ2H values are, therefore, region-specific and require local analyses [11,12].
To study the extent of isotope fractionation in atmospheric precipitation, the deuterium excess, also known as “d-excess” or “d”, was first proposed by Dansgaard in 1964 and is expressed by the equation: d-excess = δ2H − 8∙δ18O [8]. The d-excess is mainly influenced by the wind speed, sea surface temperature, and relative humidity over the sea [13,14]. Earlier studies [15] found a direct connection between d-excess and evaporative processes at the moisture source location, and therefore, d-excess can be used to trace the mixing of moisture of various vapor sources. Generally, the average value is about 10 on the global scale. High d-excess (>10) in precipitation are typical for intensive moisture recycling along air mass trajectories [16]. After a raindrop is condensed, the stronger the re-evaporative fractionation under the cloud, the smaller the d value (<10) is [17]. Due to the complexity of water cycling, the d-excess in precipitation varies temporally and spatially. Since the 1950s, the stable isotope composition of precipitation has been extensively used in studies of hydrologic cycle processes [18,19,20], including the moisture transport trajectory [21], climate models with isotope capability [22,23,24], river or lake water sources, [25,26], groundwater recharge [27], amount effects and paleoclimate reconstruction in certain regions [28,29,30,31], and the use of isotopic time series derived from speleothems to study the past monsoon intensity [32,33,34].
The northern mountainous region of Yuzhong County is located in the northwest of the Loess Plateau (Figure 1). Situated in north-central China, the Loess Plateau has a complex terrain and is a water-limited area. Many areas on the Loess Plateau have a deep groundwater level and no irrigation water; thus, as a limited and unique water resource in such areas, meteoric water is particularly important. Our study site also has very limited water resources, and therefore, low primary productivity. Intensive management results in serious water and soil loss, strongly decreasing the resistance and resilience of ecosystems to environmental perturbations. Therefore, limited water resources are one of the main factors restricting agricultural production. There is an urgent need to clarify the characteristics and sources of local precipitation to ensure the optimal utilization and management of scarce water resources. We used the δ2H and δ18O signatures of precipitation from April 2016 to December 2017 to identify meteorological factors affecting precipitation and its sources. Finally, we used a hydro-meteorological model to determine the moisture sources of precipitation on the Loess Plateau.

2. Materials and Methods
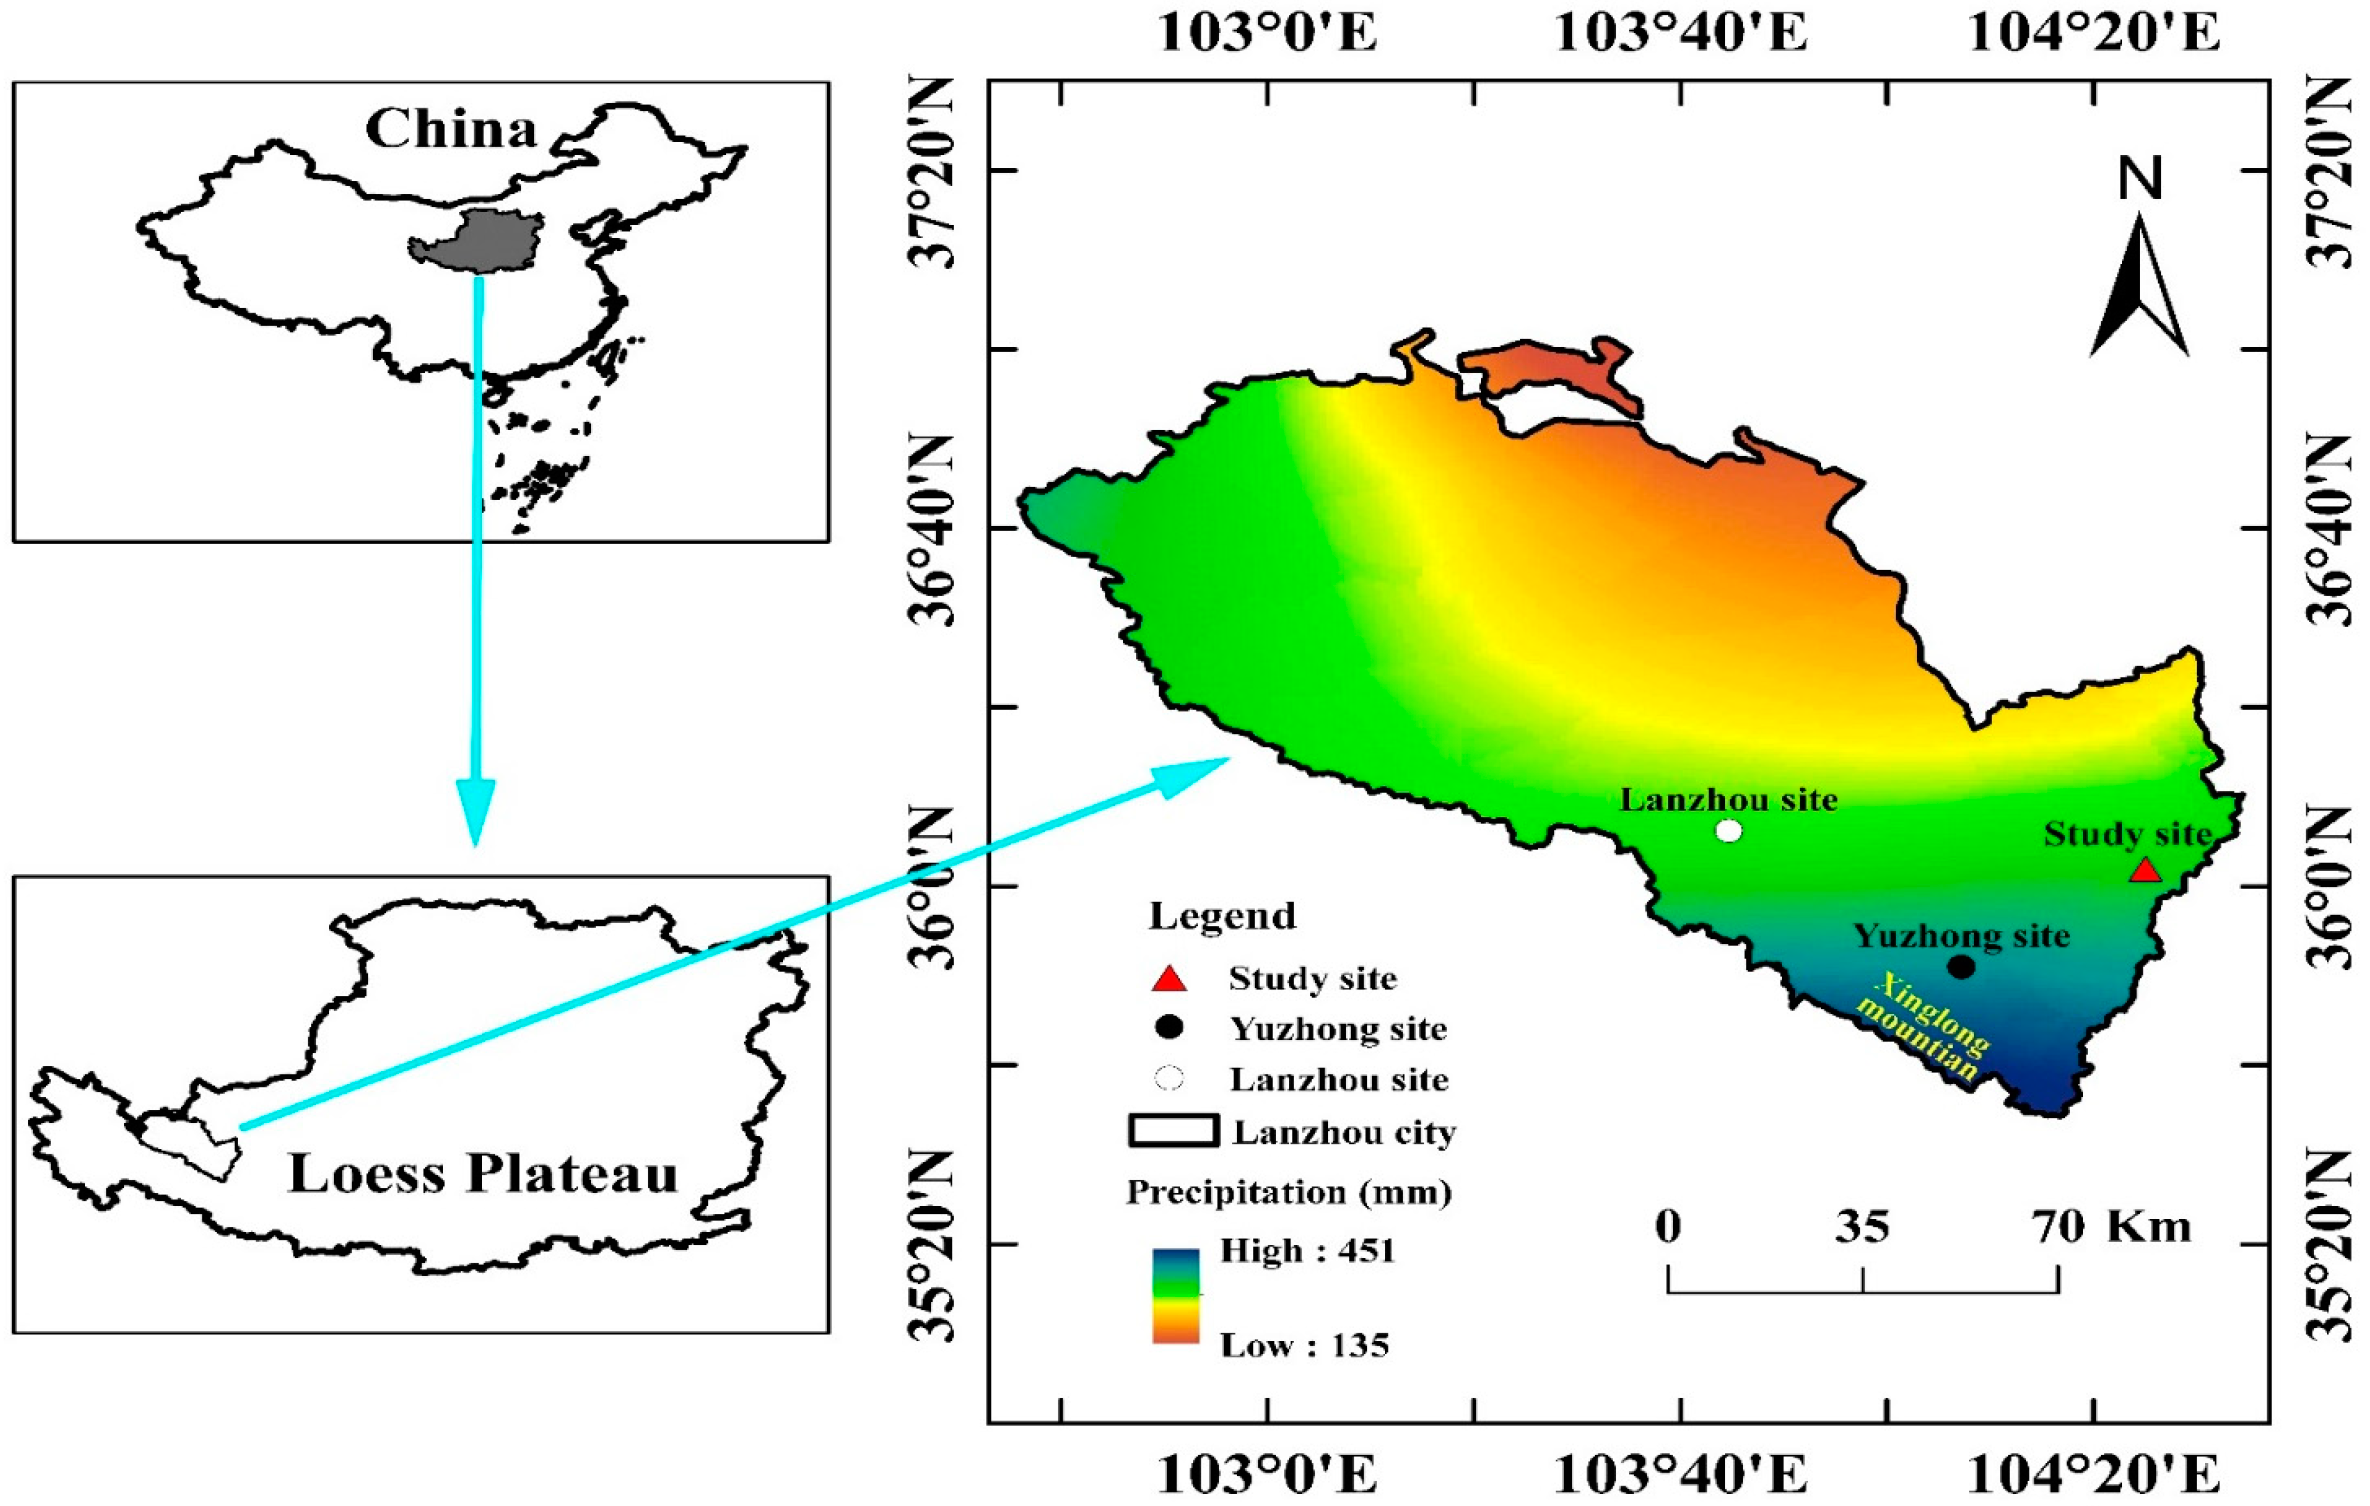
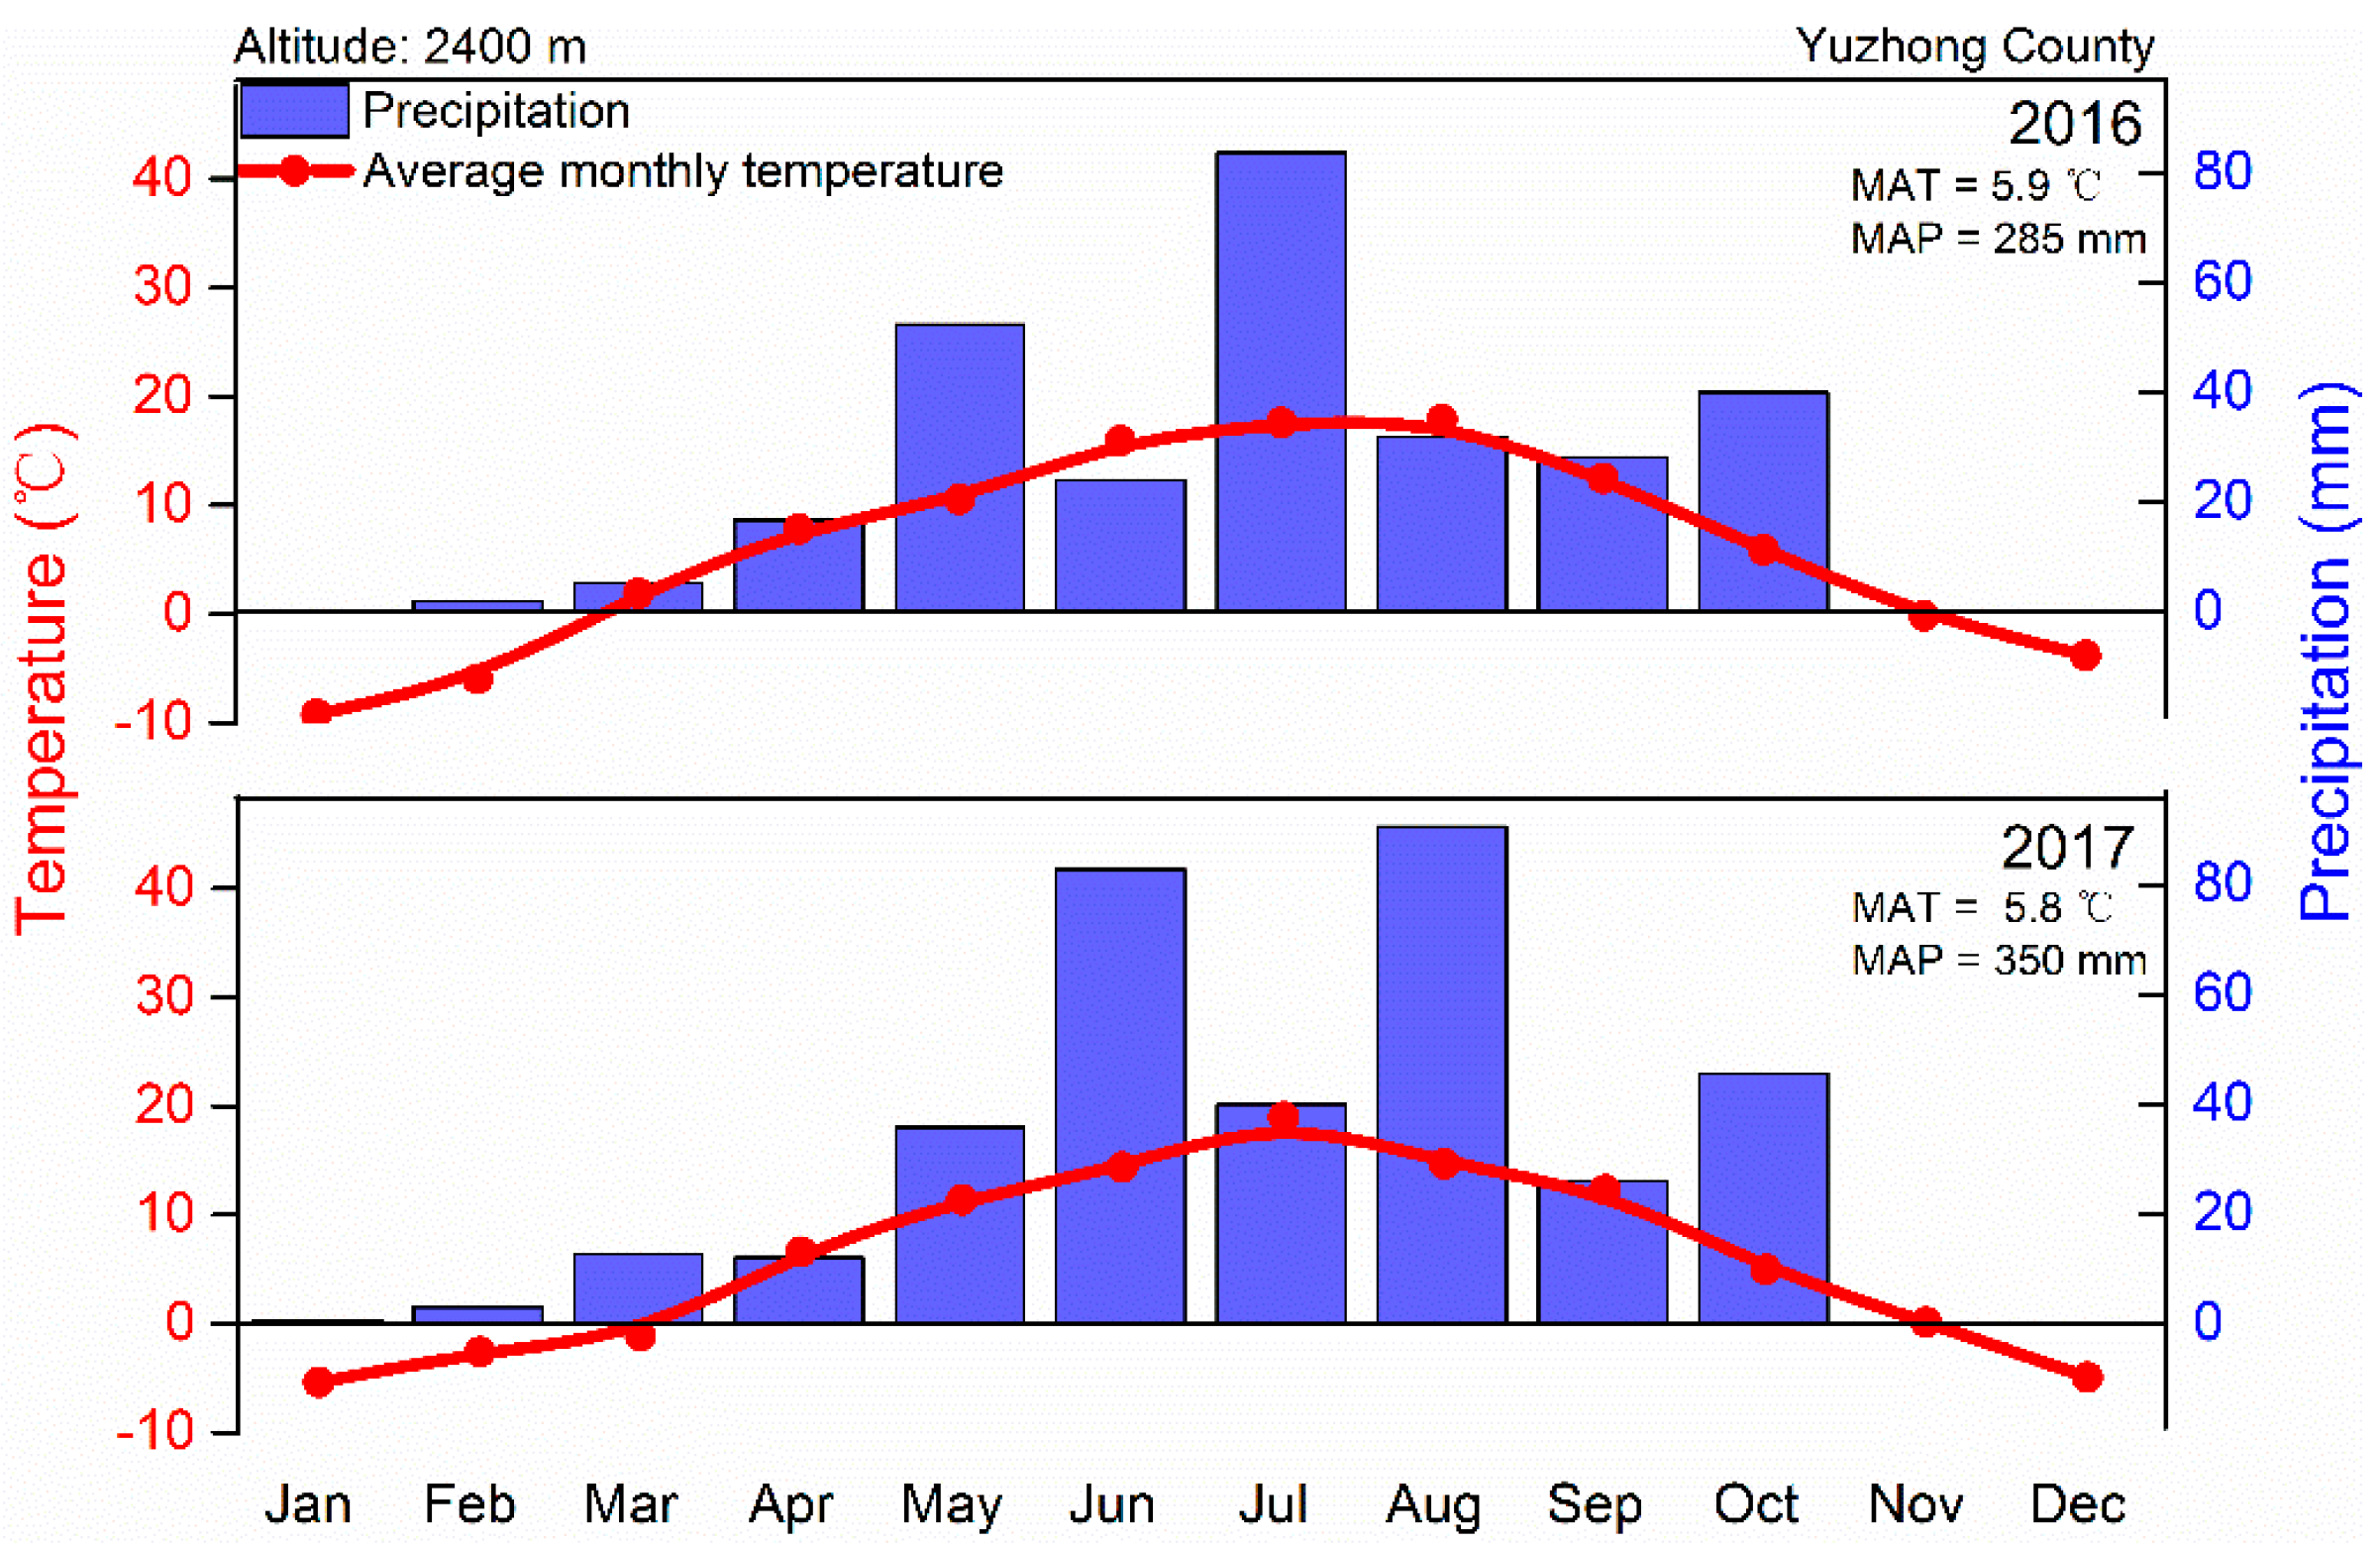
2.1. The Study Site

The study site is in the Dryland Agroecology Research Station (36°02′ N, 104°25′ E, altitude 2400 m) of Lanzhou University at Zhonglianchuan, Yuzhong County, Gansu Province, China (Figure 1). The site has a cold semi-arid climate, with an annual mean air temperature of 4.0 °C, mean maximum temperature of 15.7 °C in July, and mean minimum temperature of −12.6 °C in January. The mean annual precipitation over ten years (2007–2017) was 318 mm, with 285 mm in 2016 and 350 mm in 2017 (Figure 2). Precipitation occurs from May to October, accounting for 90% of the annual precipitation. The losses on the Chinese Loess Plateau are formed from materials derived from the Qilian and Gobi-Altay Mountains and transported via rivers and winds [35,36]. Subsequently, a further study confirmed that the loess deposits formed via the Mountain provenance-river transport-desert transition (MRD) mode, and the loess deposits are relatively continuous and thick [37]. Due to the lack of clay particles to hold water within the deposits [38], the groundwater table in this site is more than 60 m below the soil surface, which is unavailable for plants and difficult to get for irrigation.

2.2. Sampling Methods

Precipitation was collected after each rainfall event from April 2016 to December 2017. To prevent evaporation, the samples were gathered into sealed glass vials immediately after a rain event. Automated weather stations were used to record the precipitation amount, temperature, and relative humidity at the respective date. All precipitation samples were transported to the laboratory and preserved at 4 °C until analysis.

2.3. Data and Laboratory Measurements

The δ2H and δ18O values of the water samples were measured using an isotopic water analyzer (Picarro, L2130-i) at the Key Laboratory of Western China’s Environmental Systems, Ministry of Education, China. This instrument uses a laser-based absorption technique involving cavity ring-down spectroscopy. The working standard water samples were added between every seven samples. They are listed as follows, S1: δ18OV-SMOW = −13.1‰, δ2HV-SMOW = −96.4‰; S2: δ18OV-SMOW = −7.69‰, δ2HV-SMOW = −51‰; S3: δ18OV-SMOW = −2.8‰, and δ2HV-SMOW = −9.5‰. All water sample was loaded in the isotope analyzer for isotope measurement by an injector with a 0.22 um filter membrane. Each sample was parallelly measured six times, and the last three results were used for data processing. Results were expressed as parts per thousand deviations from the Vienna Standard Mean Ocean Water (V-SMOW) in the following form:
δ18O (or δ2H, ‰) = (Rs/Rstd − 1)
Rs and Rstd indicate the stable isotopic ratios of heavy to light isotopes (18O/16O, 2H/H) in the water sample and the standard sample. The analytical precision was ±0.025‰ and ±0.1‰, for δ18O for δ2H (delta notation relative to V-SMOW), respectively. Deuterium excess (d-excess) for each water sample was calculated as d-excess = δ2H − 8∙δ18O. The calculation of amount-weighted average isotopic composition for a given period was calculated by the following equation:
R W = i = 1 n ( P i R i ) i n P i
where Pi is the precipitation amount. Ri is the values of δ18O, δ2H and d-excess for sample i, and n is the total number of samples.

3. Results

Table S1 (in Supplementary Materials) and Figure 3 show the δ18O, δ2H, d-excess values and the meteorological data of each precipitation event in the study area, and the amount-weighted, minimal, maximal values and the seasonal average values in 4 seasons are listed in Table 1 and Table 2. The four seasons were defined as follows: winter (December, January, and February), spring (March, April, and May), summer (June, July, and August), and autumn (September, October, and November) according to the “Local records of Yuzhong County”. In total, 38 precipitation samples were collected in 2016, and 51 samples were collected in 2017. The δ2H and δ18O composition differed for individual precipitation events due to the complexity of vapor sources and the extreme natural climate in the cold semi-arid region. The δ18O values of precipitation in 2016 varied from −15.5‰ to 5.4‰, with the amount-weighted mean value of −8.2‰ and standard deviation of 4.7‰, while the δ2H values ranged from −108.4‰ to 35‰, with the amount-weighted mean value of −51‰ and standard deviation of 33‰. In 2017, the δ18O values varied from −17.8‰ to 5.8‰, with the amount-weighted mean value of −8.3‰ and standard deviation of 5.6‰, while the δ2H values ranged from −124.6‰ to 38.5‰, with the amount-weighted mean value of −58‰ and standard deviation of 40‰. Seasonal variations of the δ2H and δ18O values were substantial, with more enriched values in summer months and more depleted values in winter months. Generally, the seasonality in the isotope values of precipitation depends mostly on the seasonal variability of other controls such as temperature, precipitation, and moisture source [39]. Therefore, it is necessary to study further the relationship between isotopic composition and these meteorological parameters.

4. Discussion

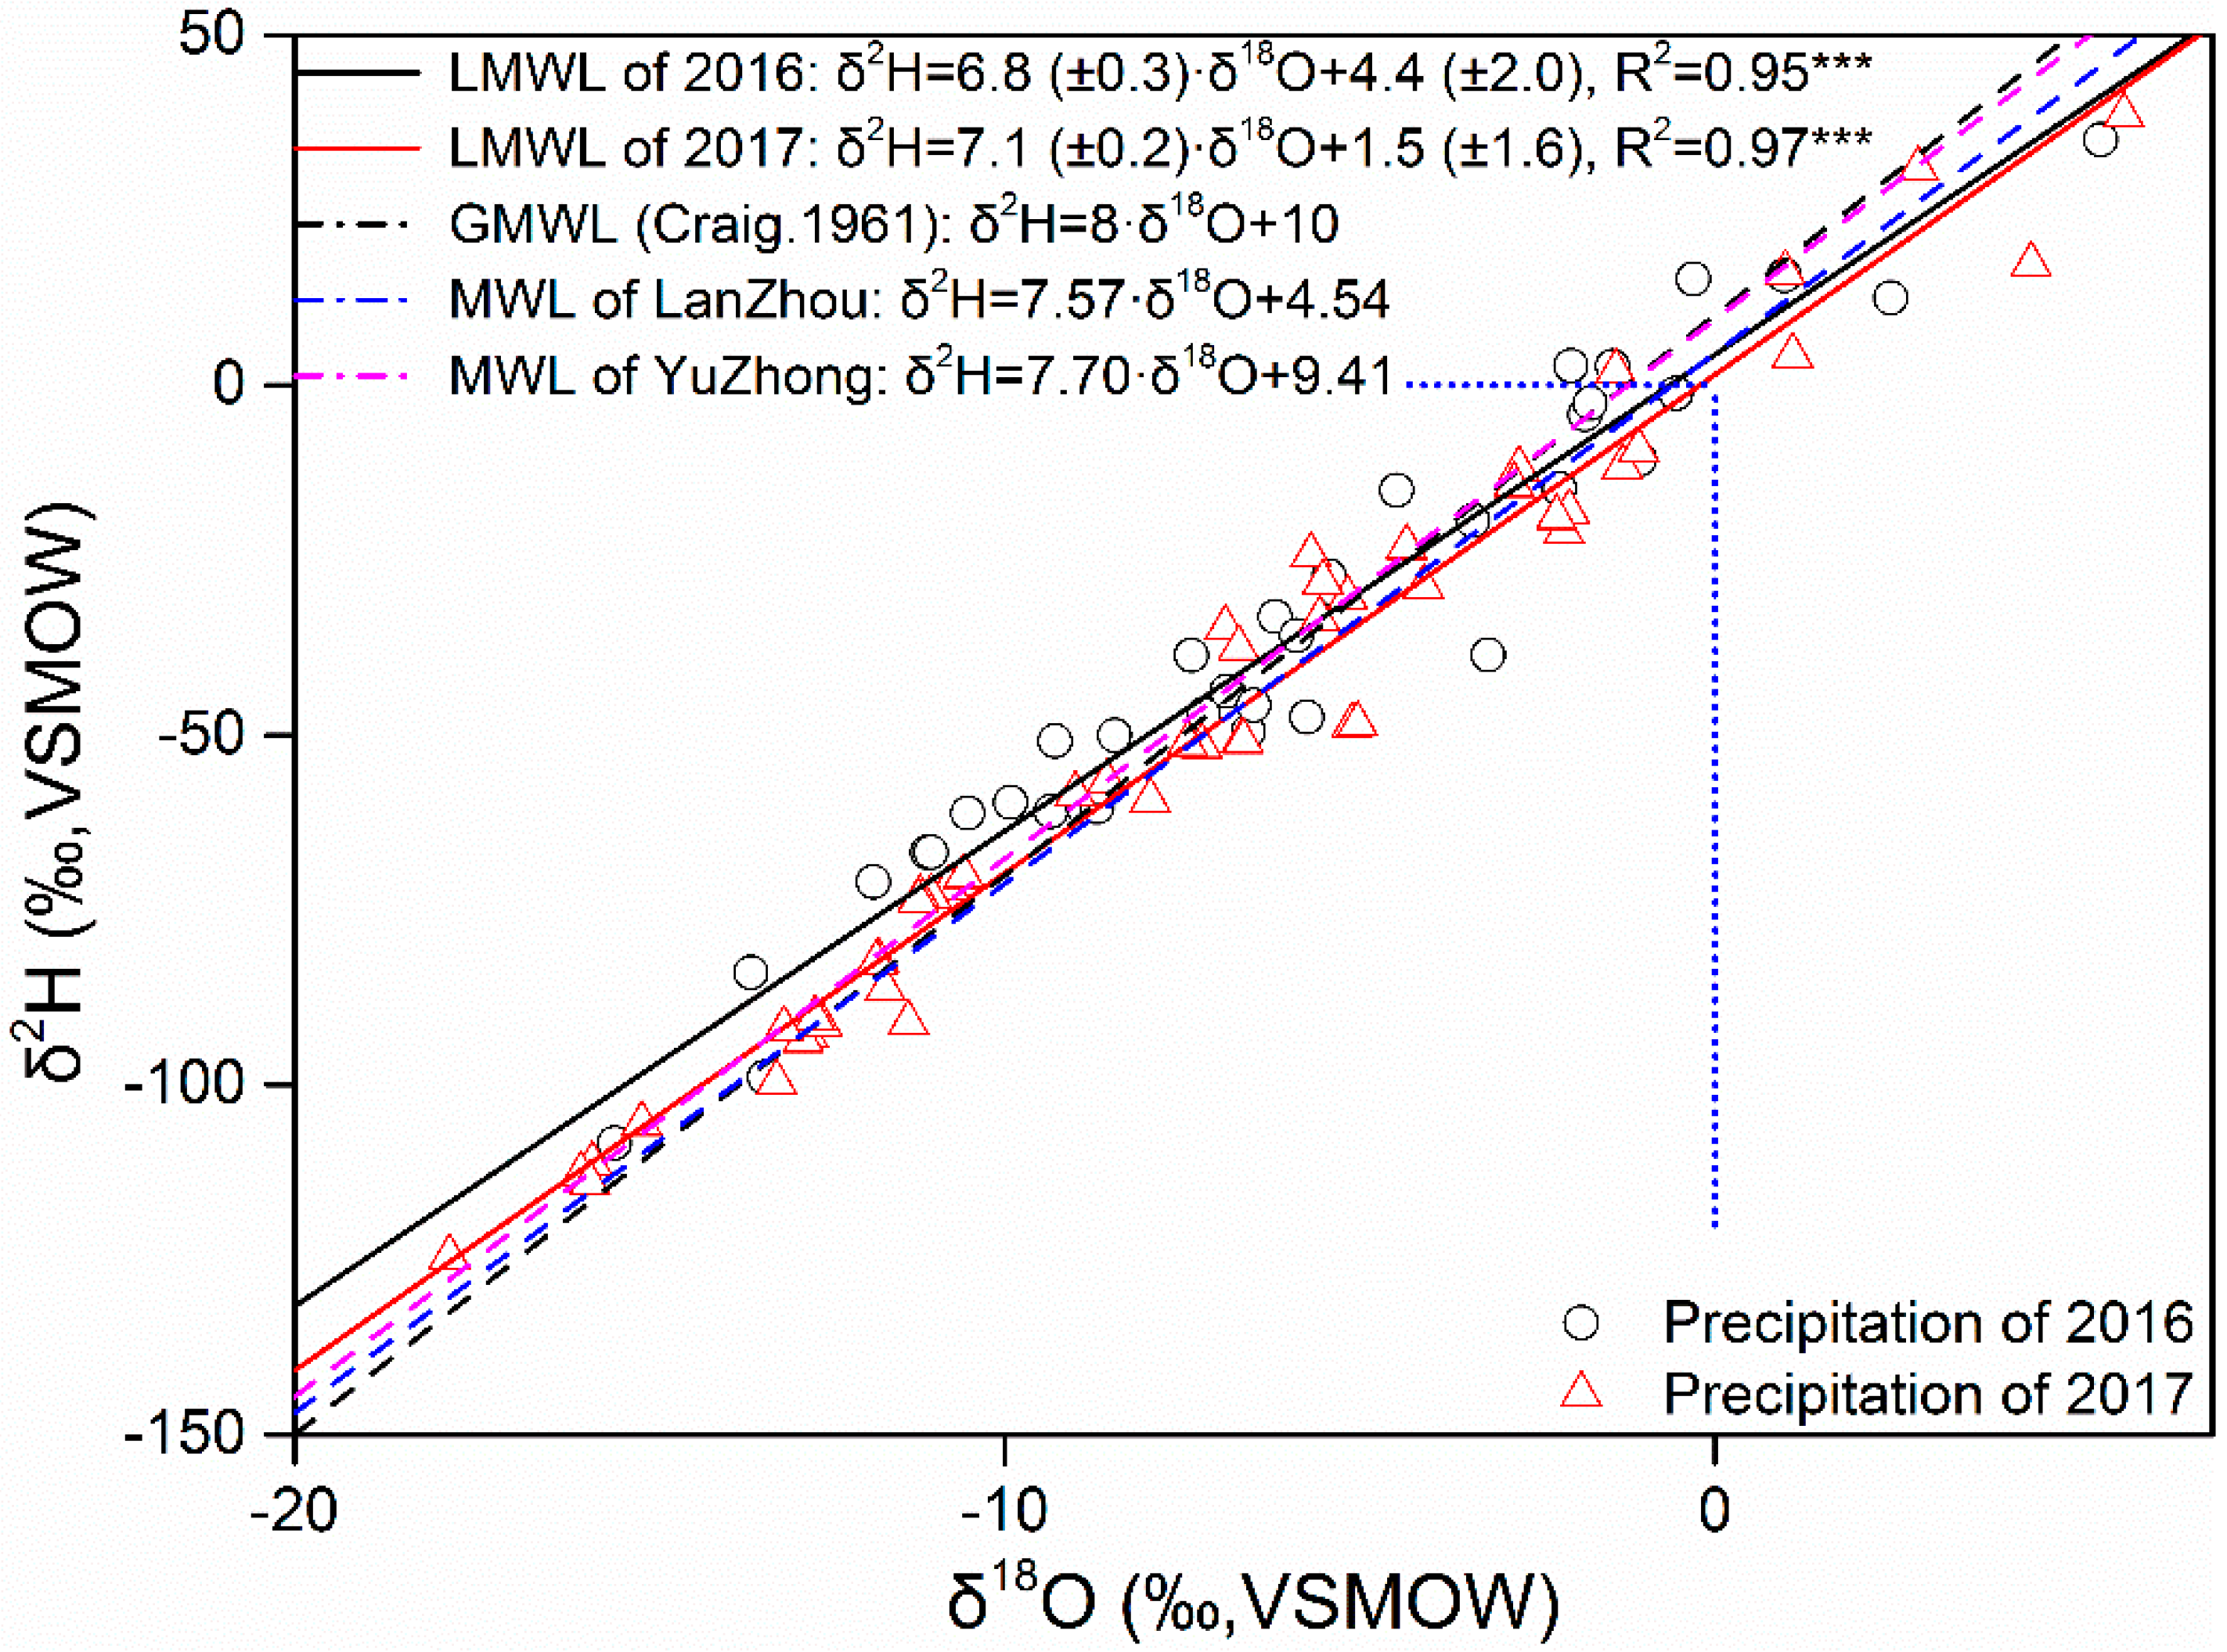
4.1. Local Meteoric Water Line

As marine air moves over the coast and into continental areas, different marine air particles mix and homogenize, resulting in closely aligned precipitation along the so-called meteoric water lines [40]. Craig initially proposed the global meteoric water line (GMWL) equation: δ2H = 8∙δ18O + 10 [11]. Friedman indicated that the evaporation of raindrops would cause the slope of the LMWL to be <8 [41]. Figure 4 shows the relationship between δ18O and δ2H in precipitation, defined as the local meteoric water line (LMWL). Several regression methods determine the LMWL [42,43], and different methods will lead to different slopes and intercepts [44]. To compare the MWL between Yuzhong county and Lanzhou city, the MWL in the study area was calculated using the ordinary least squares regression (OLSR) method. The LMWL equation in 2016 and 2017 was δ2H = 6.8 (±0.3)∙δ18O + 4.4 (±2.0) (R2 = 0.95, p < 0.001) and δ2H = 7.1 (±0.2)∙δ18O + 1.5 (±1.6) (R2 = 0.97, p < 0.001), respectively. The slope and intercept slightly differed between the two years, but both were lower than the GMWL, indicating a significant imbalance of isotopic dynamic fractionation during precipitation. When compared to the MWL equation of Yuzhong County (δ2H = 7.70∙δ18O + 9.41) and Lanzhou City (δ2H = 7.57∙δ18O + 4.54) from April 2011 to February 2013, which were defined by Chen et al. [45], the slope and intercept of the LMWL were lower in Yuzhong. The Yuzhong station is near the Xinglong Mountain forest, which has a high vegetation coverage and relative humidity, and therefore, the slope was very close to the GWML [45]. The Lanzhou station is located in an urban area (Northwest Normal University), and due to the heat island effect and moderate relative humidity [45], the slope was lower than at the Yuzhong site but higher than in our study area. Because our sampling sites were located in the northern arid mountain area of Yuzhong County, which has a cold semi-arid temperate climate, with low rainfall and strong evaporation, the rainwater was easily affected by secondary evaporation during precipitation.

4.2. Meteorological Effects on Precipitation Isotopes

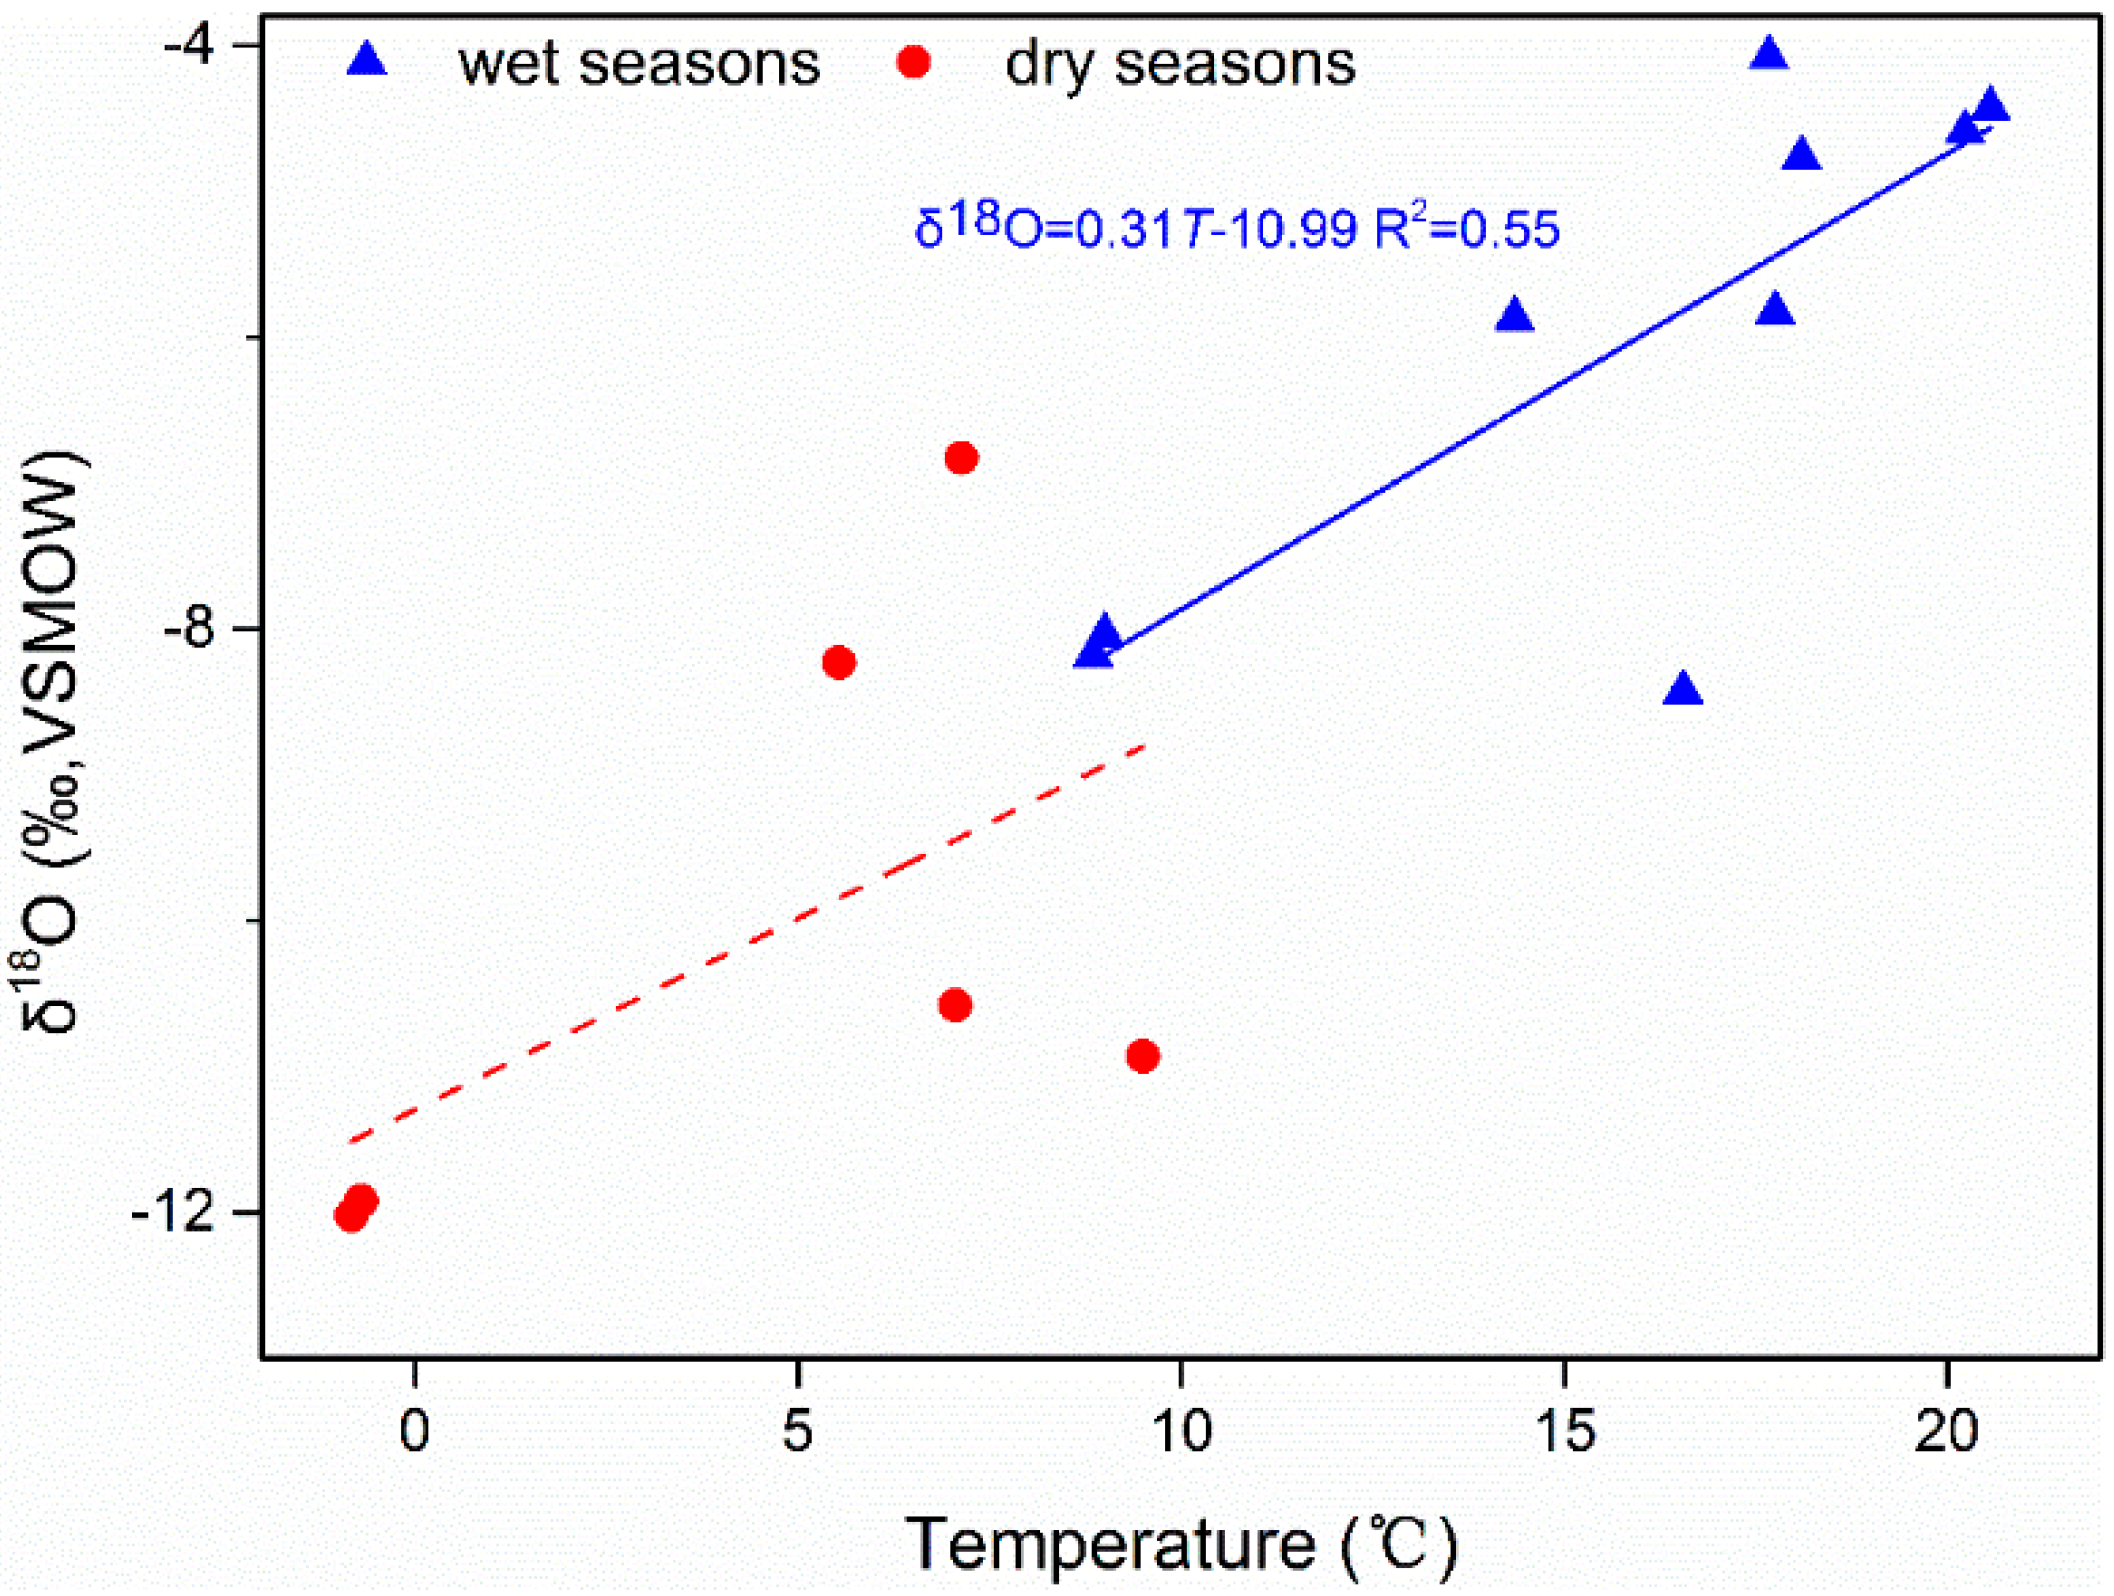
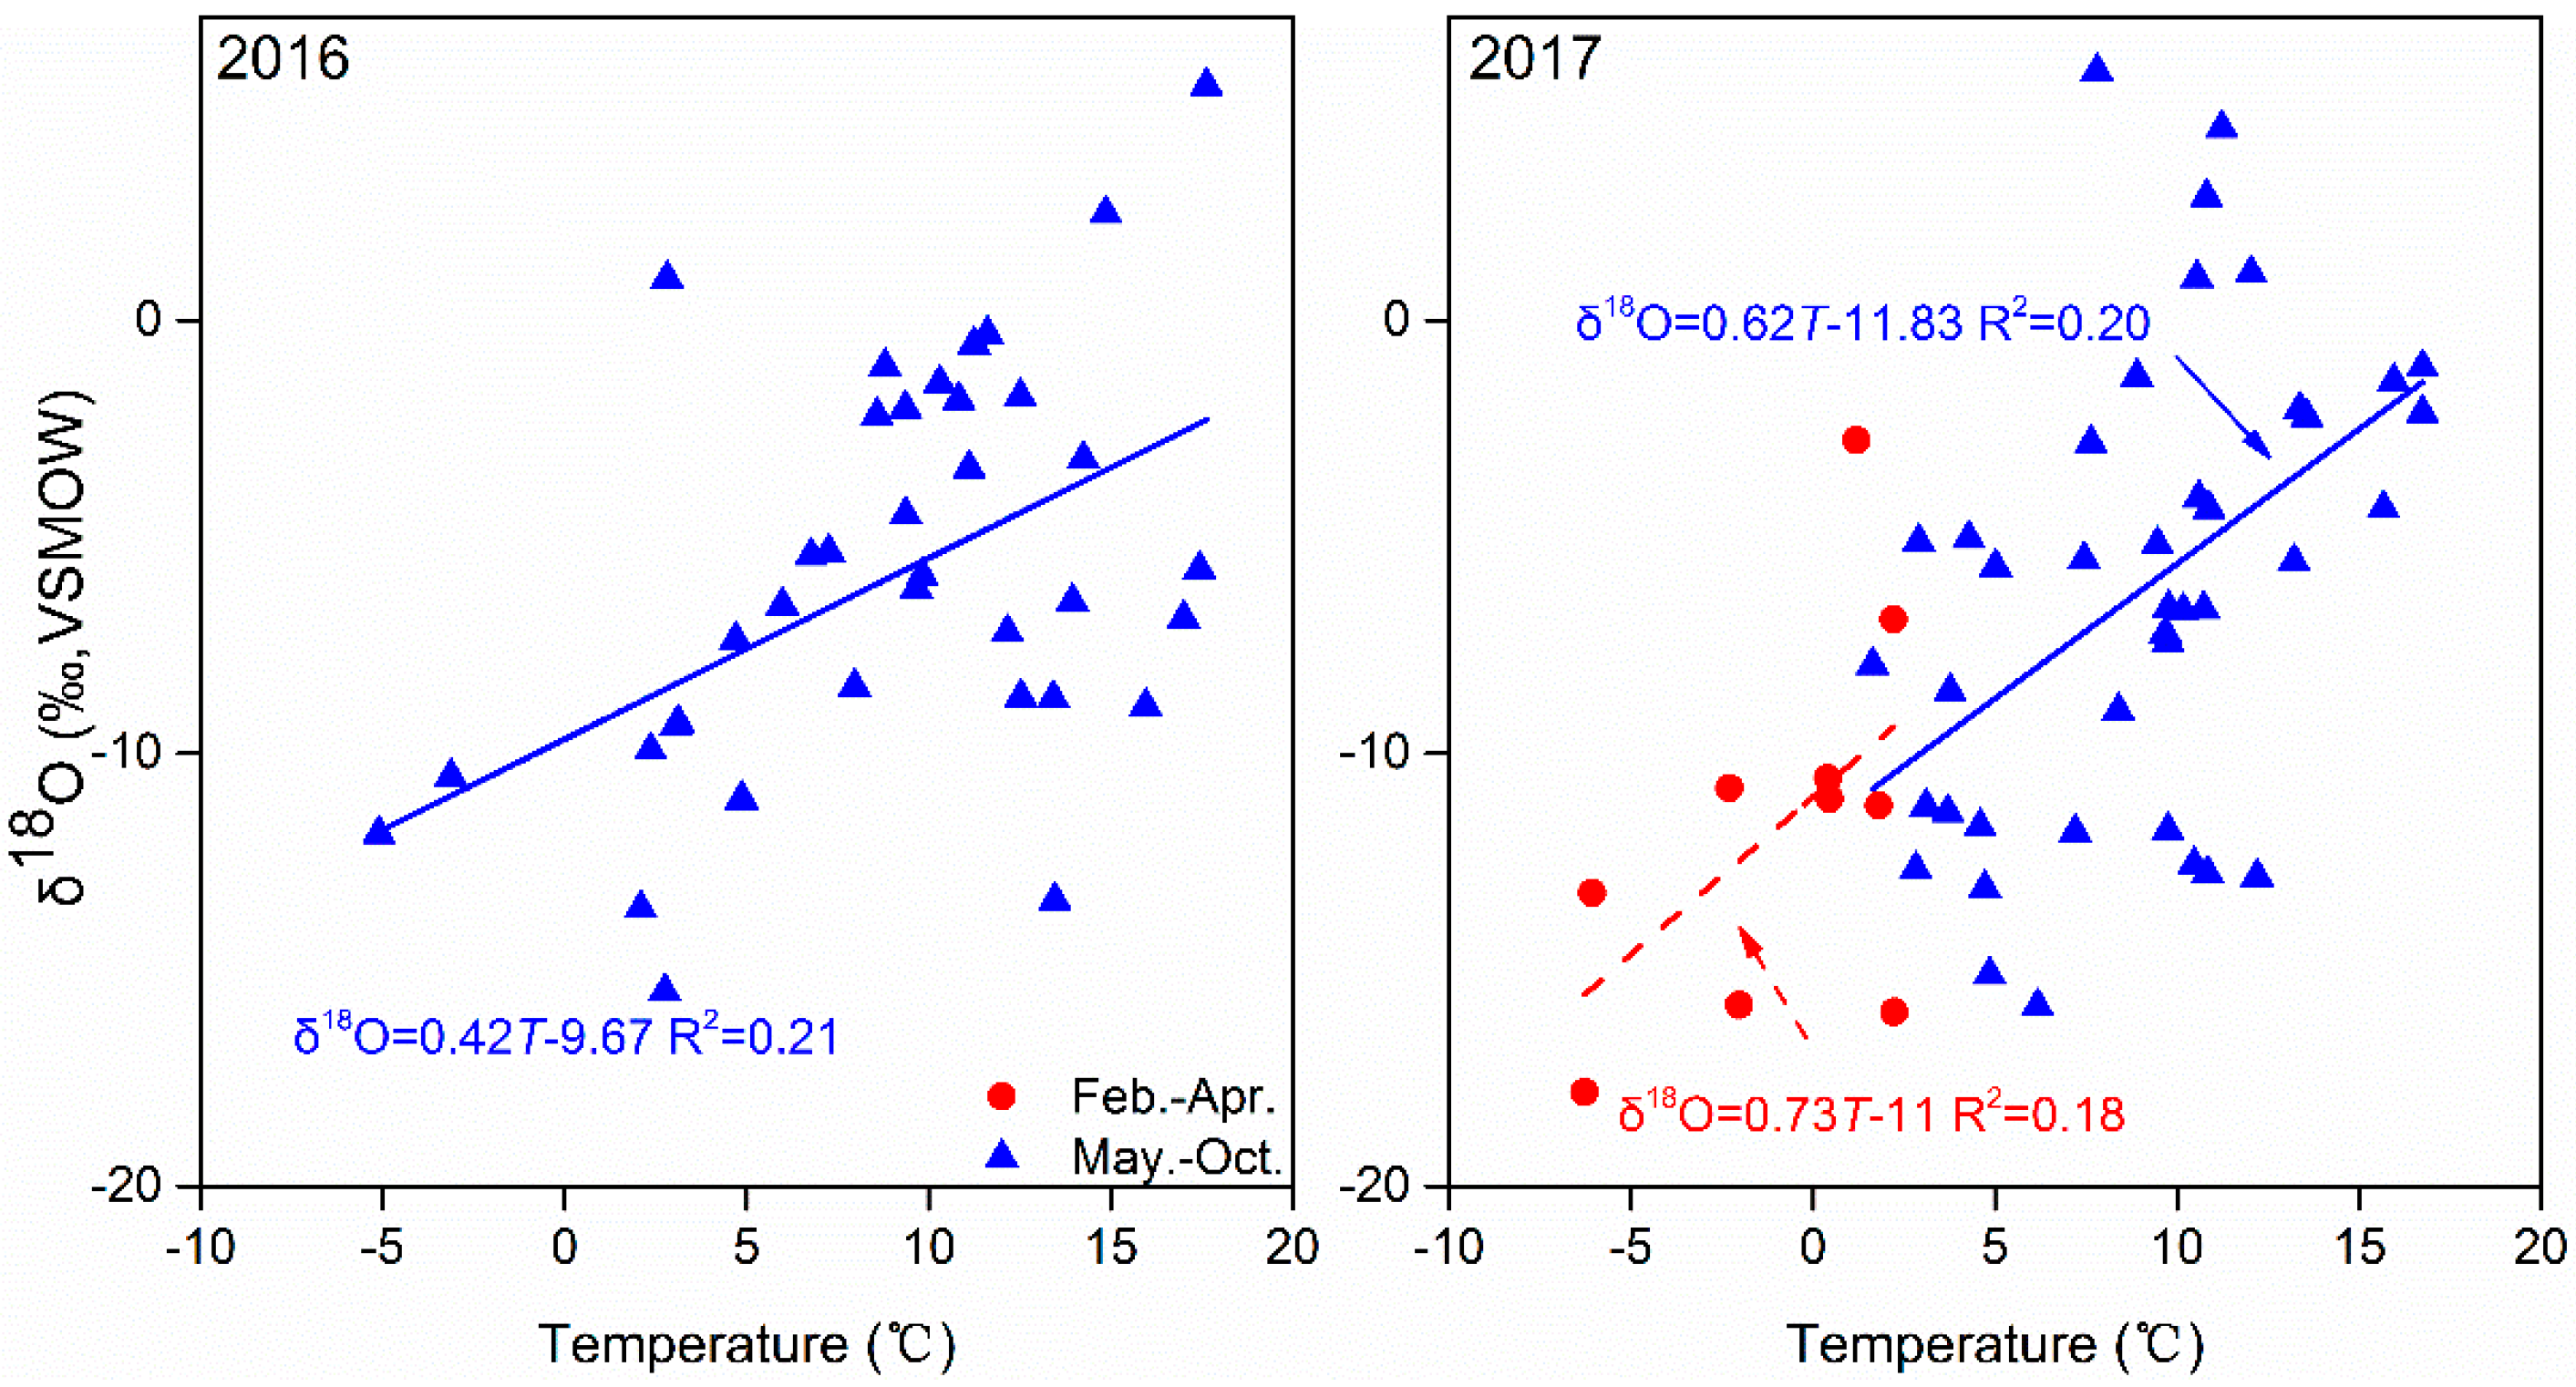
4.2.1. Temperature Effect

Generally, the δ2H and δ18O values in precipitation tend to have a positive linear correlation with the air temperature, also known as the “temperature effect.” The rise in atmospheric temperature causes 18O enrichment compared to 2H in precipitation due to sub-cloud evaporation. When water molecules gain external energy during evaporation, the hydrogen bonds between the relatively light isotopes of water molecules are preferentially broken. The temperature effect of precipitation isotopes in northwest China is widely accepted due to the many observations that have been reported [46,47,48]. The linear relationship is plotted in Figure 5 according to a regression analysis between the amount-weight δ18O values and the monthly average temperature based on the data of GNIP (1985–1987, 1996–1999) of Lanzhou station and our measured values. Their correlation between δ18O and temperature at seasonal and longer time scales is absent (p = 0.27) in dry seasons, while the correlation is significant in wet seasons.
Further study about the effect of temperature on the isotopic signature on daily scales (Figure 6) shows the linear relationship between δ18O values and the temperature for each precipitation period. The regression equations can be expressed as δ18O = 0.42T − 9.67 (R2 = 0.21; p < 0.01) and δ18O = 0.62T–11.83 (R2 = 0.20; p < 0.01) in rainy seasons of 2016 and 2017 (the date of April 26, 2016 was taken as the rainy season data since it is the only data in April, the same way in Section 4.2.2), respectively. The respective equation in dry seasons (δ18O = 0.73T−11) has very low significance level (R2 = 0.18; p = 0.12). Thus, the temperature effect is significant only in the wet seasons, which is probably connected with the different moisture sources in wet and dry seasons. Previous studies have also shown that different moisture sources also have specific effects on the temperature on a large scale [49].

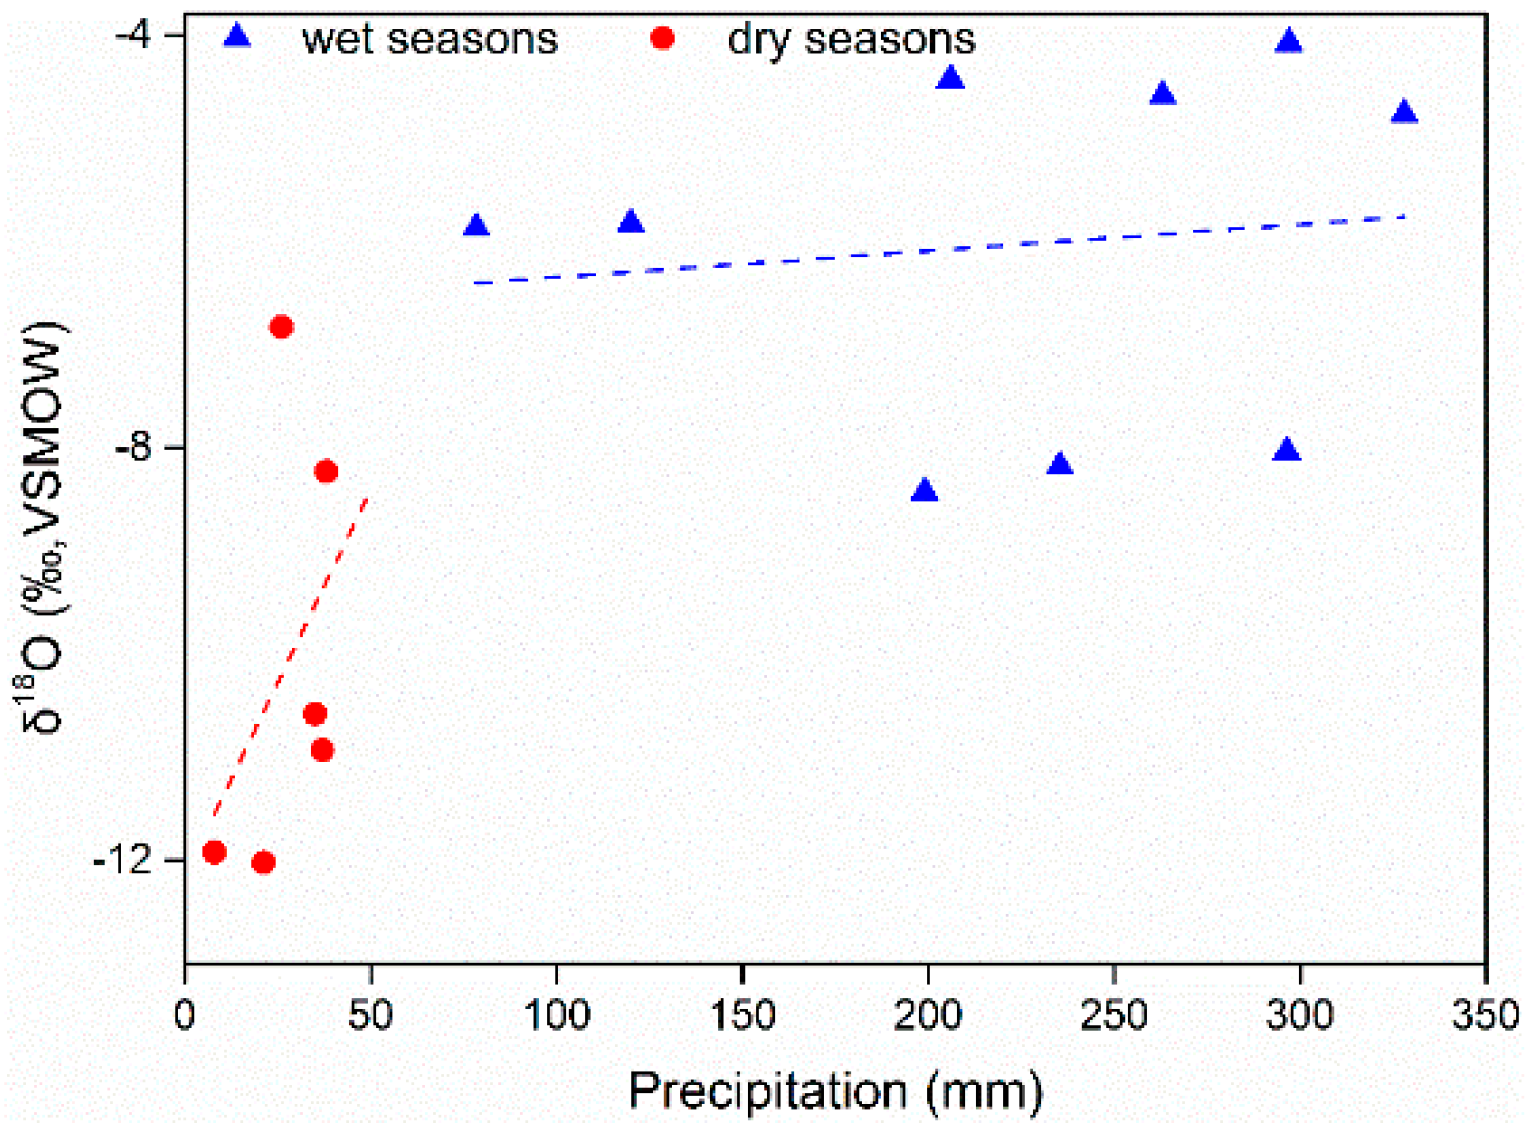
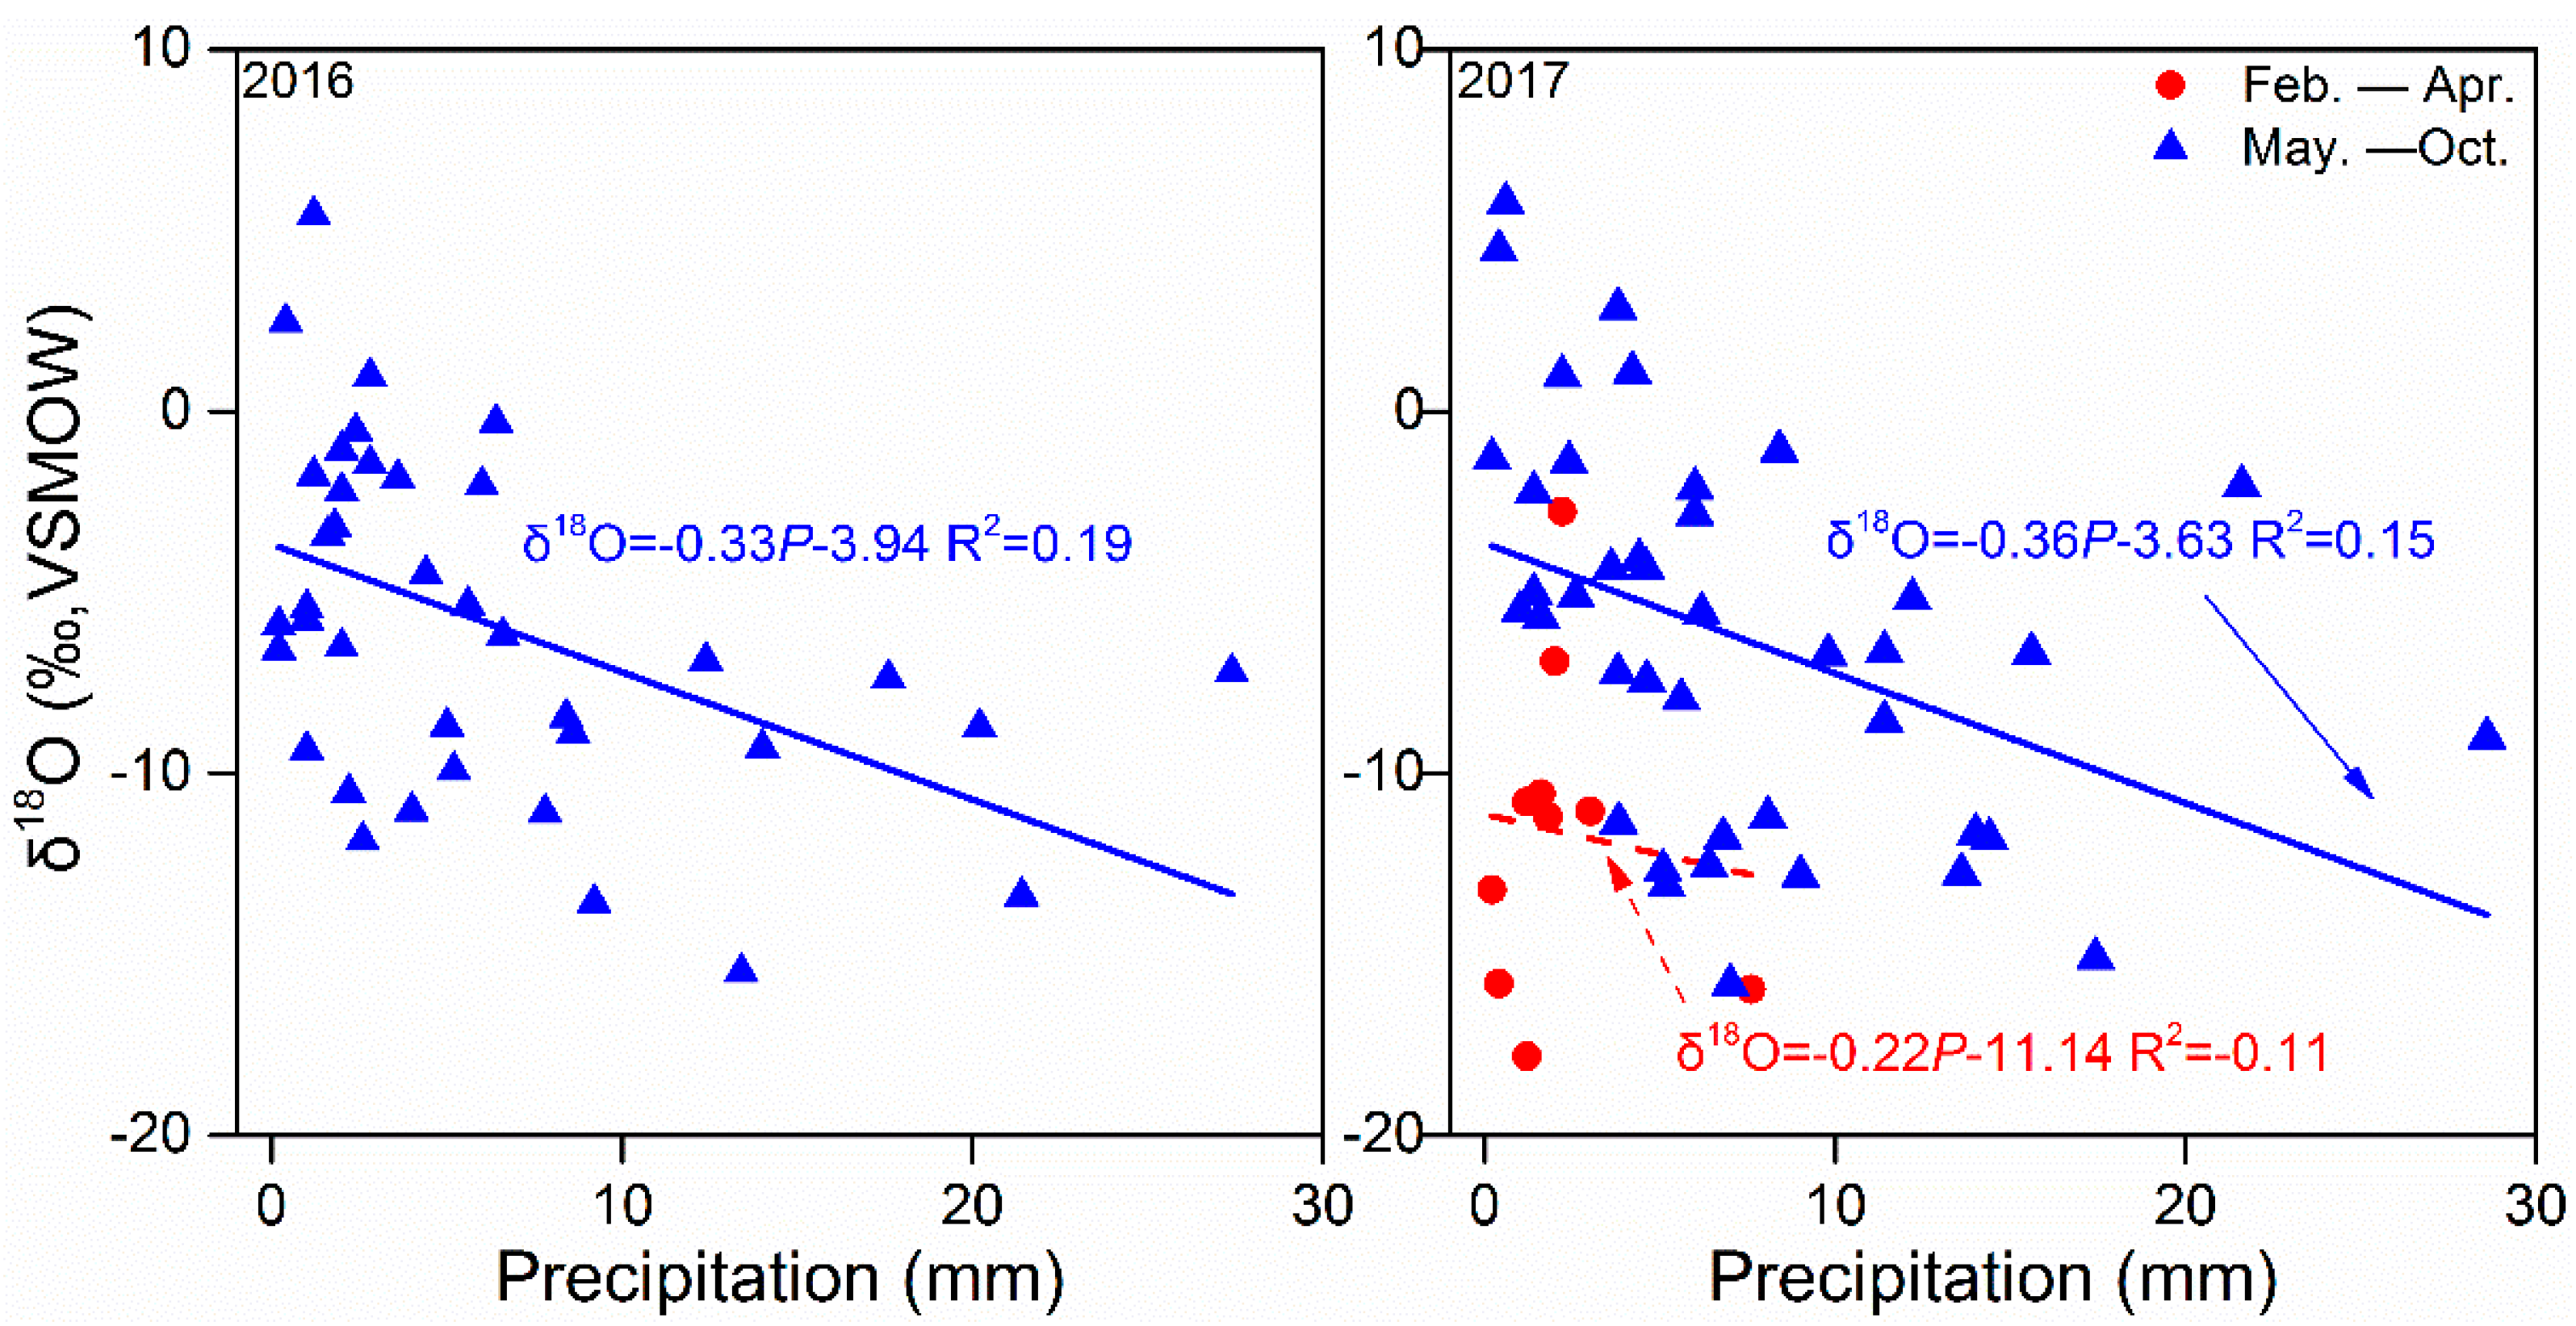
4.2.2. Amount Effect

Working with the IAEA Database of Isotopes in Precipitation [8], a negative correlation between the isotopic composition and amount of rain based on monthly means was first proposed, which is also known as the amount effect. The higher the precipitation is, the lower the δ2H and δ18O values are precipitation. This is explained by the fact that lower temperatures lead to more rainfall, while the fractionation during condensation at lower temperatures always results in higher isotopic fractionation in liquid water relative to the vapor it comes from. The precipitation amount is crucial for the hydrogen and oxygen isotope composition in the southeast and southwest monsoon regions but decreases from the coast to inland regions [50]. The precipitation effect is strong in subtropical regions where precipitation is dominated by deep convection [51]. Based on the data of GNIP(1985–1987, 1996–1999) [52] of Lanzhou station and our measured values, the relationship between seasonal amount-weighted mean δ18O values and amount was calculated (Figure 7). A significant correlation between δ18O and amount at seasonal and longer time scales is absent (p > 0.05), both in dry seasons and wet seasons. This indicates that the local precipitation amount is not the major factor controlling the δ18O variability at the monthly scale, and the amount effects are not useful to discriminate either wetter or drier rainy seasons or wetter or drier decades in the study site.
To better understand the relationship between precipitation and isotope composition, the correlation and regression analyses between the daily isotope data and precipitation amount were calculated (Figure 8). A relationship between δ18O values and precipitation amount is absent in the dry seasons (p = 0.77) but is significant (p < 0.01) in the rainy seasons (May–October) in 2016 and 2017. The precipitation amount is not uniformly distributed in the area: continuous precipitation events and greater amounts of precipitation usually occur during the rainy seasons (90%), while the precipitation in the dry seasons is usually very low (10%) (Figure 2). The smaller precipitation events are most likely exposed to evaporation so that the temperature effect may hide the amount of effects in some regions during the whole year. This result was consistent with Liu et al. (2008) [53], who also conducted studies in arid and cold semi-arid areas of northwest China. The precipitation effect is usually not significant in the inland areas of China. The δ18O values were characterized by a weak correlation with the precipitation amount over the whole year. However, this relationship was better visualized when only the values during the rainy season were considered. Additionally, it is also of great importance to future study the relationship between isotope and precipitation amount considering the annual precipitation in the study area shows an increasing tendency (285 mm in 2016, 350 mm in 2017, 461 mm in 2018, 401 mm in 2019).

4.2.3. Sub-Cloud Evaporation

When the air temperature is low, water vapor can condense into water droplets. Raindrops falling from the cloud base to the ground are affected by evaporation, which is known as below-cloud evaporation or sub-cloud evaporation [54]. The evaporation of raindrops falling below the cloud base is an important physical process, especially under the low relative humidity conditions below the cloud base. In arid and semi-arid regions, where the air is dry, and vegetation is sparse, falling raindrops are more susceptible to evaporation [5]. Precipitation falling to the surface is therefore characterized by a higher δ18O value and lower d-excess value [55]. Conversely, the secondary evaporation becomes weak with an increase in relative humidity and results in a negative correlation between relative humidity and δ18O values and a positive correlation between relative humidity and d-excess. Figure 9 shows the correlations between relative humidity and δ18O and d-excess in 2016 and 2017. The correlations between relative humidity and δ18O were δ18O = −0.21h + 11.1 (R2 = 0.42; p < 0.001), and with d-excess = 0.34h − 17.1 (R2 = 0.29; p < 0.001) in 2016 and δ18O = −0.24h + 12.6 (R2 = 0.31; p-value < 0.001), d-excess = 0.3h −16.9 (R2 = 0.21; p-value < 0.001) in 2017 respectively. Similarly to [45], there is a significant negative correlation between the δ18O values and relative humidity and a positive correlation between relative humidity and d-excess values in the two years. The relative humidity is an important factor controlling evaporation, and secondary evaporation below the cloud base can increase in low humidity conditions. The slope of the LMWL clearly shows that the study area experienced intensive secondary evaporation, which can provide a basis to study the relationship between the evaporation ratio of raindrops and the difference in deuterium excess from cloud base to ground.

4.3. Moisture Sources

4.3.1. Variation of d-Excess

As shown in Figure 3 and Table 3, the d-excess values varied from −13‰ to 24.6‰, with an amount-weighted mean value of 14.3‰ in 2016. In 2017, the d-excess values varied from −18.4‰ to 21.2‰, with an amount-weighted mean value of 8.6‰. In addition to such variables as elevation and sub-cloud evaporation of raindrops which are the major factors that control the d-excess in continental precipitation [21], the changes in water vapor sources and vapor transport also may affect d in non-unique ways [56]. There were seasonal differences and large fluctuations of the d-excess values, implying the influence of different moisture sources in different seasons, as will be discussed in detail in the following section.

4.3.2. Moisture Transport

Geographically, the experimental site is located in the cold semi-arid area of northwest China. Previous studies have shown that local water evaporation, westerly and polar air masses, the East Asian summer monsoon, and the Indian monsoon are the major potential sources for atmospheric moisture across northwestern China [1]. So the isotopic composition of precipitation will result in the continental effect, which is also referred to as the distance-from-coast effect, i.e., a progressive 18O depletion in precipitation with increasing distance from the ocean [55]. The lower amount-weighted mean δ18O value (−8.2‰) of the study site in comparison to δ18O of Zhangye (−6.0‰) in the Hexi Corridor [57] supports the continental effect. To track moisture sources, the Hybrid Single-Particle Lagrangian Integrated Trajectories (HYSPLIT) model (ver 4.9) of the Air Resources Laboratory of the National Oceanic and Atmospheric Administration [58] was used to calculate back trajectories based on the National Centers for Environmental Prediction / National Center for Atmospheric Research (NCEP/NCAR) global reanalysis data from January 2016 to December 2017 generated by the Global Data Assimilation System (GDAS). Each backward trajectory was calculated for 240 h (10 days) back in time, which is considered to be the average residence time of water vapor in the atmosphere [59]. The backtracking trajectories were calculated four times a day over four seasons (00:00, 06:00, 12:00, and 18:00 UTC), with the final level being 500 m above the ground. The corresponding trajectories were clustered to obtain a mean. Finally, the clustered result (Figure S1 in Supplementary Material) was inputted to ArcGIS 10.2 software for further processing to obtain the backward trajectory in the study area at different seasons [45].
In summary, there were two main pathways in the vapor source trajectory over the year, with most water vapor originating from marine sources in the west and northwest directions (Figure 10). One source was from the Atlantic Ocean via westerlies, and the other was from the Arctic region. In spring (Figure 10a), there were two main sources of water vapor to the study area; 46% was transported by westerlies (T1), while 54% originated from the north (T2). One of the air masses was advected eastward through Xinjiang and the Hexi Corridor, while the other was advected southward through Inner Mongolia to the study site. In summer, the d-excess value was the lowest over the whole year. The high relative humidity over the Atlantic Ocean carried by westerly air masses gives rise to a comparatively lower d-excess in the subsequent precipitation events [60]. In addition, in summer, the re-evaporation of raindrops below the cloud base in the study area also dropped the d-excess values to extremely low. The water vapor could be disentangled for three sources (Figure 10b). The first source accounted for 30% of the total and was derived from westerlies (T1), the second source accounted for 49% and originated from northerlies, while the origin of the final 21% was derived from southeasterlies. This situation was due to the influence of the monsoon. Generally, the Asian summer monsoon begins in May and retreats at the end of September or early October [61]. The sources of water vapor in summer are complex in this area. In addition to transport by westerlies and northerlies, water vapor is also affected by the southeast monsoon and local recirculation of water vapor. In autumn (Figure 10c), the area is affected by westerly (T1, T2) and northerly (T3) moisture sources. As before, an air mass (T3, 39%) is advected eastward through Xinjiang and the Hexi Corridor to the study area, but then another air mass (T1, 25%) from the west takes a different route, passing through Xinjiang and eastern Qinghai. The final air mass (T2, 36%) from the north is advected southward through Inner Mongolia and Ningxia to the destination. In winter (Figure 10d), the T1 (40%) and T2 (60%) air masses containing moisture originate from the west and northwest, respectively. The T1 air mass passed through Xinjiang and Qinghai to reach the study area, while the T2 air mass passed through Xinjiang and then moved from the northwest of Gansu. However, due to the spatial resolution of the meteorological data, this backward trajectory model could only simulate the air mass source on a large scale [62]. Further analysis is needed to determine the details of the air masses and the characteristics of the precipitation of the study area.

5. Conclusions

The δ2H and δ18O signatures of precipitation on the Loess Plateau were investigated during 2016–2017. The local meteoric water line (LMWL) in 2016 and 2017 were defined as δ2H = 6.8 (±0.3)∙δ18O + 4.4 (±2.0) and δ2H = 7.1 (±0.2)∙δ18O + 1.5 (±1.6), respectively. The LMWL slope was lower than the global meteoric water line (GMWL) due to the secondary evaporation during precipitation. Atmospheric temperature is the main environmental factor controlling the isotopic variation in rainy seasons both on daily and monthly scales. The precipitation amount is the dominant factor controlling isotope values of precipitation in rainy seasons on a daily scale, but it is not the major factor at the monthly scale, and the amount effects are not useful to discriminate either wetter or drier rainy seasons or wetter or drier decades in the study site. However, longer periods of precipitation data accumulation are required for detailed characterization of the water vapor cycle in rainfall processes, and also how does the precipitation converts into soil water for storage should be clarified in future studies. There were seasonal differences and large fluctuations of the d-excess values, indicating the influences of various moisture sources. The resulting air mass trajectories were consistent with that of the main sources of water vapor over the whole year from the Atlantic Ocean via westerlies and the Arctic region. There are 46%, 64%, and 40% vapor from the westerlies and 54%, 36%, and 60% vapor from the north in spring, autumn, and winter, respectively. In summer, however, the southeast monsoon was also a water vapor source (21%). Concluding, using δ2H and δ18O signatures of precipitation water, we disentangled and quantified the seasonal wind directions that are important for the prediction of water resources for local and regional land use on the Loess Plateau. These findings advance our understanding of the temporal variation of stable isotopes (δ2H and δ18O) in precipitation on the Loess Plateau and provide deep insights into climatic and environmental controls on precipitation in semi-arid regions.

Supplementary Materials

The following are available online at https://www.mdpi.com/article/10.3390/su13126938/s1, Table S1: Daily isotope and meteorological information, Table S2: Correlations of daily and monthly δ18O with local surface air temperature and precipitation amount in the dry seasons and wet seasons, Table S3: Correlations of δ2H with δ18O and δ18O, d-excess values with relative humidity in study site from 2016 to 2017, Figure S1: The cluster result of the model in the study site.

Author Contributions

Data curation, F.-Q.H., J.-Z.W., X.S., and Y.-H.Z.; investigation, F.-Q.H.; methodology, J.-Z.W.; project administration, F.-M.L.; resources, Q.-F.Y. and F.-M.L.; software, Y.-H.Z.; supervision, F.-M.L.; validation, Y.K. and F.-Q.H.; visualization, X.S. and Y.K.; writing—original draft, F.-Q.H. and F.-M.L.; writing—review and editing, F.-Q.H., Q.-F.Y., Y.K., and F.-M.L. All authors have read and agreed to the published version of the manuscript.

Funding

This work was supported by the National Natural Science Foundation of China (31470496) and the “111” Programme (BP0719040). Y.K. thanks for the support by the Russian Government Program of Competitive Growth of Kazan Federal University and “RUDN University Strategic Academic Leadership Program”.

Data Availability Statement

The original contributions generated for this study are included in the article/Supplementary Material, further inquiries can be directed to the corresponding author.

Conflicts of Interest

The authors declare no conflict of interest.

References

  1. Rao, W.; Zhang, W.; Yong, B.; Tan, H.; Wang, S. Identifying the source of atmospheric moisture over arid deserts using stable isotopes (2H and 18O) in precipitation. Hydrol. Process. 2018, 32, 436–449. [Google Scholar] [CrossRef]
  2. Rozanski, K.; Sonntag, C.; Munnich, K.O. Factors controlling stable isotope composition of European precipitation. Tellus A 1982, 34, 142–150. [Google Scholar] [CrossRef]
  3. Gat, J.R.; Matsui, E. Atmospheric water balance in the Amazon basin: An isotopic evapotranspiration model. J. Geophys. Res. Atmospheres 1991, 96, 79–88. [Google Scholar] [CrossRef]
  4. Field, R.D.; Jones, D.B.A.; Brown, D.P. Effects of postcondensation exchange on the isotopic composition of water in the atmosphere. J. Geophys. Res. 2010, 115, D24305. [Google Scholar] [CrossRef] [Green Version]
  5. Stewart, M.K. Stable isotope fractionation due to evaporation and isotopic exchange of falling waterdrops: Applications to atmospheric processes and evaporation of lakes. J. Geophys. Res. 1975, 80, 1133–1146. [Google Scholar] [CrossRef]
  6. Mook, W.G. Environmental isotopes in the hydrological cycle: Principles and applications, volume i: Introduction:Theory, methods, review. Tech. Doc. Hydrol. 2001, 87, 23–24. [Google Scholar]
  7. Stout, G.E. Isotope Techniques in the Hydrologic Cycle: Papers Presented at a Symposium at the University of Illinois, 10–12 November 1965; Geophysical Monograph; American Geophysical Union: Washington, DC, USA, 1967; Volume 11, p. 98. [Google Scholar]
  8. Dansgaard, W. Stable isotope in precipitation. Tellus 1964, 16, 436–468. [Google Scholar] [CrossRef]
  9. Aggarwal, P.K.; Alduchov, O.A.; Froehlich, K.O.; Araguas-Araguas, L.J.; Sturchio, N.C.; Kurita, N. Stable isotopes in global precipitation: A unified interpretation based on atmospheric moisture residence time. Geophys. Res. Lett. 2012, 39, 162–171. [Google Scholar] [CrossRef]
  10. Jia, W.; Xu, X.; Yuan, R.; Ma, X.; Li, Z. Variation characteristics of stable isotopes in precipitation and the environmental factors that influence them in the shiyang river basin of china. Environ. Earth Sci. 2019, 78, 306. [Google Scholar] [CrossRef]
  11. Craig, H. Isotopic variations in meteoric waters. Science 1961, 133, 1702–1703. [Google Scholar] [CrossRef]
  12. Kumar, U.S.; Kumar, B.; Rai, S.P.; Sharma, S. Stable isotope ratios in precipitation and their relationship with meteorological conditions in the kumaon himalayas, india. J. Hydrol. 2010, 391, 1–8. [Google Scholar] [CrossRef]
  13. Merlivat, L.; Jouzel, J. Global climatic interpretation of the deuterium-oxygen 18 relationship for precipitation. J. Geophys. Res. Ocean. 1979, 84, 5029–5033. [Google Scholar] [CrossRef]
  14. Benetti, M.; Reverdin, G.; Pierre, C.; Merlivat, L.; Risi, C.; Steenlarsen, H.C.; Vimeux, F. Deuterium excess in marine water vapor: Dependency on relative humidity and surface wind speed during evaporation. J. Geophys. Res. Atmos. 2014, 119, 584–593. [Google Scholar] [CrossRef]
  15. Gat, J.R.; Carmi, I. Evolution of the isotopic composition of atmospheric waters in the mediterranean sea area. J. Geophys. Res. 1970, 75, 3039–3048. [Google Scholar] [CrossRef]
  16. Bu, H.; Song, X.; Xia, J. The hydrogen and oxygen isotopic compositions of precipitation in a forested watershed of the south qinling mts., china. Environ. Sci. Pollut. Res. 2018, 25, 6720–6728. [Google Scholar] [CrossRef]
  17. Chen, F.; Zhang, M.; Argiriou, A.A.; Wang, S.; Liu, X. Deuterium excess in precipitation reveals water vapor source in the monsoon margin sites in northwest china. Water 2020, 12, 3315. [Google Scholar] [CrossRef]
  18. Friedman, I.; Redfield, A.C.; Schoen, B.; Harris, J. The variation of the deuterium content of natural waters in the hydrologic cycle. Rev. Geophys. 1964, 2, 177–224. [Google Scholar] [CrossRef]
  19. Price, R.M.; Swart, P.K.; Willoughby, H.E. Seasonal and spatial variation in the stable isotopic composition (δ18O and δD) of precipitation in south Florida. J. Hydrol. 2008, 358, 193–205. [Google Scholar] [CrossRef] [Green Version]
  20. Ren, W.; Yao, T.; Yang, X.; Joswiak, D.R. Implications of variations in δ18O and δD in precipitation at madoi in the eastern tibetan plateau. Quat. Int. 2013, 313–314, 56–61. [Google Scholar] [CrossRef]
  21. Krklec, K.; Domínguez-Villar, D.; Lojen, S. The impact of moisture sources on the oxygen isotope composition of precipitation at a continental site in central europe. J. Hydrol. 2018, 561, 810–821. [Google Scholar] [CrossRef]
  22. Liu, Z.; Wen, X.; Brady, E.C.; Otto-Bliesner, B.; Yu, G.; Lu, H.; Cheng, H.; Wang, Y.; Zheng, W.; Ding, Y. Chinese cave records and the east asia summer monsoon. Quat. Sci. Rev. 2014, 83, 115–128. [Google Scholar] [CrossRef]
  23. Legrande, A.N.; Schmidt, G.A. Sources of holocene variability of oxygen isotopes in paleoclimate archives. Clim. Past Discuss. 2009, 5, 1133–1162. [Google Scholar]
  24. Pausata, F.S.R.; Battisti, D.S.; Nisancioglu, K.H.; Bitz, C.M. Chinese stalagmite δ18O controlled by changes in the indian monsoon during a simulated heinrich event. Nat. Geosci. 2011, 4, 474–480. [Google Scholar] [CrossRef]
  25. England, N.; James, A.L.; Chutko, K.J.; Pyrce, R.S.; Yao, H. Hydrologic and water isotope characterization of a regulated canadian shield river basin. Hydrol. Process. 2019, 33, 905–919. [Google Scholar] [CrossRef]
  26. Jonsson, C.E.; Leng, M.J.; Rosqvist, G.C.; Seibert, J.; Arrowsmith, C. Stable oxygen and hydrogen isotopes in sub-arctic lake waters from northern sweden. J. Hydrol. 2009, 376, 143–151. [Google Scholar] [CrossRef]
  27. Yeh, H.F.; Lee, C.H.; Hsu, K.C. Oxygen and hydrogen isotopes for the characteristics of groundwater recharge: A case study from the chih-pen creek basin, taiwan. Environ. Earth Sci. 2011, 62, 393–402. [Google Scholar] [CrossRef]
  28. Cruz, F.W.; Burns, S.J.; Karmann, I.; Sharp, W.D.; Vuille, M.; Cardoso, A.O.; Ferrari, J.A.; Dias, P.L.S.; Viana, O. Insolation-driven changes in atmospheric circulation over the past 116,000 years in subtropical brazil. Nature 2005, 434, 63–66. [Google Scholar] [CrossRef]
  29. Partin, J.W.; Jenson, J.W.; Banner, J.L.; Quinn, T.M.; Taylor, F.W.; Sinclair, D.; Hardt, B.; Lander, M.A.; Bell, T.; Miklavič, B.; et al. Relationship between modern rainfall variability, cave dripwater, and stalagmite geochemistry in guam, USA. Geochem. Geophys. Geosyst. 2013, 13, 92–101. [Google Scholar] [CrossRef] [Green Version]
  30. Eastoe, C.J.; Dettman, D.L. Isotope amount effects in hydrologic and climate reconstructions of monsoon climates: Implications of some long-term data sets for precipitation. Chem. Geol. 2016, 430, 78–89. [Google Scholar] [CrossRef]
  31. Kurita, N.; Ichiyanagi, K.; Matsumoto, J.; Yamanaka, M.D.; Ohata, T. The relationship between the isotopic content of precipitation and the precipitation amount in tropical regions. J. Geochem. Explor. 2009, 102, 113–122. [Google Scholar] [CrossRef]
  32. Fleitmann, D.; Burns, S.J.; Mudelsee, M.; Neff, U.; Kramers, J.; Mangini, A.; Matter, A. Holocene forcing of the indian monsoon recorded in a stalagmite from southern oman. Science 2003, 300, 1737–1739. [Google Scholar] [CrossRef] [Green Version]
  33. Paulsen, D.E.; Li, H.C.; Ku, T.L. Climate variability in central china over the last 1270 years revealed by high-resolution stalagmite records. Quat. Sci. Rev. 2003, 22, 691–701. [Google Scholar] [CrossRef] [Green Version]
  34. Yuan, D.; Cheng, H.; Edwards, R.L.; Kelly, M.J.; Zhang, M.; Qing, L.; Lin, Y.; Wang, Y.; Wu, J.; Dorale, J.A.; et al. Timing, duration, and transitions of the last interglacialasian monsoon. Science 2004, 304, 575–578. [Google Scholar] [CrossRef] [Green Version]
  35. Sun, J. Provenance of loess material and formation of loess deposits on the Chinese Loess Plateau. Earth Planet. Sci. Lett. 2002, 203, 845–859. [Google Scholar] [CrossRef]
  36. Sun, J. Source Regions and Formation of the Loess Sediments on the High Mountain Regions of Northwestern China. Quat. Res. 2002, 58, 341–351. [Google Scholar] [CrossRef]
  37. Li, Y.; Shi, W.; Aydin, A.; Beroya-Eitner, M.A.; Gao, G. Loess genesis and worldwide distribution. Earth Sci. Rev. 2020, 201, 102947. [Google Scholar] [CrossRef]
  38. Feng, Y.J.; Nie, J.H.; Hong, Z. Soil water retention capability and the influence factors. J. Shandong Agric. Univ. 1996, 27, 298–302. (In Chinese) [Google Scholar]
  39. Krklec, K.; Domínguez-Villar, D. Quantification of the impact of moisture source regions on the oxygen isotope composition of precipitation over eagle cave, central spain. Geochim. Cosmochim. Acta 2014, 134, 39–54. [Google Scholar] [CrossRef]
  40. Gat, J.R. Oxygen and hydrogen isotopes in the hydrologic cycle. Annu. Rev. Earth Planet Sci. 1996, 24, 225–262. [Google Scholar] [CrossRef] [Green Version]
  41. Friedman, I.; Machta, L.; Soller, R. Water-vapor exchange between a water droplet and its environment. J. Geophys. Res. 1962, 67, 2761–2766. [Google Scholar] [CrossRef]
  42. Hughes, C.E.; Crawford, J. A new precipitation weighted method for determining the meteoric water line for hydrological applications demonstrated using australian and global gnip data. J. Hydrol. 2012, 464-465, 344–351. [Google Scholar] [CrossRef]
  43. Crawford, J.; Hughes, C.E.; Lykoudis, S. Alternative least squares methods for determining the meteoric water line, demonstrated using gnip data. J. Hydrol. 2014, 519, 2331–2340. [Google Scholar] [CrossRef]
  44. Boschetti, T.; Cifuentes, J.; Iacumin, P.; Selmo, E. Local meteoric water line of northern chile (18 °s–30 °s): An application of error-in-variables regression to the oxygen and hydrogen stable isotope ratio of precipitation. Water 2019, 11, 791. [Google Scholar] [CrossRef] [Green Version]
  45. Chen, F.L.; Zhang, M.J.; Ma, Q.; Wang, S.J.; Li, X.F.; Zhu, X.F. Stable isotopic characteristics of precipitation in lanzhou city and its surrounding areas, northwest china. Environ. Earth Sci. 2015, 73, 4671–4680. [Google Scholar] [CrossRef]
  46. Gao, Z. Discusston on feature of isotope component from atmospheric water, ground water and under ground water in northwest area china. Acta Geol. Gansu 1993, 2, 94–101. [Google Scholar]
  47. Liu, J.R.; Song, X.F.; Yuan, G.F.; Sun, X.M.; Liu, X.; Wang, S.Q. Characteristics of δ18O in precipitation over eastern monsoon china and the water vapor sources. Chin. Sci. Bull. 2010, 55, 200–211. [Google Scholar] [CrossRef]
  48. Huang, J.Z.; Tan, H.B.; Wang, R.A.; Wen, X.W. Hydrogen and oxygen isotopic analysis of perennial meteoric water in northwest china. J. China Hydrol. 2015, 35, 33–40. [Google Scholar]
  49. Zhang, X.; Nakawo, M.; Yao, T.; Han, J.; Xie, Z. Variations of stable isotopic compositions in precipitation on the tibetan plateau and its adjacent regions. Sci. China 2002, 45, 481–493. [Google Scholar] [CrossRef]
  50. Araguás-Araguás, L.; Froehlich, K.; Rozanski, K. Stable isotope composition of precipitation over southeast asia. J. Geophys. Res. Atmos. 1998, 103, 28721–28742. [Google Scholar] [CrossRef]
  51. Posmentier, E.S.; Feng, X.; Zhao, M. Seasonal variations of precipitation δ18O in eastern asia. J. Geophys. Res. Atmos. 2004, 109, D23. [Google Scholar] [CrossRef]
  52. IAEA/WMO. Global Network of Isotopes in Precipitation. The Gnip Database. Available online: http://www.na-web.iaea.org/napc/ih/IHS_resources_gnip.html (accessed on 30 January 2021).
  53. Liu, J.; Song, X.; Yuan, G.; Sun, X.; Wang, S. Characteristics of δ18O in precipitation over nothwest china and its water vapor sources. Acta Geogr. Sin. 2008, 63, 12–22. [Google Scholar]
  54. Liu, J.Y.; Zhang, F.P.; Feng, Q.; Li, Z.X.; Li, L. Influence of below-cloud secondary evaporation on stable isotope composition in precipitation in northwest china. Chin. J. Appl. Ecol. 2018, 29, 1479–1488. [Google Scholar]
  55. Mook, W.G. Environmental Isotopes in the Hydrological Cycle: Principles and Applications. In Technical Documents in Hydrology; International Atomic Energy Agency: Vienna, Austria; UNECO: Paris, France, 2001; Volume 87, pp. 167–235. [Google Scholar]
  56. Bershaw, J. Controls on deuterium excess across asia. Geosciences 2018, 8, 257. [Google Scholar] [CrossRef] [Green Version]
  57. Li, J.; Shi, P.; Zhu, G.; He, Y.; Yang, L. Characteristics of δ18o in precipitation and moisture transports in the central hexi corridor. Acta Entiae Circumstantiae 2015, 35, 947–955. [Google Scholar]
  58. Draxler, R.R. Hysplit (Hybrid Single-Particle Lagrangian Integrated Trajectory) Model Access via NOAAARL READY Website. 2003. Available online: http://www.arl.noaa.gov/ready/hysplit4.html (accessed on 1 January 2021).
  59. Numaguti, A. Origin and recycling processes of precipitating water over the eurasian continent: Experiments using an atmospheric general circulation model. J. Geophys. Res. Atmos. 1999, 104, 1957–1972. [Google Scholar] [CrossRef]
  60. Feng, F.; Li, Z.; Zhang, M.; Jin, S.; Dong, Z. Deuterium and oxygen 18 in precipitation and atmospheric moisture in the upper urumqi river basin, eastern tianshan mountains. Environ. Earth Sci. 2013, 68, 1199–1209. [Google Scholar] [CrossRef]
  61. Wang, B.; Lin, H. Rainy season of the asian-pacific summer monsoon. J. Clim. 2002, 15, 386–398. [Google Scholar] [CrossRef] [Green Version]
  62. Xie, L.; Wei, G.; Deng, W.; Zhao, X. Daily δ18O and δD of precipitations from 2007 to 2009 in Guangzhou, south china: Implications for changes of moisture sources. J. Hydrol. 2011, 400, 477–489. [Google Scholar] [CrossRef]
Figure 1. The location of the study area in the northwest part of the Loess Plateau, with a cold semi-arid climate.
Sustainability 13 06938 g001
Figure 2. The monthly precipitation and the average temperature in 2016 and 2017 of Yuzhong County. MAT means Mean Annual Temperature (°C), and MAP means Mean Annual Precipitation (mm).
Sustainability 13 06938 g002
Figure 3. Seasonal variations of δ18O, δ2H, and d-excess (= δ2H − 8∙δ18O) in the precipitation in the Yuzhong County. Colors represent the dry and wet seasons. The black dashed lines reflect the Y = 0.
Sustainability 13 06938 g003
Figure 4. The local meteoric water line (LMWL) of 2016 and 2017 in Yuzhong County. The global meteoric water line (GMWL) equations were defined by Craig (1961). The MWL equations of Yuzhong and Lanzhou were defined by Chen (2015). The symbols represent the precipitation in two years. The blue dotted horizontal and vertical 0 lines reflect the δ18O and δ2H of the standards (X = 0; Y = 0). *** represent correlations significant at p < 0.001. The results from the p-tests are shown in Table S3 (in Supplementary Materials).
Sustainability 13 06938 g004
Figure 5. Amount-weighted means δ18O for wet seasons (May–October) and dry seasons (November–April) vs. monthly average temperature. The data are from the Wiser-GNIP dataset of IAEA. The blue line is the linear relationship between the δ18O values and temperature in wet seasons, while the red line is the linear relationship between δ18O values and temperature in dry seasons. The continuous regression line is significant at p < 0.05; the dashed line has p > 0.05. The results from the p-tests are shown in Table S2 (in Supplementary Materials).
Sustainability 13 06938 g005
Figure 6. Correlations between δ18O and temperature for all individual samples in 2016 and 2017. The blue line is the linear relationship between the δ18O values and temperature from May to October in 2016 and 2017, while the red dashed line in the right-hand is the linear relationship between δ18O values and temperature from February 2017 to April 2017. The continuous regression lines are significant at p < 0.01; the dashed line has p > 0.05. The results from the p-tests are shown in Table S2 (in Supplementary Materials).
Sustainability 13 06938 g006
Figure 7. Amount-weighted means δ18O for wet seasons (May–October) and dry seasons (November–April) vs. precipitation amounts. The data are from the Wiser-GNIP dataset of IAEA. The blue dashed line is the linear relationship between the δ18O values and precipitation amount in wet seasons, while the red dashed line is the linear relationship between δ18O values and precipitation amount in dry seasons. The dashed lines have p > 0.05. The results from the p-tests are shown in Table S2 (in Supplementary Materials).
Sustainability 13 06938 g007
Figure 8. Correlations between δ18O and precipitation amount for all individual samples in 2016 and 2017. The blue continuous lines are the linear relationships between the δ18O values and precipitation amount from May to October in 2016 and 2017, while the red dashed line in the right-hand is the linear relationship between δ18O values and precipitation amount from February 2017 to April 2017. The continuous regression lines are significant at p < 0.01; the dashed line has p > 0.05. The results from the p-tests are shown in Table S2 (in Supplementary Materials).
Sustainability 13 06938 g008
Figure 9. Correlations between relative humidity and δ18O and d-excess for all individual samples in 2016 and 2017. All regression lines are significant at p < 0.001. The results from the p-tests are shown in Table S3 (in Supplementary Materials).
Sustainability 13 06938 g009
Figure 10. Backward trajectories cluster of moisture in the study area. (a), Spring (March, April, and May); (b), summer (June, July, and August); (c), autumn (September, October, and November); (d), winter (December, January, and February). T1, T2, and T3 represent the directions of vapor sources.
Sustainability 13 06938 g010
Table 1. Basic statistics of the isotopic composition of precipitation in the study area.
Yearδ18O (‰)δ2H (‰)
nMinMaxAmount-Weighted MeanSDnMinMaxAmount-Weighted MeanSD
2016.4–1238−15.55.4−8.24.738−108.435−5133
2017.1–1251−17.85.8−8.35.651−124.638.6−5840
Table 2. The seasonal amount-weighted average values of isotopic compositions in 2016 and 2017.
Yearδ18O (‰)δ2H (‰)
SpringSummerAutumnWinterSpringSummerAutumnWinter
2016.4–12−9.7−7.2−9.2 −58.6−47.3−53.8
2017.1–12−9.2−7.4−10.1−14.2−64.1−51.8−69.1−98.3
Table 3. The minimum, maximum, and seasonal amount-weighted average values of d-excess in 2016 and 2017.
DateMin (‰)Max (‰)Mean (‰)
AnnualSpringSummerAutumnWinter
2016−1324.614.31910.619.4
2017−18.421.28.69.77.311.415.5
2016–2017 14.28.615.015.5
Publisher’s Note: MDPI stays neutral with regard to jurisdictional claims in published maps and institutional affiliations.

