
An Integrated Decision Support Model Based on BWM and Fuzzy-VIKOR Techniques for Contractor Selection in Construction Projects

 ,
,  ,
,  ,
,  and
and 
Abstract
1. Introduction
2. Literature Review
2.1. Best-Worst Method
2.2. VIKOR Method
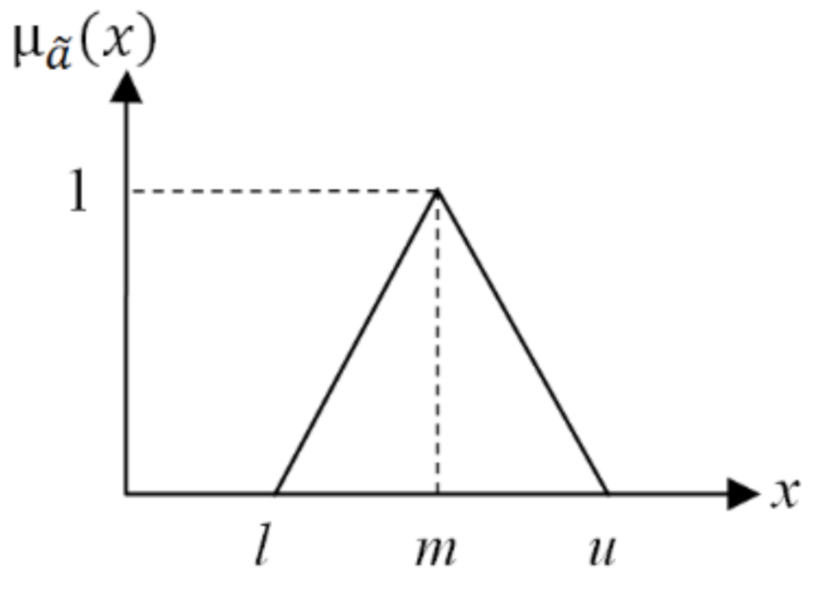
2.3. Fuzzy Set Theory
- Lack of sufficient information about competencies of contractors so that experts are obliged in some cases to surmise about them.
- Ambiguousness of the decision-maker about his understanding of the selection process.
- Complexity, lack of clarity, or incompleteness in project’s specifications which makes it hard for experts to decide on the sufficiency of contractors’ skills and capabilities for construction of the project.
- Uncertainty in the project’s information: the complete information is utilized by experts or decision-makers whereas incomplete information has yet to be processed.
- Indeterminate conditions of companies: strengths and weaknesses of companies, alongside with the lack of credible information about their abilities, makes it hard for the decision-makers to state their views quantitatively with respect to project criteria.
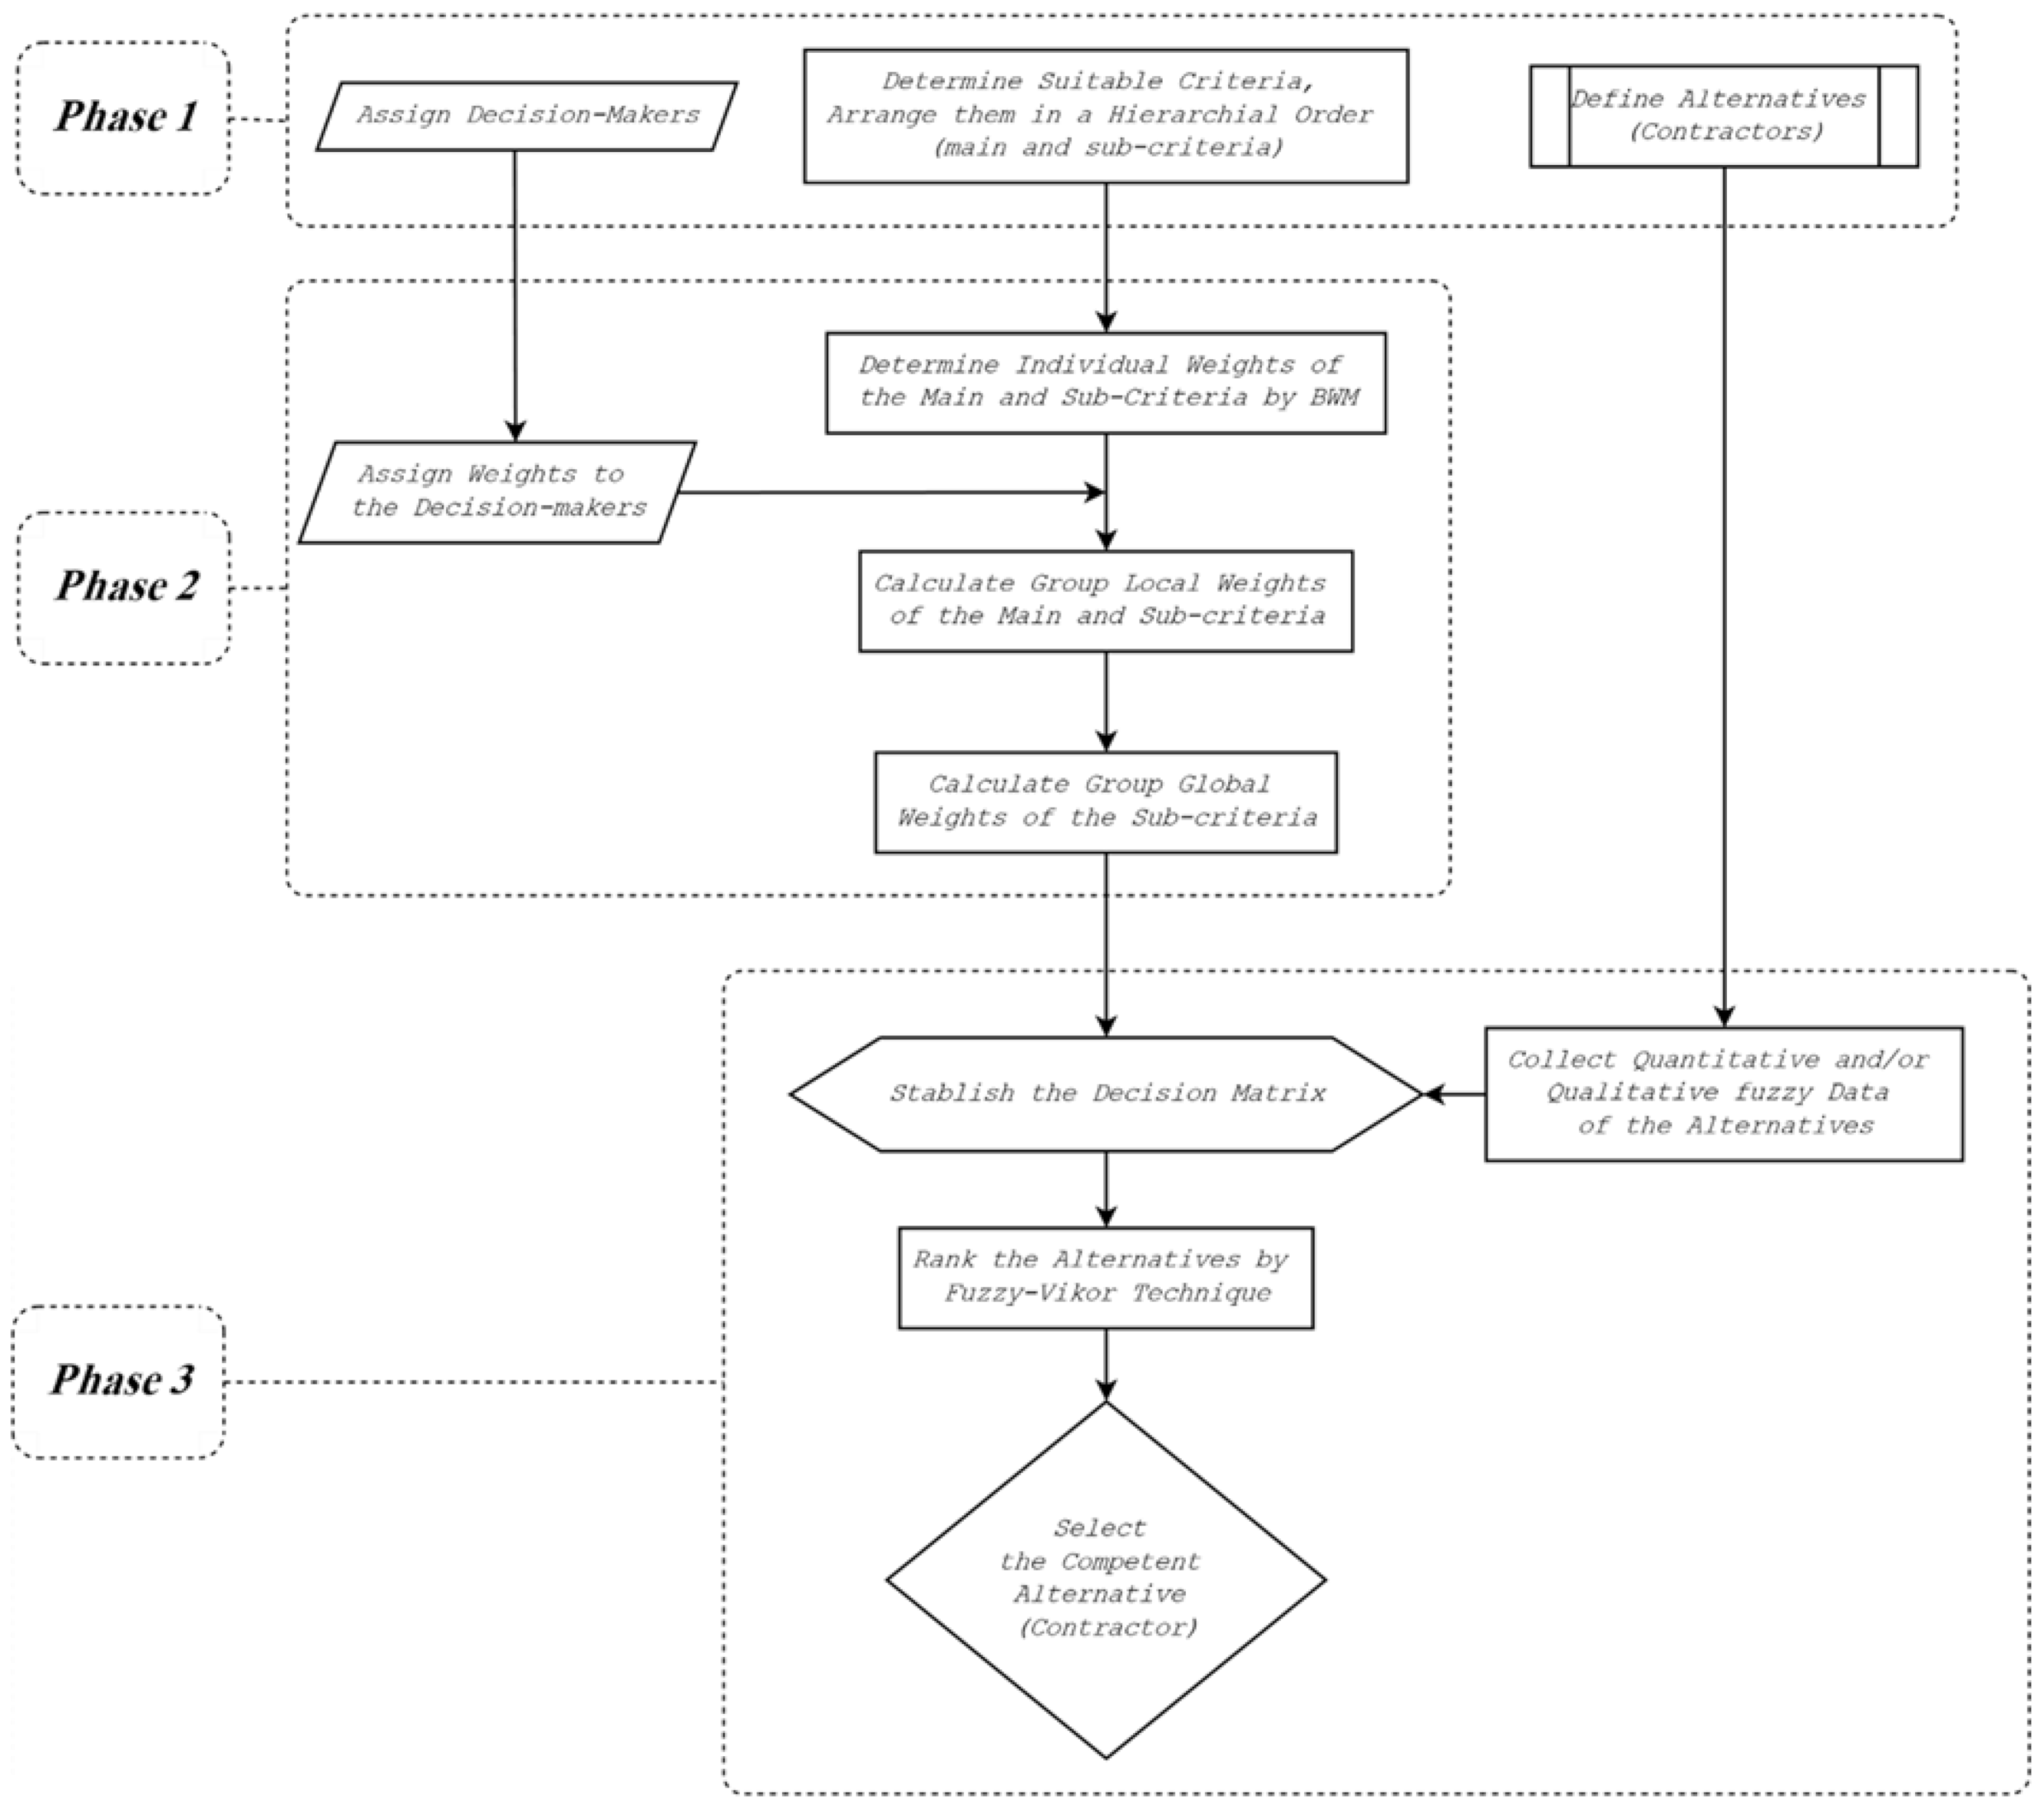
3. Methodology
- Phase 1
- Introduction of the problem: in this phase, alternatives and the criteria for contractor assessment are determined.
- Phase 2
- Weighting: in this phase, the weight or influence of the members of the decision-making group and the weights of assessment criteria are determined.
- Phase 3
- Ranking: in this phase, the performances of alternatives with respect to each criterion are determined and then, final ranks of alternatives are specified.
3.1. Best-Worst Method (BWM)
Number of Decision-Makers
3.2. Fuzzy-VIKOR Method
- Alternative A′ and A″ if only Condition 2 is not satisfied.
- Alternatives A′, A″, …, A(H), if Condition 1 is not satisfied, where A(H) is the last alternative with which Condition 1 is not satisfied i.e., Q(A(H)) − Q(A′) < DQ for maximum H.
4. Illustrative Example
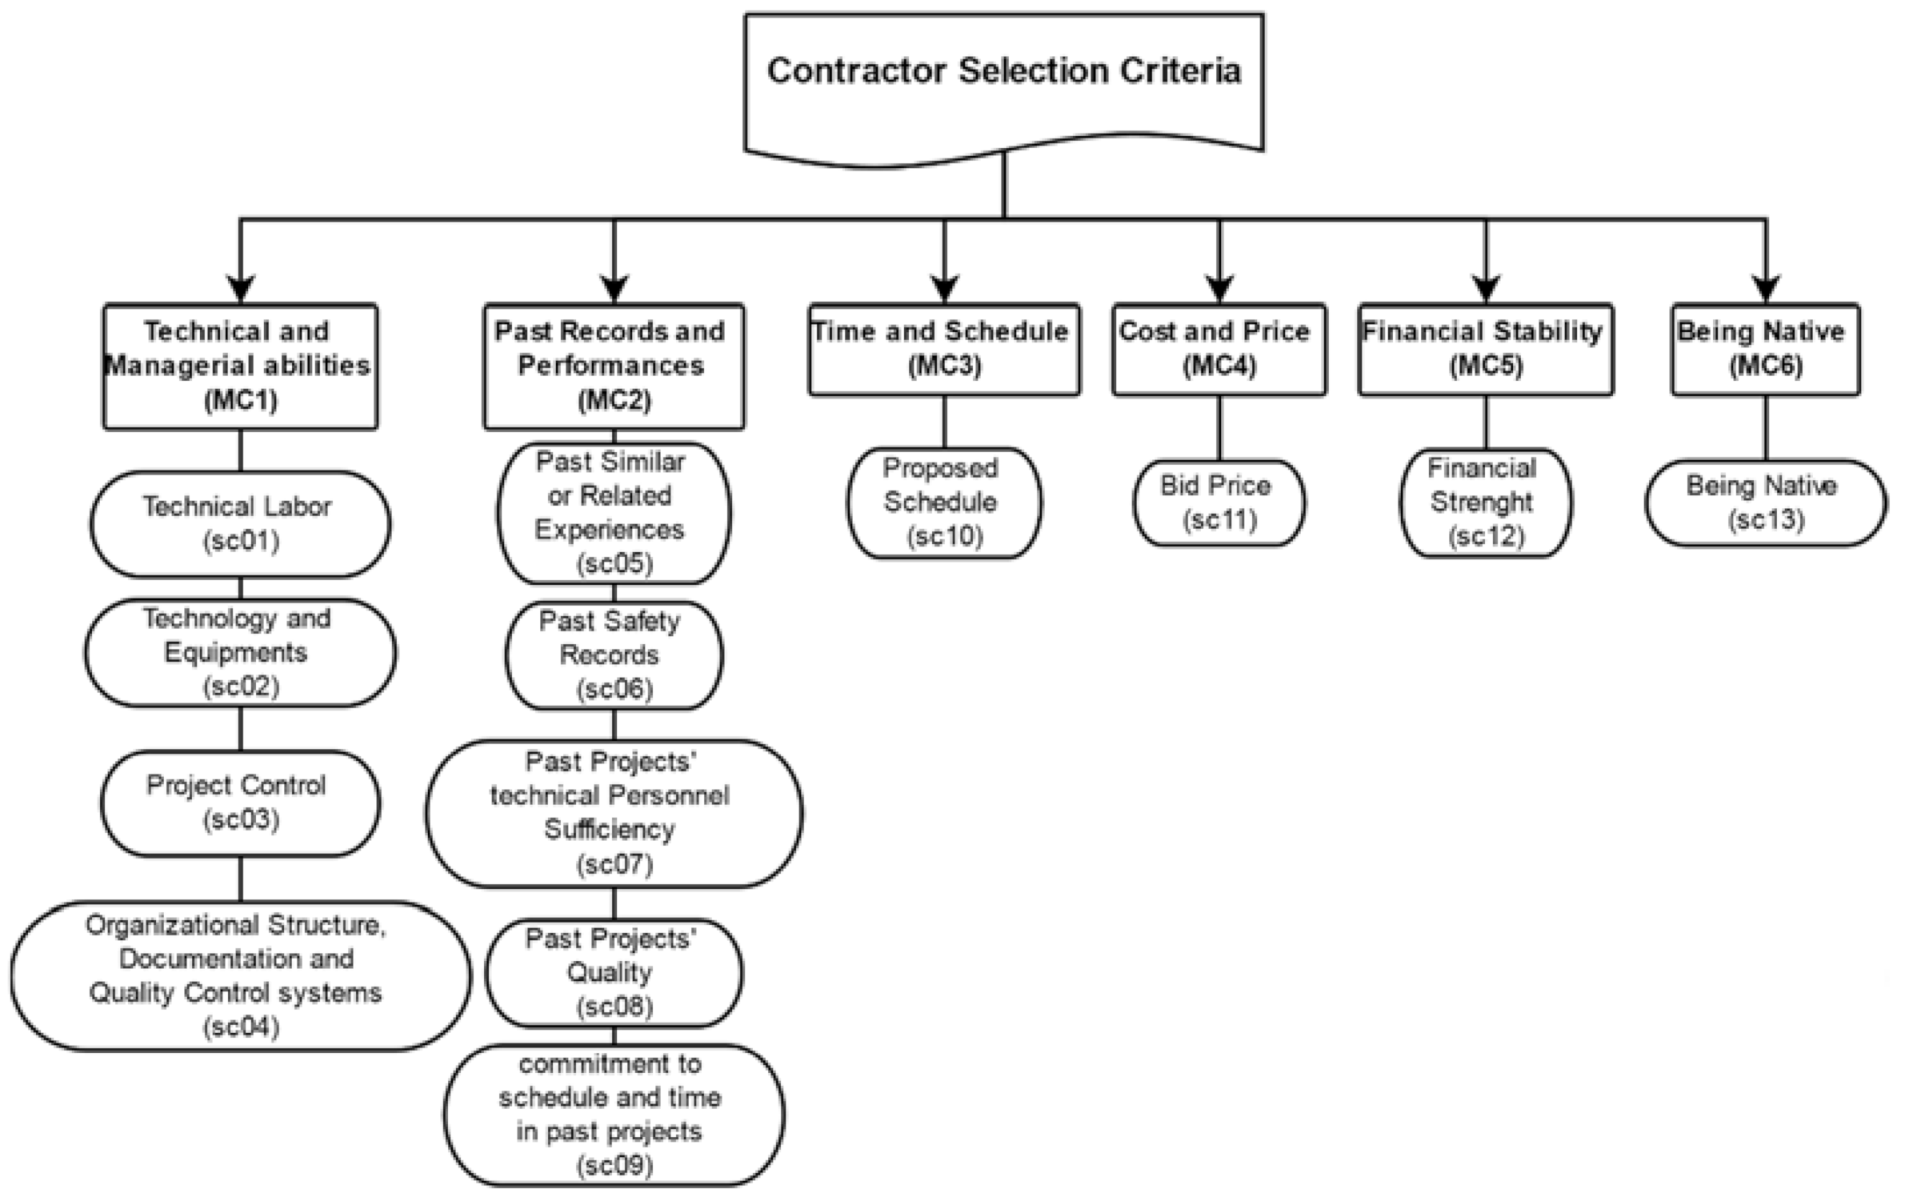
4.1. Criteria
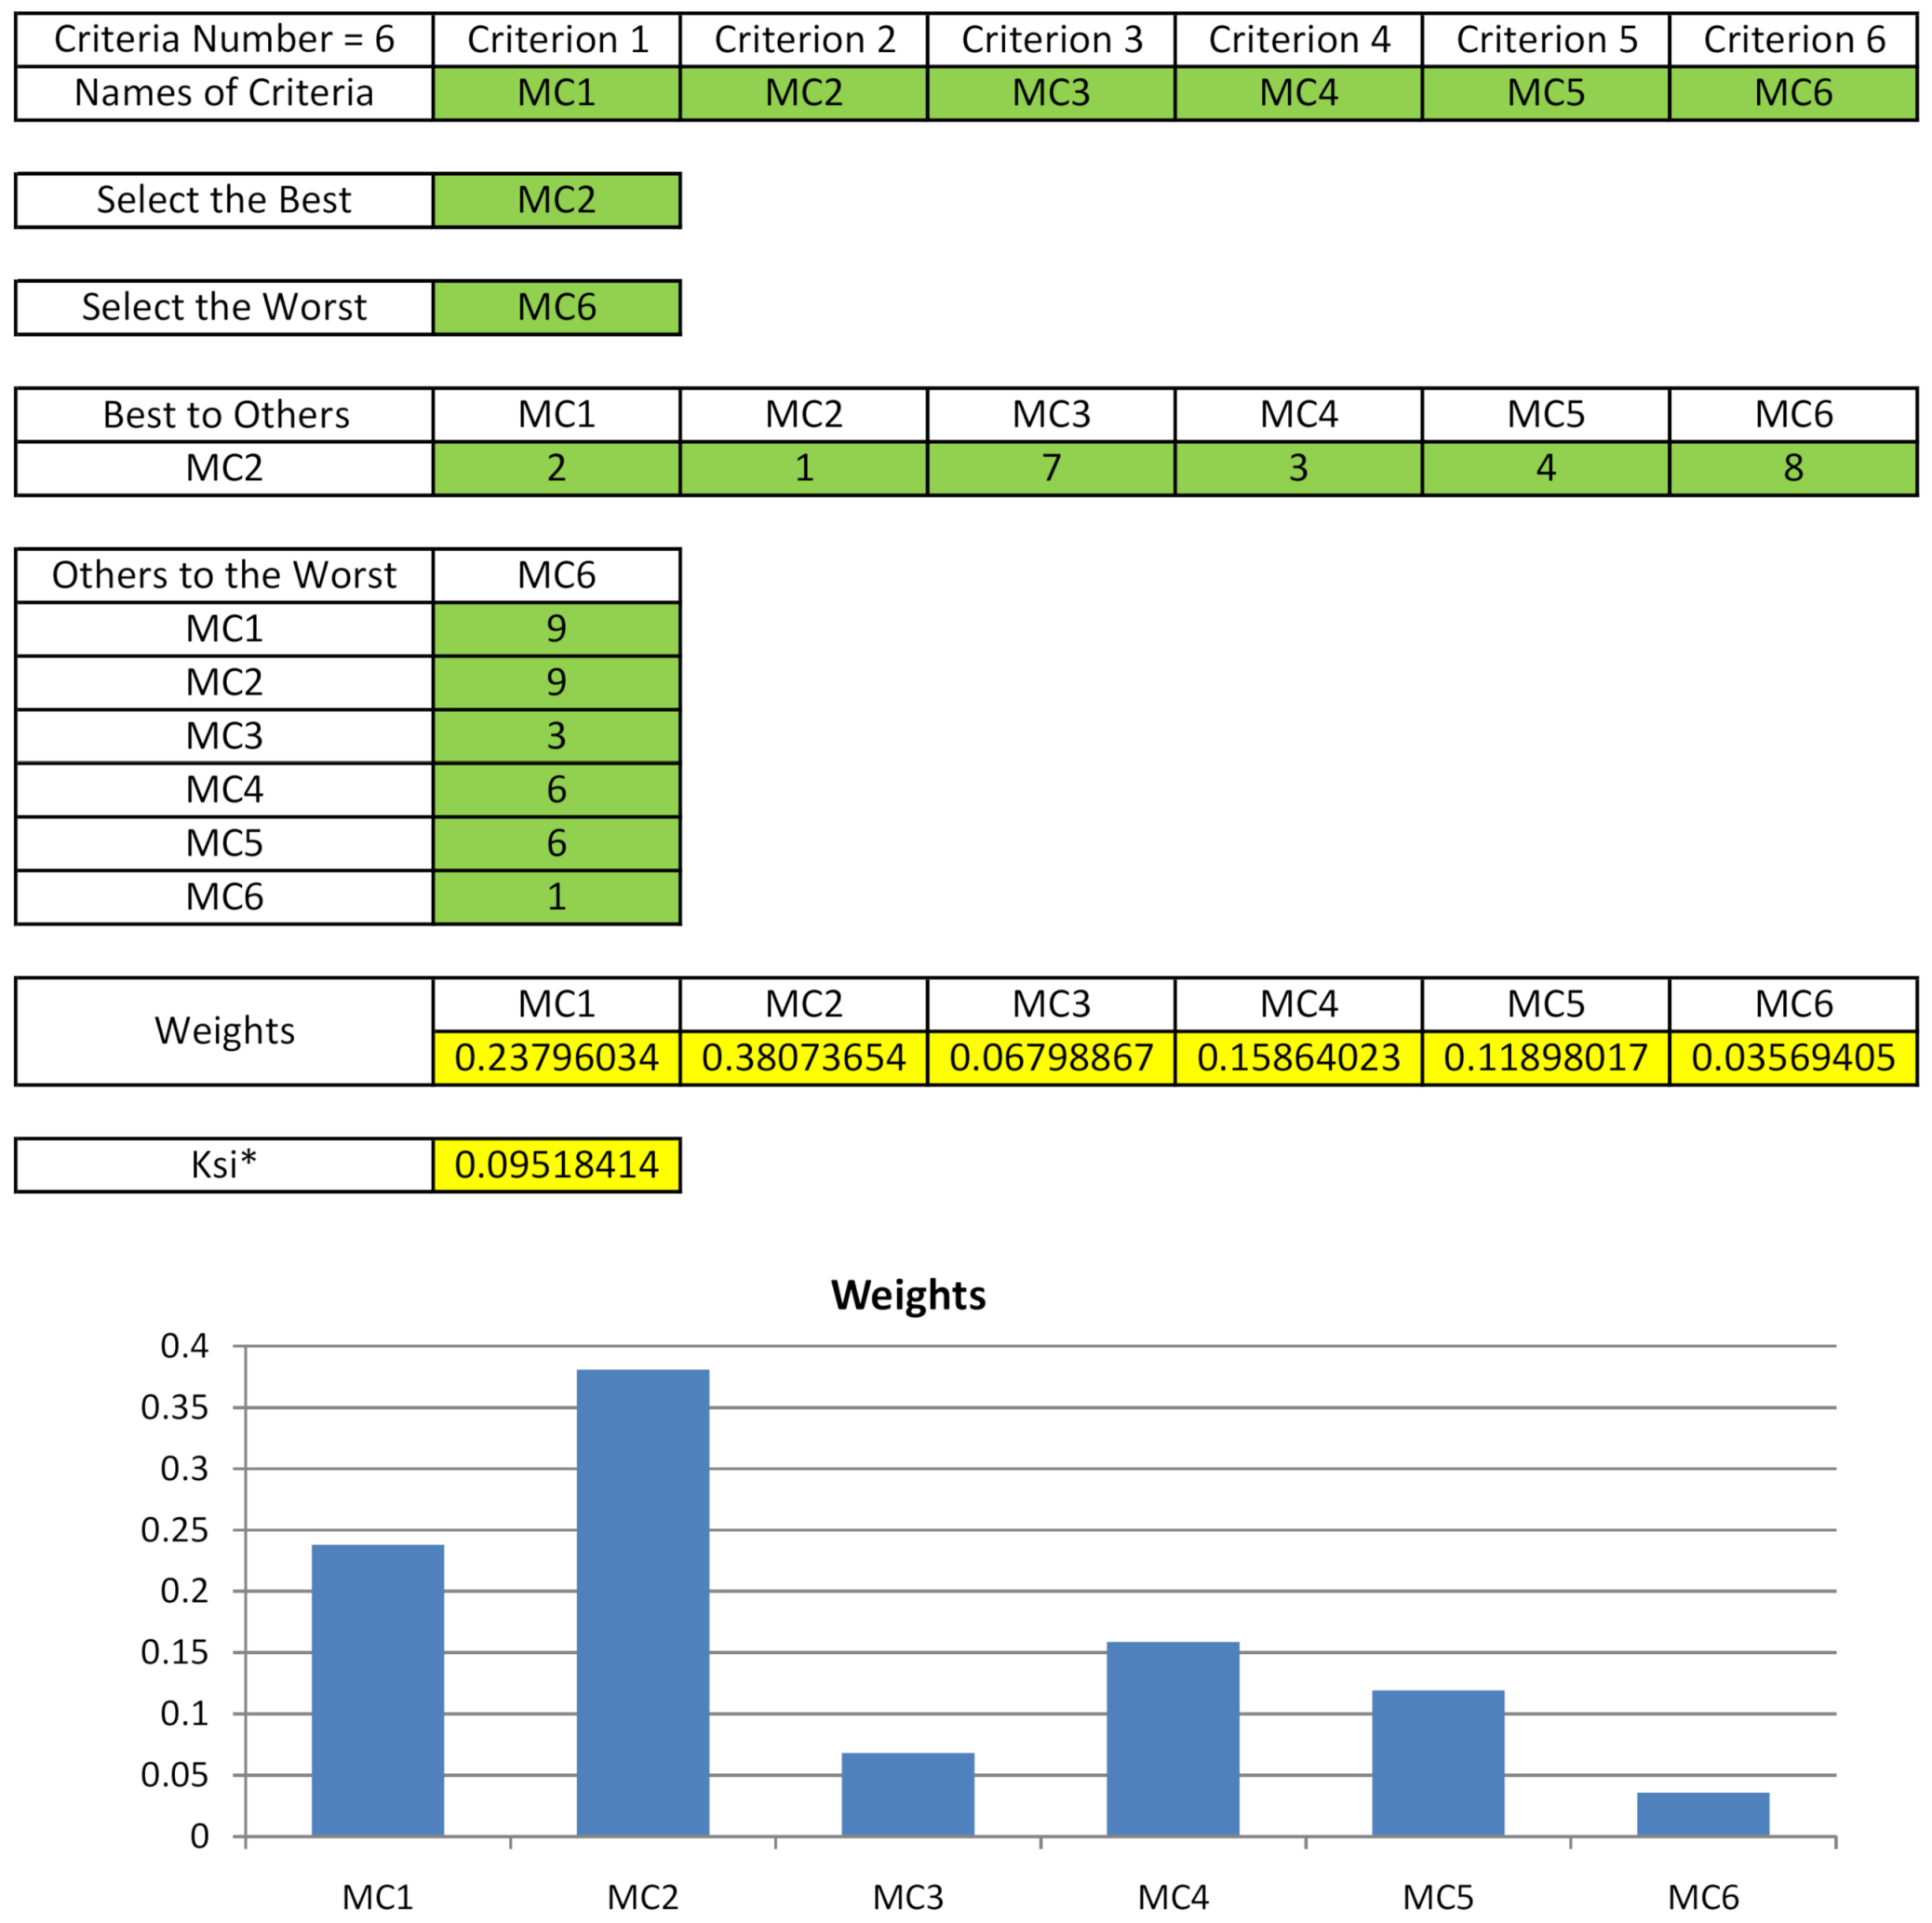
4.2. Criteria Weights
4.3. Decision Matrix
4.4. Ranking the Alternatives
4.5. Results and Discussion
5. Conclusions
Author Contributions
Funding
Institutional Review Board Statement
Informed Consent Statement
Data Availability Statement
Acknowledgments
Conflicts of Interest
Appendix A

| Criteria | sc01 | sc02 | sc03 | sc04 | sc05 | sc06 | sc07 | sc08 | sc09 | sc10 | sc11 | sc12 | sc13 | |
|---|---|---|---|---|---|---|---|---|---|---|---|---|---|---|
| Criteria Weights | 0.1184 | 0.0635 | 0.0296 | 0.0381 | 0.1847 | 0.0291 | 0.0581 | 0.0799 | 0.0574 | 0.0818 | 0.1156 | 0.1020 | 0.0417 | |
| Alternatives | A | (60,60,60) | (84.55,84.55,84.55) | (20,20,20) | (0.833,0.967,1) | (70,70,70) | (0.7,0.867,0.967) | (0.7,0.9,1) | (0.7,0.9,1) | (0.5,0.7,0.9) | (0.9,1,1) | (782000000000,782000000000,782000,000,000) | (100,100,100) | (0,0,0) |
| B | (60,60,60) | (36.25,36.25,36.25) | (25,25,25) | (0.767,0.933,1) | (50,50,50) | (0.9,1,1) | (0.5,0.7,0.9) | (0.5,0.7,0.9) | (0.3,0.5,0.7) | (0.633,0.833,0.967) | (1077195211299,1077195211299,1077195211299) | (72,72,72) | (100,100,100) | |
| C | (60,60,60) | (70.45,70.45,70.45) | (10,10,10) | (0.367,0.567,0.767) | (60,60,60) | (0.333,0.5,0.667) | (0.3,0.5,0.7) | (0.5,0.7,0.9) | (0.5,0.7,0.9) | (0.4,0.567,0.733) | (717135210855,717135210855,717135210855) | (45,45,45) | (100,100,100) | |
| D | (48,48,48) | (78.05,78.05,78.05) | (20,20,20) | (0.433,0.633,0.833) | (65,65,65) | (0.367,0.567,0.767) | (0.5,0.7,0.9) | (0.3,0.5,0.7) | (0.5,0.7,0.9) | (0.3,0.5,0.7) | (823639532214,823639532214,823639532214) | (100,100,100) | (0,0,0) | |
| f~+ | (60,60,60) | (84.55,84.55,84.55) | (25,25,25) | (0.833,0.967,1) | (70,70,70) | (0.9,1,1) | (0.7,0.9,1) | (0.7,0.9,1) | (0.5,0.7,0.9) | (0.9,1,1) | (717135210855,717135210855,717135210855) | (100,100,100) | (100,100,100) | |
| f~- | (48,48,48) | (36.25,36.25,36.25) | (10,10,10) | (0.367,0.567,0.767) | (50,50,50) | (0.333,0.5,0.667) | (0.3,0.5,0.7) | (0.3,0.5,0.7) | (0.3,0.5,0.7) | (0.3,0.5,0.7) | (1077195211299,1077195211299,1077195211299) | (45,45,45) | (0,0,0) | |
| d~ij = (f~+ − x~ij)/(u+j − l-j) | A | (0,0,0) | (0,0,0) | (0.333,0.333,0.333) | (−0.264,0,0.264) | (0,0,0) | (−0.1,0.199,0.45) | (−0.429,0,0.429) | (−0.429,0,0.429) | (−0.667,0,0.667) | (−0.143,0,0.143) | (0.18,0.18,0.18) | (0,0,0) | (1,1,1) |
| B | (0,0,0) | (1,1,1) | (0,0,0) | (−0.264,0.054,0.368) | (1,1,1) | (−0.15,0,0.15) | (−0.286,0.286,0.714) | (−0.286,0.286,0.714) | (−0.333,0.333,1) | (−0.096,0.239,0.524) | (1,1,1) | (0.509,0.509,0.509) | (0,0,0) | |
| C | (0,0,0) | (0.292,0.292,0.292) | (1,1,1) | (0.104,0.632,1) | (0.5,0.5,0.5) | (0.349,0.75,1) | (0,0.571,1) | (−0.286,0.286,0.714) | (−0.667,0,0.667) | (0.239,0.619,0.857) | (0,0,0) | (1,1,1) | (0,0,0) | |
| D | (1,1,1) | (0.135,0.135,0.135) | (0.333,0.333,0.333) | (0,0.528,0.896) | (0.25,0.25,0.25) | (0.199,0.649,0.949) | (−0.286,0.286,0.714) | (0,0.571,1) | (−0.667,0,0.667) | (0.286,0.714,1) | (0.296,0.296,0.296) | (0,0,0) | (1,1,1) | |
| wj.d~ij | A | (0,0,0) | (0,0,0) | (0.01,0.01,0.01) | (−0.01,0,0.01) | (0,0,0) | (−0.003,0.006,0.013) | (−0.025,0,0.025) | (−0.034,0,0.034) | (−0.038,0,0.038) | (−0.012,0,0.012) | (0.021,0.021,0.021) | (0,0,0) | (0.042,0.042,0.042) |
| B | (0,0,0) | (0.064,0.064,0.064) | (0,0,0) | (−0.01,0.002,0.014) | (0.185,0.185,0.185) | (−0.004,0,0.004) | (−0.017,0.017,0.041) | (−0.023,0.023,0.057) | (−0.019,0.019,0.057) | (−0.008,0.02,0.043) | (0.116,0.116,0.116) | (0.052,0.052,0.052) | (0,0,0) | |
| C | (0,0,0) | (0.019,0.019,0.019) | (0.03,0.03,0.03) | (0.004,0.024,0.038) | (0.092,0.092,0.092) | (0.01,0.022,0.029) | (0,0.033,0.058) | (−0.023,0.023,0.057) | (−0.038,0,0.038) | (0.02,0.051,0.07) | (0,0,0) | (0.102,0.102,0.102) | (0,0,0) | |
| D | (0.118,0.118,0.118) | (0.009,0.009,0.009) | (0.01,0.01,0.01) | (0,0.02,0.034) | (0.046,0.046,0.046) | (0.006,0.019,0.028) | (−0.017,0.017,0.041) | (0,0.046,0.08) | (−0.038,0,0.038) | (0.023,0.058,0.082) | (0.034,0.034,0.034) | (0,0,0) | (0.042,0.042,0.042) | |
References
- El-Sayegh, S.M.; Basamji, M.; Haj Ahmad, A.; Zarif, N. Key contractor selection criteria for green construction projects in the UAE. Int. J. Construct. Manag. 2019, 1–11. [Google Scholar] [CrossRef]
- Alptekin, O.; Alptekin, N. Analysis of Criteria Influencing Contractor Selection Using TOPSIS Method; IOP Publishing: Bristol, UK, 2017; p. 062003. [Google Scholar]
- Banaitiene, N.; Banaitis, A. Analysis of criteria for contractors’ qualification evaluation. Technol. Econ. Dev. Econ. 2006, 12, 276–282. [Google Scholar] [CrossRef]
- Jafari, A. A contractor pre-qualification model based on the quality function deployment method. Constr. Manag. Econ. 2013, 31, 746–760. [Google Scholar] [CrossRef]
- Hasnain, M.; Thaheem, M.J.; Ullah, F. Best Value Contractor Selection in Road Construction Projects: ANP-Based Decision Support System. Int. J. Civ. Eng. 2018, 16, 695–714. [Google Scholar] [CrossRef]
- Kashiwagi, D.; Byfield, R. State of Utah performance information procurement system tests. J. Constr. Eng. Manag. 2002, 128, 338–347. [Google Scholar] [CrossRef]
- El-Sayegh, S.M. Multi-criteria decision support model for selecting the appropriate construction management at risk firm. Constr. Manag. Econ. 2009, 27, 385–398. [Google Scholar] [CrossRef]
- Morkunaite, Z.; Podvezko, V.; Zavadskas, E.K.; Bausys, R. Contractor selection for renovation of cultural heritage buildings by PROMETHEE method. Arch. Civ. Mech. Eng. 2019, 19, 1056–1071. [Google Scholar] [CrossRef]
- Morkunaite, Z.; Bausys, R.; Zavadskas, E.K. Contractor Selection for Sgraffito Decoration of Cultural Heritage Buildings Using the WASPAS-SVNS Method. Sustainability 2019, 11, 6444. [Google Scholar] [CrossRef]
- Rezaei, J. Best-worst multi-criteria decision-making method. Omega 2015, 53, 49–57. [Google Scholar] [CrossRef]
- Opricovic, S.; Tzeng, G.-H. Compromise solution by MCDM methods: A comparative analysis of VIKOR and TOPSIS. Eur. J. Oper. Res. 2004, 156, 445–455. [Google Scholar] [CrossRef]
- Opricovic, S. Fuzzy VIKOR with an application to water resources planning. Expert Syst. Appl. 2011, 38, 12983–12990. [Google Scholar] [CrossRef]
- Fei, L.; Deng, Y.; Hu, Y. DS-VIKOR: A new multi-criteria decision-making method for supplier selection. Int. J. Fuzzy Syst. 2019, 21, 157–175. [Google Scholar] [CrossRef]
- Darvish, M.; Yasaei, M.; Saeedi, A. Application of the graph theory and matrix methods to contractor ranking. Int. J. Proj. Manag. 2009, 27, 610–619. [Google Scholar] [CrossRef]
- Fong, P.S.-W.; Choi, S.K.-Y. Final contractor selection using the analytical hierarchy process. Constr. Manag. Econ. 2000, 18, 547–557. [Google Scholar] [CrossRef]
- Al-Harbi, K.M.A.-S. Application of the AHP in project management. Int. J. Proj. Manag. 2001, 19, 19–27. [Google Scholar] [CrossRef]
- Topcu, Y.I. A decision model proposal for construction contractor selection in Turkey. Build. Environ. 2004, 39, 469–481. [Google Scholar] [CrossRef]
- Hadidi, L.A.; Khater, M.A. Loss prevention in turnaround maintenance projects by selecting contractors based on safety criteria using the analytic hierarchy process (AHP). J. Loss Prev. Process Ind. 2015, 34, 115–126. [Google Scholar] [CrossRef]
- Chiang, F.-Y.; Yu, V.F.; Luarn, P. Construction Contractor Selection in Taiwan Using AHP. Int. J. Eng. Technol. 2017, 9, 211–215. [Google Scholar] [CrossRef][Green Version]
- Abdelrahman, M.; Zayed, T.; Elyamany, A. Best-Value Model Based on Project Specific Characteristics. J. Constr. Eng. Manag. 2008, 134, 179–188. [Google Scholar] [CrossRef]
- Nieto-Morote, A.; Ruz-Vila, F. A fuzzy multi-criteria decision-making model for construction contractor prequalification. Autom. Constr. 2012, 25, 8–19. [Google Scholar] [CrossRef]
- San Cristóbal, J.R. Contractor selection using multicriteria decision-making methods. J. Constr. Eng. Manag. 2012, 138, 751–758. [Google Scholar] [CrossRef]
- Polat, G. Subcontractor selection using the integration of the AHP and PROMETHEE methods. J. Civ. Eng. Manag. 2016, 22, 1042–1054. [Google Scholar] [CrossRef]
- Taylan, O.; Kabli, M.R.; Porcel, C.; Herrera-Viedma, E. Contractor Selection for Construction Projects Using Consensus Tools and Big Data. Int. J. Fuzzy Syst. 2018, 20, 1267–1281. [Google Scholar] [CrossRef]
- Cheng, E.W.L.; Li, H. Contractor selection using the analytic network process. Constr. Manag. Econ. 2004, 22, 1021–1032. [Google Scholar] [CrossRef]
- Khosrowshahi, F. Neural network model for contractors’ prequalification for local authority projects. Eng. Constr. Archit. Manag. 1999, 6, 315–328. [Google Scholar] [CrossRef]
- Lam, K.C.; Ng, S.T.; Tiesong, H.; Skitmore, M.; Cheung, S.O. Decision support system for contractor pre-qualification—artificial neural network model. Eng. Constr. Archit. Manag. 2000, 7, 251–266. [Google Scholar]
- Lam, K.C.; Hu, T.; Thomas Ng, S.; Skitmore, M.; Cheung, S.O. A fuzzy neural network approach for contractor prequalification. Constr. Manag. Econ. 2001, 19, 175–188. [Google Scholar] [CrossRef]
- El-Sawalhi, N.; Eaton, D.; Rustom, R. Contractor pre-qualification model: State-of-the-art. Int. J. Proj. Manag. 2007, 25, 465–474. [Google Scholar] [CrossRef]
- Hassim, S.; Muniandy, R.; Alias Aidi, H.; Abdullah, P. Construction tender price estimation standardization (TPES) in Malaysia: Modeling using fuzzy neural network. Eng. Constr. Archit. Manag. 2018, 25, 443–457. [Google Scholar] [CrossRef]
- Moselhi, O.; Martinelli, A. Analysis of bids using multiattribute utility theory. In Proceedings of the International Symposium on Building Economics and Construction Management, Sydney, Australia, 9 June 1990; pp. 335–345. [Google Scholar]
- Holt, G.D.; Olomolaiye, P.O.; Harris, F.C. Evaluating performance potential in the selection of construction contractors. Eng. Constr. Archit. Manag. 1994, 1, 29–50. [Google Scholar] [CrossRef]
- Holt, G.D. Applying cluster analysis to construction contractor classification. Build. Environ. 1996, 31, 557–568. [Google Scholar] [CrossRef]
- Hatush, Z.; Skitmore, M. Criteria for contractor selection. Constr. Manag. Econ. 1997, 15, 19–38. [Google Scholar] [CrossRef]
- Hatush, Z.; Skitmore, M. Contractor selection using multicriteria utility theory: An additive model. Build. Environ. 1998, 33, 105–115. [Google Scholar] [CrossRef]
- Ng, S.T. EQUAL: A case-based contractor prequalifier. Autom. Constr. 2001, 10, 443–457. [Google Scholar] [CrossRef]
- Sönmez, M.; Holt, G.D.; Yang, J.B.; Graham, G. Applying evidential reasoning to prequalifying construction contractors. J. Manag. Eng. 2002, 18, 111–119. [Google Scholar] [CrossRef]
- Wong, C.H.; Nicholas, J.; Holt, G.D. Using multivariate techniques for developing contractor classification models. Eng. Constr. Archit. Manag. 2003, 10, 99–116. [Google Scholar] [CrossRef]
- Lai, K.K.; Liu, S.L.; Wang, S.Y. A method used for evaluating bids in the Chinese construction industry. Int. J. Proj. Manag. 2004, 22, 193–201. [Google Scholar] [CrossRef]
- Wong, C.H. Contractor performance prediction model for the United Kingdom construction contractor: Study of logistic regression approach. J. Constr. Eng. Manag. 2004, 130, 691–698. [Google Scholar] [CrossRef]
- Minchin, R.E., Jr.; Smith, G.R. Quality-based contractor rating model for qualification and bidding purposes. J. Manag. Eng. 2005, 21, 38–43. [Google Scholar] [CrossRef]
- McCabe, B.; Tran, V.; Ramani, J. Construction prequalification using data envelopment analysis. Can. J. Civ. Eng. 2005, 32, 183–193. [Google Scholar] [CrossRef]
- Palaneeswaran, E.; Kumaraswamy, M.M. Web-based client advisory decision support system for design–builder prequalification. J. Comput. Civ. Eng. 2005, 19, 69–82. [Google Scholar] [CrossRef]
- Kaklauskas, A.; Zavadskas, E.K.; Raslanas, S.; Ginevicius, R.; Komka, A.; Malinauskas, P. Selection of low-e windows in retrofit of public buildings by applying multiple criteria method COPRAS: A Lithuanian case. Energy Build. 2006, 38, 454–462. [Google Scholar] [CrossRef]
- Lambropoulos, S. The use of time and cost utility for construction contract award under European Union Legislation. Build. Environ. 2007, 42, 452–463. [Google Scholar] [CrossRef]
- Brauers, W.K.M.; Zavadskas, E.K.; Turskis, Z.; Vilutienė, T. Multi-objective contractor’s ranking by applying the Moora method. J. Bus. Econ. Manag. 2008, 9, 245–255. [Google Scholar] [CrossRef]
- Zavadskas, E.K.; Turskis, Z.; Tamošaitiene, J. Contractor selection of construction in a competitive environment. J. Bus. Econ. Manag. 2008, 9, 181–187. [Google Scholar] [CrossRef]
- Lam, K.C.; Palaneeswaran, E.; Yu, C.-y. A support vector machine model for contractor prequalification. Autom. Constr. 2009, 18, 321–329. [Google Scholar] [CrossRef]
- Lam, K.-C.; Lam, M.C.-K.; Wang, D. Efficacy of using support vector machine in a contractor prequalification decision model. J. Comput. Civ. Eng. 2010, 24, 273–280. [Google Scholar] [CrossRef]
- de Araújo, M.C.B.; Alencar, L.H.; Mota, C.M.M. Model for contractor performance evaluation in construction industry. In Proceedings of the 2016 IEEE International Conference on Systems, Man, and Cybernetics (SMC), Budapest, Hungary, 9–12 October 2016; pp. 002631–002635. [Google Scholar]
- Keshavarz-Ghorabaee, M.; Amiri, M.; Zavadskas, E.K.; Turskis, Z.; Antucheviciene, J. A dynamic fuzzy approach based on the EDAS method for multi-criteria subcontractor evaluation. Information 2018, 9, 68. [Google Scholar] [CrossRef]
- Russell, J.S.; Skibniewski, M.J. QUALIFIER-1: Contractor prequalification model. J. Comput. Civ. Eng. 1990, 4, 77–90. [Google Scholar] [CrossRef]
- Hatush, Z.; Skitmore, M. Assessment and evaluation of contractor data against client goals using PERT approach. Constr. Manag. Econ. 1997, 15, 327–340. [Google Scholar] [CrossRef][Green Version]
- Mahdi, I.M.; Riley, M.J.; Fereig, S.M.; Alex, A.P. A multi-criteria approach to contractor selection. Eng. Constr. Archit. Manag. 2002, 9, 29–37. [Google Scholar]
- Singh, D.; Tiong, R.L.K. A fuzzy decision framework for contractor selection. J. Constr. Eng. Manag. 2005, 131, 62–70. [Google Scholar] [CrossRef]
- Turskis, Z. Multi-attribute contractors ranking method by applying ordering of feasible alternatives of solutions in terms of preferability technique. Technol. Econ. Dev. Econ. 2008, 14, 224–239. [Google Scholar] [CrossRef]
- Plebankiewicz, E. Contractor prequalification model using fuzzy sets. J. Civ. Eng. Manag. 2009, 15, 377–385. [Google Scholar] [CrossRef]
- Juan, Y.-K.; Perng, Y.-H.; Castro-Lacouture, D.; Lu, K.-S. Housing refurbishment contractors selection based on a hybrid fuzzy-QFD approach. Autom. Constr. 2009, 18, 139–144. [Google Scholar] [CrossRef]
- Cheng, M.-Y.; Kang, S.-T. Integrated fuzzy preference relations with decision utilities for construction contractor selection. J. Chin. Inst. Eng. 2012, 35, 1051–1063. [Google Scholar] [CrossRef]
- Plebankiewicz, E. A fuzzy sets-based contractor prequalification procedure. Autom. Constr. 2012, 22, 433–443. [Google Scholar] [CrossRef]
- Vahdani, B.; Mousavi, S.M.; Hashemi, H.; Mousakhani, M.; Tavakkoli-Moghaddam, R. A new compromise solution method for fuzzy group decision-making problems with an application to the contractor selection. Eng. Appl. Artif. Intell. 2013, 26, 779–788. [Google Scholar] [CrossRef]
- Attar, A.M.; Khanzadi, M.; Dabirian, S.; Kalhor, E. Forecasting contractor’s deviation from the client objectives in prequalification model using support vector regression. Int. J. Proj. Manag. 2013, 31, 924–936. [Google Scholar] [CrossRef]
- Ulubeyli, S.; Kazaz, A. Fuzzy multi-criteria decision-making model for subcontractor selection in international construction projects. Technol. Econ. Dev. Econ. 2016, 22, 210–234. [Google Scholar] [CrossRef]
- Semaan, N.; Salem, M. A deterministic contractor selection decision support system for competitive bidding. Eng. Constr. Archit. Manag. 2017, 24, 61–77. [Google Scholar] [CrossRef]
- Afshar, M.R.; Alipouri, Y.; Sebt, M.H.; Chan, W.T. A type-2 fuzzy set model for contractor prequalification. Autom. Constr. 2017, 84, 356–366. [Google Scholar] [CrossRef]
- Martin, H.; Koylass, J.; Welch, F. An exploration of the consistency limits of the analytical hierarchy process and its impact on contractor selection. Int. J. Constr. Manag. 2018, 18, 14–25. [Google Scholar] [CrossRef]
- Hashemi, H.; Mousavi, S.M.; Zavadskas, E.K.; Chalekaee, A.; Turskis, Z. A new group decision model based on grey-intuitionistic fuzzy-ELECTRE and VIKOR for contractor assessment problem. Sustainability 2018, 10, 1635. [Google Scholar] [CrossRef]
- Cheng, M.-Y.; Yeh, S.-H.; Chang, W.-C. Multi-Criteria Decision Making of Contractor Selection in Mass Rapid Transit Station Development Using Bayesian Fuzzy Prospect Model. Sustainability 2020, 12, 4606. [Google Scholar] [CrossRef]
- Triantaphyllou, E. Conclusions and Discussion for Future Research. In Multi-Criteria Decision-Making Methods: A Comparative Study; Applied Optimization; Springer: Boston, MA, USA, 2000; Volume 44. [Google Scholar] [CrossRef]
- Mi, X.; Tang, M.; Liao, H.; Shen, W.; Lev, B. The state-of-the-art survey on integrations and applications of the best worst method in decision making: Why, what, what for and what’s next? Omega 2019, 87, 205–225. [Google Scholar] [CrossRef]
- Amiri, M.; Hashemi-Tabatabaei, M.; Ghahremanloo, M.; Keshavarz-Ghorabaee, M.; Zavadskas, E.K.; Antucheviciene, J. A new fuzzy approach based on BWM and fuzzy preference programming for hospital performance evaluation: A case study. Appl. Soft Comput. 2020, 92, 106279. [Google Scholar] [CrossRef]
- Hendiani, S.; Mahmoudi, A.; Liao, H. A multi-stage multi-criteria hierarchical decision-making approach for sustainable supplier selection. Appl. Soft Comput. 2020, 94, 106456. [Google Scholar] [CrossRef]
- Li, H.; Wang, W.; Fan, L.; Li, Q.; Chen, X. A novel hybrid MCDM model for machine tool selection using fuzzy DEMATEL, entropy weighting and later defuzzification VIKOR. Appl. Soft Comput. 2020, 91, 106207. [Google Scholar] [CrossRef]
- Yue, C. Picture fuzzy normalized projection and extended VIKOR approach to software reliability assessment. Appl. Soft Comput. 2020, 88, 106056. [Google Scholar] [CrossRef]
- Khoso, A.R.; Md Yusof, A. Extended review on contractor selection in construction projects. Can. J. Civ. Eng. 2019, 47, 771–789. [Google Scholar] [CrossRef]
- Zimmermann, H.-J. Fuzzy Set Theory—and Its Applications; Springer Science & Business Media: Berlin, Germany, 2001. [Google Scholar]
- Birjandi, A.K.; Akhyani, F.; Sheikh, R.; Sana, S.S. Evaluation and selecting the contractor in bidding with incomplete information using MCGDM method. Soft Comput. 2019, 23, 10569–10585. [Google Scholar] [CrossRef]
- Wu, Z.; Ahmad, J.; Xu, J. A group decision making framework based on fuzzy VIKOR approach for machine tool selection with linguistic information. Appl. Soft Comput. 2016, 42, 314–324. [Google Scholar] [CrossRef]
- Guo, S.; Zhao, H. Fuzzy best-worst multi-criteria decision-making method and its applications. Knowl. -Based Syst. 2017, 121, 23–31. [Google Scholar] [CrossRef]
- Chen, S.-J.; Hwang, C.-L. Fuzzy multiple attribute decision making methods. In Fuzzy Multiple Attribute Decision Making; Springer: Berlin, Germany, 1992; pp. 289–486. [Google Scholar]
- Tzeng, G.-H.; Huang, J.-J. Fuzzy Multiple Objective Decision Making; CRC Press: Boca Raton, FL, USA, 2013. [Google Scholar]
- Tian, Z.-p.; Wang, J.-q.; Zhang, H.-y. An integrated approach for failure mode and effects analysis based on fuzzy best-worst, relative entropy, and VIKOR methods. Appl. Soft Comput. 2018, 72, 636–646. [Google Scholar] [CrossRef]
- Rezaei, J.; Papakonstantinou, A.; Tavasszy, L.; Pesch, U.; Kana, A. Sustainable product-package design in a food supply chain: A multi-criteria life cycle approach. Packag. Technol. Sci. 2019, 32, 85–101. [Google Scholar] [CrossRef]
- Rezaei, J. Best-worst multi-criteria decision-making method: Some properties and a linear model. Omega 2016, 64, 126–130. [Google Scholar] [CrossRef]
- Liang, F.; Brunelli, M.; Rezaei, J. Consistency issues in the best worst method: Measurements and thresholds. Omega 2020, 96, 102175. [Google Scholar] [CrossRef]
- Saaty, T.L.; Özdemir, M.S. How many judges should there be in a group? Ann. Data Sci. 2014, 1, 359–368. [Google Scholar] [CrossRef]
- Opricovic, S.; Tzeng, G.H. Multicriteria planning of post-earthquake sustainable reconstruction. Comput. -Aided Civ. Infrastruct. Eng. 2002, 17, 211–220. [Google Scholar] [CrossRef]
- Tzeng, G.-H.; Tsaur, S.-H.; Laiw, Y.-D.; Opricovic, S. Multicriteria analysis of environmental quality in Taipei: Public preferences and improvement strategies. J. Environ. Manag. 2002, 65, 109–120. [Google Scholar] [CrossRef] [PubMed]


| Reference. | Year | Values Type | prequalification | CS | Sub-CS | CPE 2 | Criteria Importance Determination Method | |||||||||||||||||||||||
|---|---|---|---|---|---|---|---|---|---|---|---|---|---|---|---|---|---|---|---|---|---|---|---|---|---|---|---|---|---|---|
| Crisp | Fuzzy | Semantic | IFS 1 | AHP | WAM 3 | Delphi | ANP | ANN 4 | CBR 5 | SC 6 | QMIV 7 | Entropy | TOPSIS | FLT 8 | FST 9 | GT&M 10 | G-AHP 11 | QFD 12 | EJM 13 | Client 14 | IE 15 | SWARA 16 | PR 17 | BWM 18 | ||||||
| [52] | 1990 | ✓ | ✓ | ✓ | ||||||||||||||||||||||||||
| [32] | 1994 | ✓ | ✓ | ✓ | ✓ | |||||||||||||||||||||||||
| [33] | 1996 | ✓ | ✓ | |||||||||||||||||||||||||||
| [53] | 1997 | ✓ | ✓ | ✓ | ✓ | |||||||||||||||||||||||||
| [26] | 1999 | ✓ | ✓ | ✓ | ✓ | |||||||||||||||||||||||||
| [15] | 2000 | ✓ | ✓ | ✓ | ||||||||||||||||||||||||||
| [27] | 2000 | ✓ | ✓ | ✓ | ✓ | |||||||||||||||||||||||||
| [36] | 2001 | ✓ | ✓ | ✓ | ✓ | |||||||||||||||||||||||||
| [28] | 2001 | ✓ | ✓ | |||||||||||||||||||||||||||
| [16] | 2001 | ✓ | ✓ | ✓ | ||||||||||||||||||||||||||
| [54] | 2002 | ✓ | ✓ | ✓ | ✓ | ✓ | ||||||||||||||||||||||||
| [37] | 2002 | ✓ | ✓ | ✓ | ||||||||||||||||||||||||||
| [6] | 2002 | ✓ | ✓ | ✓ | ||||||||||||||||||||||||||
| [38] | 2003 | ✓ | ✓ | |||||||||||||||||||||||||||
| [17] | 2004 | ✓ | ✓ | ✓ | ✓ | |||||||||||||||||||||||||
| [25] | 2004 | ✓ | ✓ | ✓ | ||||||||||||||||||||||||||
| [40] | 2004 | ✓ | ✓ | |||||||||||||||||||||||||||
| [42] | 2005 | ✓ | ✓ | |||||||||||||||||||||||||||
| [55] | 2005 | ✓ | ✓ | ✓ | ✓ | |||||||||||||||||||||||||
| [41] | 2005 | ✓ | ✓ | ✓ | ||||||||||||||||||||||||||
| [43] | 2005 | ✓ | ✓ | ✓ | ||||||||||||||||||||||||||
| [44] | 2006 | ✓ | ✓ | ✓ | ||||||||||||||||||||||||||
| [3] | 2006 | ✓ | ✓ | ✓ | ||||||||||||||||||||||||||
| [45] | 2007 | ✓ | ✓ | ✓ | ||||||||||||||||||||||||||
| [29] | 2007 | ✓ | ✓ | ✓ | ||||||||||||||||||||||||||
| [20] | 2008 | ✓ | ✓ | ✓ | ✓ | |||||||||||||||||||||||||
| [47] | 2008 | ✓ | ✓ | ✓ | ||||||||||||||||||||||||||
| [56] | 2008 | ✓ | ✓ | ✓ | ||||||||||||||||||||||||||
| [46] | 2008 | ✓ | ✓ | |||||||||||||||||||||||||||
| [57] | 2009 | ✓ | ✓ | ✓ | ✓ | |||||||||||||||||||||||||
| [14] | 2009 | ✓ | ✓ | ✓ | ✓ | |||||||||||||||||||||||||
| [58] | 2009 | ✓ | ✓ | ✓ | ✓ | |||||||||||||||||||||||||
| [48] | 2009 | ✓ | ✓ | |||||||||||||||||||||||||||
| [49] | 2010 | ✓ | ✓ | |||||||||||||||||||||||||||
| [22] | 2012 | ✓ | ✓ | ✓ | ||||||||||||||||||||||||||
| [59] | 2012 | ✓ | ✓ | ✓ | ✓ | |||||||||||||||||||||||||
| [21] | 2012 | ✓ | ✓ | ✓ | ✓ | ✓ | ||||||||||||||||||||||||
| [60] | 2012 | ✓ | ✓ | ✓ | ✓ | |||||||||||||||||||||||||
| [61] | 2013 | ✓ | ✓ | ✓ | ✓ | |||||||||||||||||||||||||
| [4] | 2013 | ✓ | ✓ | |||||||||||||||||||||||||||
| [62] | 2013 | ✓ | ✓ | |||||||||||||||||||||||||||
| [18] | 2015 | ✓ | ✓ | ✓ | ||||||||||||||||||||||||||
| [23] | 2016 | ✓ | ✓ | ✓ | ||||||||||||||||||||||||||
| [50] | 2016 | ✓ | ✓ | ✓ | ||||||||||||||||||||||||||
| [63] | 2016 | ✓ | ✓ | ✓ | ✓ | |||||||||||||||||||||||||
| [19] | 2017 | ✓ | ✓ | ✓ | ||||||||||||||||||||||||||
| [64] | 2017 | ✓ | ✓ | ✓ | ✓ | |||||||||||||||||||||||||
| [2] | 2017 | ✓ | ✓ | ✓ | ✓ | |||||||||||||||||||||||||
| [65] | 2017 | ✓ | ✓ | ✓ | ✓ | |||||||||||||||||||||||||
| [66] | 2018 | ✓ | ✓ | ✓ | ||||||||||||||||||||||||||
| [51] | 2018 | ✓ | ✓ | ✓ | ✓ | ✓ | ||||||||||||||||||||||||
| [24] | 2018 | ✓ | ✓ | ✓ | ✓ | ✓ | ✓ | ✓ | ||||||||||||||||||||||
| [67] | 2018 | ✓ | ✓ | ✓ | ✓ | |||||||||||||||||||||||||
| [8] | 2019 | ✓ | ✓ | ✓ | ||||||||||||||||||||||||||
| [9] | 2019 | ✓ | ✓ | ✓ | ✓ | |||||||||||||||||||||||||
| [68] | 2020 | ✓ | ✓ | ✓ | ✓ | ✓ | ✓ | |||||||||||||||||||||||
| This paper | ✓ | ✓ | ✓ | ✓ | ✓ | |||||||||||||||||||||||||
| Reference. | Year | Ranking Method | ||||||||||||||||||||||||||||||||||||||
|---|---|---|---|---|---|---|---|---|---|---|---|---|---|---|---|---|---|---|---|---|---|---|---|---|---|---|---|---|---|---|---|---|---|---|---|---|---|---|---|---|
| AHP | BVD 19 | TOPSIS | VIKOR | PROMETHEE | MAUT 20 | ANP | ANN | CBR | CA 21 | COPRAS 22 | MAA 23 | HLR 24 | MCPM 25 | DEA 26 | DWA 27 | DF-EDAS 28 | ELECTRE 29 | ER 30 | OFASPT 31 | WBS 32 | CSM 33 | T 2FSM 34 | FST | FNN 35 | GNN 36 | GT&M | G-AHP | QFD | PERT 37 | GRA 38 | LR 39 | MDA 40 | MOORA 41 | QBPR 42 | ZDIM 43 | SVM 44 | WASPAS-SVNS 45 | BFPM 46 | ||
| [52] | 1990 | ✓ | ||||||||||||||||||||||||||||||||||||||
| [32] | 1994 | ✓ | ||||||||||||||||||||||||||||||||||||||
| [33] | 1996 | ✓ | ||||||||||||||||||||||||||||||||||||||
| [53] | 1997 | ✓ | ||||||||||||||||||||||||||||||||||||||
| [26] | 1999 | ✓ | ||||||||||||||||||||||||||||||||||||||
| [15] | 2000 | ✓ | ||||||||||||||||||||||||||||||||||||||
| [27] | 2000 | ✓ | ||||||||||||||||||||||||||||||||||||||
| [36] | 2001 | ✓ | ||||||||||||||||||||||||||||||||||||||
| [28] | 2001 | ✓ | ||||||||||||||||||||||||||||||||||||||
| [16] | 2001 | ✓ | ||||||||||||||||||||||||||||||||||||||
| [54] | 2002 | ✓ | ||||||||||||||||||||||||||||||||||||||
| [37] | 2002 | ✓ | ||||||||||||||||||||||||||||||||||||||
| [6] | 2002 | ✓ | ||||||||||||||||||||||||||||||||||||||
| [38] | 2003 | ✓ | ✓ | |||||||||||||||||||||||||||||||||||||
| [17] | 2004 | ✓ | ||||||||||||||||||||||||||||||||||||||
| [25] | 2004 | ✓ | ||||||||||||||||||||||||||||||||||||||
| [40] | 2004 | ✓ | ||||||||||||||||||||||||||||||||||||||
| [42] | 2005 | ✓ | ||||||||||||||||||||||||||||||||||||||
| [55] | 2005 | ✓ | ||||||||||||||||||||||||||||||||||||||
| [41] | 2005 | ✓ | ||||||||||||||||||||||||||||||||||||||
| [43] | 2005 | ✓ | ||||||||||||||||||||||||||||||||||||||
| [44] | 2006 | ✓ | ||||||||||||||||||||||||||||||||||||||
| [3] | 2006 | |||||||||||||||||||||||||||||||||||||||
| [45] | 2007 | ✓ | ||||||||||||||||||||||||||||||||||||||
| [29] | 2007 | ✓ | ||||||||||||||||||||||||||||||||||||||
| [20] | 2008 | ✓ | ||||||||||||||||||||||||||||||||||||||
| [47] | 2008 | ✓ | ||||||||||||||||||||||||||||||||||||||
| [56] | 2008 | ✓ | ||||||||||||||||||||||||||||||||||||||
| [46] | 2008 | ✓ | ||||||||||||||||||||||||||||||||||||||
| [57] | 2009 | ✓ | ||||||||||||||||||||||||||||||||||||||
| [14] | 2009 | ✓ | ||||||||||||||||||||||||||||||||||||||
| [58] | 2009 | ✓ | ✓ | ✓ | ||||||||||||||||||||||||||||||||||||
| [48] | 2009 | ✓ | ✓ | |||||||||||||||||||||||||||||||||||||
| [49] | 2010 | ✓ | ✓ | |||||||||||||||||||||||||||||||||||||
| [22] | 2012 | ✓ | ✓ | |||||||||||||||||||||||||||||||||||||
| [59] | 2012 | ✓ | ||||||||||||||||||||||||||||||||||||||
| [21] | 2012 | ✓ | ✓ | |||||||||||||||||||||||||||||||||||||
| [60] | 2012 | ✓ | ||||||||||||||||||||||||||||||||||||||
| [61] | 2013 | ✓ | ||||||||||||||||||||||||||||||||||||||
| [4] | 2013 | ✓ | ||||||||||||||||||||||||||||||||||||||
| [62] | 2013 | ✓ | ✓ | |||||||||||||||||||||||||||||||||||||
| [18] | 2015 | ✓ | ||||||||||||||||||||||||||||||||||||||
| [23] | 2016 | ✓ | ||||||||||||||||||||||||||||||||||||||
| [50] | 2016 | ✓ | ||||||||||||||||||||||||||||||||||||||
| [63] | 2016 | ✓ | ||||||||||||||||||||||||||||||||||||||
| [19] | 2017 | ✓ | ||||||||||||||||||||||||||||||||||||||
| [64] | 2017 | ✓ | ✓ | |||||||||||||||||||||||||||||||||||||
| [2] | 2017 | |||||||||||||||||||||||||||||||||||||||
| [65] | 2017 | ✓ | ||||||||||||||||||||||||||||||||||||||
| [66] | 2018 | ✓ | ||||||||||||||||||||||||||||||||||||||
| [51] | 2018 | ✓ | ||||||||||||||||||||||||||||||||||||||
| [24] | 2018 | ✓ | ✓ | |||||||||||||||||||||||||||||||||||||
| [67] | 2018 | ✓ | ✓ | ✓ | ||||||||||||||||||||||||||||||||||||
| [8] | 2019 | ✓ | ||||||||||||||||||||||||||||||||||||||
| [9] | 2019 | ✓ | ||||||||||||||||||||||||||||||||||||||
| [68] | 2020 | ✓ | ||||||||||||||||||||||||||||||||||||||
| This paper | ✓ | ✓ | ||||||||||||||||||||||||||||||||||||||
| Scale | Criteria Number | ||||||
|---|---|---|---|---|---|---|---|
| 3 | 4 | 5 | 6 | 7 | 8 | 9 | |
| 3 | 0.1667 | 0.1667 | 0.1667 | 0.1667 | 0.1667 | 0.1667 | 0.1667 |
| 4 | 0.1121 | 0.1529 | 0.1898 | 0.2206 | 0.2527 | 0.2577 | 0.2683 |
| 5 | 0.1354 | 0.1994 | 0.2306 | 0.2546 | 0.2716 | 0.2844 | 0.2960 |
| 6 | 0.1330 | 0.1990 | 0.2643 | 0.3044 | 0.3144 | 0.3221 | 0.3262 |
| 7 | 0.1294 | 0.2457 | 0.2819 | 0.3029 | 0.3144 | 0.3251 | 0.3403 |
| 8 | 0.1309 | 0.2521 | 0.2958 | 0.3154 | 0.3408 | 0.3620 | 0.3657 |
| 9 | 0.1359 | 0.2681 | 0.3062 | 0.3337 | 0.3517 | 0.3620 | 0.3662 |
| Alternative | Bid Price (Rials) |
|---|---|
| A | 782,000,000,000 |
| B | 1,077,195,211,299 |
| C | 717,135,210,855 |
| D | 823,639,532,214 |
| Decision-Maker | Preference of the Best Criterion over Others | |||||||
|---|---|---|---|---|---|---|---|---|
| Best Criterion | MC1 | MC2 | MC3 | MC4 | MC5 | MC6 | ||
| DM01 | MC2 | 2 | 1 | 7 | 3 | 4 | 8 | |
| DM02 | MC2 | 2 | 1 | 6 | 6 | 7 | 9 | |
| DM03 | MC2 | 2 | 1 | 5 | 4 | 3 | 5 | |
| Preference of Other Criteria over the Worst Criterion | ||||||||
| Worst Criterion | MC1 | MC2 | MC3 | MC4 | MC5 | MC6 | ||
| DM01 | MC6 | 9 | 9 | 5 | 6 | 7 | 1 | |
| DM02 | MC6 | 9 | 9 | 4 | 5 | 8 | 1 | |
| DM03 | MC6 | 4 | 5 | 2 | 3 | 3 | 1 | threshold |
| DM01 | 0.1786 | 0.0179 | 0.4821 | 0.1786 | 0.3571 | 0.0000 | 0.3337 | |
| DM02 | 0.1250 | 0.0000 | 0.2083 | 0.2917 | 0.6528 | 0.0000 | ||
| DM03 | 0.1500 | 0.0000 | 0.2500 | 0.3500 | 0.2000 | 0.0000 | ||
| Decision-Maker | Preference of the Best Criterion over Others | |||||
|---|---|---|---|---|---|---|
| Best Criterion | sc01 | sc02 | sc03 | sc04 | ||
| DM01 | sc02 | 1 | 1 | 3 | 2 | |
| DM02 | sc01 | 1 | 3 | 5 | 5 | |
| DM03 | sc01 | 1 | 3 | 4 | 2 | |
| Preference of Other Criteria over the Worst Criterion | ||||||
| Worst Criterion | sc01 | sc02 | sc03 | sc04 | ||
| DM01 | sc03 | 3 | 3 | 1 | 2 | |
| DM02 | sc04 | 7 | 6 | 4 | 1 | |
| DM03 | sc03 | 4 | 2 | 1 | 3 | threshold |
| DM01 | 0.0000 | 0.0000 | 0.0000 | 0.1667 | 0.2681 | |
| DM02 | 0.1000 | 0.6500 | 0.7500 | 0.0000 | ||
| DM03 | 0.0000 | 0.1667 | 0.0000 | 0.1667 | ||
| Decision-Maker | Preference of the Best criterion over Others | ||||||
|---|---|---|---|---|---|---|---|
| Best Criterion | sc05 | sc06 | sc07 | sc08 | sc09 | ||
| DM01 | sc05 | 1 | 6 | 4 | 2 | 3 | |
| DM02 | sc05 | 1 | 5 | 4 | 4 | 5 | |
| DM03 | sc05 | 1 | 4 | 3 | 2 | 3 | |
| Preference of Other Criteria over the Worst Criterion | |||||||
| Worst Criterion | sc05 | sc06 | sc07 | sc08 | sc09 | ||
| DM01 | sc06 | 7 | 1 | 4 | 6 | 3 | |
| DM02 | sc06 | 8 | 1 | 7 | 7 | 5 | |
| DM03 | sc06 | 4 | 1 | 2 | 3 | 2 | threshold |
| DM01 | 0.0333 | 0.0000 | 0.3333 | 0.2000 | 0.1000 | 0.3062 | |
| DM02 | 0.1500 | 0.0000 | 1.1500 | 1.1500 | 1.0000 | ||
| DM03 | 0.0000 | 0.0000 | 0.1667 | 0.1667 | 0.1667 | ||
| Decision-Maker | Preference of the Best Criterion over Others | |||||||
|---|---|---|---|---|---|---|---|---|
| Best Criterion | MC1 | MC2 | MC3 | MC4 | MC5 | MC6 | ||
| DM01 | MC2 | 2 | 1 | 7 | 3 | 4 | 8 | |
| DM02 | MC2 | 2 | 1 | 6 | 6 | 7 | 9 | |
| DM03 | MC2 | 2 | 1 | 5 | 4 | 3 | 5 | |
| Preference of Other Criteria over the Worst Criterion | ||||||||
| Worst Criterion | MC1 | MC2 | MC3 | MC4 | MC5 | MC6 | ||
| DM01 | MC6 | 9 | 9 | 3 | 6 | 6 | 1 | |
| DM02 | MC6 | 9 | 9 | 4 | 5 | 4 | 1 | |
| DM03 | MC6 | 4 | 5 | 2 | 2 | 3 | 1 | threshold |
| DM01 | 0.1786 | 0.0179 | 0.2321 | 0.1786 | 0.2857 | 0.0000 | 0.3337 | |
| DM02 | 0.1250 | 0.0000 | 0.2083 | 0.2917 | 0.2639 | 0.0000 | ||
| DM03 | 0.1500 | 0.0000 | 0.2500 | 0.1500 | 0.2000 | 0.0000 | ||
| Decision-Maker | Preference of the Best Criterion over Others | |||||
|---|---|---|---|---|---|---|
| Best Criterion | sc01 | sc02 | sc03 | sc04 | ||
| DM01 | sc02 | 1 | 1 | 3 | 2 | |
| DM02 | sc01 | 1 | 3 | 5 | 5 | |
| DM03 | sc01 | 1 | 3 | 4 | 2 | |
| Preference of Other Criteria over the Worst Criterion | ||||||
| Worst Criterion | sc01 | sc02 | sc03 | sc04 | ||
| DM01 | sc03 | 3 | 3 | 1 | 2 | |
| DM02 | sc04 | 7 | 3 | 2 | 1 | |
| DM03 | sc03 | 4 | 2 | 1 | 3 | threshold |
| DM01 | 0.0000 | 0.0000 | 0.0000 | 0.1667 | 0.2681 | |
| DM02 | 0.1000 | 0.2000 | 0.2500 | 0.0000 | ||
| DM03 | 0.0000 | 0.1667 | 0.0000 | 0.1667 | ||
| Decision-Maker | Preference of the Best criterion over Others | ||||||
|---|---|---|---|---|---|---|---|
| Best Criterion | sc05 | sc06 | sc07 | sc08 | sc09 | ||
| DM01 | sc05 | 1 | 6 | 4 | 2 | 3 | |
| DM02 | sc05 | 1 | 5 | 4 | 4 | 5 | |
| DM03 | sc05 | 1 | 4 | 3 | 2 | 3 | |
| Preference of Other Criteria over the Worst Criterion | |||||||
| Worst Criterion | sc05 | sc06 | sc07 | sc08 | sc09 | ||
| DM01 | sc06 | 7 | 1 | 3 | 6 | 3 | |
| DM02 | sc06 | 8 | 1 | 2 | 2 | 2 | |
| DM03 | sc06 | 4 | 1 | 2 | 3 | 2 | threshold |
| DM01 | 0.0333 | 0.0000 | 0.2000 | 0.2000 | 0.1000 | 0.3062 | |
| DM02 | 0.1500 | 0.0000 | 0.1500 | 0.1500 | 0.2500 | ||
| DM03 | 0.0000 | 0.0000 | 0.1667 | 0.1667 | 0.1667 | ||
| Decision-Maker | Weight of DM | MC1 | MC2 | MC3 | MC4 | MC5 | MC6 |
|---|---|---|---|---|---|---|---|
| DM01 | 0.3333 | 0.2380 | 0.3807 | 0.0680 | 0.1586 | 0.1190 | 0.0357 |
| DM02 | 0.5000 | 0.2685 | 0.4381 | 0.0895 | 0.0895 | 0.0767 | 0.0377 |
| DM03 | 0.1667 | 0.2161 | 0.3798 | 0.0864 | 0.1081 | 0.1441 | 0.0655 |
| Group average | 0.2496 | 0.4093 | 0.0818 | 0.1156 | 0.1020 | 0.0417 | |
| Decision-Maker | Weight of DM | sc01 | sc02 | sc03 | sc04 |
|---|---|---|---|---|---|
| DM01 | 0.3333 | 0.3514 | 0.3514 | 0.1081 | 0.1892 |
| DM02 | 0.5000 | 0.5590 | 0.2174 | 0.1304 | 0.0932 |
| DM03 | 0.1667 | 0.4655 | 0.1724 | 0.1034 | 0.2586 |
| Group average | 0.4742 | 0.2545 | 0.1185 | 0.1528 | |
| Decision-Maker | Weight of DM | sc05 | sc06 | sc07 | sc08 | sc09 |
|---|---|---|---|---|---|---|
| DM01 | 0.3333 | 0.4110 | 0.0548 | 0.1233 | 0.2466 | 0.1644 |
| DM02 | 0.5000 | 0.4962 | 0.0763 | 0.1527 | 0.1527 | 0.1221 |
| DM03 | 0.1667 | 0.3971 | 0.0882 | 0.1471 | 0.2206 | 0.1471 |
| Group average | 0.4513 | 0.0711 | 0.1419 | 0.1953 | 0.1404 | |
| Main Criteria | Main Criteria Weights | Subcriteria | Local Weights | Global Weights | Rank |
|---|---|---|---|---|---|
| MC1 | 0.2496 | sc01 | 0.4742 | 0.1184 | 2 |
| sc02 | 0.2545 | 0.0635 | 7 | ||
| sc03 | 0.1185 | 0.0296 | 12 | ||
| sc04 | 0.1528 | 0.0381 | 11 | ||
| MC2 | 0.4093 | sc05 | 0.4513 | 0.1847 | 1 |
| sc06 | 0.0711 | 0.0291 | 13 | ||
| sc07 | 0.1419 | 0.0581 | 8 | ||
| sc08 | 0.1953 | 0.0799 | 6 | ||
| sc09 | 0.1404 | 0.0574 | 9 | ||
| MC3 | 0.0818 | sc10 | 1.0000 | 0.0818 | 5 |
| MC4 | 0.1156 | sc11 | 1.0000 | 0.1156 | 3 |
| MC5 | 0.1020 | sc12 | 1.0000 | 0.1020 | 4 |
| MC6 | 0.0417 | sc13 | 1.0000 | 0.0417 | 10 |
| Linguistic Variable | Abbreviation | TFN |
|---|---|---|
| Very Good | VG | (0.9,1,1) |
| Good | G | (0.7,0.9,1) |
| Medium Good | MG | (0.5,0.7,0.9) |
| Fair | F | (0.3,0.5,0.7) |
| Medium Poor | MP | (0.1,0.3,0.5) |
| Poor | P | (0,0.1,0.3) |
| Very Poor | VP | (0,0,0.1) |
| Criteria | sc01(+) | sc02(+) | sc03(+) | sc04(+) | sc05(+) | sc06(+) | sc07(+) | sc08(+) | sc09(+) | sc10(+) | sc11(-) | sc12(+) | sc13(+) | |
|---|---|---|---|---|---|---|---|---|---|---|---|---|---|---|
| Weights | 0.1184 | 0.0635 | 0.0296 | 0.0381 | 0.1847 | 0.0291 | 0.0581 | 0.0799 | 0.0574 | 0.0818 | 0.1156 | 0.1020 | 0.0417 | |
| Alternatives | ||||||||||||||
| A | 60 | 84.55 | 20 | (0.833,0.967,1) | 70 | (0.7,0.867,0.967) | (0.7,0.9,1) | (0.7,0.9,1) | (0.5,0.7,0.9) | (0.9,1,1) | 7.82 × 10¹¹ | 100 | 0 | |
| B | 60 | 36.25 | 25 | (0.767,0.933,1) | 50 | (0.9,1,1) | (0.5,0.7,0.9) | (0.5,0.7,0.9) | (0.3,0.5,0.7) | (0.633,0.833,0.967) | 1.08 × 10¹² | 72 | 100 | |
| C | 60 | 70.45 | 10 | (0.367,0.567,0.767) | 60 | (0.333,0.5,0.667) | (0.3,0.5,0.7) | (0.5,0.7,0.9) | (0.5,0.7,0.9) | (0.4,0.567,0.733) | 7.17 × 10¹¹ | 45 | 100 | |
| D | 48 | 78.05 | 20 | (0.433,0.633,0.833) | 65 | (0.367,0.567,0.767) | (0.5,0.7,0.9) | (0.3,0.5,0.7) | (0.5,0.7,0.9) | (0.3,0.5,0.7) | 8.24 × 10¹¹ | 100 | 0 | |
| A | (−0.05,0.078,0.205) | (0.042,0.042,0.042) | (−0.186,0,0.186) |
| B | (0.335,0.496,0.633) | (0.185,0.185,0.185) | (0.595,0.806,1) |
| C | (0.215,0.395,0.533) | (0.102,0.102,0.102) | (0.219,0.443,0.638) |
| D | (0.233,0.419,0.562) | (0.118,0.118,0.118) | (0.289,0.517,0.716) |
| (−0.05,0.078,0.205) | |||
| (0.042,0.042,0.042) | |||
| −0.050 | 0.042 | ||
| 0.633 | 0.185 |
| Alternatives | Parameters | Rankings (with Respect to) | ||||
|---|---|---|---|---|---|---|
| Si | Ri | Qi | Si | Ri | Qi | |
| A | 0.0778 | 0.0417 | 0.0000 | 1 | 1 | 1 |
| B | 0.4900 | 0.1847 | 0.8018 | 4 | 4 | 4 |
| C | 0.3846 | 0.1020 | 0.4357 | 2 | 2 | 2 |
| D | 0.4081 | 0.1184 | 0.5100 | 3 | 3 | 3 |
Publisher’s Note: MDPI stays neutral with regard to jurisdictional claims in published maps and institutional affiliations. |
© 2021 by the authors. Licensee MDPI, Basel, Switzerland. This article is an open access article distributed under the terms and conditions of the Creative Commons Attribution (CC BY) license (https://creativecommons.org/licenses/by/4.0/).
Share and Cite
Naghizadeh Vardin, A.; Ansari, R.; Khalilzadeh, M.; Antucheviciene, J.; Bausys, R. An Integrated Decision Support Model Based on BWM and Fuzzy-VIKOR Techniques for Contractor Selection in Construction Projects. Sustainability 2021, 13, 6933. https://doi.org/10.3390/su13126933
Naghizadeh Vardin A, Ansari R, Khalilzadeh M, Antucheviciene J, Bausys R. An Integrated Decision Support Model Based on BWM and Fuzzy-VIKOR Techniques for Contractor Selection in Construction Projects. Sustainability. 2021; 13(12):6933. https://doi.org/10.3390/su13126933
Chicago/Turabian StyleNaghizadeh Vardin, Aziz, Ramin Ansari, Mohammad Khalilzadeh, Jurgita Antucheviciene, and Romualdas Bausys. 2021. "An Integrated Decision Support Model Based on BWM and Fuzzy-VIKOR Techniques for Contractor Selection in Construction Projects" Sustainability 13, no. 12: 6933. https://doi.org/10.3390/su13126933
APA StyleNaghizadeh Vardin, A., Ansari, R., Khalilzadeh, M., Antucheviciene, J., & Bausys, R. (2021). An Integrated Decision Support Model Based on BWM and Fuzzy-VIKOR Techniques for Contractor Selection in Construction Projects. Sustainability, 13(12), 6933. https://doi.org/10.3390/su13126933