Article

The Environmental Effects of International Trade in China: Measuring the Mediating Effects of Technology Spillovers of Import Trade on Industrial Air Pollution

1
School of Management, China University of Mining and Technology (Beijing), Beijing 100083, China
2
Division of Resource Economics and Management, West Virginia University, Morgantown, WV 26506, USA
*
Author to whom correspondence should be addressed.
Sustainability 2021, 13(12), 6895; https://doi.org/10.3390/su13126895
Submission received: 24 May 2021 / Revised: 11 June 2021 / Accepted: 14 June 2021 / Published: 18 June 2021

Abstract

:
China is in a strategic phase of an industrial green transformation. Industrial air pollution is a key environmental target for governance. Because import trade is a core channel through which advanced environmental protection technology is absorbed, the question of whether technology spillovers brought about by import trade can reduce industrial air pollution emissions is a topic worth exploring. This paper uses a generalized spatial two-stage least-square (GS2SLS) model to explore the impact of import trade technology spillovers on industrial air pollution emission intensities using panel data from 30 provinces and cities between 2000 and 2017. Economic scale, industrial structure, and technological innovation are used as intermediary variables to test whether they play mediating effects. The results show that: (1) capital and intermediate goods technology spillovers directly reduce industrial air pollution emission intensity and (2) import trade technology spillovers indirectly reduce emission intensities by expanding economic scale, optimizing industrial structure, and enhancing technological innovation through mediating variables. Furthermore, industrial structure optimization and technological innovation have the largest mediating effects on industrial SO2, while economic expansion has the most significant mediating effect on industrial smoke and dust. The mediating effects of technology spillovers from intermediate goods exceed those of capital technology spillovers. Finally, industrial air pollution emission intensity demonstrates both spatial agglomeration and time lag effects. Environmental regulations and energy structure are shown to increase industrial air pollution emissions, while urbanization and foreign direct investment reduce industrial air pollution. Based upon these research results, some pertinent policy implications are proposed for China.

1. Introduction

Since reforming and “opening up” the economy in the late 1970s, China’s industrial development has made remarkable achievements. However, its development model of “pollution first, treatment later” has created environmental concerns (Xiong et al., 2018 [1]). In particular, large amounts of smoke, dust, sulfur oxides, nitrogen oxides, and other harmful gas emissions have adversely affected the health of many people in society. According to the State of 2019 Global Air, up to 1.2 million people in China suffer from various diseases due to long-term exposure to indoor and outdoor air pollution in 2017. In addition, air pollution has shortened the average life expectancy of people in China by approximately 23 months (Health Effects Institute, 2019 [2]), of which outdoor air pollution is responsible for 15 months.
Currently, China is in a period of industrial green transformation; therefore, solving severe ecological environment problems is crucial. Technology is a fundamental driving force for alleviating air pollution. Air pollution control technology not only comes from domestic research and development but also relies on importation of advanced clean production technology. Spillovers from foreign direct investment (FDI) technology and international trade technology have become the main means of technology transfer and diffusion across the globe (Keller, 2010 [3]; Hoekman et al., 2006 [4]). In contrast, limited by factors such as intellectual property protection, external environment, capital conditions, and technology costs, it is undoubtedly a more direct way to use import trade to introduce and absorb advanced foreign technology (Qu, et al., 2013 [5]).
The scale of import trade to China has increased significantly in recent decades. According to China Customs statistics, the total value of China’s import trade from 1998 to 2019 increased from 1.16 trillion and 14.31 trillion yuan, an increase of 1134%. Based upon the structure of imported goods, according to the 2017 China Green Trade Development Report, however, China’s capacities for environmental protection and technological innovation are relatively weak. Some environmentally friendly and energy-saving production process equipment and environmental-monitoring equipment, such as air-, water-, and soil-monitoring equipment and core technologies, basically rely on imports. Some intermediate products with high technological content, such as solar-grade polysilicon, automobile engines, and computer chips, also need to be imported in large quantities. Undeniably, the spillovers of environmental protection technology brought about by import trade can have a profound impact on the improvement of China’s atmospheric environmental quality. Therefore, in this critical period of industrial green development transition and import trade expansion stage for China, the relationships between import trade technology spillovers and industrial air pollution emissions are worthy of further research.

2. Literature Review

In the context of international trade, research on the relationship between technology spillovers and air pollution is reflected mainly in two aspects: (1) the perspective of the environmental effects of trade liberalization, that is, scale, structural, and technical effects, and (2) the perspective of the direct effect of foreign trade technology spillovers.
Theoretical research on the environmental impact of international trade was conducted initially by Grossman and Krueger (1991) [6], who proposed that international trade affects the environmental quality by exerting scale, structural, and technological effects on economic activities. These three environmental effects of trade liberalization have become important theoretical cornerstones for subsequent studies. Some studies have primarily focused on the impact of technological effects of international trade on global air pollution in both developed and developing countries (Managi et al., 2008 [7]; Kukla-Gryz, 2009 [8]). These studies can be categorized into two groups. First, the scale effect surpasses technological and structural effects, causing trade liberalization to aggravate air pollution (Copeland and Taylor, 1994 [9]; Grossman and Krueger, 1995 [10]). Second, technological and structural effects dominate, causing trade to alleviate air pollution (Antweilier et al., 2001 [11]; Cole and Elliott, 2003 [12]; Di Maria and Smulders, 2005 [13]). In studies belonging to the latter category, some scholars focused on microlevels such as the internal regions and industries of individual countries. Based on three major environmental effects noted above, Benarroch and Werder (2006) [14] developed a two-country model, wherein there is final and intermediate goods production to verify whether the technological effect can reduce pollution in the intra-industry trade of intermediate products. For China, Jayanthakumaran and Liu (2012) [15] adopted a simultaneous equations system model to explore the relationships between provincial-level trade, growth, and SO2 emissions. Their result showed that the China’s scale effect from 1990 to 2007 surpassed the technological effect and occupied a dominant position among the three effects. Xu et al., (2020) [16] used a spatial lag model to confirm that the trade liberalization of 279 prefecture-level cities in China has reduced PM2.5 concentration. The main reason is that the impact of technical effects on haze pollution exceeds those of scale and structural effects.
Some scholars have explored the relationship between technology spillovers and environmental pollution based on the direct impacts of foreign trade technology spillovers. Three viewpoints exist regarding the direction of influence. The first viewpoint is that technology spillovers in foreign trade have reduced pollution emissions. Grubb et al., (2002) [17] and Prakash et al., (2007) [18] demonstrated that import and export market prices and the quality of foreign commodities put competitive pressure on domestic companies of importing countries. The competitive effect led companies to upgrade their environmental protection technology to reduce the intensity of pollutant emissions. Youssef (2009) [19] used game theory to prove that, in most cases, the opening of the international trade market increased research and development (R&D) spillovers, thereby reducing the pollutant emission rate of the host country. Liu et al., (2017) [20] performed the spatial index decomposition analysis to suggest that China should adopt an active import policy and incorporate advanced production and emission technologies from developed countries to reduce air pollution. Uddin and Khan (2013) [21] used panel econometric methods, selected 72 countries, and verified that imported environmental goods and services technology spillovers reduce air pollution.
The second viewpoint is that foreign trade technology spillovers increase pollution emissions. Albornoz et al., (2009) [22] alleged that competitive pressure is not conducive to technology spillovers in foreign trade. The effect of competition may reduce the profits of importing countries’ enterprises, which can reduce energy efficiency and technological transformation expenditures. This scenario results in higher emissions of greenhouse gas.
The third viewpoint is that the impact of foreign trade technology spillovers on environmental pollutant emissions is uncertain because of other restricting factors. Lovely and Popp (2011) [23] reported that in constructing a general equilibrium model of free trade, the uncertain relationship between foreign trade technology spillovers and pollutant emissions is affected by environmental regulations. Perkins and Neumayer (2012) [24] noted that whether the energy-saving and emission reduction effects of foreign trade technology spillovers can be effectively used depends on the absorptive capacity of the importing country, such as the level of education. Hao et al., (2021) [25] constructed the China’s intellectual property protection system. Restricted by China’s regional heterogeneity, the interaction between trade technology spillovers and IPP restrains carbon emissions in the western region but increases environmental pollution in the eastern and central regions.
Additionally, less attention has been paid to the relationship between import trade technology spillovers and air pollution, and most studies have explored the effect of import trade technology spillovers on the total factor production efficiency (TFP). In other words, these studies have explored the technology spillover effect of import trade. Coe and Helpman (1995) [26] pioneered the calculation of foreign R&D capital by computing the foreign R&D stocks based on a country’s import share from trading partner countries. Additionally, regression models have been used to empirically analyze whether foreign R&D investment increases the total factor productivity of importing countries. Furthermore, Coe et al., (1997) [27] verified the effect of technology spillovers in 22 industrialized countries from 1971 to 1990 on the total factor productivity of 77 developing countries; on an average, for every 1% increase in the R&D capital stock of industrialized countries, the TFP of developing countries increases by 0.06%. Since then, many other factors have been regularly introduced to modify the research results of Coe and Helpman (1995) [26]. For example, Lichtenberg and Potterie (1998) [28] changed the weightage of the R&D input density, which greatly reduced the total deviation in the original model. Falvey et al., (2002) [29] introduced the concept of private goods and public goods. They proposed that the spillover effects of import trade can only play a role in technology-receiving countries if the technical knowledge is pertaining to public goods. Madsen (2007) [30] weighed foreign R&D with per capita imports and empirically tested that imported trade technology spillovers can double TFP growth. Moreover, other studies have used imported capital goods and intermediate goods to replace the total import trade in the model to measure international technology spillovers (Xu and Wang, 1999 [31]; Kasahara and Rodrigue, 2008 [32]; Cuadros and Alguacil, 2014 [33]). All these studies confirmed that the import trade technology spillovers from developed countries have a positive effect on the TFP, economic growth, and technological innovation of developing countries.
The aforementioned studies suggest that technology spillovers of import trade have an important effect on the economic development and technological innovation of a country. In addition, based on the perspective of the environmental effects of international trade or foreign trade technology spillovers, technology spillovers brought about by international trade channels affect the environmental pollution levels of importing countries. Nevertheless, the existing literature has at least three shortcomings. First, studies have mainly focused on independent research of air pollution caused by trade liberalization. Most of the scholars have rarely studied the relationship between import trade technology spillovers and air pollution from the perspective of R&D spillovers. Second, the environmental effects of technology spillovers of imported trade have not been studied. Existing literature focuses more on the environmental effects of international trade and the technology spillover effects of imported trade. However, the technology spillover, as a transfer of foreign technology, also directly or indirectly affects the air pollution of importing countries via environmental factors. Third, the effect of foreign trade technology spillovers has been studied based on greenhouse gas emissions rather than industrial air pollutant emissions in most of these studies.
Hence, to address the deficiencies of existing research, we contribute to the literature in following three aspects. First, in terms of research content, this paper not only considers the direct effect of the import trade technology spillovers on the intensities of industrial air pollution emission. but also uses mediating effect models to analyze how import trade technology spillovers affect the intensities of industrial air pollution emission through mediating variables of economic scale, industrial structure, and technological innovation. Second, we use the generalized spatial two-stage least squares method (GS2SLS) method for empirical analysis. Compared with other spatial econometric models (i.e., spatial auto regression model, spatial Durbin model, and spatial error model), this method provides more robust research hypothesis testing because even with heteroscedasticity and non-normal distributions, the empirical results still maintain a consistent estimate. Thirdly, in terms of variable construction for estimating China’s imported capital goods and intermediate goods, we innovatively construct the technology spillovers of capital goods and intermediate goods per capita.

3. Research Hypotheses

The literature review section shows that the import trade channel has a certain external effect on a country’s economic growth and technological progress through materialization in commodities. Moreover, international trade affects air pollution by generating scale, structural, and technological effects on economic activities. To sort out these effects of import technology spillovers on air pollution in China along with the channels through which these effects take place, this paper puts forward three research hypotheses. Figure 1 presents the relationships envisioned among technology spillovers of import trade, intermediary variables, and industrial air pollution.
For Hypothesis 1, foreign R&D knowledge indirectly affects the technological progress of importing countries through the import trade channel, thereby promoting economic development. The subsequent expansion of economic scale leads to increasing the intensity of industrial air pollution emissions. If technological progress and government supervision cannot effectively curb the environmental pollution, the scale effect exerted by technology spillover promotes an increase in air pollution.
For much of its development, China’s heavy industry-based industrial structure has been dependent on nonclean energy sources, resulting in a large amount of polluting waste during industrial production and operation (Lam 2005 [34], Jin et al., 2011 [35]). However, imported trade technology spillovers, as a form of diffusion of advanced foreign technology, can promote the shift of industrial structure from primary industries such as agriculture and secondary industries to tertiary industries such as science and technology. Specifically, technology spillovers can reduce the intensity of industries with high pollution and high energy consumption in heavy industries. These high value-added and high-tech imported goods help increase the proportion of tertiary industries in the economy along with their low-pollution and low-emission characteristics. These connections lead to Hypothesis 2 occurring with China’s economy.
Finally, Hypothesis 3 is related to the “increasing intermediate varieties” model (Grossman and Helpman, 1991 [36]). Increases of intermediate varieties can bring about diversified technological spillovers, allowing final products to be more in line with green requirements. In addition, importing high-quality intermediate products into the production of final products can enhance the technological progress of importing countries. This idea is mainly reflected in the “quality ladder model” (Aghion and Howitt, 1990 [37]; Grossman and Helpman, 1991 [38]). Therefore, higher-quality intermediate product inputs lead to more green productivity and environmental protection technology spillovers. Finally, the most direct way of technology spillover is the import of capital goods such as machinery equipment and transportation equipment (Acharya and Keller, 2009 [39]). Capital goods contain highly technical knowledge, leading to more green technology spillovers.
Hypothesis 1.
Technology spillovers from imported trade can bring about economic scale expansion effects. Economic scale expansion has a positive mediating effect on the impact of import trade technology spillover on industrial air pollution emissions. That is, through the effect of economic scale expansion, import trade technology spillovers increase industrial air pollution.
Hypothesis 2.
Import trade technology spillovers can bring industrial structural optimization effects. Industrial structure optimization has a negative mediating effect on the impact of import trade technology spillover on industrial air pollution emissions. Thus, through its effect on optimizing industrial structure, import trade technology spillover reduces industrial air pollution.
Hypothesis 3.
Import trade technology spillovers can bring about technological innovation effects. Technological innovation has a negative mediating effect on the impact of import trade technology spillover on industrial air pollution emissions. That is, through the effect of enhancing technological innovation, import trade technology spillover reduces industrial air pollution.

4. Data and Methods

4.1. Variable Selection

4.1.1. Dependent Variable

Industrial air pollutant emissions mainly refer to industrial waste gas emissions, including sulfur dioxide, smoke, dust, and nitrogen oxides. When measuring industrial air pollution, related research directly selects either industrial waste gas emissions or representative industrial sulfur dioxide as its proxy variables or indirectly constructs a pollution index and pollution intensity (Poon et al. 2006 [40]; Zhang et al., 2014 [41]; Zhao et al., 2019 [42]). Due to data availability, industrial sulfur dioxide emissions (SO2) and industrial smoke and dust emissions (SS) are utilized to measure industrial air pollutants. Since economic development is closely related to environmental pollution, air pollution emission intensity indices are utilized to reflect the level of pollutants discharged from economic activities. Following Birdsal and David (1993) [43], the proportion of industrial air pollution relative to the GDP generated in each region is used to measure the emission intensity. The larger the ratio, the larger the air pollutant emissions per unit of industrial output.

4.1.2. Independent Variables

Technology spillovers due to international trade (CATECH and INTECH) follow a long list of literature pioneered by Coe and Helpman (1995) [26] and Lichtenberg and De La Potterie (1998) [28]. We calculated a weighted-average foreign R&D capital for each province imported from nine main trading partners. Furthermore, we used the population of each province and city to convert foreign R&D capital to technology spillovers of import trade per capita as shown in Equation (1). Import trade technology spillovers are separated into capital goods and intermediate goods as the different nature and structure of these goods may have different impacts on air pollution.
C A T E C H i t = j = 1 9 c a p i t a l i j t G D P j t R D j t / P O P i t , f o r i = 1 , , 30 I N T E C H i t = j = 1 9 I n t e r m e d i a t e i j t G D P j t R D j t / P O P i t , f o r i = 1 , , 30
CATECHit and INTECHit, respectively, indicate technology spillovers of imported capital goods and intermediate goods per capita. For subscripts, t represents year (2000–2017), i denotes the 30 provinces (or province-level cities), and j stands for the trading partners of China, including Japan, Singapore, South Korea, United Kingdom, Germany, France, Italy, Canada, and United States. Additionally, RDjt represents the R&D capital stock of country j in the year t. GDPjt denotes the output level of country j in the year t. POPit denotes population in the year t and i province and city. Technology spillovers due to capital imports and intermediate goods imports are therefore calculated using the percentages of capital and intermediate goods imported from country j over country j’s GDP, respectively. All price indicators are deflated into the 2000 constant price. For details of these calculations, see Appendix A.
The levels of technology spillovers for capital goods and intermediate goods per capita in 30 provinces and cities are shown in Figure 2 and Figure 3, respectively. These figures reflect that regions such as Beijing, Tianjin, Shanghai, Zhejiang, Shandong, Hainan, and Guangdong have relatively high levels of technology spillovers from import trade. This indicates that economically developed regions and coastal areas have frequent international trade exchanges. The large total import trades also bring significant foreign green technology spillovers. Moreover, the levels of technology spillovers per capita from import trade increased between 2000 and 2017 in each province and city.

4.1.3. Mediating Variables

Based upon the three research hypotheses, import trade technology spillovers may bring about impacts on industrial air pollution due to economic scale expansion, industrial structure optimization, and/or technological innovation Therefore, we chose economic scale, industrial structure, and technology patents as intermediary variables to represent these three effects.
Economic scale (GDP): GDP reflects the economic development of a country or region. Compared with GDP per capita, GDP per square kilometer of land (Peng and Wang, 2012 [44]; Gan et al., 2020 [45]) more accurately describes economic scale and economic agglomeration. The specific calculation method is that the proportion of real GDP in the land area of each province and city and GDP are deflated into the 2000 constant price.
Industrial structure (IS): Import trade technology spillovers can not only optimize and adjust the structure of the secondary industry but also increase the share of the tertiary industry. Therefore, referring to the indicator setting utilized by Feng and Wang (2020) [46], we adopted the industrial structure upgrade variable, that is, the shares of the output value of tertiary industry in the output value of the secondary industry. The larger the indicator, the higher the industrial structure center of gravity tends to the tertiary industry, and the more advanced the industrial structure is.
Technological patents (TECH): Approaches to measuring technological innovation include the input of innovation elements, the output of innovation elements, and the data envelopment analysis (DEA) method. Innovation inputs such as human capital and R&D funds may appear to be inefficient in resource utilization and cannot accurately measure technological progress. The input–output algorithm led by DEA can accurately interpret the connotation of total factor productivity and reflect the technology spillover effect. It is also a measurement method that many scholars utilize in their research. However, in China, it is currently difficult to obtain consistent data on the full-time equivalent of industrial labor force and industrial fixed-assets stock. From the perspective of output, the authorized and recognized technological innovations can more truly reflect the corporate technological innovation and the “learning by doing” effect. Therefore, given the above constraints, the number of technology patent grants is used as a proxy variable for technological innovation.

4.1.4. Control Variables

Environmental regulation (ER): Because it is difficult to directly measure environmental regulations, scholars have used indicators such as sewage charges, environmental pollution control investment to GDP, etc. (Wang et al., 2010 [47]; Zhang et al., 2019 [48]). Investment completed in the treatment of industrial pollution can accurately reflect the degree of government regulation of industrial pollution, as well as investment in the treatment of industrial air pollution. Thus, investment in treatment of industrial pollution as a percentage of industrial added value is utilized to approximate the intensity of government environmental regulation.
Energy structure (ES): In China, the economy is still primarily powered by coal-based energy (Xu and Milner, 2008 [49]) which results in large amounts of pollutant emissions, impacting the atmospheric environment (Zhou 2019 [50]). Therefore, energy structure is represented by coal consumption as a percentage of all energy consumption.
Urbanization (CITY): Urbanization concentrates energy consumption and emissions through an agglomeration of many industries, impacting the environmental quality. Hence, the urban population as a proportion of the total population is used to reflect the level of urbanization.
Foreign direct investment (FDI): The “pollution heaven” hypothesis argues that FDI may aggravate host countries’ environmental problems as multinational enterprises transfer high-polluting industries to developing countries. Nevertheless, FDI may also generate green spillovers by bringing advanced clean technology to host countries, alleviating the environmental problems in host countries. Indeed, Li et al., (2019) [51] find that FDI increased air pollution in eastern and central China, while reducing air pollution in western China. This paper uses foreign direct investment as a percentage of GDP in each province to account for the effect of FDI.

4.2. Sample Selection and Data Sources

To ensure the integrity of the data, we selected 30 provinces and cities in China (excluding Tibet, Hong Kong, Taiwan, and Macao) as the research area. Furthermore, the industrial sulfur dioxide emissions and industrial smoke and dust emissions from 2000 to 2017 are from the “China Statistical Yearbook” and “China City Statistical Yearbook” (2001–2018). GDP and research and development of (R&D) nine countries are, respectively, derived from the World Bank database and OECD data. The data of China’s imports of capital goods and intermediate goods from nine countries are selected from the UN Comtrade database. The total import trade volume of 30 provinces and cities from nine countries comes from the statistical yearbooks of all provinces and cities in China (2001–2018). The mediating variables and other control variables are selected from the “China Statistical Yearbook”, “China Environment Yearbook”, and “China Energy Statistical Yearbook” (2001–2018). Descriptive statistics for variables used in this study are presented in Table 1.

4.3. Model Design

We use stata15.1 and Arcgis 10.8 software to perform spatial autocorrelation analysis and build GS2SLS model. Further, spatial autocorrelation analysis includes global spatial autocorrelation test and local spatial autocorrelation test.

4.3.1. Spatial Autocorrelation Analysis

A global spatial autocorrelation test is performed since industrial air pollution intensity may display spatial dependence due to atmospheric circulation along with similar meteorological and economic conditions in neighboring provinces. A Moran’s I test (Moran, 1950 [52]) is used to determine whether there exists spatial autocorrelation between the emissions from adjacent regions. The global Moran’s I is calculated by:
M o r a n I = n i = 1 n j = 1 n w i j x i x ¯ x j x ¯ i = 1 n x i x ¯ 2 i = 1 n j = 1 n w i j
where Moran’s I represents the global Moran index. xi and xj represent the industrial air pollution intensity in regions i and j, respectively. x ¯ . is the average emission intensity across all regions, and wij denotes the spatial weight matrix as shown in Equation (3), calculated as the reciprocal of the nearest distance between province i and province j. Moran’s I test statistic ranges between −1 and 1, with a value closer to 1 (−1) indicating stronger positive (negative) correlation between air pollution intensity in adjacent regions.
w i j = 1 / d i j 0 i j i = j
The global Moran’s I describes the overall distribution status and correlation degree of the industrial air pollution emission intensities, but does not reflect the spatial distribution positions of clustered areas with similar attributes (Anselin, 1995 [53]). However, the local Moran’s I can solve the above problems and accurately reveal the spatial heterogeneity of industrial air pollution emission intensities. Therefore, a Moran scatter plot and LISA (local indicators of spatial association) cluster map are used to measure local spatial autocorrelation. The local Moran’s I is defined as:
I i = n 1 x i x ¯ j = 1 n w i j x j x ¯ j = 1 n x j x ¯
where Ii represents the local Moran index. The positive Ii indicates that the emissions intensities of industrial air pollution in this region are similar to those of neighboring areas, presenting many “high-high” or “low-low” situations. The negative Ii, by contrast, means that the attributes between adjacent areas are not similar, presenting many “high-low” or “low-high” situations. xi, xj, x ¯ , and wij are set as global spatial autocorrelation.

4.3.2. GS2SLS Model Construction

A lagged value of air pollution emission intensity is included in the estimation to avoid missing variables (Zhang et al., 2020 [54]). Thus, a dynamic spatial autoregressive model as shown in Equation (5) is estimated.
A I R i t = λ W A I R i t + γ A I R i t + α X i t + ε i t , ε i t = ρ W ε i t + η i t , λ < 1 a n d ρ < 1
where AIRit represents industrial air pollution emission intensity for either SO2 or SS, W is the spatial weight matrix of known constants, and X i t is a vector of independent variables including technology spillover due to import trade and other control variables. The error term is assumed to follow a first-order spatial autoregressive process.
Equation (5) suffers from endogeneity concerns. In spatial autoregressive models, the dependent variable is assumed to be correlated with a weighted average of the dependent variables from adjacent units (i.e., the spatial lag term). Since the spatial lag term often correlates with the disturbance term of the model, the conventional OLS estimation method is inconsistent. Meanwhile, as in conventional panel data model, the lagged dependent variable is often correlated with the error term since the unobservable components included in the error term are likely to correlate over time.
To address these concerns, a generalized spatial two-stage least-square (GS2SLS) model, outlined by Kelejian and Prucha (1998) [55], is used to analyze the relationship between technology spillover and air pollution. Specifically, a first step, Equation (5) is estimated by two-stage least squares using the spatial and time lags of independent variables as instruments for the two endogenous variables, namely the spatial and time lag terms for air pollution intensity. In the second step, a spatial autoregressive parameter of the error distribution is estimated using generalized moments procedure of Kelejian and Prucha (1997) [56], based on the residuals obtained in Step 1. In the third and final step, Equation (5) is then re-estimated by 2SLS after transforming the model using the estimated via a Cochrane–Orcutt transformation (Zhang et al., 2020 [54]).
According to the above steps, the GS2SLS method can effectively solve endogenous problems, such as missing variables, measurement errors, and the two-way causality between the explanatory variable and the explained variable. The method is convenient to calculate, and the results are robust, which does not cause difficulties due to too large sample size. More importantly, compared to the conventional maximum likelihood estimator, the GS2SLS approach is consistent even if the error terms are heteroscedastic and non-normally distributed. However, every model including the GS2SLS method has certain shortcomings. This methodology is most suitable for large-sample distributions. In case of small samples, there may be issues with the accuracy of results (Kelejian and Prucha, 1998 [55]). In addition, similar to the two-stages least square estimator, the GS2SLS model also requires effective instrumental variables, which are related to the endogenous explanatory variables but not related to the disturbance term. In empirical testing, it is difficult to find suitable instrumental variables. Indeed, this paper uses a large sample size for empirical analysis, which is in line with the large-sample nature of the GS2SLS model. Meanwhile, we also find suitable instrumental variables, namely the spatial lag and time lag of explanatory variables, which pass the overidentification tests (Sargan LM test and Basmann LM test in the following section). Finally, the reliability and scientificity of the approach has been verified.
Following the regression framework of Baron and Kenny (1986) [57], this paper next investigates the channel through which technology spillovers from international trade affect industrial air pollution emissions. The specific process is depicted in Figure 4.
First, Equation (6) is estimated to test whether industrial air pollution emission intensity (Y) is affected by technology spillover of capital goods and intermediate goods from import trade (X).
Next, each of the mediating variables (M), including economic scale, industrial structure, and technology patents are regressed against technology spillover (X) as shown in Equation (7).
Finally, industrial air pollution emission intensity (Y) is regressed against both the main variable of interest (X), and the mediating variables (M) (Equation (8)).
If technology spillover affects air pollution emission intensity via one of the mediating variables, then regressions based on Equations (6)–(8) must satisfy a condition that regression coefficients c,  a , and b are all statistically significant. Further, when the coefficient c’ is statistically significant, indicating that there is a part of the mediating effect, there is otherwise a complete mediating effect. Indeed, Equation (8) can be rewritten as Y = cX + abX + be2 + e3, where ab represents the mediating effect of   M , or how technology spillover affects air pollution emission intensity via economic scale, industrial structure, and/or technological innovation.
What cannot be ignored is that time-delayed factors such as absorptive capacity, patent monopoly, and environmental regulations all are involved in a process for technology spillovers of imported trade affecting environmental pollution. Therefore, it is reasonable to add a time lag term of technology spillover. Using economic scale expansion as an example, Equations (9)–(11) correspond to Equations (6)–(8), respectively. To deal with potential data instability and the dependence on the regression model setting, all variables are transformed into natural logarithms.
ln A I R i t = λ 1 W i t ln A I R i t + γ 1 ln A I R i , t 1 + c ln I M P O R T i , t 1 + α 1 Z i t + e i t
ln G D P i t = λ 2 W i t ln G D P i t + γ 2 ln G D P i , t 1 + c ln I M P O R T i , t 1 + α 2 Z i t + δ i t
ln A I R i t = λ 3 W i t ln A I R i t + γ 3 ln A I R i , t 1 + c ln I M P O R T i , t 1 + b ln G D P i t + α 3 Z i t + π i t
where GDPit represents the economic scale, which is equivalent to the intermediary variable M. IMPORTi,t−1 represents lagging technological spillover of capital goods (CATECH) and intermediate goods (INTECH). Zit represents a vector of control variables.

5. Results

5.1. Spatial Autocorrelation Test

Table 2 plots the global Moran’s I for industrial SO2 and smoke and dust emission intensities for each year, all of which are highly statistically significant. As can be seen, there exists positive spatial autocorrelation across provinces and cities. This result suggests that regions with a high (low) industrial air pollution emission intensity tend to be close to regions with a high (low) emission intensity. The spatial distribution of the two pollutants has significant spatial agglomeration and spatial spillover effects.
Furthermore, the Moran scatter plots (Figure 5 and Figure 6) and LISA cluster maps (Figure 7 and Figure 8) show that most regions of China, such as the northeast and coastal areas, are located in low-low concentration regions. Some provinces and cities, such as central region and Northwest China, are in low-high and high-high concentration regions. A few provinces, such as Shanxi, are located in a high-low concentration region. From the perspective of dynamic evolution, the low-low concentration region of emission intensities has expanded from the eastern part of China to the central and southern regions. However, provinces in the northwest, such as Xinjiang, Gansu, and Qinghai, joined the high-value agglomeration range between 2000 and 2017.

5.2. Estimation Results

Having confirmed the existence of spatial autocorrelation, a GS2SLS method was used to analyze the effect of technology spillovers of import trade on industrial air pollution in China; the results of which are presented in Table 3, Table 4, Table 5 and Table 6. We estimated separate regression models for industrial SO2 and smoke and dust emission intensities, using the two spillover variables as the main variables of interest. As can be seen, all 22 models presented have R2 above 0.5, with most above 0.8, indicating that all models have a high degree of goodness of fit. Further, for all models, the null hypothesis that the instrumental variables are exogenous cannot be rejected using either the Sargan or Basmann overidentification tests. Additionally, both spatial and time lags for the air pollution variables are positive and statistically significant in all specifications. The time lag term indicates that if the industrial air pollution emission intensity in the previous period is high, then the industrial air pollution emission intensity in the subsequent time period continues to increase in a “snowball effect”.
The spatial agglomeration effect means that the intensity of industrial air pollution emissions within one province or city promotes emissions in surrounding areas, which coincides with the analysis of Moran’s tests. There are two main reasons for a positive spatial correlation. First, crossborder environmental pollution generates spatial agglomeration due to natural factors such as circulatory systems of the atmosphere exchanging pollutants between regions. Second, the development of regional integration and industrial connections between enterprises results in the spatial correlation. In the process of enterprises pursuing local market effects and enhancing regional economic competitiveness, related pollution-oriented industries are easily formed in surrounding areas (Zhang et al., 2020 [54]).

5.2.1. Benchmark Regressions

Table 3 results correspond to Equation (6), which detects whether the coefficient c is statistically significant. Estimation results confirm that technological externalities due to imports from developed nations significantly reduce the intensities of industrial air pollution in China. The effect is more evident for smoke and dust emissions, with a 1% increase in technology spillovers due to capital and intermediate goods imports in the previous year (L.lnCATECH and L.lnINTECH) reducing smoke and dust emission intensity (lnSS) by 0.22% and 0.21%, respectively. For SO2 emissions (lnSO2), its intensity is reduced by 0.15% and 0.04% based upon technology spillovers due to capital and intermediate goods import increases of 1% in the previous year, respectively.
Explanations of these findings include those characteristics of imported goods and trading partners. Developed countries with advantages in R&D capital occupy the commanding heights of international technological innovation. The capital goods and intermediate goods imported by China from the nine OCED countries have brought clean production technology through high added value, high technology, and high intensification characteristics. Furthermore, these imports have produced a green spillover effect on China’s industrial air pollution as Chinese industrial enterprises have effectively absorbed technology spillovers from imported trade. For imported goods, industrial enterprises are not limited to simple operation and application but dig deep into the embedded high tech through human resource training, R&D investment, and technical exchanges. Absorption of advanced environmental protection technology results in reduced pollution emissions.
For the control variables, higher percentages of coal consumption in total energy demand significantly increases the air pollution emission intensity. China’s energy consumption is dominated by coal. Coal is the main basic raw material for industrial production and operation. In the process of economic development, the combustion and processing of coal releases a large amount of harmful gases such as sulfur dioxide, soot, and dust.
Environmental regulations have increased the emission intensities of industrial air pollution emissions. We identify two explanations for this positive impact. First, the effectiveness of governance investment often has a long lag, such that it is difficult to show regulatory results in a short period of time. Secondly, air pollution treatment investment accounts for a relatively small proportion of the industrial added value, such that these investments are not meeting the economic and social development needs of China.
Urbanization has a negative effect on industrial air pollution emissions. However, this indicator fails the significance level test. The reason for the difference from the research results of Liu et al., (2017) [20] is that as the urbanization process continues to deepen, more high-quality human capital is pouring into industrialization construction, bringing new materials, processes, and technologies. In addition, urbanization has also led to the development of people’s environmental protection awareness and green consumption.
Contrary to the pollution haven hypothesis (e.g., Al-Mulali et al., 2015 [58]; Feng and Wang 2020 [46]), we found that FDI into China reduces the intensity of industrial air pollution emissions. This finding is consistent with Shahbaz et al., (2012) [59] and Zhao et al., (2019) [42], who argue that FDIs generate technological externalities by bringing advanced green technologies that improve energy efficiency and alleviate environmental degradation in the host country.

5.2.2. Mediating Effects Regressions

Next, the channel through which import trade technology spillovers indirectly affect air pollution in China is investigated. Following the hypotheses in Section 2, three mediation effects, i.e., economic scale expansion, structural optimization, and technology innovation effects, are disentangled using the framework as outlined in Equations (7) and (8).
  • Economic scale expansion effect. Table 4 presents the GS2SLS regression results for the scale expansion effect. Models (5) and (6) show that import trade technology spillovers significantly improve China’s economic development (the scale of the economy). Further, Models (7)–(10) show that GDP and technology spillovers all significantly reduce the intensity of industrial air pollution emissions.
    Combining the regression results in Table 3 and Table 4, the mediating effect of economic scale on lnSO2 due to technology spillovers from capital imports is −0.0277 (the regression coefficient for L.lnCATECH in Model (5), which is 0.3353, multiplied by the regression coefficient of lnGDP in Model (7), which is −0.0826), whereas the direct effect of capital import-related technology spillovers after accounting for the mediating effect is −0.1139. In other words, a 1% increase in technology spillovers from capital imports directly reduces SO2 emission intensity in China by 0.1139% and indirectly reduces SO2 emission intensity by 0.0277% through increased economic scale. The economic scale effect of technology spillovers due to intermediate goods imports on SO2 emission intensity is similar to capital imports, with the mediating effect being −0.0280.
    For smoke and dust emissions, the mediating effects of economic scale for technology spillovers from capital and intermediate goods trade are −0.0591 and −0.0610, respectively. Our results confirm that technology spillovers from both imports of capital and intermediate goods reduce the intensity of industrial air pollution emissions by expanding the scale of the economy. Therefore, Hypothesis 1 is rejected.
    Our explanations for this rejection of Hypothesis 1 include that China is striving to pursue sustainable development between economic quality and atmospheric environment, rather than pursuing the speed of economic development at the expense of the environment. In terms of supply, the expansion of economic scale may bring economies of scale. The intensive effect of production saves energy and reduces resource consumption, which both alleviate air pollution. As far as demand is concerned, the expansion of economic scale has transformed residents’ consumption concepts. When meeting material needs, more residents prefer green consumption and choose environmentally friendly products.
  • Industrial structural optimization effect. Technology spillovers due to international trade may also affect air pollutants by changing the structure of the economy. Indeed, estimation results in Table 5 suggest that the two technology spillover variables both positively affect the industrial structure (lnIS) in each province. In other words, a higher level of R&D stock due to imports increases the ratio of the tertiary industry’s output, such as the service industry, over the total output from secondary industries, such as manufacturing. Furthermore, Models (13)–(16) show that both technology spillover variables and the industrial structure variable negatively affect the intensity of industrial air pollutant emissions. The statistically significant coefficient estimates for the mediating and technology spillover variables across all specifications suggest that trade-imported technology spillovers help reduce air pollution in China by optimizing the industrial structure. The mediating effects of industrial structure amount to −0.0275 and −0.0307 for imports of capital and intermediate goods on SO2 emission, and −0.0342 and −0.0377 for smoke and dust emissions.
    Finally, these results confirm that technology spillovers from capital goods and intermediate goods imports reduce the intensity of industrial air pollution emissions by optimizing industry structure. Therefore, Hypothesis 2 is verified because technology spillovers of imported trade decrease the intensity of industrial air pollution emissions by reducing high-polluting industries and upgrading high-tech industries. Moreover, the spillover of advanced technology may prompt the industrial sector to explore localized production and operation methods for controlling pollution.
  • Technological innovation effect. Table 6 presents the estimation results when technology innovation, as measured by the number of patents granted in each province, is considered as the mediating variable. Models (17) and (18) show that import trade technology spillovers help stimulate technological innovations in each province. Except for lnTECH in Model (22), the two technology spillover variables significantly affect the emission intensities of the two industrial air pollutants after controlling for the number of patents granted in each province. Using the framework outlined in Equations (7) and (8), the mediating effects of technological innovations are −0.0289 and −0.0440 for capital import technology spillovers on SO2 and smoke and dust emission intensities and −0.0292 for intermediate goods import technology spillovers on SO2 emission intensity, respectively. These estimation results suggest that import trade technology spillovers have reduced the emission intensity of industrial air pollutants by improving the technological innovation capacity within importing provinces. Therefore, Hypothesis 3 is verified.
    Environment-friendly commodities imported by China from developed countries, such as environmental pollution prevention and control equipment, environmental monitoring instruments, pollution prevention materials, and related parts and accessories, often are of high quality. Technology spillovers of capital and intermediate goods with high quality can improve the original production process and product technology, causing high production efficiency. Less resource consumption and energy input also reduce industrial pollution. Moreover, the high technology content of capital and intermediate goods imports from developed nations may generate positive externality to human resources and production technology of domestic firms in importing provinces, through demonstration and imitation, personnel training effects, and industry linkage effects. The technological innovation effect triggered by foreign R&D has promoted green production technology, which reduces air pollution.
    However, the regression coefficient of lnTECH in Model (22) is not statistically significant, indicating that the technological innovation effect brought by the technology spillover of intermediate products has not affected industrial smoke and dust emissions. One possible reason is that domestic enterprises have a weak ability to absorb the green innovative technologies brought about by intermediate products. Currently, China’s smoke and dust control technologies and mechanisms are not yet mature. The core knowledge of materialization in environmentally friendly machinery equipment as well as pollution control materials is an important way to break through the bottleneck of treatment technology. Compared with capital goods, enterprises can obtain advanced technology spillover from intermediate products in production and processing without investing large capital and human resources. As a result, more enterprises have shifted their focus on absorbing technology of capital goods. In the long run, coupled with the constraints of employee quality education, capital expenditures, and technical training from exporting countries, enterprises may not be able to absorb technological innovations of intermediate products promptly, resulting in strong emissions of industrial air pollution.

5.3. Comparative Analysis of Mediating Effects

Table 7 compares different values of mediating effects. Comparative analysis mainly includes two aspects. First, based on the three environmental effects, technology spillover has different mediating effects on the two air pollution emissions. On the one hand, industrial structure optimization and technological innovation have the largest mediating effect on industrial SO2. Intermediary effects for SO2 include the technological innovation effect brought about by capital goods technology spillovers of −0.0289 and the structural optimization effect brought about by technology spillovers of intermediate goods of −0.0307. On the other hand, economic expansion has the most significant mediating effect on industrial smoke and dust. The economic scale expansion effect has technological spillovers for capital and intermediate goods, such that a 1% increase reduces emission intensities by 0.0591% and 0.061%, respectively.
Second, compared with the intermediary effect brought by the technology spillover of capital goods and intermediate goods, we find that in addition to the technological innovation effect on industrial smoke and dust, the scale expansion and structure optimization effects of intermediate goods technology spillover are higher than those of capital goods technology spillover. The reason is that the total import trade of intermediate goods in provinces and cities is generally higher than that of capital goods, which leads to the strong intermediary effects of technology spillover. Moreover, intermediate refers to parts of machinery and equipment. Compared with capital goods such as complete sets of machinery and transportation equipment, enterprises can master the green technology nested in intermediate products without more cost, which makes the intermediary function more prominent.

6. Conclusions and Policy Implications

6.1. Research Conclusions

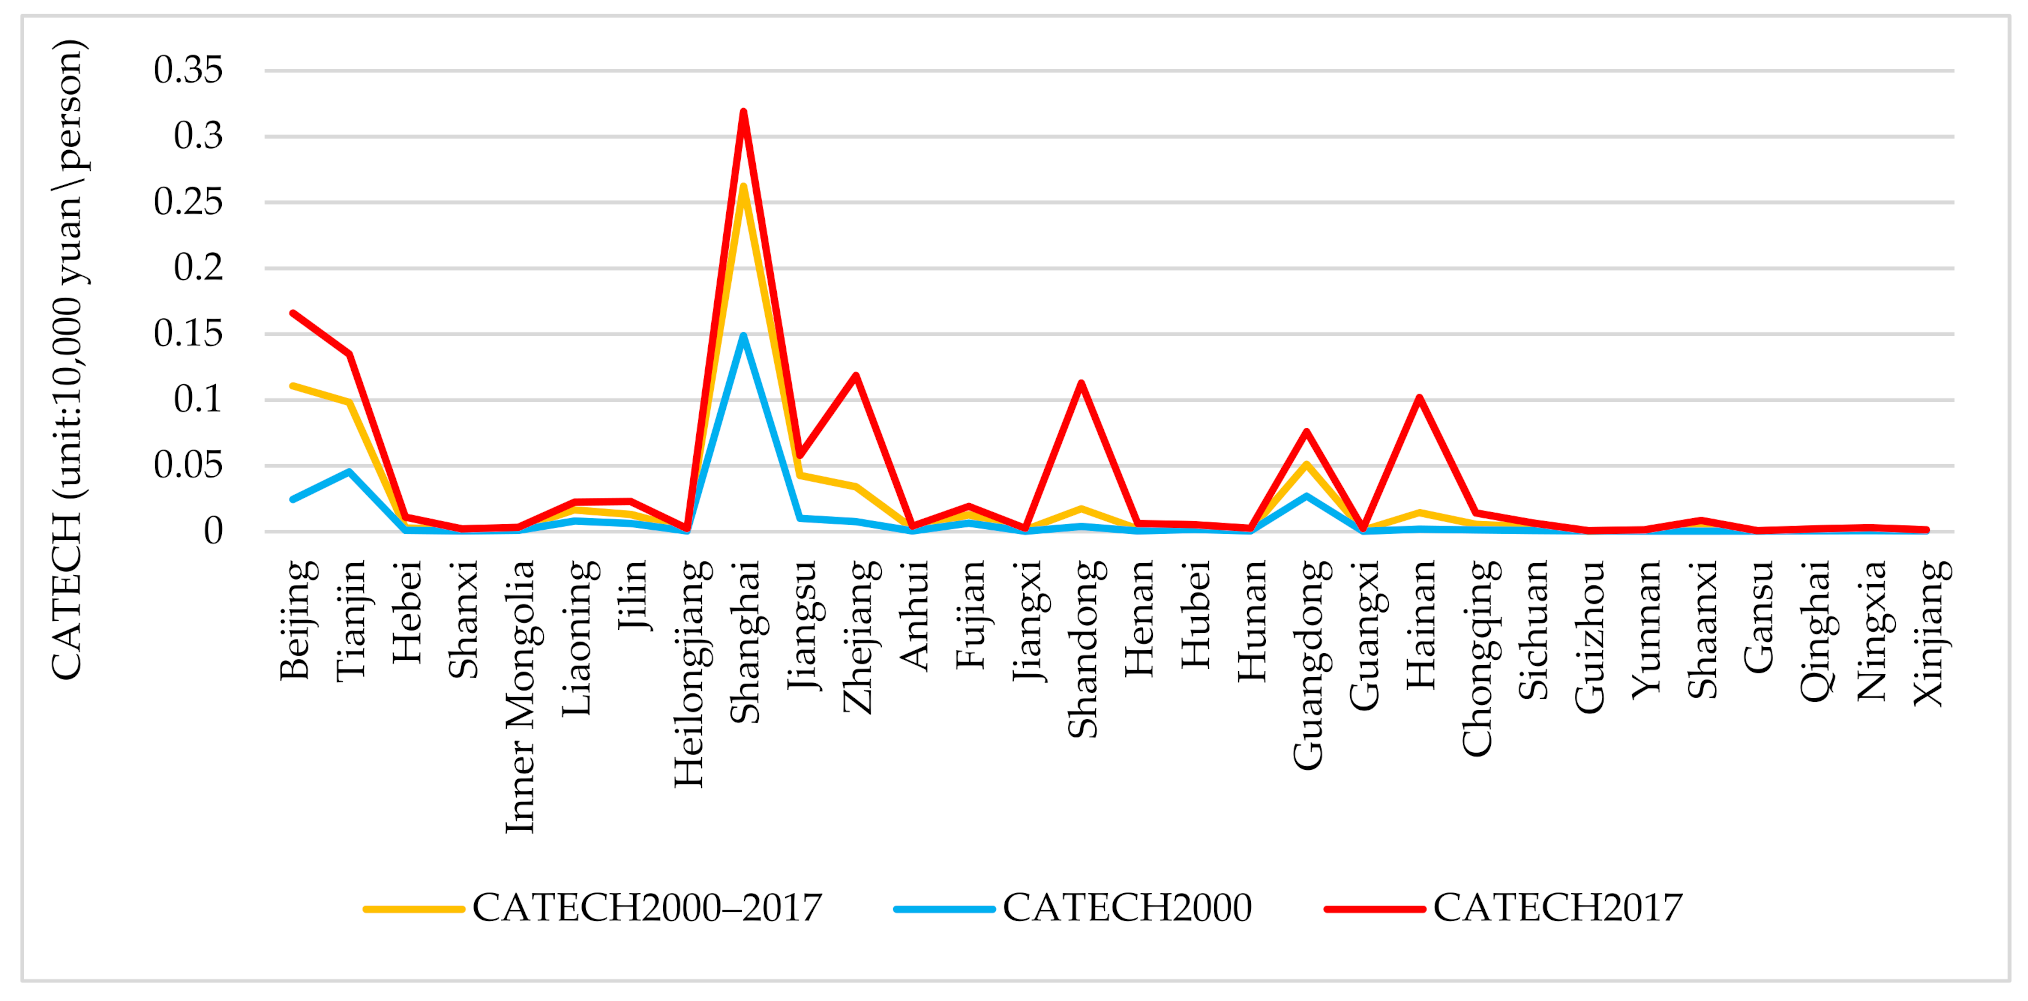
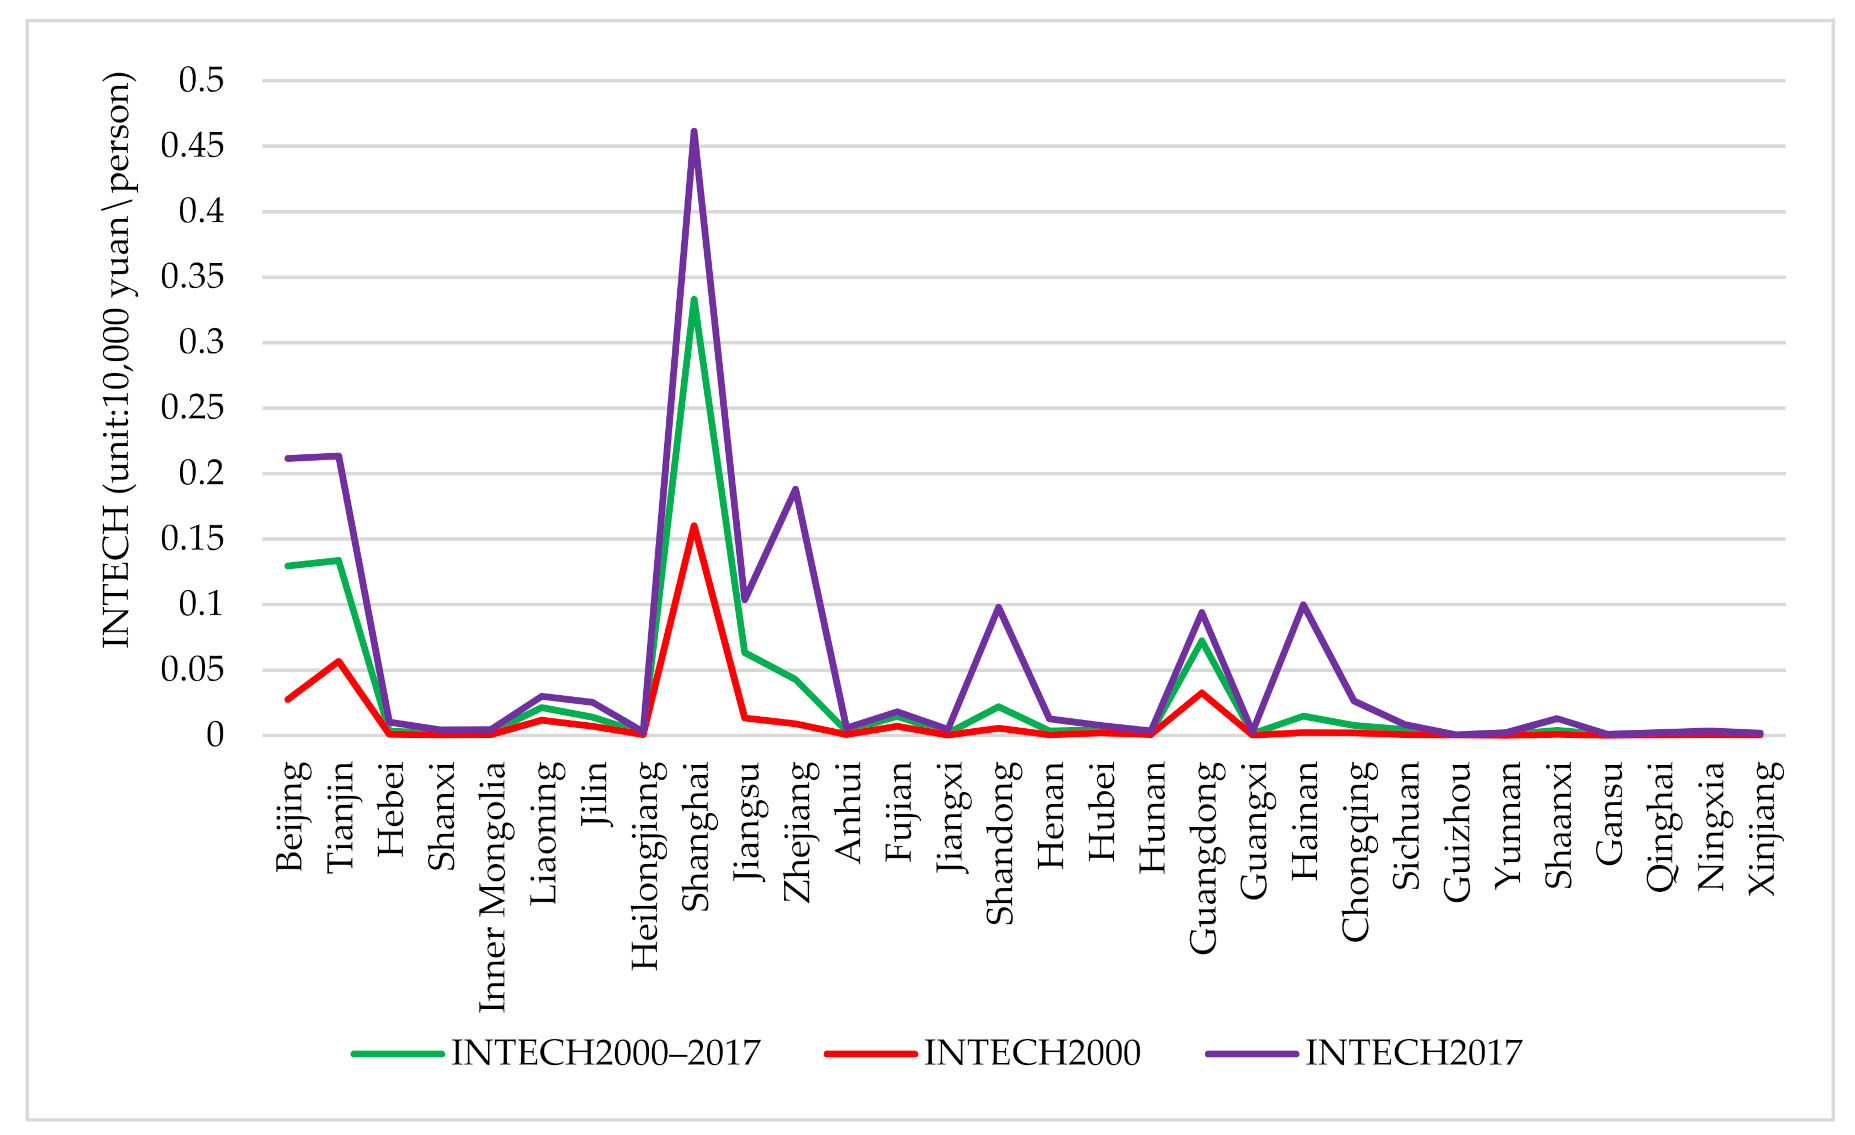
This paper analyzes the impact of import trade technology spillovers on industrial air pollution emission intensity in China by examining the channels through which mediation effects take place. We use panel data from 30 provinces and province-level cities between 2000 and 2017 with industrial SO2 and smoke and dust emissions as measures of air pollution. GS2SLS models are used to examine economic scale, industrial structure, and technological innovation as mediating variables. Our research conclusions are listed below.
We find that technology spillovers due to capital and intermediate goods imports have direct and statistically significant reductions in industrial SO2 and smoke and dust emission intensities. These results indicate that technology spillovers of import trade bring about both energy savings and emission reductions. The capital and intermediate goods that China imports from developed countries are of high added value and are made using highly developed technologies. Chinese industrial enterprises have also effectively absorbed green spillovers by improving human resources, R&D investment, and technical exchanges. The characteristics of imported goods and absorption capacity have reduced industrial air pollution emissions.
In addition to direct effects, trade-imported technology spillovers indirectly help improve air quality in China by expanding the economic scale, optimizing the industrial structure, and improving domestic technological innovation. Specifically, technology spillovers have economic scale expansion, industrial structure optimization, and technological innovation effects. Hence, research findings reject Hypothesis 1, while accepting Hypotheses 2 and 3. Further, the technology innovation effect due to technology spillover of capital goods and the structural optimization effect of technology spillover due to intermediate goods have the largest intermediary effects on industrial SO2 emission intensities; that is, a 1% increase reduces emission intensities by 0.0289% and 0.0307%, respectively. However, the scale expansion effect brought by the two technology spillovers has the largest mediating effects on industrial soot and dust emission intensities; that is, a 1% increase reduces emission intensities by 0.0591% and 0.0610%, respectively. In addition to the technological innovation effect, the mediating effect of the technology spillover due to intermediate goods exceeds that of the technology spillover due to capital import.
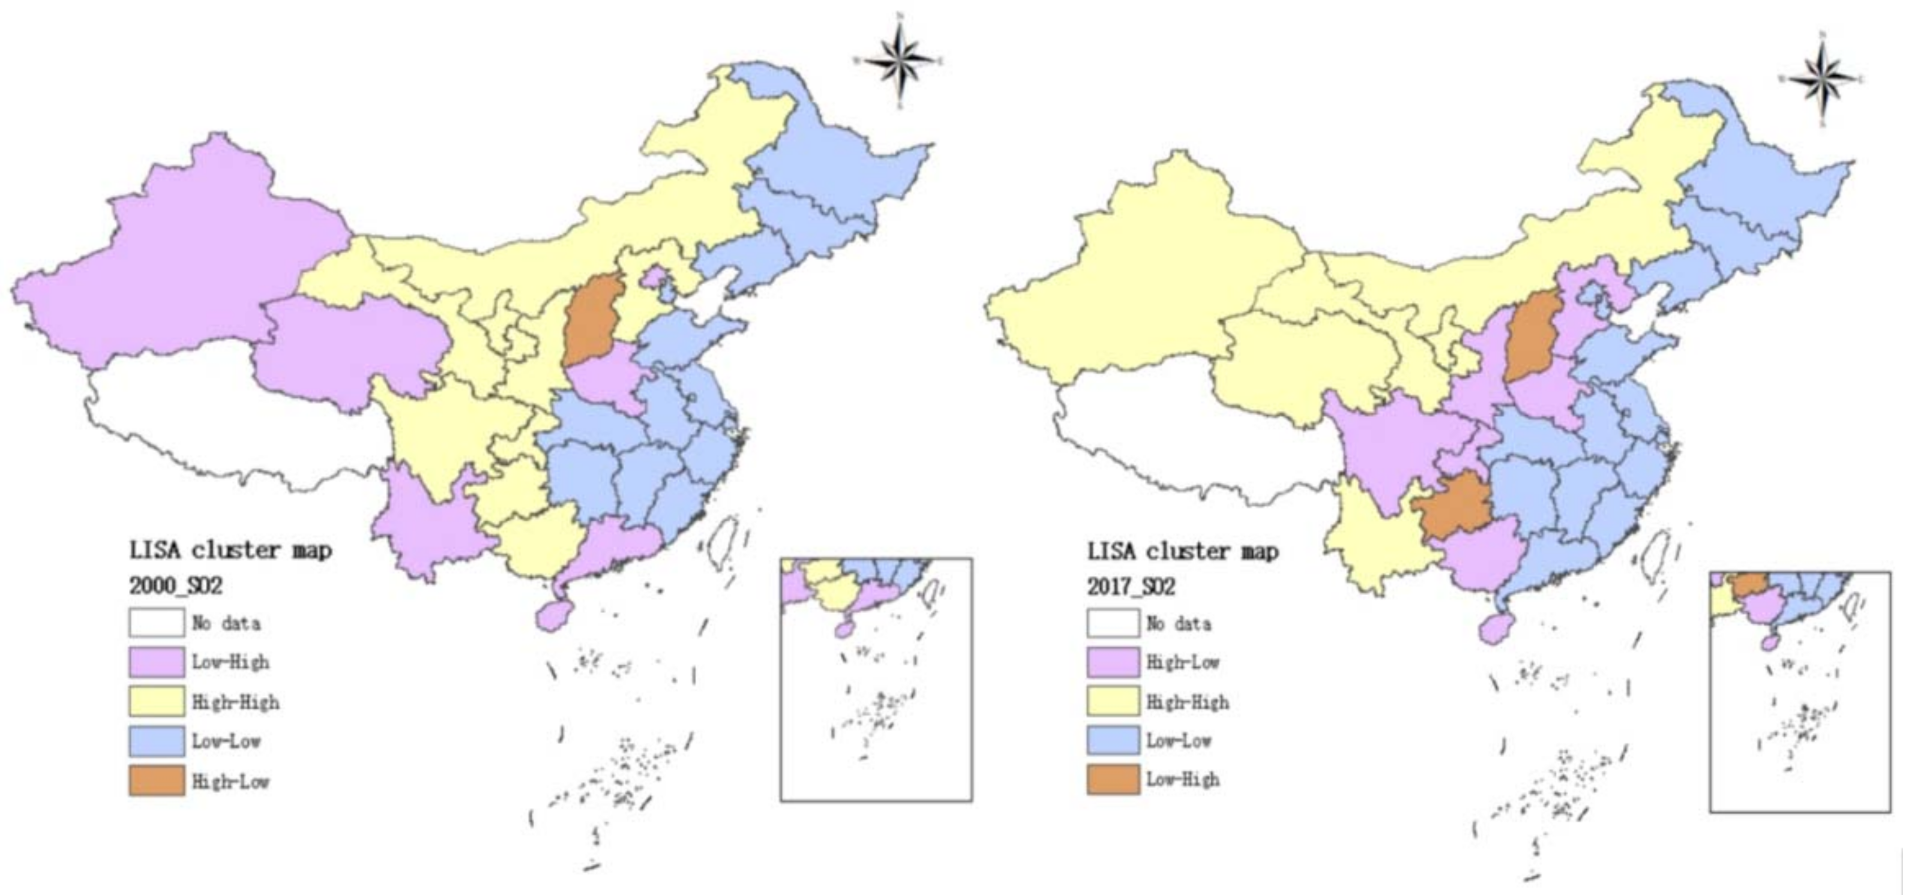
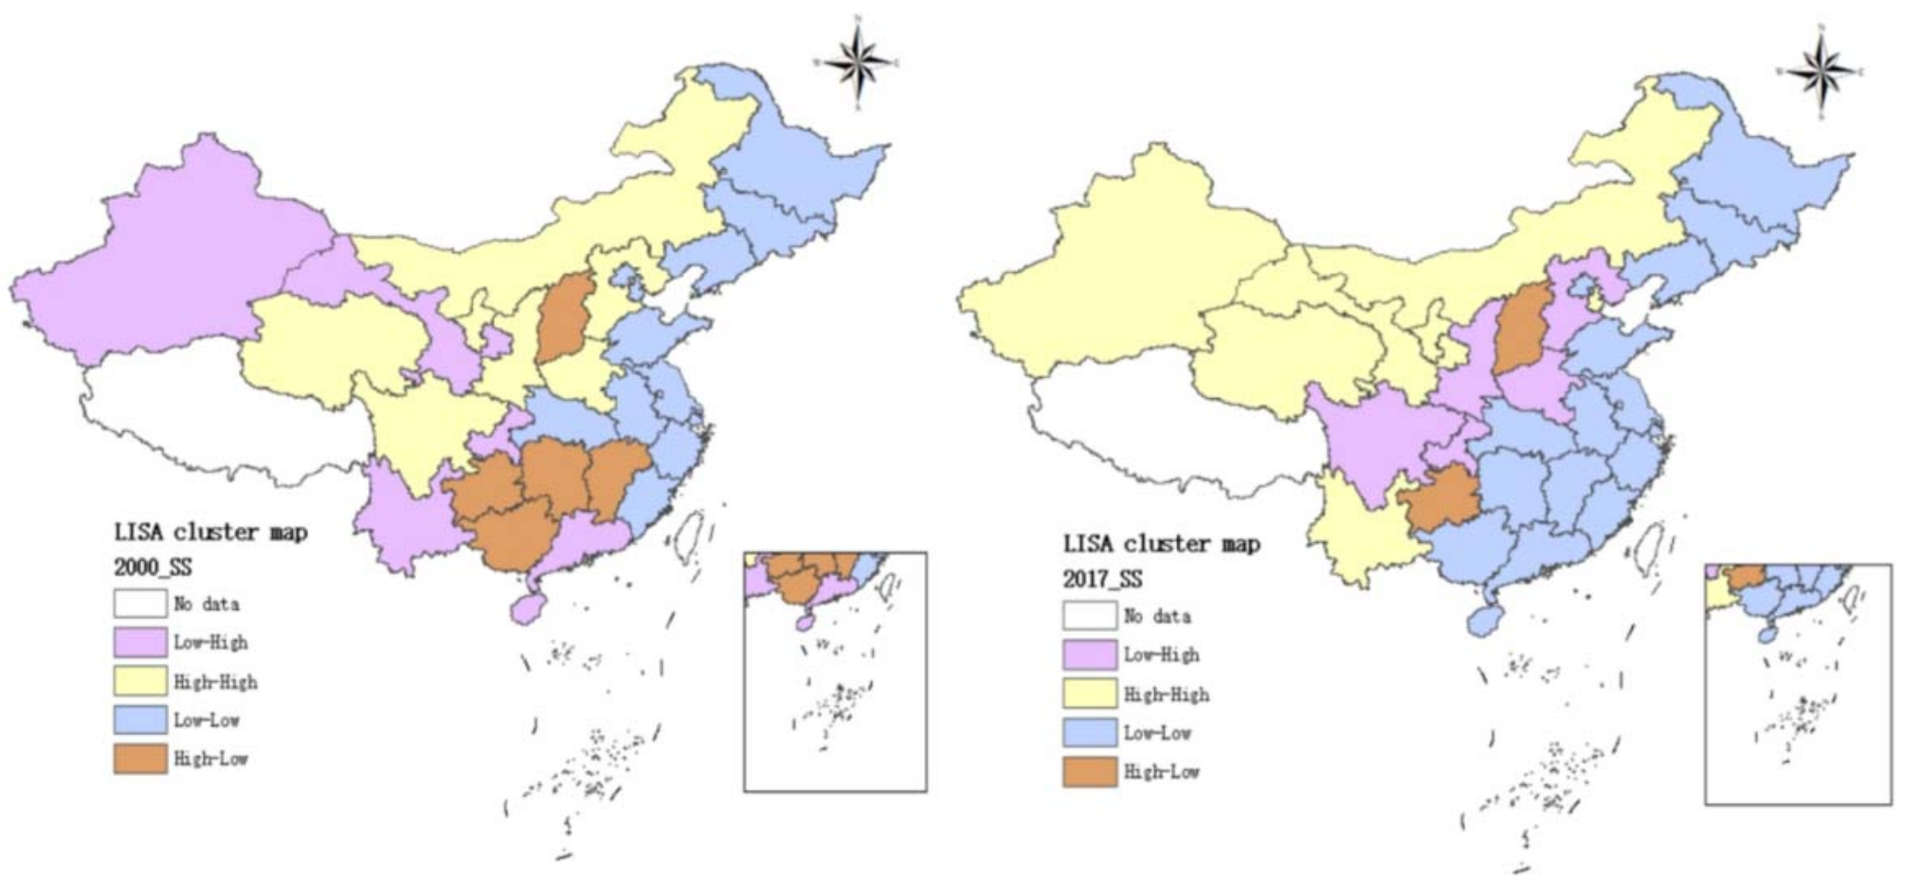
By performing spatial autocorrelation tests and empirical analyses, the emission intensities of industrial SO2, smoke, and dust have obvious spatial spillover effects and time lag effects. From the perspective of spatial agglomeration effects, both the Moran index and GS2SLS models confirm industrial air pollution’s transboundary attributes. Affected by natural factors and the development of regional economic integration, industrial pollutants in a certain area spread to neighboring areas, causing damage to the environment in these neighboring areas. From the perspective of time lag effect, industrial air pollutant emissions in the previous period positively impact air pollutant emissions in the current period, creating a “snowball” effect of compounding air quality deterioration. Furthermore, once the air quality in a certain period deteriorates (improves), the air quality in the subsequent period is likely to be decline (improve).
The regression analysis results showed that energy structure and environmental regulation exacerbated industrial air pollution emissions, whereas the level of urbanization and foreign direct investment reduced environmental pollution emissions. We have four explanations for these results. First, China’s industrial energy consumption is dominated by coal. The burning of coal releases a large amount of harmful gases, aggravating the emission of SO2, smoke, and dust. Second, the lagging effect and inadequacy of investment in industrial environmental governance are important reasons that cause environmental regulations to exacerbate pollution. Third, when urbanization develops to a certain degree, high-quality human resources and green consumption concepts have an inhibitory effect on industrial air pollution. Fourth, FDI’s pollution halo effect is established. FDI causes advanced technology spillovers and enhances industrial air quality.

6.2. Policy Implications

Based on the aforementioned conclusions, we derived the following four policy implications:
The first implication is to expand the scale of import trade. Given that technological spillovers of imported capital goods and intermediate goods have actively reduced the intensity of industrial air pollution emissions by expanding economic scale, optimizing industrial structure, and enhancing technological innovation, further expansion of international trade, especially the importation of clean capital goods and intermediate goods, is an important means to continue improving air quality in China. Speeding up the development process through import trade requires government support and guidance, perhaps in the form of lower tariffs. Examples include reducing and/or exempting tariffs on environmental monitoring equipment, environmental protection materials, and pollution control equipment as well as reducing import tax rates of green products. In addition, the government should increase trade liberalization and facilitation. Measures include simplifying the import process of high-tech products, improving public services for imported environment-friendly products, and optimizing custom clearance services. On the other hand, enterprises should seize the opportunity to expand import trade. They should actively participate in international import trade fairs and purchase imported duty-free cleaning equipment and materials.
The second implication is to strengthen interregional coordination to control industrial air pollution emissions due to existence of spatial spillover effects. Controlling industrial air pollution solely within a single province or city no longer solves environmental problems. Strengthening the inter-regional joint prevention and control mechanism involves three approaches. First, a consultation and decision-making mechanism should be established across regions. Neighboring provinces and cities should jointly formulate emission reduction policies and regulations on industrial air pollution emissions through consultation and exchanges of governments that coordinate the common goals, plans, and action plans of regional cooperative governance. Second, information-sharing mechanisms across regions should be improved. Establishing a regional air pollution forecast, early warning, and monitoring center to share pollution control data is necessary. In addition, provinces and cities that have achieved considerable results in the treatment of industrial air pollution should share advanced experience and technology with surrounding areas. Third, an operable inter-regional benefit balance and compensation mechanism should be established across regions. Based on the experiences of developed countries, each region should realize the balance of ecological compensation and interests through a legal system, responsibility definition, and performance appraisal.
The third implication is choosing the right trading partner. Technological spillovers because of imported goods from nine developed countries have reduced industrial air pollution in China. Developed countries have rich experience and advanced technology for pollution control. Chinese enterprises should expand the scope of import countries and choose to become trade partners with more developed countries. Considering the expertise of developed countries in Asia, China should make use of the superior geographical location and infrastructure to strengthen the construction of free trade zones, facilitating the trading of green products. For distantly located developed countries, market access restrictions and environmental regulations of environmentally protected products should be relaxed to attract more high-quality trade partners.
The final implication is that the causes of industrial air pollution emissions must be determined, and the problem must be solved at inception. Industrial air pollution is caused by human factors such as environmental regulation, energy structure, and foreign direct investment. First, the government should optimize the investment structure, improve the investment efficiency of industrial waste gas treatment, and strengthen the supervision to ensure maximum efficiency of the utilization of government funds. Then, each region should adjust the energy structure, that is, reduce coal consumption and increase the proportion of clean energy. Specific programs include research and development of clean coal technology, increasing the proportion of new energy vehicles, and improving the awareness of green consumption among citizens. Second, provinces and cities should focus on promoting ecological urbanization. The government should rationally plan an intensive and green urban layout. Measures include expediting the upgradation of industrial structure, perfecting transportation facilities, cultivating new environmental protection industries, and rationally utilizing land resources. Finally, enterprises should actively introduce foreign investment in the field of energy conservation and environmental protection. Since this research demonstrated that the “pollution haven” hypothesis is invalid, enterprises should introduce high-quality and clean foreign capital technology and environmental protection standards and pay attention to the development of advanced technology and the green production process of foreign enterprises.

6.3. Limitations and Research Prospects

Although this study provided several valuable insights, it has some limitations.
First, the spillover of imported trade technology not only has an inhibitory effect on industrial sulfur dioxide and smoke and dust, but it also has a certain impact on other environmental pollution such as haze pollution, industrial wastewater, and nitrogen oxides. Moreover, other international technology spillovers, such as technology spillovers due to FDI and export, may also affect environmental pollution. Under the condition of ensuring the availability of data, expanding the research scope of technology spillover and environmental pollution variables is also worth exploring in the future.
Second, we verified the existence of direct and intermediary effects from imported trade technology spillovers on industrial air pollution in China only, but we did not demonstrate whether this research formulation is applicable to other countries. Due to different characteristics of economic development, industrial structure, and technological innovation within each country along with differing scenarios of international trade cooperation and environmental pollution, future research in other countries may find interesting conclusions different from those of China.
Third, the import trade process may be associated with uncertain factors, which could affect the relationships between technology spillovers and industrial air pollution. For example, the uncertainty of trade policies and agreements could affect sustainable green spillovers (Imbruno 2019 [60]), whereas uncertainties over trade regulations may increase the cost of import spillovers (Qu et al., 2021 [61]). These uncertainties potentially have important impacts on industrial air pollution. While we use spatial econometrics and past data to examine the possibilities of correlation relationships between technology spillovers and industrial air pollution, to adequately account for uncertainty, it is necessary to use advanced algorithms and game theory to predict future outcomes accounting for uncertainties (Wu et al., 2018 [62]; Qu et al., 2021 [63]). Therefore, future research regarding the relationship between import trade and environmental pollution incorporating uncertainty analysis is worthy of pursuit.

Author Contributions

Conceptualization, S.Z., A.R.C. and X.L.E.; methodology, S.Z. and A.R.C.; software, X.L.E.; validation, S.Z. and R.D.; formal analysis, S.Z. and A.R.C.; investigation, S.Z.; resources, A.R.C. and R.D.; data curation, S.Z.; writing—original draft preparation, S.Z.; writing—review and editing, A.R.C., X.L.E. and R.D.; visualization, S.Z. and X.L.E.; supervision, A.R.C., X.L.E. and R.D.; funding acquisition, S.Z. and R.D. All authors have read and agreed to the published version of the manuscript.

Funding

This research was funded by a scholarship awarded under the State Scholarship Fund organized by China Scholarship Council, grant number 201906430023, and The National Key Research and Development Program of China, grant number 2017YFC0805600.

Institutional Review Board Statement

Not applicable.

Informed Consent Statement

Not applicable.

Data Availability Statement

The data and estimations command that support the findings of this paper available on request from the first and corresponding authors.

Conflicts of Interest

The authors declare no conflict of interest.

Appendix A. Supplementary Formula Description

In Equation (A1), Capitalijt and Intermediateijt refer to the trade volume of intermediate goods and capital goods imported from country j by province i during period t. The division of intermediate goods and capital goods is based on the UN BEC classification. Two of the BEC classifications are regarded as capital goods, namely, the capital goods (except transport equipment) represented by code 41 and the transport equipment, other, industrial represented by code 521. There are eight items in the BEC taxonomy that can be regarded as intermediate products. However, since the variables are used as technology spillovers, the parts and accessories of capital goods (except transport equipment) represented by code 42 and the parts and accessories of transport equipment represented by code 53 which have high technical contents are the two categories used to represent the trade volume of intermediate goods.
Due to the lack of trade data concerning intermediate goods and capital goods imported from nine countries by 30 provinces and cities in China, the following formula is used to estimate:
C a p i t a l i j t = p r o v i n c e i j t C h i n a j t × C a p C h i n a j t I n t e r m e d i a t e i j t = p r o v i n c e i j t C h i n a j t × I n t e C h i n a j t
where provinceijt represents the total import volume imported from country j by province i during period t; Chinajt denotes the total volume of China’s import from country j in year t; CapChinajt and InteChinajt, respectively, refer to China’s import trade volume of capital goods and intermediate goods from country j in year t.
Additionally, RDjt represents the R&D capital stock of country j during t period. The stock of R&D expenditure in various countries is calculated by reference to the perpetual inventory method of Griliches (1992) [64]. The formula is as follows:
R D 0 = R 0 / ( g + δ ) R D t = R t 1 + ( 1 δ ) R D t 1
where RD0 and RDt are the R&D capital stocks of countries in the year 2000 and subsequent years. Rt−1 are R&D expenditures in the year t−1; g is the average annual growth rate of R&D expenditures between 2000–2017; and δ is the depreciation rate of R&D capital, generally set at 5% (Coe and Helpman 1995 [26]).

References

  1. Xiong, L.; De Jong, M.; Wang, F.; Cheng, B.; Yu, C. Spatial Spillover Effects of Environmental Pollution in China’s Central Plains Urban Agglomeration. Sustainability 2018, 10, 994. [Google Scholar] [CrossRef] [Green Version]
  2. Health Effects Institute. The State of 2019 Global Air. HEI Research Report. 2019. Available online: https://www.stateofglobalair.org/ (accessed on 21 March 2021).
  3. Keller, W. International Trade, Foreign Direct Investment, and Technology Spillovers. In Handbook of the Economics of Innovation; Elsevier BV: Amsterdam, The Netherlands, 2010; Volume 2, pp. 793–829. [Google Scholar]
  4. The World Bank. Global Integration and Technology Transfer; Hoekman, B.M., Smarzynska Javorcik, B., Eds.; World Bank Group: Washington, DC, USA, 2006. [Google Scholar]
  5. Qu, T.; Chen, J.C.; Li, S.M.; Xiang, H. Impact of Inward FDI, Import on Domestic Innovation: Evidence from China. Int. J. Bus. Financ. Res. 2013, 7, 119–136. [Google Scholar]
  6. Grossman, G.M.; Krueger, A.B. Environmental Impacts of a North American Free Trade Agreement; National Bureau of Economic Research: Cambridge, MA, USA, 1991. [Google Scholar]
  7. Managi, S.; Hibiki, A.; Tsurumi, T. Does Trade Liberalization Reduce Pollution Emissions. Discuss. Pap. 2018, 8013. [Google Scholar]
  8. Kukla-Gryz, A. Economic Growth, International Trade and Air Pollution: A Decomposition Analysis. Ecol. Econ. 2009, 68, 1329–1339. [Google Scholar] [CrossRef]
  9. Copeland, B.R.; Taylor, M.S. North-South Trade and the Environment. Q. J. Econ. 1994, 109, 755–787. [Google Scholar] [CrossRef]
  10. Grossman, G.M.; Krueger, A.B. Economic Growth and the Environment. Q. J. Econ. 1995, 110, 353–377. [Google Scholar] [CrossRef] [Green Version]
  11. Antweiler, W.; Copeland, B.R.; Taylor, M.S. Is Free Trade Good for the Environment? Am. Econ. Rev. 2001, 91, 877–908. [Google Scholar] [CrossRef] [Green Version]
  12. Cole, M.A.; Elliott, R. Determining the Trade–Environment Composition Effect: The Role of Capital, Labor and Environmental Regulations. J. Environ. Econ. Manag. 2003, 46, 363–383. [Google Scholar] [CrossRef]
  13. Di Maria, C.; Smulders, S.A. Trade pessimists vs technology optimists: Induced technical change and pollution havens. Adv. Econ. Anal. Policy 2005, 4. [Google Scholar] [CrossRef]
  14. Benarroch, M.; Weder, R. Intra-Industry Trade in Intermediate Products, Pollution and Internationally Increasing Returns. J. Environ. Econ. Manag. 2006, 52, 675–689. [Google Scholar] [CrossRef]
  15. Jayanthakumaran, K.; Liu, Y. Openness and the Environmental Kuznets Curve: Evidence from China. Econ. Model. 2012, 29, 566–576. [Google Scholar] [CrossRef]
  16. Xu, Y.; Fan, X.; Zhang, Z.; Zhang, R. Trade Liberalization and Haze Pollution: Evidence from China. Ecol. Indic. 2020, 109, 105825. [Google Scholar] [CrossRef]
  17. Grubb, M.J.; Hope, C.; Fouquet, R. Climatic Implications of the Kyoto Protocol: The Contribution of International Spillover. Clim. Chang. 2002, 54, 11–28. [Google Scholar] [CrossRef]
  18. Prakash, A.; Potoski, M. Investing up: FDI and the Cross-Country Diffusion of ISO 14001 Management Systems. Int. Stud. Q. 2007, 51, 723–744. [Google Scholar] [CrossRef]
  19. Ben Youssef, S. Transboundary Pollution, R&D Spillovers and International Trade. Ann. Reg. Sci. 2009, 43, 235–250. [Google Scholar] [CrossRef] [Green Version]
  20. Liu, H.; Fang, C.; Zhang, X.; Wang, Z.; Bao, C.; Li, F. The Effect of Natural and Anthropogenic Factors on Haze Pollution in Chinese Cities: A Spatial Econometrics Approach. J. Clean. Prod. 2017, 165, 323–333. [Google Scholar] [CrossRef]
  21. Uddin, S.A.H.; Khan, S. Air Pollutions and Environmental Goods Trade: Re-Visiting the EKC Hypothesis; Social Science Electronic Publishing: Rochester, NY, USA, 2013. [Google Scholar] [CrossRef]
  22. Albornoz, F.; Cole, M.A.; Elliott, R.J.R.; Ercolani, M.G. In Search of Environmental Spillovers. World Econ. 2009, 32, 136–163. [Google Scholar] [CrossRef]
  23. Lovely, M.; Popp, D. Trade, Technology, and the Environment: Does Access to Technology Promote Environmental Regulation? J. Environ. Econ. Manag. 2011, 61, 16–35. [Google Scholar] [CrossRef]
  24. Perkins, R.; Neumayer, E. Do Recipient Country Characteristics Affect International Spillovers of CO2-Efficiency via Trade and Foreign Direct Investment? Clim. Chang. 2011, 112, 469–491. [Google Scholar] [CrossRef] [Green Version]
  25. Hao, Y.; Ba, N.; Ren, S.; Wu, H. How does International Technology Spillover Affect China’s Carbon Emissions? A New Perspective through Intellectual Property Protection. Sustain. Prod. Consum. 2021, 25, 577–590. [Google Scholar] [CrossRef]
  26. Coe, D.T.; Helpman, E. International R&D spillovers. Eur. Econ. Rev. 1995, 39, 859–887. [Google Scholar] [CrossRef] [Green Version]
  27. Coe, D.T.; Helpman, E.; Hoffmaister, A.W. North-South R&D Spillovers. Econ. J. 1997, 107, 134–149. [Google Scholar] [CrossRef] [Green Version]
  28. Lichtenberg, F.R.; De La Potterie, B.V.P. International R&D Spillovers: A Comment. Eur. Econ. Rev. 1998, 42, 1483–1491. [Google Scholar] [CrossRef]
  29. Falvey, R.; Foster, N.; Greenaway, D. North-South Trade, Knowledge Spillovers and Growth. J. Econ. Integr. 2002, 17, 650–670. [Google Scholar] [CrossRef] [Green Version]
  30. Madsen, J.B. Technology Spillover through Trade and TFP Convergence: 135 Years of Evidence for the OECD Countries. J. Int. Econ. 2007, 72, 464–480. [Google Scholar] [CrossRef] [Green Version]
  31. Xu, B.; Wang, J. Capital Goods Trade and R&D Spillovers in the OECD. Can. J. Econ. Revue Can. D Écono. 1999, 32, 1258. [Google Scholar] [CrossRef]
  32. Kasahara, H.; Rodrigue, J. Does the Use of Imported Intermediates Increase Productivity? Plant-Level Evidence. J. Dev. Econ. 2008, 87, 106–118. [Google Scholar] [CrossRef] [Green Version]
  33. Cuadros, A.; Alguacil, M. Productivity Spillovers through Foreign Transactions: The Role of Sector Composition and Local Conditions. Emerg. Mark. Financ. Trade 2014, 50, 75–88. [Google Scholar] [CrossRef]
  34. Lam, P.-L. Energy in China: Development and Prospects. China Perspect. 2005, 2005. [Google Scholar] [CrossRef] [Green Version]
  35. Jin, B.; Lu, T.; Deng, Z. Transformation and Upgrading of China’s Industrial Structure: Process, Issues and Trends. China. Ind. Econ. 2011, 2, 5–15. [Google Scholar]
  36. Grossman, G.M.; Helpman, E. Innovation and Growth in the Global Economy; MIT Press: Cambridge, MA, USA, 1991. [Google Scholar]
  37. Aghion, P.; Howitt, P. A Model of Growth through Creative Destruction. A Model Growth Creat. Destr. 1990. [Google Scholar] [CrossRef]
  38. Grossman, G.M.; Helpman, E. Quality Ladders in the Theory of Growth. Rev. Econ. Stud. 1991, 58, 43–61. [Google Scholar] [CrossRef] [Green Version]
  39. Acharya, R.; Keller, W. Technology Transfer through Imports. Technol. Transf. Imports 2007, 1411–1448. [Google Scholar] [CrossRef]
  40. Poon, J.P.H.; Casas, I.; He, C. The Impact of Energy, Transport, and Trade on Air Pollution in China. Eurasian Geogr. Econ. 2006, 47, 568–584. [Google Scholar] [CrossRef]
  41. Zhang, L.-W.; Chen, X.; Xue, X.-D.; Sun, M.; Han, B.; Li, C.-P.; Ma, J.; Yu, H.; Sun, Z.-R.; Zhao, L.-J.; et al. Long-Term Exposure to High Particulate Matter Pollution and Cardiovascular Mortality: A 12-Year Cohort Study in Four Cities in Northern China. Environ. Int. 2014, 62, 41–47. [Google Scholar] [CrossRef]
  42. Zhao, J.; Zhao, Z.; Zhang, H. The Impact of Growth, Energy and Financial Development on Environmental Pollution in China: New Evidence from a Spatial Econometric Analysis. Energy Econ. 2021, 93, 104506. [Google Scholar] [CrossRef]
  43. Birdsall, N.; Wheeler, D. Trade Policy and Industrial Pollution in Latin America: Where Are the Pollution Havens? J. Environ. Dev. 1993, 2, 137–149. [Google Scholar] [CrossRef]
  44. Peng, B.F.; Wang, Y.L. Quantitative Analysis on Relationship between Urbanization and Economic Growth of China since 2000. J. Wuling 2012, 37, 28–32. [Google Scholar]
  45. Gan, T.; Liang, W.; Yang, H.; Liao, X. The Effect of Economic Development on Haze Pollution (PM2.5) Based on a Spatial Perspective: Urbanization as a Mediating Variable. J. Clean. Prod. 2020, 266, 121880. [Google Scholar] [CrossRef]
  46. Feng, Y.; Wang, X. Effects of Urban Sprawl on Haze Pollution in China Based on Dynamic Spatial Durbin Model during 2003–2016. J. Clean. Prod. 2020, 242, 118368. [Google Scholar] [CrossRef]
  47. Wang, B.; Wu, Y.; Yan, P. Environmental Efficiency and Environmental Total Factor Productivity Growth in China’s Regional Economies. Econ. Res. J. 2010, 45, 95–109. [Google Scholar]
  48. Zhang, M.; Liu, X.; Ding, Y.; Wang, W. How does Environmental Regulation Affect Haze Pollution Governance?—An Empirical Test Based on Chinese Provincial Panel Data. Sci. Total. Environ. 2019, 695, 133905. [Google Scholar] [CrossRef] [PubMed]
  49. Xu, F.; Milner, C. The Pollution Content in China’s Trade. Working Paper. 2018. Available online: http://citeseerx.ist.psu.edu/viewdoc/summary?doi=10.1.1.406.9884 (accessed on 21 March 2021).
  50. Zhou, Z. The Spatiotemporal Dynamics and Socioeconomic Factors of SO2 Emissions in China: A Dynamic Spatial Econometric Design. Atmosphere 2019, 10, 534. [Google Scholar] [CrossRef] [Green Version]
  51. Li, L.; Liu, X.; Ge, J.; Chu, X.; Wang, J. Regional Differences in Spatial Spillover and Hysteresis Effects: A Theoretical and Empirical Study of Environmental Regulations on Haze Pollution in China. J. Clean. Prod. 2019, 230, 1096–1110. [Google Scholar] [CrossRef]
  52. Moran, P.A.P. A Test for the Serial Independence of Residuals. Biometrika 1950, 37, 178. [Google Scholar] [CrossRef]
  53. Anselin, L. Local Indicators of Spatial Association-LISA. Geogr. Anal. 1995, 27, 93–115. [Google Scholar] [CrossRef]
  54. Zhang, K.; Shao, S.; Fan, S. Market Integration and Environmental Quality: Evidence from the Yangtze River Delta Region of China. J. Environ. Manag. 2020, 261, 110208. [Google Scholar] [CrossRef]
  55. Kelejian, H.H.; Prucha, I.R. A Generalized Spatial Two-Stage Least Squares Procedure for Estimating a Spatial Autoregressive Model with Autoregressive Disturbances. J. Real Estate Financ. Econ. 1998, 17, 99–121. [Google Scholar] [CrossRef]
  56. Kelejian, H.H.; Prucha, I.R. Estimation of Spatial Regression Models with Autoregressive Errors by Two-Stage Least Squares Procedures: A Serious Problem. Int. Reg. Sci. Rev. 1997, 20, 103–111. [Google Scholar] [CrossRef] [Green Version]
  57. Baron, R.M.; Kenny, D.A. The Moderator–Mediator Variable Distinction in Social Psychological Research: Conceptual, Strategic, and Statistical considerations. J. Pers. Soc. Psychol. 1986, 51, 1173–1182. [Google Scholar] [CrossRef]
  58. Al-Mulali, U.; Tang, C.F.; Ozturk, I. Does Financial Development Reduce Environmental Degradation? Evidence from a Panel Study of 129 Countries. Environ. Sci. Pollut. Res. 2015, 22, 14891–14900. [Google Scholar] [CrossRef]
  59. Shahbaz, M.; Lean, H.H.; Shabbir, M.S. Environmental Kuznets Curve hypothesis in Pakistan: Cointegration and Granger causality. Renew. Sustain. Energy Rev. 2012, 16, 2947–2953. [Google Scholar] [CrossRef] [Green Version]
  60. Imbruno, M. Importing under Trade Policy Uncertainty: Evidence from China. J. Comp. Econ. 2019, 47, 806–826. [Google Scholar] [CrossRef]
  61. Qu, S.; Yang, H.; Ji, Y. Low-Carbon Supply Chain Optimization Considering Warranty Period and Carbon Emission Reduction Level under Cap-And-Trade Regulation. Environ. Dev. Sustain. 2021, 1–28. [Google Scholar] [CrossRef]
  62. Wu, Z.; Ma, N.; Zeng, Z.; Xu, J. Integer Programming Models to Manage Consensus for Uncertain MCGDM Based on PSO Algorithms. IEEE Trans. Fuzzy Syst. 2018, 27, 888–902. [Google Scholar] [CrossRef]
  63. Qu, S.; Li, Y.; Ji, Y. The Mixed Integer Robust Maximum Expert Consensus Models for Large-Scale GDM under Uncertainty Circumstances. Appl. Soft Comput. 2021, 107, 107369. [Google Scholar] [CrossRef]
  64. Griliches, Z. The Search for R&D Spillovers. Scand. J. Econ. 1992, 94, S29. [Google Scholar] [CrossRef]
Figure 1. Research hypotheses on the mediating effect of imported trade technology spillover.
Sustainability 13 06895 g001
Figure 2. Technology spillovers of capital goods per capita in 30 provinces and cities. Note: CATECH2000–2017 repreScheme 2000. to 2017. CATECH2000 and CATECH2017 denote the technology spillovers of capital goods per capita in each province and city in 2000 and 2017, respectively.
Sustainability 13 06895 g002
Figure 3. Technology spillovers of intermediate goods per capita in 30 provinces and cities. Note: INTECH2000–2017 represents the average values of technology spillovers of intermediate goods per capita in each province and city from 2000 to 2017. INTECH2000 and INTECH2017 denote the technology spillovers of intermediate goods per capita in each province and city in 2000 and 2017, respectively.
Sustainability 13 06895 g003
Figure 4. Flow chart of mediating effect.
Sustainability 13 06895 g004
Figure 5. Moran scatter plot of industrial sulfur dioxide emission intensity in 2000 and 2017.
Sustainability 13 06895 g005
Figure 6. Moran scatter plot of industrial smoke and dust emission intensity in 2000 and 2017.
Sustainability 13 06895 g006
Figure 7. LISA cluster map of industrial sulfur dioxide emission intensity in 2000 and 2017.
Sustainability 13 06895 g007
Figure 8. LISA cluster map of industrial smoke and dust emission intensity in 2000 and 2017.
Sustainability 13 06895 g008
Table 1. Descriptive statistics for dependent and independent variables.
VariableDefinitionObsMeanStd. Dev.MinMaxUnit
SO2Industrial sulfur dioxide emission intensity5401.20721.26880.00327.1467ton/million yuan
SSIndustrial smoke and dust emission intensity5401.05771.30830.00369.7269ton/million yuan
CATECHTechnology spillover of capital goods import trade5400.02380.05480.00020.320410,000 yuan/person
INTECHTechnology spillover of intermediate goods import trade5400.03030.07060.00020.461510,000 yuan/person
GDPEconomic scale5401508.133937.093.655934,792.8510,000 yuan/km2
ISIndustrial structure54096.142648.696849.4374423.6700%
TECHTechnology patent grant5402.22954.45640.007033.270010,000 patent grants
EREnvironmental regulation5400.44910.36890.03592.8000%
ESEnergy structure54053.337415.25940.000082.5300%
CITYUrbanization54049.423315.350713.885089.6000%
FDIForeign direct investment5402.61542.30330.0387315.3600%
Table 2. Moran’s I for industrial sulfur dioxide and smoke and dust emission intensities, 2000–2017.
YearIndustrial Sulfur Dioxide Emission IntensityIndustrial Smoke and Dust Emission Intensity
Moran’s IZ Valuep ValueMoran’s IZ Valuep Value
20000.0542.5670.0100.0412.2390.025
20010.0602.7440.0060.0442.3550.019
20020.0612.8000.0050.0392.2090.027
20030.0713.1360.0020.0422.3620.018
20040.083.3880.0010.0552.6350.008
20050.0923.7830.0000.0572.6840.007
20060.0683.1360.0020.0572.7240.006
20070.0743.3660.0010.0502.5040.012
20080.0853.6970.0000.0542.5550.011
20090.0994.0290.0000.0442.2650.024
20100.1024.0910.0000.0733.2890.001
20110.0793.5740.0000.0783.4470.001
20120.0763.5270.0000.0793.3430.001
20130.0803.6560.0000.0843.5530.000
20140.0833.7230.0000.0903.6660.000
20150.0903.9420.0000.0803.4220.001
20160.0552.9550.0030.0562.7700.006
20170.0482.7470.0060.0623.0820.002
Table 3. Regression results of import trade technology spillovers on industrial air pollution.
Dependent VariableModel (1)Model (2)Model (3)Model (4)
lnSO2lnSO2lnSSlnSS
WlnSO20.6705 ***0.0873 ***
(7.75)(7.61)
L.lnSO20.1877 ***0.0621 ***
(2.92)(2.85)
WlnSS 0.5123 ***0.5046 ***
(7.81)(7.50)
L.lnSS 0.3413 ***0.3290 ***
(8.51)(8.20)
L.lnCATECH−0.1534 *** −0.2200 ***
(−4.21) (−12.40)
L.lnINTECH −0.0359 *** −0.2149 ***
(−4.15) (−12.00)
lnER0.1985 **0.0972 **0.1411 *0.1430 *
(2.10)(2.06)(1.77)(1.75)
lnES0.4087 **0.1758 **0.3017 **0.3148 **
(2.34)(2.39)(2.14)(2.19)
lnCITY−0.0990−0.2661−0.0028−0.0199
(−0.38)(−0.44)(−0.01)(−0.10)
lnFDI−0.1051 *−0.0577 *−0.0549−0.0510
(−1.87)(−1.79)(−0.84)(−0.77)
Constant−2.4948 ***0.9278 ***−3.0204 ***−3.0275 ***
(−2.75)(−2.70)(−4.47)(−4.42)
R20.84440.84100.89690.8942
Sargan LM test3.14502.54230.40190.3167
p value0.36980.46770.93990.9569
Basmann LM test3.14592.54010.39990.3151
p value0.36970.46810.94030.9572
Note: t statistic in parentheses. ***, **, * indicate statistical significance at 1%, 5%, and 10%, respectively.
Table 4. Regression results showing the scale expansion effect.
Dependent VariablesModel (5)Model (6)Dependent VariablesModel (7)Model (8)Dependent VariablesModel (9)Model (10)
lnGDPlnGDPlnSO2lnSO2lnSSlnSS
Mediating and Control Variables
WlnGDP0.5603 ***0.5233 ***WlnSO20.6745 ***0.6729 ***WlnSS0.4757 ***0.4759 ***
(4.01)(3.79) (14.93)(14.65) (6.70)(6.46)
L.lnGDP0.4270 ***0.4273 ***L.lnSO20.1195 ***0.1080 ***L.lnSS0.2335 ***0.2153 ***
(7.11)(7.25) (3.08)(2.75) (4.41)(4.07)
L.lnCATECH0.3353 *** L.lnCATECH−0.1139 *** L.lnCATECH−0.1514 ***
(10.23) (−5.57) (−4.96)
L.lnINTECH 0.3384 ***L.lnINTECH −0.1084 ***L.lnINTECH −0.1426 ***
(10.77) (−5.22) (−4.61)
lnER−0.0136−0.0071lnGDP−0.0826 ***−0.0827 ***lnGDP−0.1763 ***−0.1803 ***
(−0.15)(−0.08) (−3.44)(−3.33) (−3.72)(−3.63)
lnES0.07500.0746lnER0.2065 ***0.2095 ***lnER0.1569 *0.1619 *
(0.67)(0.69) (5.72)(5.72) (1.77)(1.79)
lnCITY−0.4121−0.4215lnES0.4627 ***0.4741 ***lnES0.3824 **0.3993 **
(−1.01)(−1.04) (8.58)(8.72) (2.28)(2.30)
lnFDI0.2159 **0.2042 **lnCITY−0.1315−0.1523lnCITY−0.0907−0.1248
(2.45)(2.40) (−1.17)(−1.34) (−0.47)(−0.63)
Constant3.0258 ***3.2682 ***lnFDI−0.0829 ***−0.0836 ***lnFDI0.01790.0184
(2.86)(3.10) (−2.82)(−2.80) (0.22)(0.23)
R20.88820.8912Constant−2.1837 ***−2.1610 ***Constant−2.3170 ***−2.2440 **
Sargan LM test1.13101.0627 (−5.09)(−4.91) (−2.69)(−2.57)
p value0.76960.7861R20.82850.8243R20.88950.8846
Basmann LM test1.12701.0589Sargan LM test3.21703.0331Sargan LM test0.59890.3939
p value0.77060.7870p value0.52220.5523p value0.96320.9830
Basmann LM test3.21223.0276Basmann LM test0.59510.3912
p value0.52300.5532p value0.96360.9832
Note: t statistic in parentheses. ***, **, * indicate statistical significance at 1%, 5%, and 10%, respectively.
Table 5. Regression results showing the structural optimization effect.
Dependent VariablesModel (11)Model (12)Dependent VariablesModel (13)Model (14)Dependent VariablesModel (15)Model (16)
lnISlnISlnSO2lnSO2lnSSlnSS
Mediating and Control Variables
WlnIS0.3244 ***0.4764 ***WlnSO20.6378 ***0.6378 ***WlnSS0.4943 ***0.4857 ***
(3.58)(5.72) (7.49)(7.49) (8.71)(8.46)
L.lnIS0.0445 ***0.0481 ***L.lnSO20.1256 ***0.1523 **L.lnSS0.3144 ***0.3046 ***
(3.49)(4.46) (3.02)(2.14) (6.58)(6.43)
L.lnCATECH0.0311 *** L.lnCATECH−0.0889 *** L.lnCATECH−0.1931 ***
(5.4700) (−4.35) (−9.74)
L.lnINTECH 0.0335 ***L.lnINTECH −0.1252 ***L.lnINTECH −0.1886 ***
(6.69) (−3.14) (−9.54)
lnER0.01190.0156 *lnIS−0.8850 ***−0.9169 **lnIS−1.0990 ***−1.1257 ***
(1.45)(1.93) (−5.10)(−2.20) (−4.07)(−4.03)
lnES−0.0790 ***−0.0863 ***lnER0.2050 ***0.2227 **lnER0.1645 **0.1660 **
(−6.38)(−7.24) (5.46)(2.28) (2.06)(2.03)
lnCITY0.1717 ***0.1393 ***lnES0.3154 ***0.3419 **lnES0.2051*0.2130 *
(5.78)(4.91) (6.11)(2.26) (1.80)(1.85)
lnFDI−0.0290 ***−0.0231 ***lnCITY−0.11860.0318lnCITY0.19590.1838
(−4.34)(−3.40) (−1.06)(0.12) (1.11)(1.06)
Constant2.1866 ***1.7647 ***lnFDI−0.0424−0.1278 **lnFDI−0.0852−0.0818
(6.89)(6.18) (−1.56)(−2.40) (−1.44)(−1.37)
R20.55720.5493Constant0.80320.5291Constant0.63150.7032
Sargan LM test0.24120.4194 (1.05)(0.31) (0.54)(0.59)
p value0.97070.9362R20.84660.8444R20.90410.9023
Basmann LM test0.24000.4174Sargan LM test4.07113.2715Sargan LM test0.46190.3956
p value0.97090.9366p value0.39650.5135p value0.97710.9828
Basmann LM test4.07163.2670Basmann LM test0.45880.3929
p value0.39640.5142p value0.97740.9831
Note: t statistic in parentheses. ***, **, * indicate statistical significance at 1%, 5%, and 10%, respectively.
Table 6. Regression results showing the technological innovation effect.
Dependent VariablesModel (17)Model (18)Dependent VariablesModel (19)Model (20)Dependent VariablesModel (21)Model (22)
lnTECHlnTECHlnSO2lnSO2lnSSlnSS
Mediating and Control Variables
WnTECH0.5578 ***0.5332 ***WlnSO20.6259 ***0.6256 ***WlnSS0.4184 ***0.4187 ***
(5.65)(5.42) (13.37)(13.20) (3.73)(3.62)
L.lnTECH0.2972 ***0.3013 ***L.lnSO20.1391 ***0.1269 ***L.lnSS0.2920 ***0.2765 ***
(3.84)(4.11) (3.87)(3.49) (6.97)(6.50)
L.lnCATECH0.3555 *** L.lnCATECH−0.1233 *** L.lnCATECH−0.1800 ***
(4.82) (−6.58) (−5.79)
L.lnINTECH 0.3660 ***L.lnINTECH −0.1176 ***L.lnINTECH −0.1732 ***
(5.21) (−6.18) (−5.40)
lnER−0.2486 *−0.2385 *lnTECH−0.0813 ***−0.0798 ***lnTECH−0.1239 *−0.1222
(−1.91)(−1.89) (−3.65)(−3.47) (−1.72)(−1.62)
lnES0.5039 **0.5019 **lnER0.1767 ***0.1805 ***lnER0.10990.1146
(2.07)(2.08) (4.98)(5.02) (1.51)(1.52)
lnCITY−0.2792−0.3202lnES0.4917 ***0.5031 ***lnES0.4042 **0.4186 **
(−0.62)(−0.75) (8.77)(8.86) (2.39)(2.41)
lnFDI0.0066−0.0150lnCITY−0.1112−0.1343lnCITY−0.0391−0.0704
(0.06)(−0.14) (−1.00)(−1.20) (−0.19)(−0.33)
Constant2.03702.4102lnFDI−0.1099 ***−0.1109 ***lnFDI−0.0480−0.0481
(1.06)(1.29) (−3.93)(−3.88) (−0.68)(−0.67)
R20.81930.8276Constant−2.3745 ***−2.3489 ***Constant−2.7462 ***−2.7053 ***
Sargan LM test4.42953.7361 (−5.75)(−5.56) (−3.02)(−2.92)
p value0.21870.2914R20.83490.8305R20.89590.8917
Basmann LM test4.44153.7413Sargan LM test2.21681.9589Sargan LM test0.09860.0677
p value0.21760.2908p value0.69600.7433p value0.99880.9994
Basmann LM test2.20941.9514Basmann LM test0.09780.0672
p value0.69730.7447p value0.99880.9994
Note: t statistic in parentheses. ***, **, * indicate statistical significance at 1%, 5%, and 10%, respectively.
Table 7. Comparative analysis of mediating effects.
Depend VariablesEconomic Scale ExpansionStructural OptimizationTechnology Innovation
Capital GoodsIntermediate GoodsCapital GoodsIntermediate GoodsCapital GoodsIntermediate Goods
lnSO2−0.0277−0.0280−0.0275−0.0307−0.0289−0.0292
lnSS−0.0591−0.0610−0.0342−0.0377−0.0440None
Publisher’s Note: MDPI stays neutral with regard to jurisdictional claims in published maps and institutional affiliations.

