Article

Thermal Feature Detection of Vehicle Categories in the Urban Area

1
Faculty of Transportation Sciences, Czech Technical University, 110 00 Prague, Czech Republic
2
Faculty of Engineering, Czech University of Life Sciences Prague, 165 00 Prague, Czech Republic
*
Author to whom correspondence should be addressed.
Sustainability 2021, 13(12), 6873; https://doi.org/10.3390/su13126873
Submission received: 30 April 2021 / Revised: 11 June 2021 / Accepted: 14 June 2021 / Published: 17 June 2021
(This article belongs to the Special Issue Smart Cities, Smart Mobilities, and Sustainable Development of Cities)

Abstract

:
The main goal of this paper is to present new possibilities for the detection and recognition of different categories of electric and conventional (equipped with combustion engines) vehicles using a thermal video camera. The paper presents a draft of a possible detection and classification system of vehicle propulsion systems working with thermal analyses. The differences in thermal features of different vehicle categories were found out and statistically proved. The thermal images were obtained using an infrared thermography camera. They were utilized to design a database of vehicle class images of passenger vehicles (PVs), vans, and buses. The results confirmed the hypothesis that infrared thermography might be used for categorizing the vehicle type according to the thermal features of vehicle exteriors and machine learning methods for vehicle type recognition.

1. Introduction

The number of automobiles has been increasing in urban areas in the whole world for decades. It results in serious problems such as congestions, traffic accidents, and air pollution, affecting cities on a social, economic, and environmental level [1]. Electromobility offers a solution to reduce carbon dioxide emissions and become less dependent on gasoline or diesel fuels. It becomes popular in current society due to reduced energy consumption [2]. In traffic planning, management, and transport, data collection is a necessity for the continuity and safety of all vehicle types [3]. In the past, collecting traffic data was limited to manual methods or induction loop collection in stationary positions [4]. These methods neither provide spatial coverage and complex information nor capture all road user types [5]. Hence, video detection systems were developed. They are the most promising from nonintrusive methods [6]. Traffic control needs to be adapted in real time to monitor traffic flow, traffic classification, and other traffic engineering parameters in this way [7].
Vehicle types can be categorized according to their emissions standards, type of engine unit used for tolling ways, emission zones, emergency, safety systems, etc. Their categorization has to be integrated with intelligent transportation system (ITS) applications to keep them competitive in the future.
Nowadays, traffic control systems rely on conventional methods using visual cameras. Their accuracy under bad weather conditions, such as fog, snow, or heavy rain is low [5]. This is the reason to replace or complement them with other equipment, e.g., infrared cameras. Thermal images of vehicles promise to provide continuous and reliable detection of vehicles regardless of surrounding conditions [5].
Several approaches to automated vehicle detection and classification have been carried out in recent years. For example, the article [8] proposes a classification based on the length of the vehicle. A similar approach is chosen by another author [9]. Image-based methods are developed to speed up the video detection processing time. Systems for image classification based on artificial intelligence have been adopted [10,11,12,13]. Reliable detection of battery electric vehicles (BEVs) can be considered for preferences at light-controlled intersections, activation in parking and smog situations, or application of toll systems. BEV detection can support the further development of electromobility in cities.

Application of Vehicle Detection and Classification

More areas of science, industry, and common life take advantage of the power of computing in computer science. Automatic techniques for processing and classifying vehicle bodies are attractive due to their wide applicability in various real-world applications [10]. Classification and its reliable processing methods need to be adopted in real conditions, e.g., rain, fog, low picture resolution at night, or shadow contrast during the day.
Video vehicle detection systems have become popular in many agglomerations [13], and they offer an interesting alternative to other sensors [14]. Detection methods and visual object tracking have been developed in recent years [15,16,17]. Their disadvantage is the use of conventional video cameras resulting in incapability to recognize all road users. Thermal video cameras expand their potential [5]. The video system fulfills the requirements if it is able to work in varied conditions, e.g., illumination, dark, shade, or other weather conditions [16].
Therefore, commonly used methods to detect vehicle headlamps or taillights are used with day and night detection algorithms [17,18]. The Japanese team [18] mentions that it is essential to control traffic flow to detect vehicles 24/7 with high accuracy regardless of changing conditions.
Other sources refer to a comparison of video technologies, particularly conventional visual cameras and thermal cameras [5], that processed captured video using the object tracker available video in the open source project of computer vision “Traffic Intelligence’’ [19]. Individual pixels are first detected and tracked from frame to frame and saved as body trajectories using Kanade–Lucas–Tomasi tracking algorithm [20].
The article [21] presents the possibilities of the classification of vehicles based on their temperature signs. The topic focuses on the different thermal features of various vehicle categories (passenger car, van, and truck) and distinguishes them by statistical analysis of their thermal images. The detection area is an entire image with a predefined height and width. Only a part of the temperature histogram is statistically evaluated as a representative part for the vehicle category. Author [18] uses the windshield and its surroundings as a detection area. However, this method proved to be less accurate in winter due to windshield temperatures similar to ambient temperatures [22]. Authors [23] use both visual and thermal video for detection. They focus the detection area on the grille area and headlight.
Artificial intelligence (AI) and machine learning offer other promising solutions for processing image data. Authors [11] propose a methodology that uses machine learning for the classification of vehicles from a visual video at night. The authors [24] provide a solution using histograms of oriented gradients and support vector machines, which is one of the machine learning methods. Deep convolutional neural networks are currently auspicious processing techniques [24,25]. Convolution neural networks (CNNs) are deep learning algorithms that have already obtained countless results on computer vision tasks [25,26,27,28]. Pixel classification is a topic for research in computer vision. It provides different solutions such as semi-supervised learning [25] or fully convolutional architecture [29,30].
Every car generates heat while driving [21]. Even an electric engine car generates heat, although it is significantly less heat, compared to conventional vehicles. The heat is emitted to the body of the vehicle, and it is easily visible on the front mask and vehicle side, perhaps on defined places of the rear end. The goal of this paper is to present a method for reliable detection of thermal features of different vehicle categories, particularly battery electric vehicles (BEVs) and internal combustion engine vehicles (ICEVs).

2. Materials and Methods
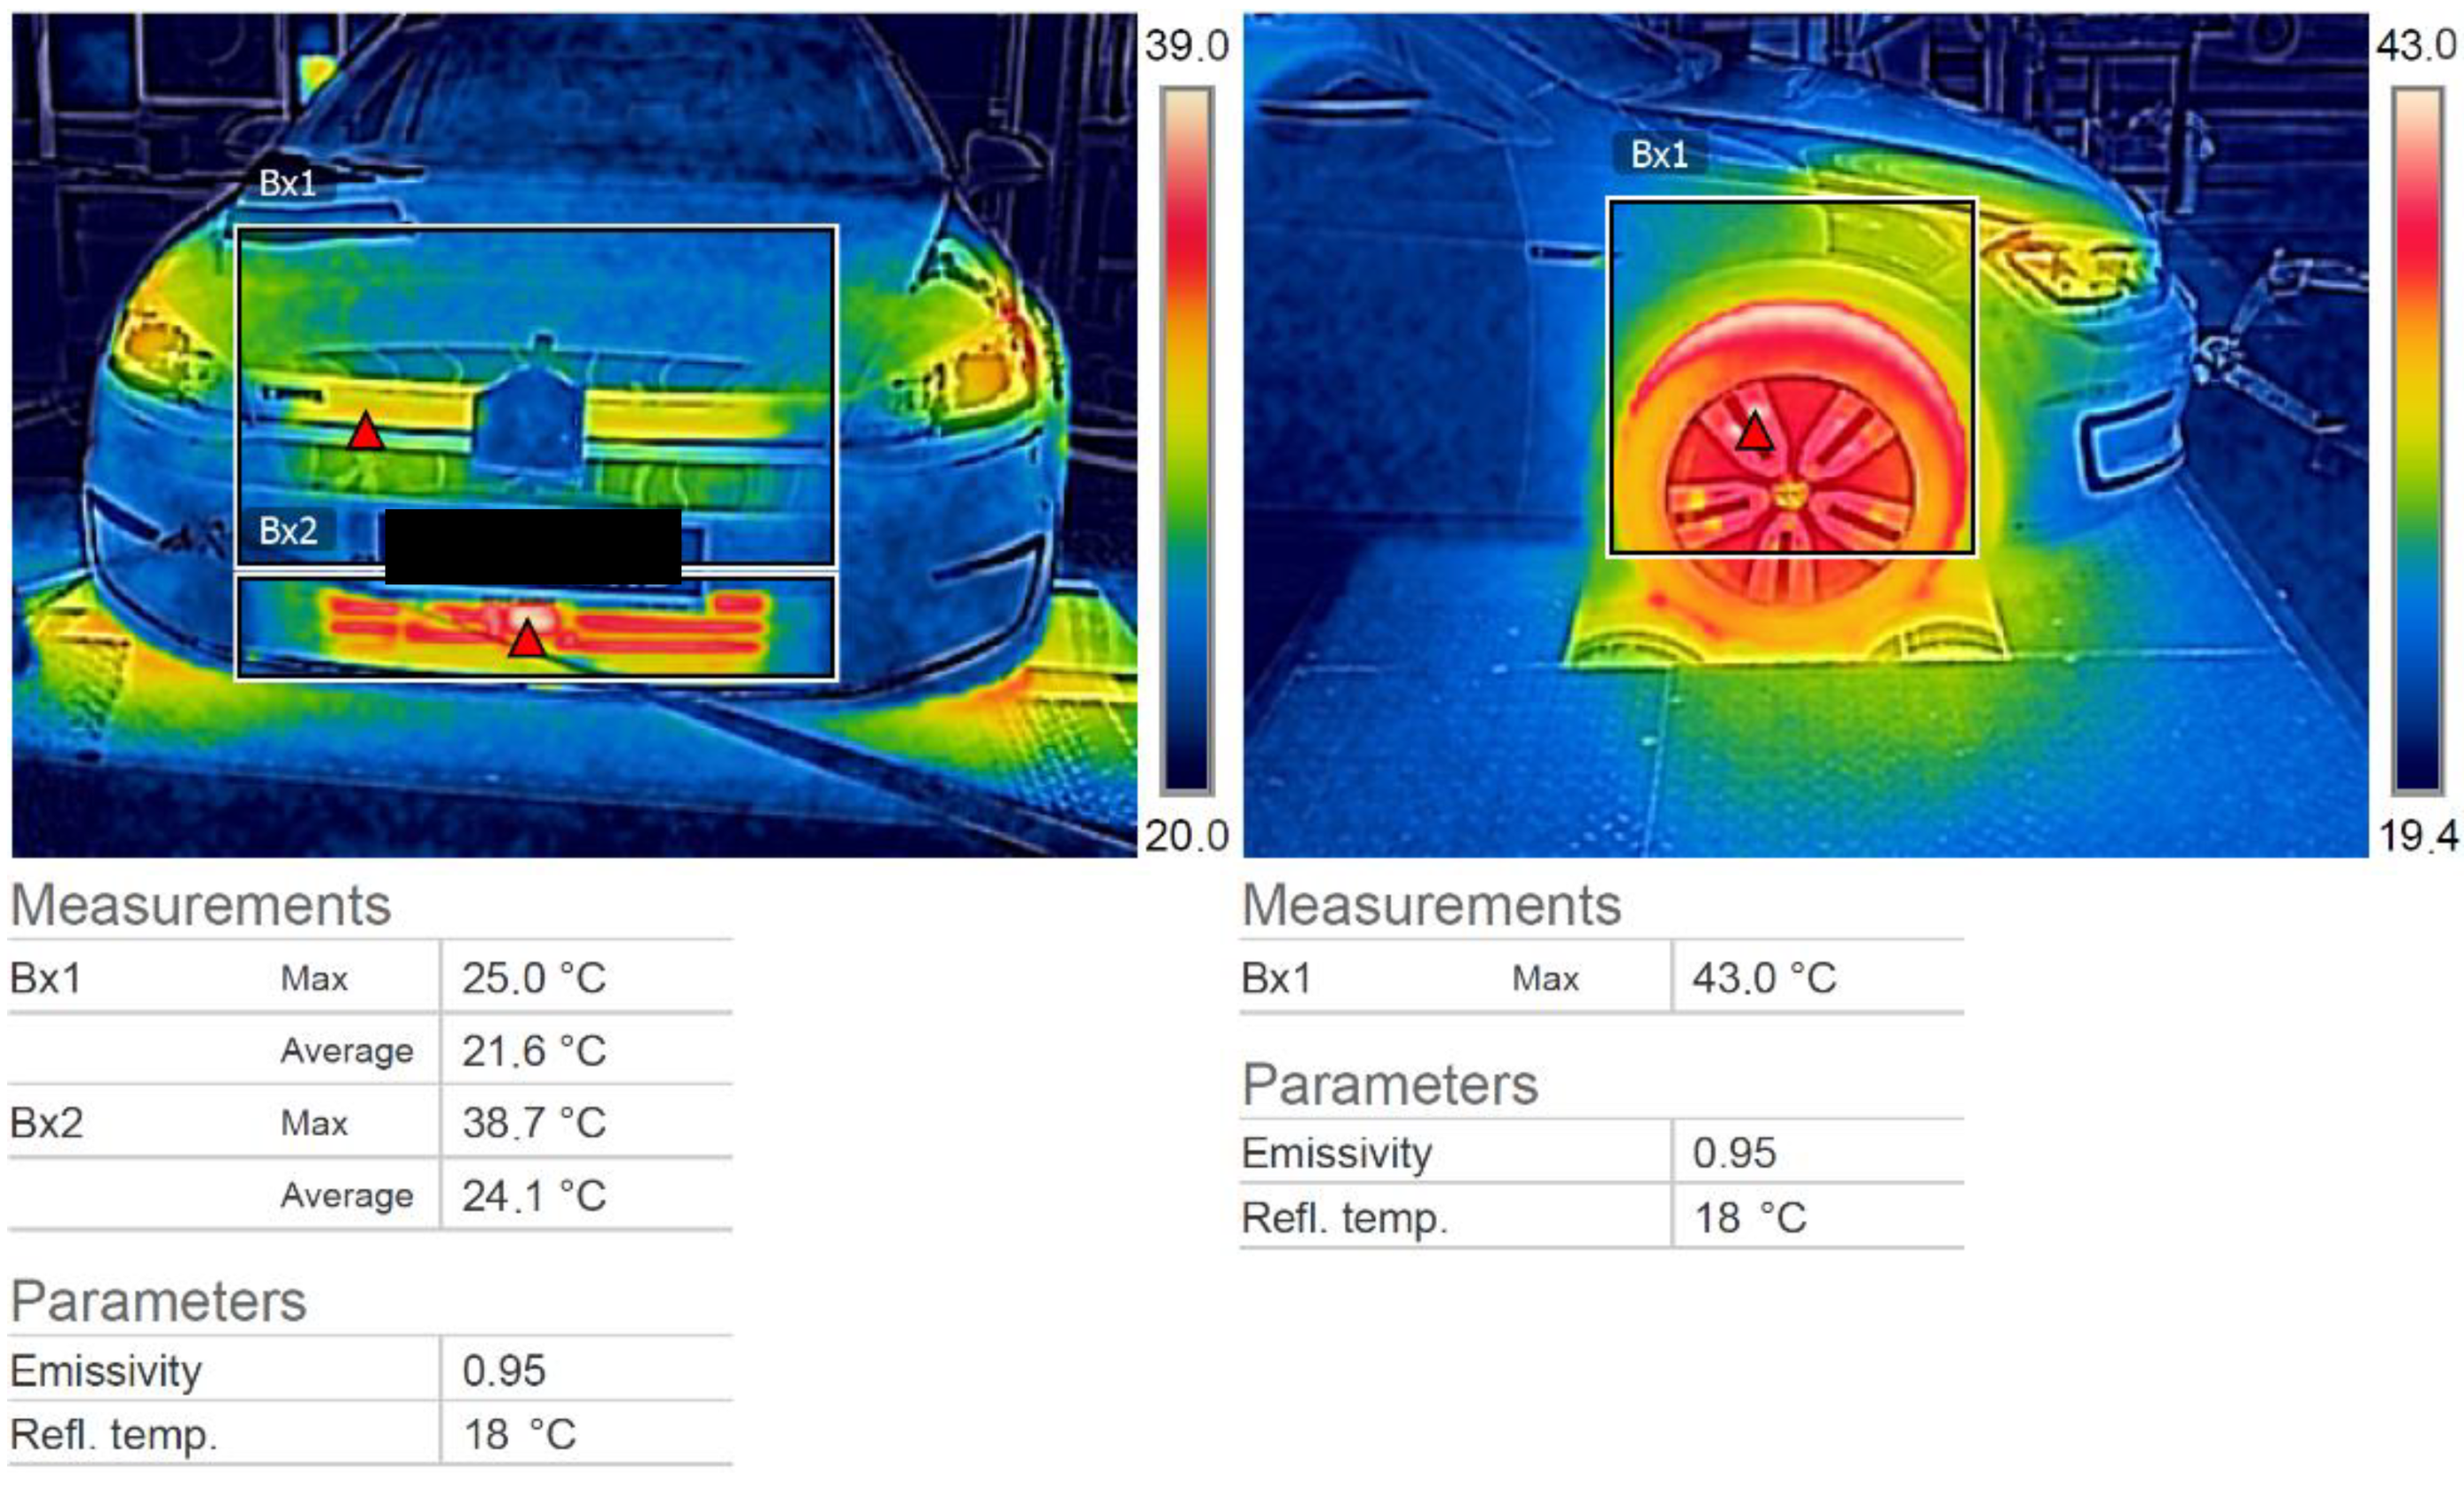
Methods used for categorizing electric and combustion engine vehicles apply the principles of thermal analyses. The thermal and visual RGB camera was used to record vehicles passing by. The thermographic software FLIR Tools + (version 5.1, FLIR Systems, Wilsonville, OR, USA) [31] analyzed a radiometric video stream from a thermal camera. The same software separated the thermal values of pixels from the image. The thermal video stream was recorded by the FLIR E5 camera (FLIR Systems, Wilsonville, Oregon, USA). The used camera can record radiometric images in *.jpg format as well as a radiometric video stream in *.seq format, with possible conversion to *.avi format. FLIR E5 was equipped with an uncooled microbolometer detector, with a resolution of 90 × 120 pixels and speed rate of 30 fps [32], where individual pixels corresponded to the surface temperature of the measured object at a given point. The image resolution (thermogram) was determined by thermal detector resolution. The continual traffic stream was recorded by RGB camera VISION (Bucheon, Republic of Korea) with a resolution of 1280 × 720 pixels and speed rate of 30 fps [33]. The resolution of the RGB camera Hikvision that recorded traffic plates of vehicles was 1920 × 1080 pixels with a 50 fps speed rate [34].
The results of our previous measurements were presented in the previous paper [35] and they showed a significant difference between the temperature patterns of electric and combustion engine vehicles. The biggest difference in the detected released temperatures was up to dozens of degrees Celsius in a temperature-controlled laboratory environment. The tables below thermogram pictures (Figure 1) show that the highest temperature reached in the detection window and the average temperature of the detection area.
The results of electric vehicle (Figure 1) are the following:
(a)
Mild temperature affects the vehicle body in detection area Bx1, and the warmest heat source is the radiator and its grille;
(b)
Second experimentally measured area Bx2 is independently heated due to passive radar and would distort the measurement.
Figure 2 of the combustion vehicle thermogram shows a considerably affected area of the vehicle mask, primarily the grille area and vehicle hood. Temperatures are up to 40 °C higher in comparison with an electric vehicle. Respectively, the average temperature of the detection area is more than 10 °C higher by the same vehicular speed, time of drive, and the same settings of measured parameters of the thermal camera. This temperature gap confirms the results of measurements carried out on the vehicle side. The electric vehicle has heated tires and the surrounding area of the wheel arch and its fender are slightly warmed, compared to the combustion engine vehicle (Figure 2). In addition to warm tires, the wheel arch and front fender area are more affected by higher temperatures.
According to a comparison of the average and maximum temperatures of the individual thermograms, there are clear differences in the highest measured temperature in specific sections of vehicle bodies.
Different color pallets represent the temperature values (Figure 3). We used the original grayscale due to the reason of creating a thermal image database to train the neural network to classify vehicle categories.

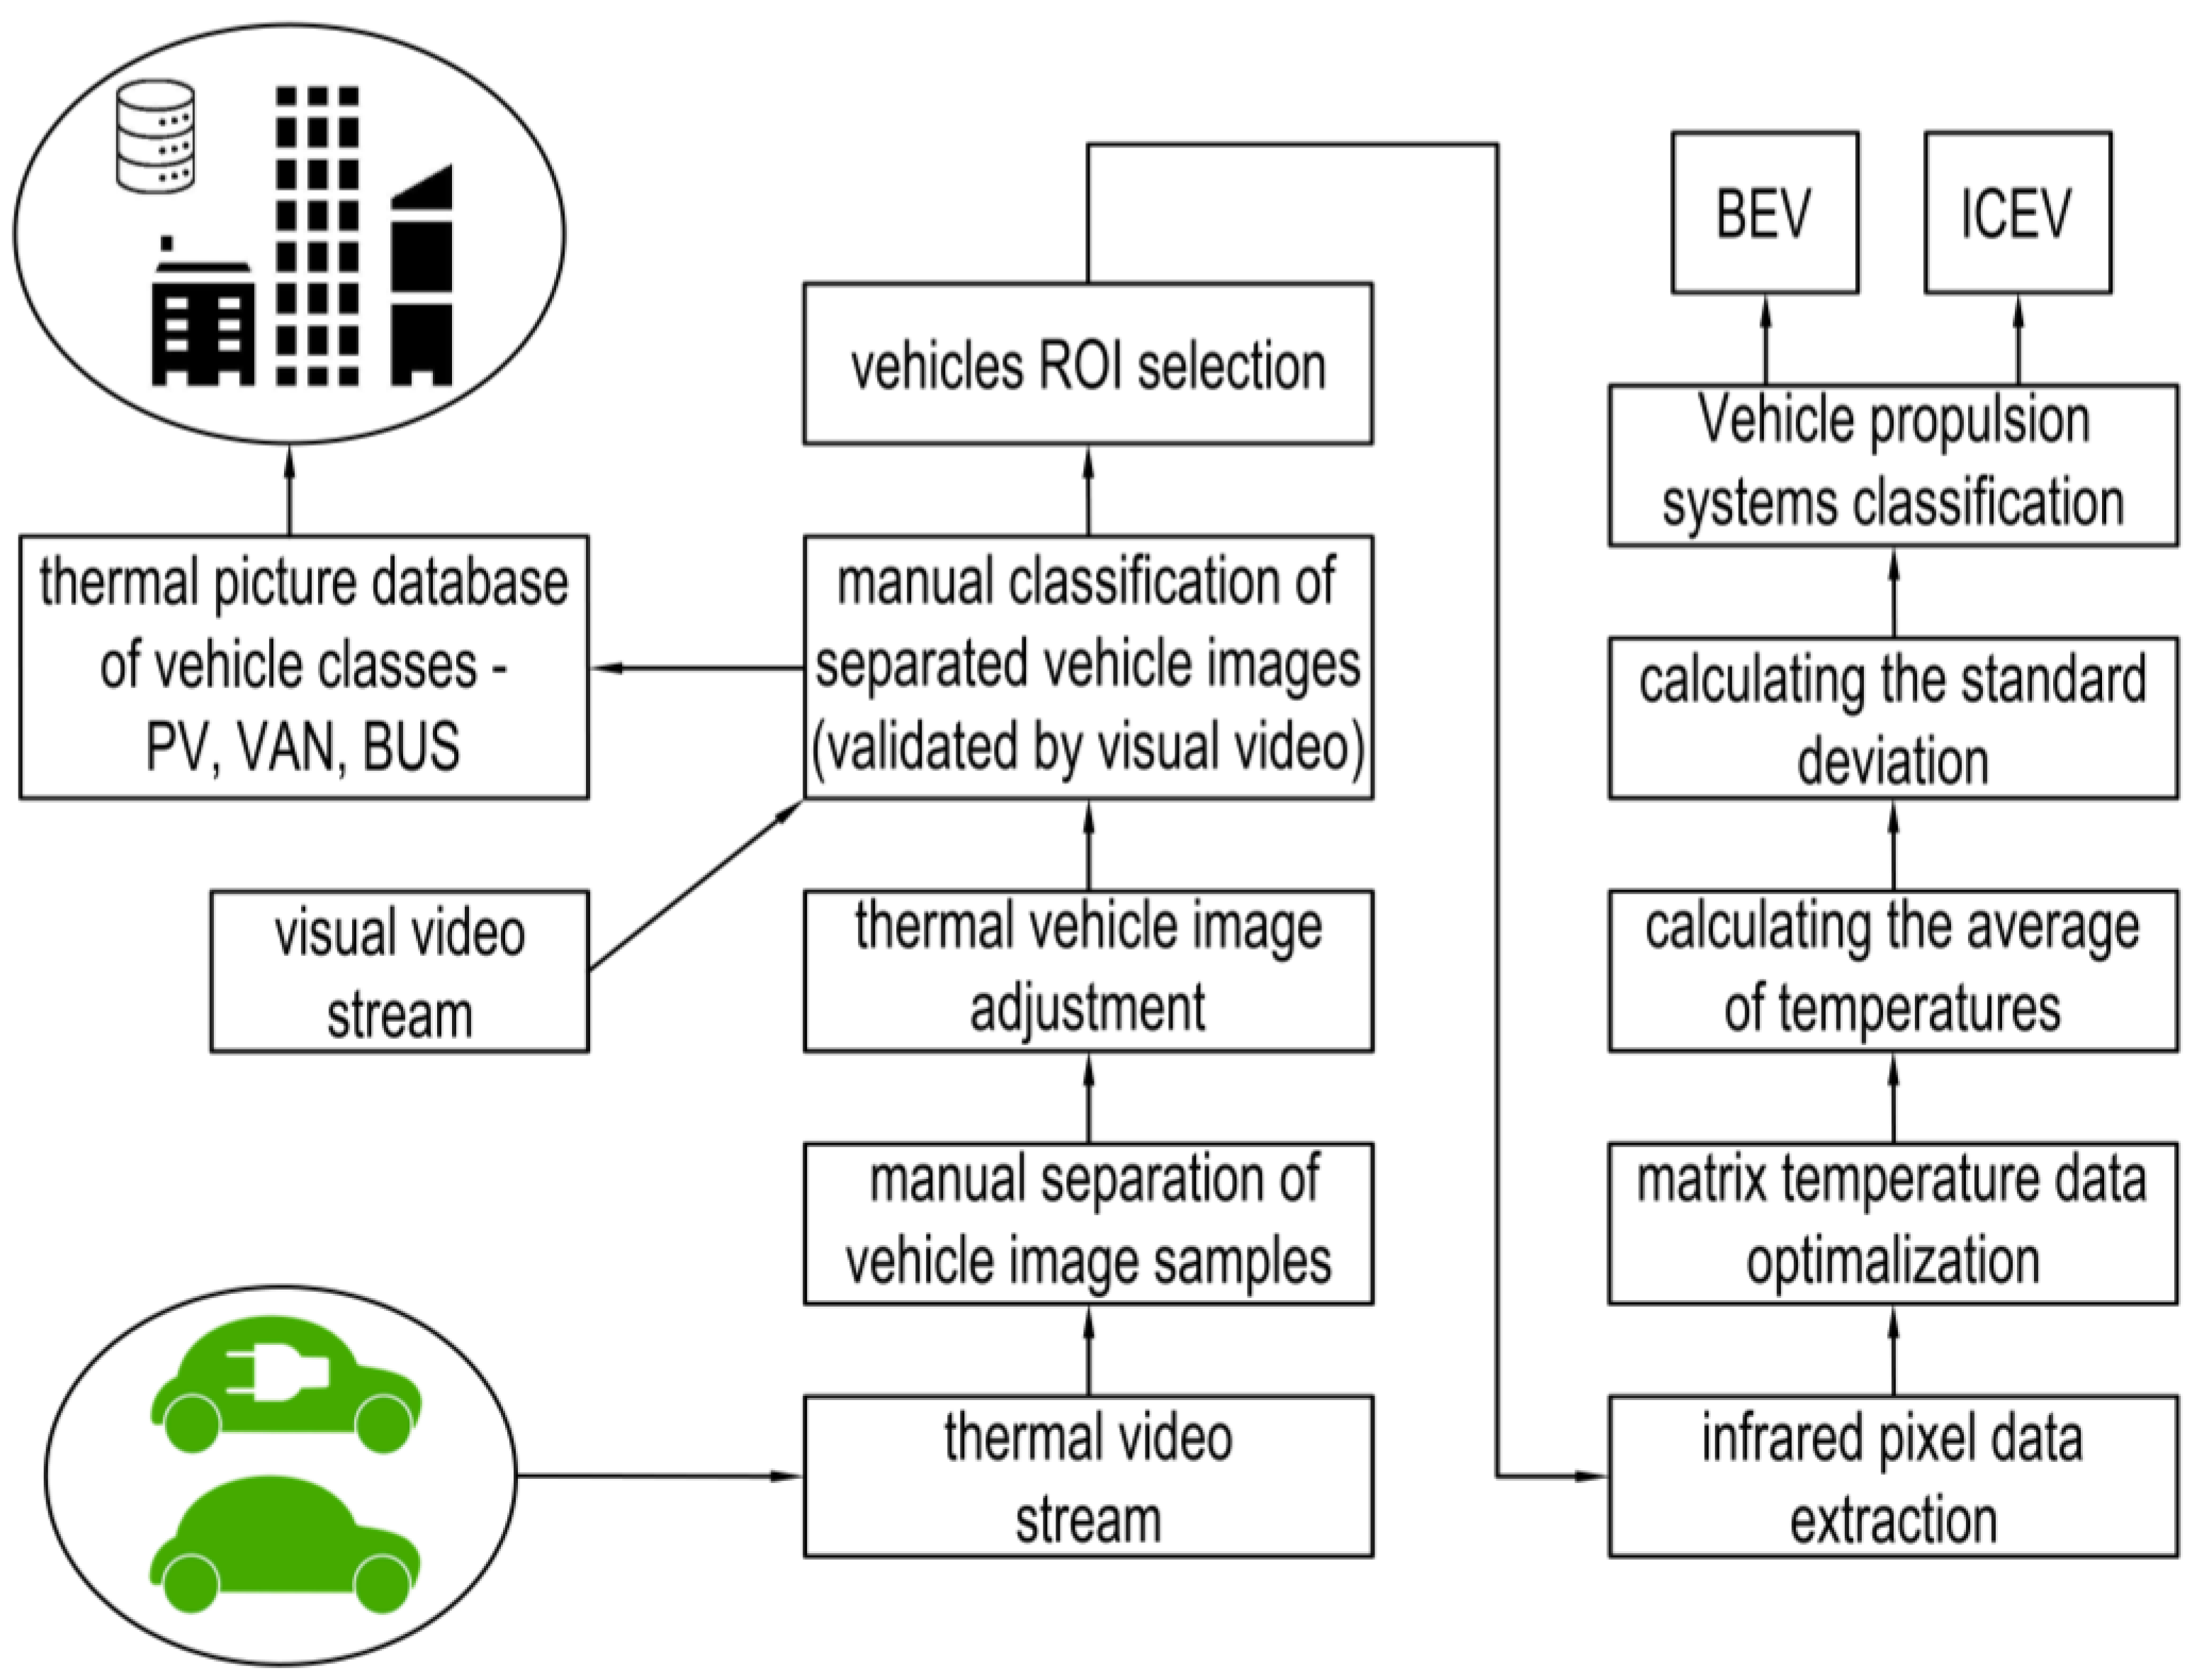
Proposed Method of Data Processing

Categorizing vehicles into BEV and ICEV categories was achieved by setting parameters’ region of interest (ROI) on the vehicle mask. ROI differs from other parts of the vehicle by the generated engine thermal energy and other operating parts that emit energy into this area. These conclusions were confirmed in our previous work [35]. Knowing each pixel’s temperature value in the radiometric image type of vehicle engine unit was determined. Figure 4 presents the flowchart of the proposed method.
First, radiometric images of passing vehicles were manually separated from the thermal video stream. The adjustment of the temperature range of the thermal image was subsequently placed to eliminate possible errors of automatic optimization of the temperature scale. The vehicles belonged to the following categories: passenger ICEV, VAN, passenger BEV, and BUS. The correct category was validated by a visual RGB camera. Two categories, VAN and BUS, were included in the research due to their standard share in urban traffic flow. Statistical differences were detected between the thermal properties of the most represented categories of vehicles in urban traffic.
The analyses of the extracted data were subsequently placed in the file. Each detected vehicle was double-checked by manual analysis. It consisted of the selection of the ROI (i.e., vehicle mask) and extraction of the pixel values of this ROI by the thermal analysis program. The size of the ROI varies due to the size of the vehicle and its body in the radiometric image. The number of extracted pixels is directly proportional to the size of the detection window ROI. The next step was optimizing the temperature matrix for other calculations. The program for calculation and proper analysis of extracted data was written in visual basic language.
Analysis of variance (ANOVA) [37] was used for statistical evaluation. The null and alternative hypotheses were determined. No significant difference between the vehicle categories was statistically found in the case of null hypothesis confirmation. On the other hand, the alternative hypothesis confirms there is a significant difference in thermal features between the vehicle categories. The evaluation took place in statistical software StatSoft Statistica [38], which offers advanced statistical functions including ANOVA. The data were uploaded to this software. The data contain the calculated average temperature values of ROI for all measured vehicles with assigned categories. The test criterium was calculated with a prespecified threshold (0.05) of probability “p”. The post hoc Scheffe test [39] was used for a detailed confirmation of ANOVA results and furthermore to find the results among vehicle categories.
The following calculations determine the average temperatures from the extracted values of pixels and standard deviations for each detected vehicle according to their categories. Automatic categorizing of individual vehicles was based on this information. The algorithm proceeded according to the formula (1) to decide whether average temperatures (extracted and calculated the value of pixels) of ICEV or BEV are inside of the boundaries of intervals for these categories.
T = [ t 11 t 12 t 21 t 22 t 1 c t 2 c t r 1 t r 2 t r c ] =   µ ( t 11 , t 12 , . t r c )
where t11–trc (°C) are temperatures of each pixel in the detected window.
According to the calculated average of temperatures by this formula and standard deviation, decision-making process was set as follows:
  • When calculating “σ”, if the standard deviation < threshold –”σ”, the vehicle is supposed to be BEV;
  • When calculating “σ”, if the standard deviation is between thresholds –”σ“ and +”σ”, the vehicle is supposed to be ICEV.
If the calculated ROI average temperature or its standard deviation is within the temperature range of the ICEV and outside the range of the BEV, the algorithm enters logic “1” in the register. It indicates the internal combustion engine vehicle. If the temperature is within the range of the electric vehicle category, the temperature detector writes a logic “0”, which indicates the battery electric vehicle.

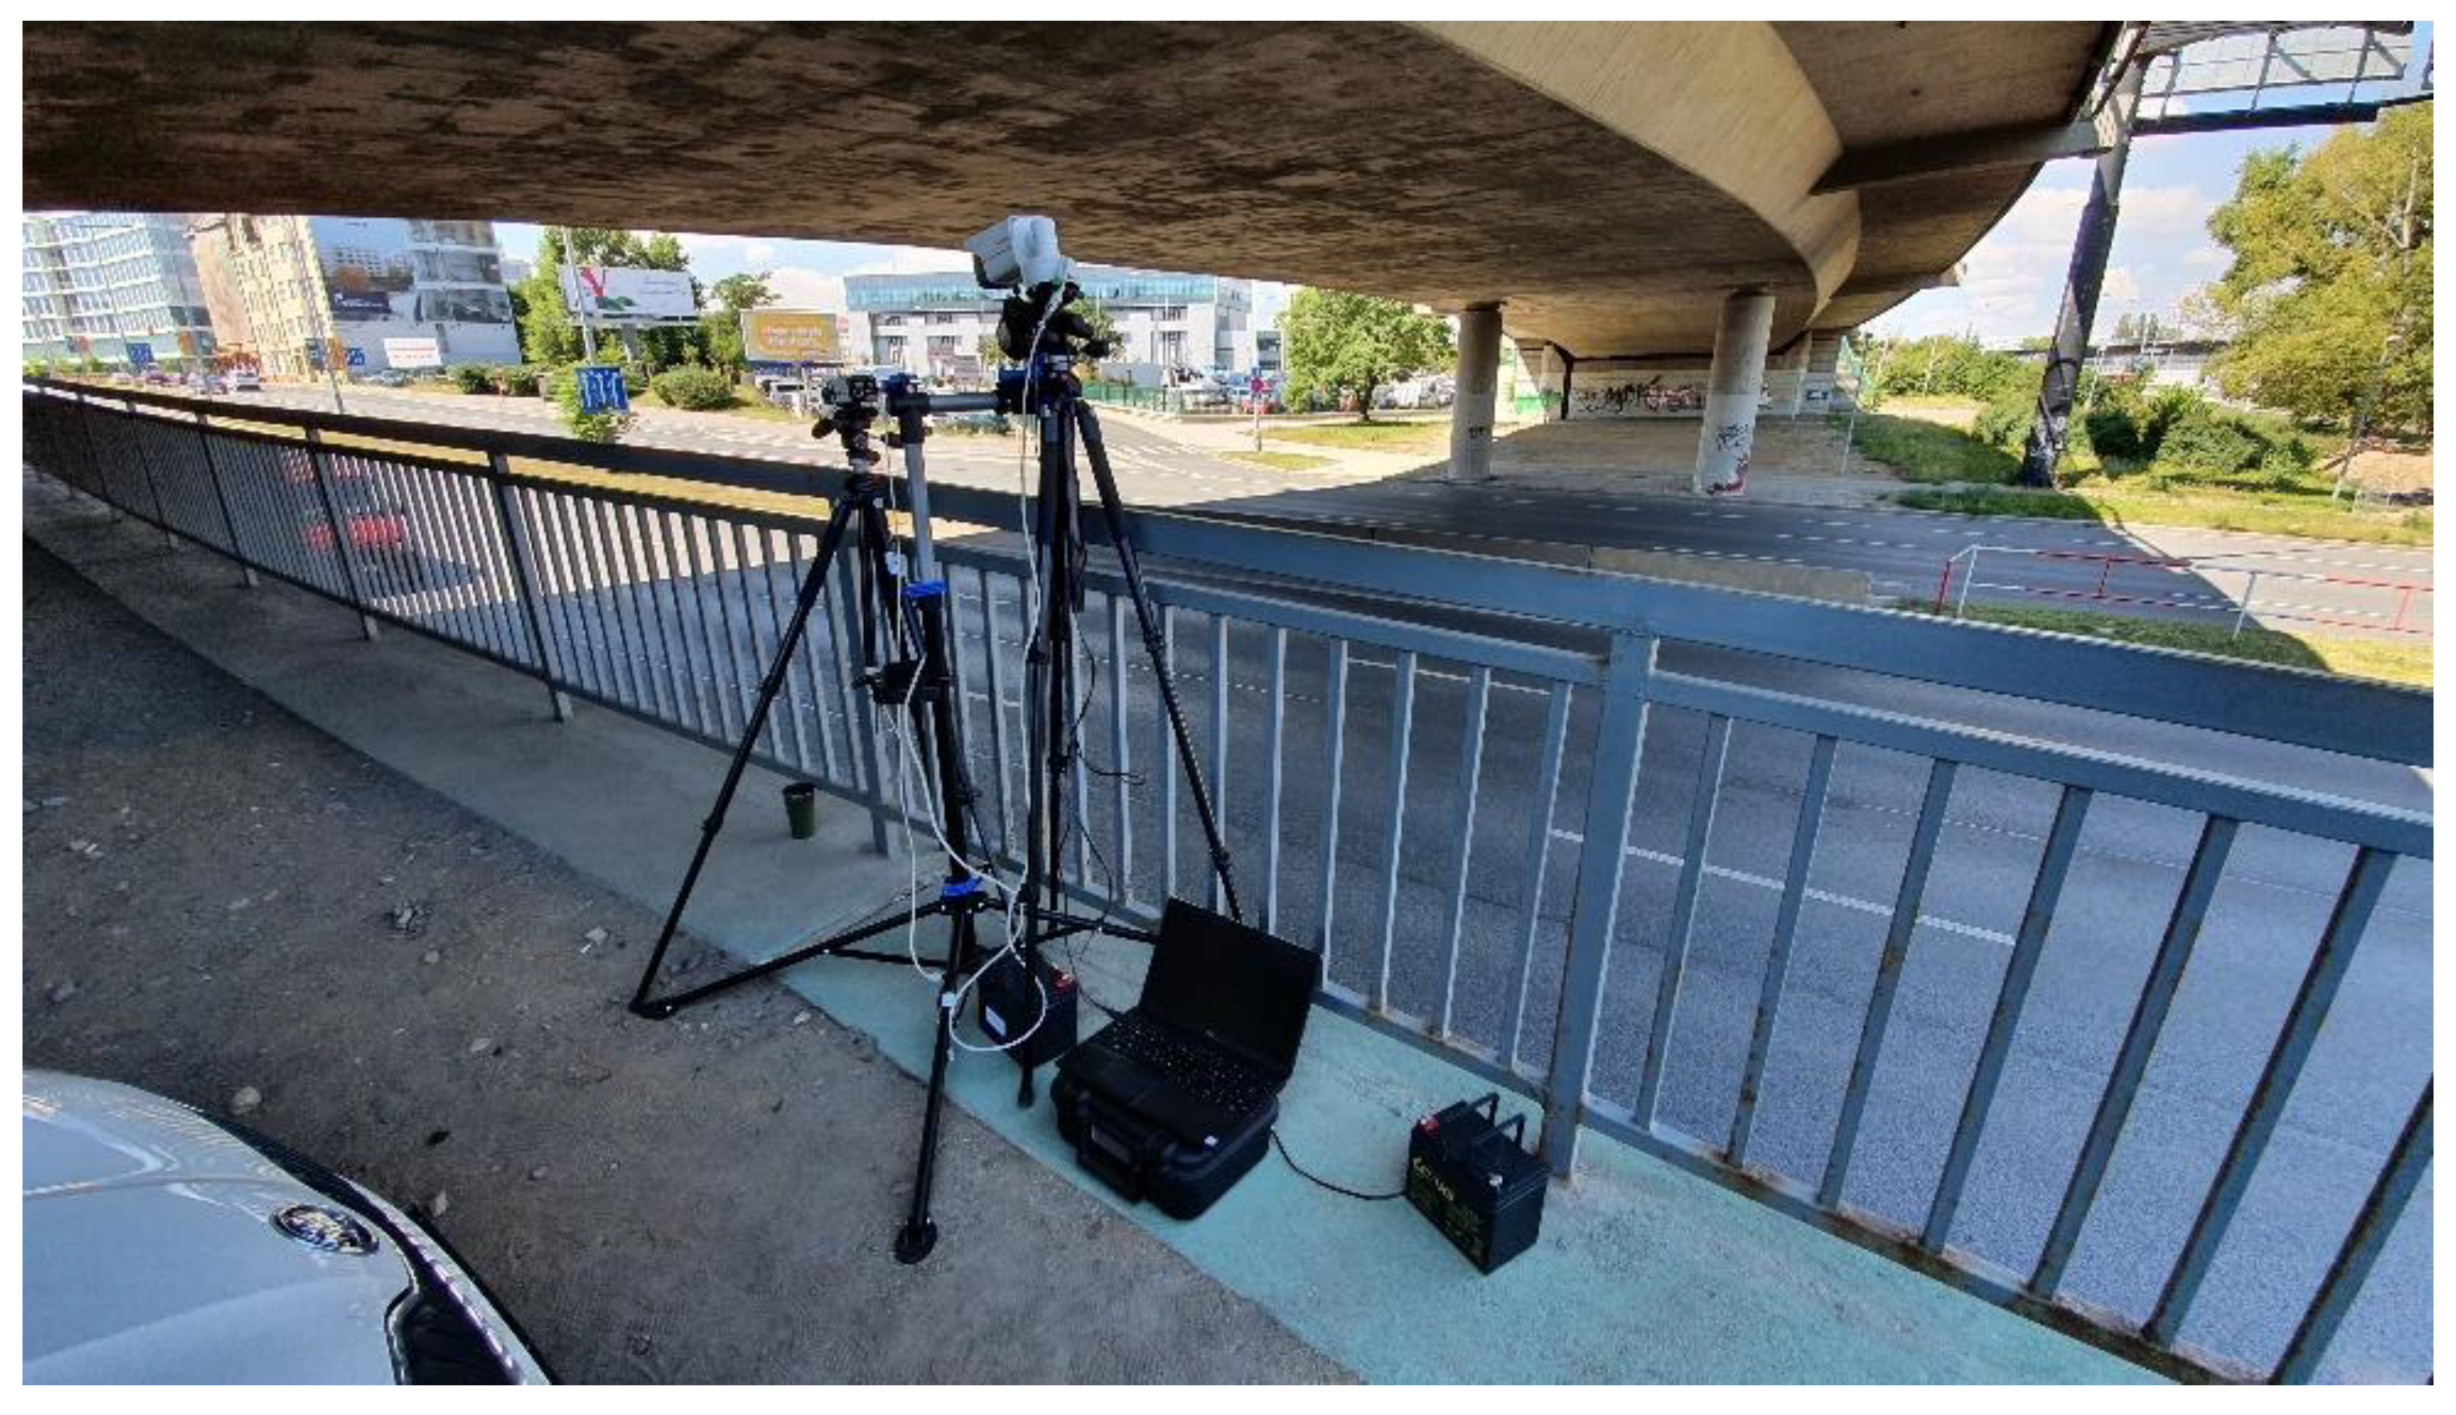
3. Methodology of Measurement

Image data were captured during August and December to verify the functionality of the engine thermal signature recognition. Measurements that were carried out under winter conditions proved that the reliability of detection is higher in winter. Nevertheless, difficulties might occur in the system, especially at higher outdoor temperatures from May to September in central Europe. The smallest difference between the air temperature and the temperature of the vehicle mask warmed by the engine occurs during the summer months and is therefore important to prove the validity of the evaluation. The video streams (RGB and thermal) consist of hours of recording time. Representative four hours of the video stream recorded during various light and weather conditions were selected for statistical evaluation. Table 1 shows representative data containing the number of passing vehicles during the four hours of measurement, the average temperatures of ROI, and the calculated standard deviation. The average size of the detection window was, for ICEV/BEV categories 25 × 15 pixels; van 30 × 15 pixels; bus 40 × 20 pixels. Multiplying the number of pixels of the simple detection window represents the number of thermal data in this window. Note that the number of recorded BEVs is not higher than two percent of the total number of recorded vehicles. This small number corresponds with the actual number of new registered BEVs in the Czech Republic [40]. The percentage in comparison with total registered vehicles in the Czech Republic (according to the official central registry of road vehicles) is small [41].
The location of the measurement was chosen near the junction exit, a street with three lanes and high traffic flow. The cameras were installed under a bridge in Argentinska Street in Prague). It is a busy road with a 24 h density of more than 31,000 cars [42]. The decision of where to position a thermal camera was based on two facts. First, a suitable position to record approaching vehicles, thus recording vehicle height and angle. Second, the video recording was less affected by weather conditions (cameras were placed under the bridge to prevent their damage in case of bad weather). The record was made in two particular positions. The cameras captured the mask and the side of the vehicle in one moment.
This measurement considered the results of previous laboratory experiments. They confirmed the hypothesis that the detection of BEV is based on the thermal signature. These results were obtained under the controlled laboratory environment without changes in lighting conditions. The measured vehicles were similar in body shapes, colors, and horsepower. Similar conditions are not possible to reach in real traffic situations. The vehicles are different in body shapes, colors, and horsepower. This affects the parameters of measurement. For example, different colors have different emissivity, and different horsepower in engines cause them to emit various amounts of heat into the vehicle mask. This might be below the resolution of the thermal camera used. Despite these limitations, thermal detection must be considered. Hence, it was necessary to confirm or decline the hypothesis made in [35] in real traffic and weather conditions. Three cameras were used for the experiment—two visual cameras, one for recording and collection of vehicle registration plates and the other for continuous recording of traffic, and a third that was a thermal camera. Visual cameras with a continuous video stream are used mainly due to the manual control of classified vehicles from the thermal video stream. The infrared thermal camera has a smaller resolution and that is why the visual camera was used to record the registration plate numbers of passing vehicles. Numbers that start with the letters “EL” are used for the recognition of electric vehicles [43] (registration plate law in the Czech Republic). That is why the visual traffic flow recording, manual classification, and separation from the thermal traffic flow were carried out (and eventually hybrid and hydrogen cars were excluded).

Procedure of Experiment with the FLIR E5 Camera and Visual RGB Camera

The following paragraphs provide a brief description of the experimental procedure to determine the optimal settings of the measuring parameters of thermal and visual RGB cameras. Thermal camera settings involve length measurement points, emissivity, atmospheric and reflected temperature, and relative humidity. Temperature range calibration is an automatic function of the thermal camera. This function is optimized, e.g., by changes in lighting conditions. The following thorough setup of parameters was performed before measurement:
  • atmospheric temperature, 19 °C;
  • emissivity, 0.95;
  • distance, 7 m;
  • reflected temperature, 20 °C;
  • relative humidity, 60%.
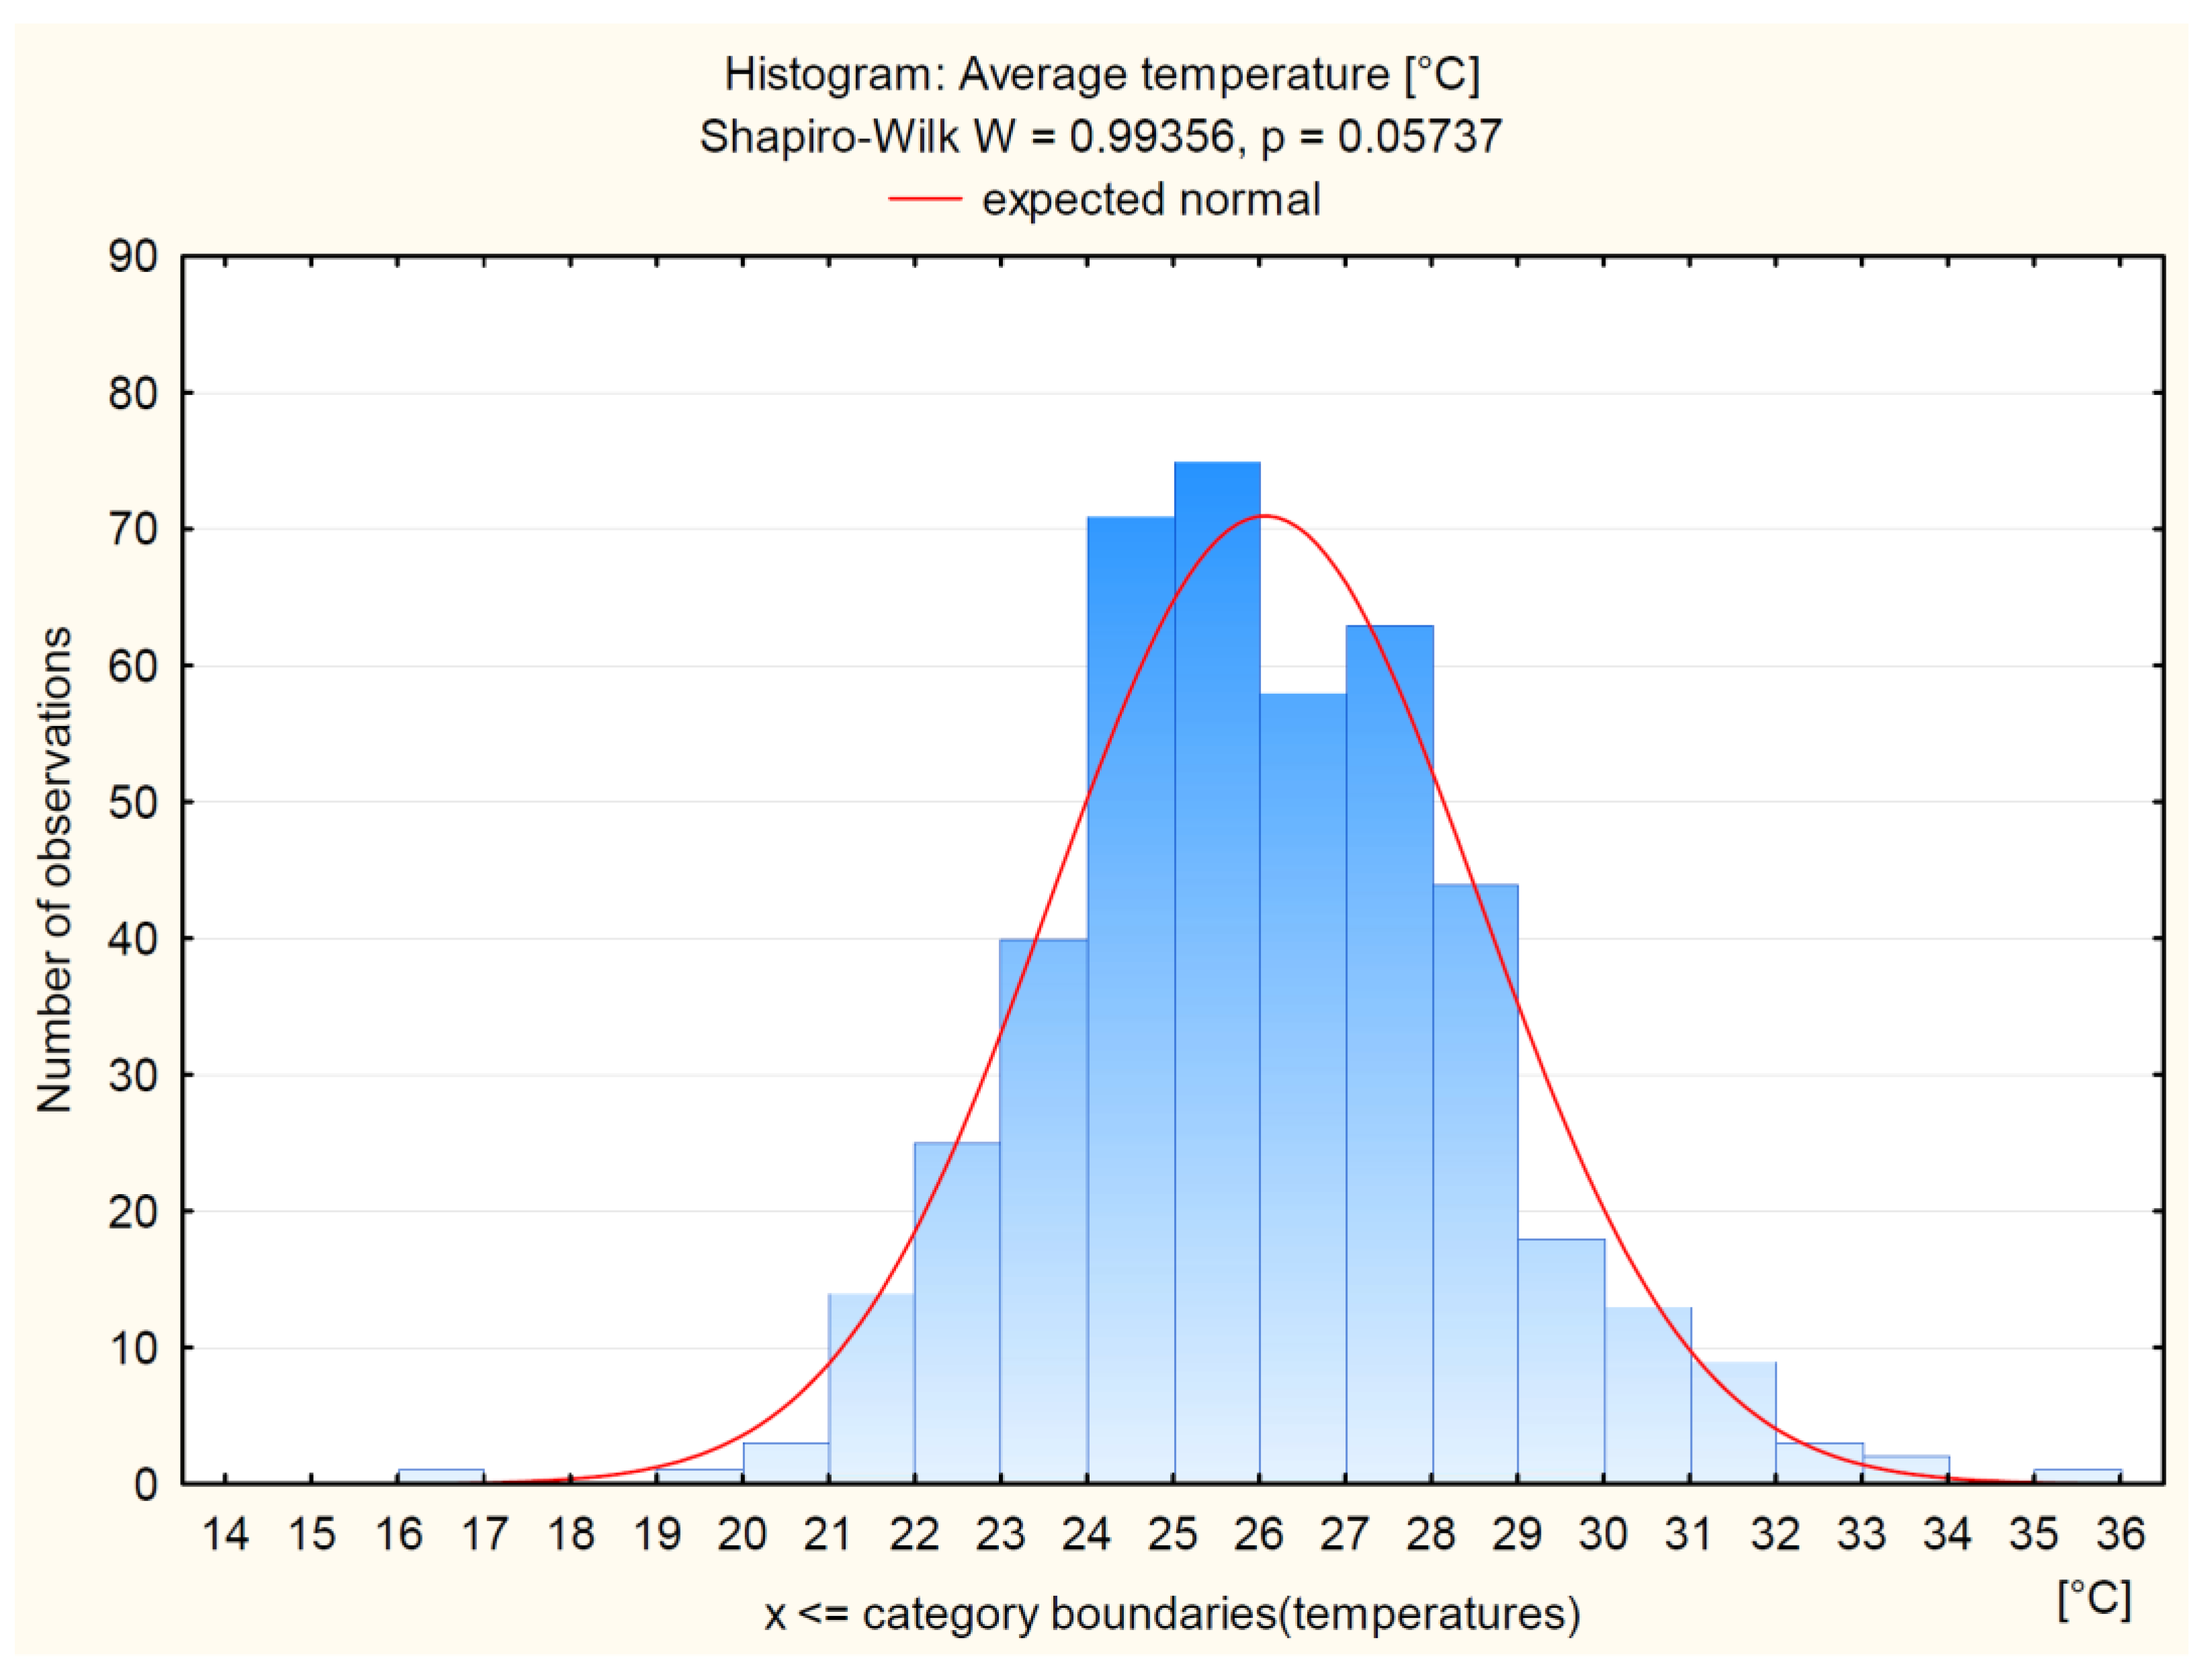
Automatic calibration of the temperature range was not suitable for all measuring conditions. Manual calibration was not an optimal solution due to many objects (vehicles) of different emissivity in the measured area. FLIR Tools + was used to optimize the thermographic analysis.
Lens focusing was adjusted in visual cameras as well as defining areas (lanes) for vehicle license plate detection and registration. Record of the video stream of a thermal camera was saved on a laptop. Visual camera records were saved as a video stream on the internal camera memory.
Electric vehicles in the traffic flow are not common yet. A Tesla car was hired to provide examples of the drive of BEV in real operating conditions. It was preheated to operate with temperature matching after a half-hour drive in city traffic. Subsequently, Tesla was driven to pass the prepared cameras several times to obtain its images. Figure 5 shows the measurement layout.

4. Results

The normal distribution of average temperature is a condition of statistical evaluation. Histogram (Figure 6) shows the data recorded by the thermal camera and proceeded by the thermal analysis program. The analysis used the normal distribution and created a statistical test known as the analysis of variance (ANOVA). ANOVA test compared the average of four vehicle categories, specifically, passenger ICEV, passenger BEV, VAN with a combustion engine, and BUS with a combustion engine.
The statistical test was based on the confirmation of the alternative hypothesis of whether there is a significant difference between the average temperatures of the ROI mask of the vehicle for each category. The probability ”p” was lower than the prespecified threshold (0.05); therefore, it was possible to confirm this hypothesis. There was a statistically significant difference between groups, as determined by one-way ANOVA (F (3.437) = 10781, p = 0.000001).
There was a gap among these groups. Statistic post hoc Scheffe test proved that the significant difference was just between the two groups—passenger ICEV and VAN—according to the red highlighted results (Table 2).
Scheffe test proved that there was no statistically significant difference between the two remaining categories, i.e., passenger BEV and BUS; the statistically significant difference did not occur in other categories. This might be caused by an insufficient number of images of personal BEVs and buses. In total, 9 personal BEV and 32 BUS were recorded; therefore, the data do not provide sufficient evidence for comparison so far. The probability plot of average temperature (Figure 7) makes the difference well visible.
A larger set of image data containing BUS and passenger BEVs will contribute to more precise results. It is essential to continue developing this method and its accuracy. Thermal analysis is suitable for a larger proportion of BEV in the traffic flow.

5. Discussion

The results of the completed experiments showed the limitation of the camera and insufficient resolution of the thermal detector. Another issue was the low number of BEV vehicles in the traffic flow. To obtain more precise results, this method can be improved based on the hypothesis from the previous laboratory measurements [35]. The method used has its drawbacks. Various designs of vehicle engines bring uncertainty about the place of emitted thermal energy to the vehicle mask. In addition, inaccurate detection of vehicles might be caused by overlapping vehicles. To conclude, the following five key points are highlighted:
  • The hypothesis confirmed in previous work in laboratory conditions was evaluated in real traffic conditions;
  • The hypothesis is valid for an appropriate number of BEV vehicles in traffic flow for qualitative confirmation of all parts of the hypothesis;
  • This paper provides a basic approach for the thermal detection of BEV in traffic flow;
  • Varied lighting and weather conditions require a program for an automatic recalibration of thermal camera parameters;
  • The convolution neural network software, vector machine, and other object detection and classification methods need to be adopted to increase the precision of the presented approach in the future.
Vehicle detection and categorization system in traffic flow might be designed based on thermal analysis and correct targeting of the thermal camera. Positive results can be achieved even in summer when the ambient air temperature approaches the temperature of the car’s heated mask. The results provide the following anticipation: if there is a difference between the categories of personal ICEV and VAN, this difference might occur in other categories. The low number of electric vehicles in the current traffic flow in the Czech Republic is a pitfall. It mainly raises the question of how to verify pixel values (temperatures) and determine the range of the temperature interval for reliable detection of this category due to its currently small representation. Further research requires a better resolution of the thermal images. The proposed method of calculating thermal data is a promising first step to develop an automatic system for detecting vehicles in traffic flow, e.g., a joint vehicle recognition system and neural network. Both, the independence of detection on ambient conditions and categorization of passing vehicles according to the engine unit of the vehicles might be the advantages, compared to current detection systems. Recording other vehicle parts, especially the stern, is expected in the future. Moreover, detection of electric vehicles based on the absence of their exhaust system benefits from the temperature difference, compared to a combustion vehicle with an exhaust system.

6. Conclusions

The proposed approach shows a reliable detection of BEV, conventional and hybrid vehicles running on an internal combustion engine, and pure electric car. Exiting detectors cannot recognize these categories. The vehicle register does not deliver the necessary information about vehicle type. The main benefit of the proposed method is categorizing vehicles in real time. The use of detection is offered to the development of electric vehicles (EVs), especially in specific areas, such as historical city centers, etc. The use of reliable detection of BEV can be considered for various purposes, as mentioned in the introductory part, especially for toll systems. The thermal detection using methods of artificial neural networks can contribute to the further development of electromobility in cities, for instance, parking occupancy next to public charge points and charging stations. The described detection method has a wide potential in the concept of smart city, automatic diagnostics of vehicles in operation, vehicle classification, BEV preference allocation in traffic management in central urban areas, etc. It can contribute to safety in the city. Furthermore, thermal camera detection can address the priority of more occupied vehicles due to its ability to detect vehicle occupancy by passengers accurately. It can prevent fire ignition by detecting faults and overheating some vehicle parts in time. Thermal detection can be applied in tunnel technologies, additionally for checking diagnostic and condition prediction systems. The presented results offer the high potential of these technologies for electromobility, transportation, diagnostics, smart applications, their control, applicability, and further improvement [35].

Author Contributions

Data curation, D.Š.; methodology, T.T., D.Š., M.R., and Z.B.; project administration, T.T.; formal analysis, D.Š. and T.T.; resources, T.T., D.Š., M.R., and Z.B.; writing—original draft preparation, T.T. and D.Š.; writing—review and editing, T.T., J.B, Z.B., T.T., D.Š., M.R. and Z.B. All authors have read and agreed to the published version of the manuscript.

Funding

This research was funded by the Department of Transport Telematics CTU in Prague, Faculty of Transportation Sciences.

Institutional Review Board Statement

Not applicable.

Informed Consent Statement

Informed consent was obtained from all subjects involved in the study.

Data Availability Statement

Restrictions apply to the availability of these data. Data were obtained from the company Eltodo and it is available from the authors after the official request. These data would be available only with the permission of the third party—company Eltodo from the Czech Republic.

Acknowledgments

The research was supported by the Department of Transport Telematics CTU in Prague, Faculty of Transportation Sciences and Department of vehicles and Ground Transport, CULS Prague, and the Faculty of Engineering.

Conflicts of Interest

The authors declare no conflict of interest. The funders had no role in the design of the study; in the collection, analyses, or interpretation of the data; in the writing of the manuscript, or in the decision to publish the results.

References

  1. Vilarinho, C.; Tavares, J.P.; Rossetti, R.J.F. Intelligent Traffic Lights: Green Time Period Negotiaton. Transp. Res. Procedia 2017, 22, 325–334. [Google Scholar] [CrossRef]
  2. Li, C.; Guo, H.; Wang, W.; Jiang, X. Stabilization Analysis of Mixed Traffic Flow with Electric Vehicles Based on the Modified Multiple Velocity Difference Model. In Proceedings of the International Conference on Green Intelligent Transportation System and Safety, Changchun, China, 1–2 July 2017; pp. 251–261. [Google Scholar] [CrossRef]
  3. Robert, K. Night–Time Traffic Surveillance: A Robust Framework for Multi–Vehicle Detection, Classification and Tracking. In Proceedings of the 2009 Sixth IEEE International Conference on Advanced Video and Signal Based Surveillance, Genova, Italy, 2–4 September 2009; IEEE: Geneva, Switzerland, 2009; pp. 1–6. [Google Scholar] [CrossRef]
  4. Bahler, S.J.; Kranig, J.M.; Minge, E.D. Field Test of Nonintrusive Traffic Detection Technologies. Transp. Res. Rec. J. Transp. Res. Board 1998, 1643, 161–170. [Google Scholar] [CrossRef]
  5. Fu, T.; Stipancic, J.; Zangenehpour, S.; Miranda–Moreno, L.; Saunier, N. Automatic Traffic Data Collection under Varying Lighting and Temperature Conditions in Multimodal Environments: Thermal versus Visible Spectrum Video–Based Systems. J. Adv. Transp. 2017, 2017, 1–15. [Google Scholar] [CrossRef]
  6. Zangenehpour, S.; Strauss, J.; Miranda–Moreno, L.F.; Saunier, N. Are Signalized Intersections with Cycle Tracks Safer? A Case–Control Study Based on Automated Surrogate Safety Analysis Using Video Data. Accid. Anal. Prev. 2016, 86, 161–172. [Google Scholar] [CrossRef]
  7. Ni, D. Determining Traffic–Flow Characteristics by Definition for Application in ITS. IEEE Trans. Intell. Transp. Syst. 2007, 8, 181–187. [Google Scholar] [CrossRef]
  8. Avery, R.P.; Wang, Y.; Rutherford, G.S. Length–Based Vehicle Classification Using Images from Uncalibrated Video Cameras. In Proceedings of the the 7th International IEEE Conference on Intelligent Transportation Systems (IEEE Cat. No.04TH8749), Washington, WA, USA, 3–6 October 2004; IEEE: Piscataway, NJ, USA, 2004; Volume 1993, pp. 737–742. [Google Scholar] [CrossRef]
  9. Zhang, G.; Avery, R.P.; Wang, Y. Video–Based Vehicle Detection and Classification System for Real–Time Traffic Data Collection Using Uncalibrated Video Cameras. Transp. Res. Rec. 2007, 1993, 138–147. [Google Scholar] [CrossRef] [Green Version]
  10. Goyal, A.; Verma, B. A Neural Network Based Approach for the Vehicle Classification. In Proceedings of the A Neural Network Based Approach for the Vehicle Classification, Honolulu, HI, USA, 1–5 April 2007; pp. 226–231. [Google Scholar] [CrossRef]
  11. Thi, T.H.; Robert, K.; Lu, S.; Zhang, J. Vehicle Classification at Nighttime Using Eigenspaces and Support Vector Machine. In Proceedings of the 2008 Congress on Image and Signal Processing, Vehicle Classification at Nighttime Using Eigenspaces and Support Vector Machine, Sanya, China, 27–30 May 2008; Volume 2, pp. 422–426. [Google Scholar] [CrossRef]
  12. Iwasaki, Y.; Kawata, S.; Nakamiya, T. Vehicle Detection Even in Poor Visibility Conditions Using Infrared Thermal Images and Its Application to Road Traffic Flow Monitoring. Lect. Notes Electr. Eng. 2011, 151, 997–1009. [Google Scholar] [CrossRef]
  13. Coifman, B. Freeway Detector Assessment: Aggregate Data from Remote Traffic Microwave Sensor. Transp. Res. Rec. J. Transp. Res. Board 2005, 1917, 149–163. [Google Scholar] [CrossRef]
  14. Zhou, J.; Gao, D.; Zhang, D. Moving Vehicle Detection for Automatic Traffic Monitoring. IEEE Trans. Veh. Technol. 2007, 56, 51–59. [Google Scholar] [CrossRef] [Green Version]
  15. Iwasaki, Y. A Method of Robust Moving Vehicle Detection for Bad Weather Using an Infrared Thermography Camera. In Proceedings of the International Conference on Wavelet Analysis and Pattern Recognition, Hong Kong, China, 30–31 August 2008; Volume 1, pp. 86–90. [Google Scholar] [CrossRef]
  16. Yoneyama, A.; Yeh, C.–H.; Kuo, C.–C.J. Robust Vehicle and Traffic Information Extraction for Highway Surveillance. EURASIP J. Adv. Signal. Process. 2005, 2005, 912501. [Google Scholar] [CrossRef] [Green Version]
  17. Lee, D.; Park, Y. Measurement of Traffic Parameters in Image Sequence Using Spatio–Temporal Information. Meas. Sci. Technol. 2008, 19, 115503. [Google Scholar] [CrossRef]
  18. Iwasaki, Y.; Misumi, M.; Nakamiya, T. Robust Vehicle Detection under Various Environments to Realize Road Traffic Flow Surveillance Using an Infrared Thermal Camera. Sci. World J. 2015, 2015, 1–11. [Google Scholar] [CrossRef] [PubMed] [Green Version]
  19. Saunier, N.; Sayed, T. A Feature–Based Tracking Algorithm for Vehicles in Intersections. In Proceedings of the Third Canadian Conference on Computer and Robot Vision, CRV 2006, Quebec, QC, Canada, 7–9 June 2006; Volume 2006, p. 59. [Google Scholar] [CrossRef] [Green Version]
  20. Shi, J.; Tomasi. Good Features to Track. In Proceedings of 1994 Proceedings of IEEE Conference on Computer Vision and Pattern Recognition, Seattle, WA, USA,, 21–23 June 1994; Volume 178, pp. 593–600. [Google Scholar] [CrossRef]
  21. Sangnoree, A.; Chamnongthai, K. Thermal–Image Processing and Statistical Analysis for Vehicle Category in Nighttime Traffic. J. Vis. Commun. Image Represent. 2017, 48, 88–109. [Google Scholar] [CrossRef]
  22. Iwasaki, Y.; Misumi, M.; Nakamiya, T. Robust Vehicle Detection under Various Environmental Conditions Using an Infrared Thermal Camera and Its Application to Road Traffic Flow Monitoring. Sensors 2013, 13, 7756–7773. [Google Scholar] [CrossRef] [PubMed]
  23. Nam, Y.; Nam, Y.–C. Vehicle Classification Based on Images from Visible Light and Thermal Cameras. EURASIP J. Image Video Process 2018, 5, 1–9. [Google Scholar] [CrossRef] [Green Version]
  24. Dalal, N.; Triggs, B. Histogram of Oriented Gradients for Human Detection. In Proceedings of the IEEE Computer Society Conference on Computer Vision and Pattern Recognition, San Diego, CA, USA, 20–26 June 2005; p. 8. [Google Scholar]
  25. Krizhevsky, A.; Sutskever, I.; Hinton, G.E. ImageNet Classification with Deep Convolutional Neural Networks. NIPS 2012, 60, 84–90. [Google Scholar] [CrossRef]
  26. Simonyan, K.; Zisserman, A. Very Deep Convolutional Networks for Large–Scale Image Recognition. In Proceedings of the 3rd International Conference on Learning Representations, ICLR 2015, San Diego, CA, USA, 7–9 May 2015; pp. 1–14. [Google Scholar]
  27. Murthy, C.B.; Hashmi, M.F.; Bokde, N.D.; Geem, Z.W. Investigations of Object Detection in Images/Videos Using Various Deep Learning Techniques and Embedded Platforms–A Comprehensive Review. Appl. Sci. 2020, 10, 3280. [Google Scholar] [CrossRef]
  28. Nistor, S.C.; Ileni, T.A.; Dărăbant, A.S. Automatic Development of Deep Learning Architectures for Image Segmentation. Sustainability 2020, 12, 9707. [Google Scholar] [CrossRef]
  29. Ligocki, A.; Jelinek, A.; Zalud, L.; Rahtu, E. Fully Automated DCNN–Based Thermal Images Annotation Using Neural Network Pretrained on RGB Data. Sensors 2021, 21, 1552. [Google Scholar] [CrossRef] [PubMed]
  30. Ligocki, A.; Jelinek, A.; Zalud, L. Brno Urban Dataset–The New Data for Self–Driving Agents and Mapping Tasks. In Proceedings of the IEEE International Conference on Robotics and Automation (ICRA), Paris, France, 31 May–31 August 2020; pp. 3284–3290. [Google Scholar] [CrossRef]
  31. FLIR Tools Thermal Analysis and Reporting (Desktop) | FLIR Systems. 2021. Available online: https://www.flir.com/products/flir–tools/ (accessed on 26 April 2021).
  32. FLIR E5 Infrared Camera with MSX&reg; | FLIR Systems. 2020. Available online: https://www.flir.com/products/e5/ (accessed on 1 February 2020).
  33. HARDWARE INSTALLATION GUIDE VC58SMi–1.3 Megapixel Box Type IP Camera VC58SM3i–3.0 Megapixel Box Type IP Camera VC58EHi–Standard D1 Box Type IP Camera. 2021. Available online: http://www2.viakom.cz/stahuj/vision/manualy/VC58_Hardware_Installation_Guide_eng_20110922.pdf (accessed on 26 April 2021).
  34. IP Bullet Camera Hikvision, iDS–2CD7A26G0/P–IZHS.2020. Available online: https://www.kamery–hikvision.cz/bullet–kamery/9384–ids–2cd7a26g0–p–izhs8–32mm–2mpix–ip–bullet–kamera–ir–100mwdr–140db–audio–alarm–ip67–ik10–cteni–spz–heater–6941264056898.html (accessed on 25 May 2021).
  35. Svorc, D.; Tichy, T.; Ruzicka, M. Detection of the Electric Vehicle Using Thermal Characteristics. In Proceedings of the 2020 Smart City Symposium Prague (SCSP), Prague, Czech Republic, 25 June 2020; pp. 1–5. [Google Scholar] [CrossRef]
  36. FLIR Systems. User’s Manual FLIR Tools/Tools+ 5.1. 2017. Available online: http://91.143.108.245/Downloads/Flir/Dokumentation/t810209-en-us_a4.pdf; (accessed on 25 May 2021).
  37. Scheffé, H. The Analysis of Variance, 1st ed.; Wiley–Interscience: New York, NY, USA, 1999. [Google Scholar]
  38. TIBCO StatisticaTM Trial Download for Windows | TIBCO Software. Available online: https://www.tibco.com/resources/product–download/tibco–statistica–trial–download–windows (accessed on 26 April 2021).
  39. Scheffé, H. A “Mixed Model” for the Analysis of Variance. Ann. Math. Stat. 1956, 23–36. Available online: http://www.jstor.org/stable/2236975 (accessed on 26 April 2021).
  40. Centrum Dopravniho Vyzkumu. Tiskove Zpravy–Počet Elektromobilů Se v České Republice Blíží Desetitisícové Hranici; Ostrava/Brno. 2021. Available online: https://www.cdv.cz/tisk/pocet-elektromobilu-se-v-ceske-republice-blizi-desetitisicove-hranici/ (accessed on 26 April 2021).
  41. Ministry of Transport of Czech Republic. Ministerstvo Dopravy ČR–Centrální Registr Vozidel. 2020. Available online: https://www.mdcr.cz/Statistiky/Silnicni–doprava/Centralni–registr–vozidel/Statistika?returl=/Statistiky/Silnicni–doprava/Centralni–registr–vozidel (accessed on 28 April 2020).
  42. The Technical Administration of Roads of the City of Prague–Department of Transport Engineering (TSK–ÚDI). Prague Transportation Yearbook 2019. Available online:https://www.czso.cz/csu/czso/statistical-yearbook-of-prague-2019Prague (accessed on 26 April 2021).
  43. Web Site of Minister of Transport. Registrační Značka Elektrického Vozidla–Platnost, Oprávnění, Výhody in CZ (Registration Number of an Electric Vehicle–Validity, Authorization, Benefits). 2020. Available online: https://www.mdcr.cz/Ministerstvo/Zadost–o–poskytnuti–informace–(1)/Poskytnute–informace/Registracni–znacka–elektrickeho–vozidla–––platnost?lang=cs–CZ (accessed on 28 April 2020).
Figure 1. Example of laboratory measurement of BEV’s front [35].
Sustainability 13 06873 g001
Figure 2. Example of laboratory measurement of ICEV’s front [35].
Sustainability 13 06873 g002
Figure 3. Example of different color pallets of the thermogram: (a) gray pallet and (b) artic pallet [36].
Sustainability 13 06873 g003
Figure 4. Flowchart of the proposed method.
Sustainability 13 06873 g004
Figure 5. Measurement disposition.
Sustainability 13 06873 g005
Figure 6. Histogram of normality validation.
Sustainability 13 06873 g006
Figure 7. Probability plot of average temperature.
Sustainability 13 06873 g007
Table 1. The recorded data of passing vehicles.
Category of VehiclesNumber of VehiclesAverage Temp. (°C)Standard Dev.
Passen. ICEV20025.364862.286562
VAN20026.710892.383138
Passen. BEV925.989512.244830
BUS 3226.454613.147705
All Groups44126.067132.479222
Table 2. Scheffe test results.
Category of VehiclesScheffe Test; Level of Significant p < 0.05000
{1}{2}{3}{4}
Passen. ICEV Average Temperature {1} 0.0000010.9002070.129651
VAN Average Temperature {2}0.000001 0.8547260.957246
Passen. BEV Average Temperature {3}0.9002070.854726 0.966665
BUS Average Temperature {4}0.1296510.9572460.966665
Publisher’s Note: MDPI stays neutral with regard to jurisdictional claims in published maps and institutional affiliations.

