Abstract
Government environmental information disclosure (GEID) is a key policy instrument in environmental governance. Local governments in China are improving the disclosure level of environmental information, but does the environmental information disclosed by local governments reflect the existing state of the local ecological environment? This paper analyzes the correlation between GEID and environmental performance and verifies whether or not the environmental information disclosed by local governments can reflect actual local ecological environment conditions. Based on data from Chinese cities, this paper adopts a multiple regression method, and the results show that the environmental information disclosed by governments can reflect the local environmental performance as a whole, and the higher the level of GEID, the better the local environmental performance; but the relationship between the two has significant regional differences. In eastern China, the higher the level of GEID, the better the local environmental performance. In central and western China, the correlation between GEID and environmental performance is not significant. In addition, it should be noted that the correlation between the level of GEID and the emission intensity of water pollutants is not significant in all regions. This study contributes to further clarifying the effectiveness of GEID policy and identifying a breakthrough for the optimization of environmental policies faced with the dilemma of serious environmental pollution and urgent economic development needs.
1. Introduction
China has been changing, and people have begun to yearn for “clear water, blue sky”, instead of merely for basic materials. But, due to extensive development models enacted over the past decade, the ecological environment in China has long been overloaded and, as a result, is severely damaged [1]. Now, in order to pursue the harmonious coexistence of “gold hills, silver hills” and “clear water, blue sky”, China is trying to govern the ecological environment. In 2008, the “Environmental Disclosure Measures (Trial)” was first proposed. Based on it, the “Notice on the Key Work Arrangements for Government Information Disclosure” and the “Notice on Further Strengthening the Work of Environmental Protection Information Disclosure” were successively proposed in 2012. They jointly regulate the behaviors of stakeholders, including government, enterprises, and the masses. In 2015, “information disclosure” and “citizen participation” were specifically included in the newly revised “Environmental Protection Law”. In recent years, the central government of China has attached great importance to the reform of the environmental information disclosure system, and issued guidelines to improve the GEID, such as “Strengthening Ecological Environmental Protection and Resolutely Fighting Pollution Prevention and Control” (2018) and “Building A Modern Environmental Governance System” (2020), which clearly proposed to improve the mandatory disclosure system of environmental information, strengthen legal supervision and encourage public supervision. The accurate and complete environmental information disclosure has been realized as the basis for achieving environmental sustainability.
Government environmental information disclosure (GEID) refers to an act of government and its public organizations, by which they make public the environmental information they have in accordance with laws, regulations, or applicants’ applications [2]. Environmental performance is derived from economic performance and refers to the management effect of an organization on the environment. According to the Polycentric Governance Theory [3,4], if the decision-making centers take each other into account in competitive and cooperative relationships and have recourse to conflict resolution mechanisms, they may be regarded as a polycentric governance system. Additionally, in the context of natural resource governance, the polycentric governance system could enhance adaptive capacity, provide a good institutional fit for natural resource systems, and mitigate risk on account of redundant governance factors and institutions [4]. So, considering that GEID is the crucial path to establish relationships among decision-making centers, it is necessary to implement GEID to promote the formation of the polycentric environmental governance system. Based on the Chinese context of institutions, authorities, and supervision, GEID can guarantee citizens’ right to access environmental information, regulate public participation behavior, and enhance citizens’ participation enthusiasm [5,6,7].
Previously, scholars have conducted a large body of research on environmental disclosure at the corporate level, including the influencing factors [1,8], the economic consequences [9], environmental performance [10,11,12,13,14,15,16], and regional effects [17,18], while few studies have extended this research to the governmental level. Huang (2017), Gao (2018, 2020), Zheng (2018), and Yang (2019) studied the influencing factors of GEID, including the stakeholders (e.g., governments, enterprises, the public, social media, non-governmental environmental organizations, etc.) and environmental regulations (e.g., environmental policies adopted by provincial government, the top-down intervention mechanism, the bottom-up reputation mechanism, etc.) [19,20,21,22,23]. Feng (2020), Yang (2020), Song (2021), and Zhang (2021) examined the effect of environmental governance, showing that GEID exerts a positive influence on environmental quality [24,25,26,27]. Feng (2020) also revealed that the level of economic development affects the level of GEID and environmental quality [24]. Zhang (2021) argued that GEID can alleviate the information asymmetry between the stakeholders, improve public environmental awareness, and then encourage the public to participate in urban environmental protection [27]. Furthermore, Lu (2020) and Sun (2019) empirically examined the impact of GEID on enterprises. Lu (2020) found that the high level of GEID can attract the location of clean enterprises and inhibit polluting enterprises [28]. Sun (2019) revealed that, in the context of China, there is a positive relationship between the government’s environmental information transparency and corporate environmentalism, and this relationship will be stronger for regions where government bureaucracy capabilities are stronger [29].
In China’s unique context, it is unclear whether or not the environmental information disclosed by local governments accurately and effectively reflects the local ecological environment. Are there acts of concealment or even deception undertaken by local governments? Does regional heterogeneity affect the explanatory power of the environmental information disclosed by the government and the quality of the ecological environment? Ji (2020) and Peng (2020) found that, in the process of corporate environmental disclosure, managers tend to withhold environmental information and selectively disguise sensitive environmental information [30,31]. Tang (2020) preliminarily discussed the human causes that form the greenwashing of the local government in the stages of collecting, mediating, and disseminating environmental information [32]. Kosajan (2018) evaluated the level of GEID of the 31 provinces in China and revealed that the overall level was categorized as “medium”, and none of the provinces was categorized as “excellent” [33]. Moreover, in May 2021, the Ministry of Ecology and Environment of China reported that the existing environmental information disclosure system has problems such as incomplete content, insufficient supervision, poor information quality, and difficulty in accessing information, so that the critical role of supporting ecological environment governance has not effectively worked. The above arguments reveal that the environmental information disclosed by local governments in China may not accurately and completely present the actual environmental conditions.
This paper takes 120 (The total number of China’s key environmental protection cities is 120. The key environmental protection cities are the ones that are strictly supervised and focused on by the country in terms of environmental protection and governance, and were designated in “China’s 12th Five-Year Plan for Environmental Protection”) of China’s key environmental protection cities included in the Pollution Information Transparency Index (PITI), jointly issued by the Institute of Public and Environmental Affairs (IPE) and the Nature Resources Defense Council (NRDC), as the object of research, and explores the correlation between GEID level and local environmental performance, as well as its regional effects in the Chinese context. This study provides new perspectives in terms of studying GEID, enriches the content of the regional environmental effects of GEID policy, and provides a reference for future decision-making and implementation.
2. Research Hypotheses and Model Building
2.1. Government Environmental Information Disclosure and Environmental Performance
Many studies have constructed systems with which to evaluate the implementation effects of GEID policies in different regions [34,35,36]. To a certain extent, this research has proved that GEID policy could improve the ecological environment quality. Based on a panel dataset of publicly listed Chinese firms from 2008 to 2015, Sun (2019) proposed that the information transparency of GEID can provide support for governments’ decision-making in regard to environmental governance, the activity levels of environmental nongovernment organizations, the participation of the general public in environmental issues, and the promotion of corporate environmentalism [29]. This shows that GEID policy can indirectly promote the improvement of environmental performance by influencing the behaviors of stakeholders, including the government, nongovernment organizations, the public, and enterprises. Kosajan (2018) proposed that environmental information disclosure is not only an important environmental management tool but is also a significant subfield of government information disclosure [33]; over 60 countries and regions around the world have established their own government information disclosure systems, and the related theoretical research has advanced considerably. In addition, the 19th CPC National Congress clearly pointed out that China’s environmental governance system should gradually improve the ecological environment quality in the form of government-led public participation. As the basis for triggering the joint action of the government, enterprises, and society, GEID policy is an important institutional guarantee in regard to promoting ecological environment harmony and building ecological civilizations. Environmental inspectors, implemented from 2015, further defined environmental protection as the “inspection” of the environmental information disclosed. Moreover, according to the theory of Signal Transmission, the environmental information disclosed by the government can not only show actual local environmental conditions but can also protect the public’s right to know about the environment and further encourage the public to participate in the disclosure of environmental information, thereby further promoting the local government in terms of implementing and strictly following the central government’s policies and regulations.
This paper aims to analyze the correlation between GEID and environmental performance and verify whether or not the environmental information disclosed by the government can objectively reflect actual local ecological environment conditions. Among them, environmental performance is measured by the emission intensity of major pollutants, including the emission intensity of industrial sewage discharge, industrial sulfur dioxide, and industrial smoke (dust), and the industrial solid waste treatment rate [22].
Based on the above theoretical analysis, the following hypotheses are proposed:
Hypothesis 1a.
The level of GEID can significantly reflect environmental performance.
Hypothesis 1b.
The higher the level of GEID, the lower the emission intensity of industrial sewage.
Hypothesis 1c.
The higher the level of GEID, the lower the emission intensity of industrial smoke (dust).
Hypothesis 1d.
The higher the level of GEID, the lower the emission intensity of industrial sulfur dioxide.
Hypothesis 1e.
The higher the level of GEID, the higher the treatment rate of industrial solid waste.
2.2. Regional Effects
China is huge and there are thus large gaps between regions, geographical features, development levels, and the quality of life of citizens. The amount of environmental information disclosed by the government is closely related to regional environmental governance, enterprises’ green production, and residents’ green living, each of which shows strong regional characteristics [22]. The level of environmental information disclosed by the government is positively and significantly correlated with innovation capability, corporate pressure, the environmental policies adopted by the provincial government, and the suggestions proposed by NPC representatives and CPPCC members, which are all heterogeneous in different regions [37]. At the same time, the performance of the water environment depends on the level of local economic development, resource utilization, population density, and biological survival, and these indicators all have regional characteristics [35,36]. In addition, Sun (2019) showed that, in the context of China, the relationship between the government’s environmental information transparency and corporate environmentalism is stronger for regions where government bureaucracy capabilities are stronger [29]. So, regional effects may influence the improvement effects of GEID on environmental quality to a certain extent, causing it to exist in unbalanced ways across the country. Yang and Zhao (2018) found that the impact of environmental disclosure policies on the ecological environment is not coordinated, nor is it sufficient, and there are significant regional differences [38].
From the perspectives of different regions, in the eastern region, the economy is developed and, while ensuring GDP growth, the region pays more attention to “green GDP”. Based on citizen appeals, the efficiency of government environmental law enforcement has been improved through public participation in GEID, making local environmental governance effects relatively significant. However, in the central and western regions, industries are singular and have poor innovation capabilities, and the local economy is over-reliant on the abundant resources available. Under the assessment mechanism of “GDP competition”, there may be only “policies” involved in the disclosure of environmental information. Public environmental data is only “avoiding the real thing” and cannot truly reflect the regional environmental performance. The “economic tournament” line of logic, which pursues GDP data alone, may result in the selective disclosure of environmental information, reducing the promotion effect of GEID on the ecological environment. That is, the environmental information published by local governments cannot truly reflect the regional environmental performance. Based on the above theoretical analysis, the following hypotheses are proposed:
Hypothesis 2a.
Compared with the eastern region, the correlation between GEID and environmental performance in the central and western regions is weaker.
Hypothesis 2b.
Compared with the eastern region, the correlation between GEID and the discharge intensity of industrial sewage in the central and western regions is weaker.
Hypothesis 2c.
Compared with the eastern region, the correlation between GEID and the emission intensity of industrial smoke (dust) in the central and western regions is weaker.
Hypothesis 2d.
Compared with the eastern region, the correlation between GEID and the emission intensity of industrial sulfur dioxide in the central and western regions is weaker.
Hypothesis 2e.
Compared with the eastern region, the correlation between GEID and the treatment rate of industrial solid waste in the central and western regions is weaker.
Through the above theoretical analysis, this paper constructs a theoretical model, as shown in Figure 1.
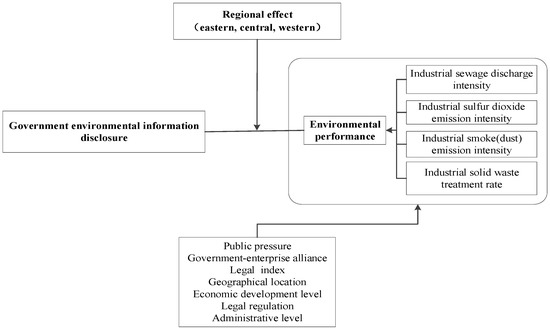
Figure 1.
Theoretical model.
3. Methods
3.1. Sample and Data
This study involves all 120 key environmental protection cities in China since 2013, which equates to 35.6% of 337 cities nationwide. The key environmental protection cities are the ones that are strictly supervised and focused on by the country in terms of environmental protection and governance and were designated in “China’s 12th Five-Year Plan for Environmental Protection”. The 120 cities are widely distributed throughout almost all the regions of China (eastern, central, and western), cover 28 provinces or municipalities in mainland China. The sampled cities are representatives making strides in environmental information transparency and inform the IPE and NRDC’s assessment targets for the level of environmental information disclosure. Among these 120 cities, there are 53 cities in eastern China, distributed across ten provinces (Shanghai, Hebei, Beijing, Tianjin, Jiangsu, Zhejiang, Fujian, Shandong, Guangdong, and Hainan); 32 cities in central China, distributed across eight provinces (Shanxi, Liaoning, Jilin, Heilongjiang, Anhui, Jiangxi, Henan, Hubei, and Hunan); and 35 cities in western China, distributed across ten provinces (Inner Mongolia, Guangxi, Sichuan, Guizhou, Yunnan, Shaanxi, Gansu, Ningxia, Xinjiang, and Chongqing). The lowest GDP was just 0.0202 billion RMB in 2016, while the highest GDP reached 2.7466 billion RMB in 2016, showing that the sampled cities are not limited to big cities. Overall, these cities are dispersed widely and can thus represent the basic conditions of pollution supervision in Chinese cities. The specific 120 cities in 28 provinces are presented in Appendix A. The sample spans four years from 2013 to 2016 (480 city-year observations).
The GEID data were extracted from annual PITI reports (Taken from the website of the Institute of Public & Environmental Affairs (IPE) (http://www.ipe.org.cn/) (accessed on 12 February 2021)). Data regarding urban environmental performance were collected from the China City Statistical Yearbook, which was developed by the National Bureau of Statistics of China (NBS) and provides information on the pollutant emissions of each city. The city’s other characteristics (e.g., GDP per capita, proportion of state-owned enterprises) were drawn from 120 local city statistical yearbooks (The website http://www.chinayearbook.com/yearbook/ (accessed on 12 February 2021) provided most local city statistical yearbooks. A few missing statistical yearbooks were further inquired about with the related cities’ information sources). Data regarding each local legal index were collected from the Yearbook of China City Competitiveness (It is annually developed by the China Institute of City Competitiveness, Hong Kong, China). Data regarding the pressure of public environmental appeals were manually acquired through the Baidu Index (Similar to Google Trends, the Baidu Index is a data-sharing platform based on Baidu’s netizen behavior data, developed by the Baidu company in China; it is the world’s largest Chinese search engine. Using the Baidu Index, we can gain insight into internet users’ interests and needs, and monitor public opinion trends through keyword searches).
3.2. Measures
City-level environmental performance (CEP) is defined as the effort and performance regarding how successful a city is in minimizing or reducing its impact on the natural environment. To date, studies seeking to evaluate environmental performance across different layers have been constrained by data availability [39,40]. Various methods have been employed to capture environmental performance. Independent databases provided by third parties have typically been relied on in firm-level studies—for example, the Toxic Release Inventory (TRI) (e.g., Al-Tuwaijri, 2004; Clarkson, 2008) [4,41], the Kinder, Lydenberg, Domini index (KLD social performance ranking) (e.g., Dawkins, 2011; Cho, 2007) [42,43], and the European Pollutant Release and Transfer Register (EPRTR) (e.g., Horváthová, 2012) [44]. At the national or regional levels, some researchers have constructed composite indexes of environmental performance, such as the Composite Index of Environmental Performance (CIEP) and the Environmental Performance Index (EPI) (Almeida, 2016; García-Sánchez, 2015) [45,46]. However, many constituent indicators were involved, such as in the EPI, the framework of which contains nine environmental issues and 21 indicators that form the total EPI score and cover more than 150 countries. Thomaskos and Alexopoulos (2016) revealed that the informational content of the EPI is, in a large part, explainable by the level of carbon intensity (CO2/GDP), one of the environmental indicators for policy control and pollution; they suggested that carbon intensity may be used as a proxy for regional environmental performance [47]. At the regional or industry level, some studies have also adopted pollutant emissions as proxies for environmental performance, such as industry environmental emission intensity (e.g., Qi, 2014) [48], greenhouse gas emissions and waste intensity (e.g., Fujii, 2013; Li, 2014; Trumpp, 2015) [49,50,51], and aggregated indexes of emissions (e.g., Li, 2018; Wagner, 2005) [52,53]. Based on the concept of city-level environmental performance and data availability, we also adopt the main environmental pollutants (i.e., smoke/dust emissions, sulfur dioxide emissions, industrial sewage discharge, and industrial solid waste treatment) that each city releases in the air, in water, and on land, to reflect their overall impacts on the natural environment in our study. Considering the different economic scales of cities (“Economic scales of cities” refers to the city-level GDP. Considering the different levels of economic development, the pollutants emission among cities must be different. In China, generally, the higher the GDP, the more industrial enterprises, and the more pollutants would be discharged. So the pollutants emission per unit GDP can better measure pollution intensity), environmental pollutant emission intensity (that is, emissions per unit of city-level GDP) is used to measure the city-level environmental performance (CEP) in this study.
The details of the environmental pollutants and the CEP indicators are presented in Table 1.

Table 1.
CEP indicators included and estimated with environmental pollutants.
The level of government environmental information disclosure (GEID) is measured through the annual pollution information transparency index (PITI). The aims of developing PITI are to clarify the baseline during the first year of environmental information disclosure, record every step of China’s progress, identify and promote positive local practices, and advocate for the disclosure of environmental information. The PITI of cities in annual reports is jointly developed by the Institute of Public and Environmental Affairs (IPE) (The IPE is a registered non-profit environmental research organization established in Beijing in 2006. It works to promote environmental information disclosure, public participation, and effective environmental governance strategies) and the Natural Resources Defense Council (NRDC) (The NRDC is an international non-profit environmental organization that combines the power of more than three million members and supporters with the expertise of some 500 lawyers, scientists, and other environmental specialists. Since 1970, the NRDC has worked to protect the world’s natural resources, public health, and environment across countries and regions (e.g., the United States, China, and the European Union, etc.)), which are devoted to protecting the public environment by assessing the disclosure of pollution source supervision information and portraying the efforts that local governments have taken in regard to the content and level of environmental information disclosure) [29,54]. The first evaluation results were released in June of 2009 and the latest report (2020) is the tenth issue. This integrated evaluation system includes five primary indicators: environmental supervision information, pollution source self-disclosure, interactive response, enterprise emission data and environmental impact assessment information, as well as eight secondary indicators. Each indicator is measured from four dimensions: systematicness, timeliness, completeness, and user-friendliness. The PITI provides a ranking of cities in regard to local environmental disclosure according to each city’s assessment scores, ranging between 0 and 100. The year’s PITI could be regarded as an indicator of the openness of pollution supervision information in different cities in a year [54], which contains information disclosure across 10 criteria: (1) the disclosure of daily excessive emissions and other violation records; (2) the disclosure of enterprise environmental performance/credit ratings; (3) discharge fee breakdown disclosure; (4) automatic monitoring data disclosure; (5) the disclosure of information about key polluting entities; (6) complaints and reports information disclosure; (7) disclosure upon request; (8) the emission data disclosure of key polluting enterprises; (9) cleaner production audit data disclosure; and (10) environmental impact assessment (EIA) information disclosure.
Each criterion is assigned a value and is scored according to its environmental disclosure level, as displayed publicly. The total value of all criteria is 100. Thus, each city gains a total PITI score by adding together the values of the 10 criteria used to evaluate its level of local government environmental information disclosure (GEID). The level of GEID reflects the degree of effort exerted by local governments in regard to environmental disclosure.
Control Variables. In order to prevent the results from being driven by cities’ heterogeneity, we control a set of variables (economic development, geographic location, the city’s administrative hierarchy, local government-enterprise political connections, legal regulatory stringency, and local public pressure on environmental protection) at the city level.
The economic development of a city is assessed as the natural logarithm of the per capita GDP, which has been shown to be linked to a city’s environmental governance [54]. Local governments with higher economic development have more financial resources for environmental improvement. Geographic location is defined as where a city is located in a region. China has a vast territory with multiple nations and unbalanced development. Drawing on the traditional method of geographic division [55,56], China can be divided into three main regions (i.e., eastern, central, and western regions). We set two nominal variables for the three regions; that is, eastern (“1” if the city is located in eastern China, and “0” otherwise) and central (“1” if the city located in central China, and “0” otherwise). The provincial capital city has a higher administrative hierarchy than other cities in the province. It is the seat of a provincial government, generally serves as the political and economic center of the province and can absorb more political and economic resources [57]. We set a dummy variable for a city’s administrative hierarchy; if a city belongs to a provincial capital, it is assigned a value of 1, and 0 otherwise. Local government-enterprise political connections refer to the relationships between the local government and regulated enterprises through political connections, establishing a community of interests [58], which may harm the environmental governance and information disclosure [59] due to the city’s GDP competition and local protectionism. The local government-enterprise political connection is closely tied to the ownership of enterprises, especially state-owned enterprises (SOEs), which are naturally connected with and more sheltered by the local government, as both owners and regulators [60]. The larger the proportion of SOEs in a city, the stronger the political connection between the government and enterprises. We use the proportion of SOEs as the proxy variable to reflect the degree of the political connection between the government and enterprises. Prior studies have found that stricter legal regulatory stringency spurs emissions reduction in industrial sectors [61,62]. A city’s environmental governance will also be affected by the soundness and enforcement of local laws. The Legal Index was built to reflect local legal regulatory stringency, which can be extracted from the Yearbook of China City Competitiveness. As documented by prior studies, public opinion may affect environmental governance by putting pressure on local governments [63,64]. Traditional collective behavior has been dramatically changed by the internet. Public opinion on the internet can spread in a short period of time, serving as an aggregated online reflection of opinions or appeals regarding public affairs [65]. We used the Baidu Index (similar to Google Trends), which uses data mining from web search queries to analyze public opinion [66] and was developed by baidu.com, the largest online search engine in China, as a proxy variable to measure public pressure regarding environmental protection (accumulatively with environmental protection as Chinese keywords). Considering the stability of the year-city Baidu Index, we adopted a robust approach that, for each city in a year, records the average values of the Baidu Index over the last four years, reflecting the intensity and breadth of opinions, attitudes, and concerns of the public and the attention of governmental authorities. We also use year dummies to capture unobserved factors that do not vary across cities in a given year but change over time (e.g., environmental regulatory pressure nationwide upon all the cities). This study adopts robust multiple regression for panel data, controlling the influence of years and regions.
4. Results
Table 2 shows the descriptive statistics of the PITI from 2013 to 2016. According to the trends shown in the PITI, the level of GEID has an overall upward trend, with the average score gradually improving (28.5 in 2013, 44.3 in 2014, 49.6 in 2015, and 52.3 in 2016). However, GEID was still in its initial stages in China during this period, and the average score was still low; even in 2016, its average score was not more than 60 points. This suggests that more specific and stricter controls for GEID are urgent in China. In addition, the city with the highest PITI score (Wenzhou) had a score of 78.1, while the city with the lowest PITI score (Linfen) had a score of only 23.6 in 2016. The differences between the maximum and the minimum values of the PITI in each year exceeds 50, indicating that there is still a large gap in the level of GEID among cities. The cities with lower GEID levels are distributed in central and western China, and cities located in eastern China have relatively high GEID levels, revealing a clear regional effect.
Table 2.
Descriptive statistics of the PITI and major environmental pollutants.
It is also found, as shown in Table 2, that the emissions of major environmental pollutants in 120 cities decreased from 2013 to 2016, especially the emission intensity of SO2 from 26.723 to 12.374 tons per capita GDP. During the sampling period, industrial sewage discharge intensity (from 3.498 to 2.131 tons per capita GDP) and industrial smoke (dust) emission intensity (from 15.845 to 11.506 tons per capita GDP) were also significantly reduced.
The trend in the level of GEID changed in a reverse manner in regard to the emission intensity of the main pollutants. Overall, increasing environmental pressure in recent years in China has given a constant impetus for local environmental governance [21,23], which can drive local governments to improve their environmental performance and the level of environmental information disclosure.
Table 3 reports the descriptive statistics for the year-city observations in the full sample. The maximum value of per capita GDP is ¥467,749, the minimum value is ¥17,504, and the average value is ¥70,459, indicating that the regional economy is quite unbalanced. 44.2% of cities in the sample are located in eastern China, 26.7% in central China, and 29.1% in western China. The maximum proportion of SOEs is 39% (the average value is 8.3%), which reflects the significantly varied proportion of SOEs in cities. The average legal regulatory stringency is 0.445 (minimum = 0.1, maximum = 1), showing that the local laws and regulations of some cities are sound, and the legal enforcement efficiency is high, while others are imperfect, and the nationwide degree of legal regulatory stringency is moderately lower. Local public pressure on environmental protection also has great heterogeneity (the maximum year-city value is 438, the minimum value is 0, and the average value is 109.952). This reveals that some cities’ environmental protection, with high Baidu Index scores (Like Google Trends, the Baidu Index is a data sharing platform based on Baidu’s massive netizen behavior data; it was developed by a company, Baidu (also responsible for the world’s largest Chinese search engine), in China. Here, we can gain insight into internet users’ interests and needs, and monitor public opinion trends by keyword search), have great appeal for citizens, while a few cities have very low Baidu Index scores, indicating that the public’s environmental awareness and participation in some cities should still be further strengthened.
Table 3.
Descriptive statistics of year-city observations in the full sample.
Table 3 also provides a comparison of the characteristics of cities in eastern, central, and western China. The differences between the three groups were examined using a one-way ANOVA. The average PITI score and the environmental performance variables of the eastern sub-sample were significantly better than that of the central and western sub-samples at the level of p < 0.05, except for in regard to sewage discharge. This shows that eastern cities disclosed more environmental information and achieved superior local environmental performance on the whole. Moreover, the eastern region has significantly stronger public environmental appeal, higher economic levels, stricter legalization levels, and lower proportions of SOEs than the central and western regions. However, the two groups of cities in central and western China have relatively small differences in GEID, environmental performance, and control variables. Therefore, it is necessary to model the relationship between GEID and CEP in the view of different regions (i.e., eastern, central, and western China), respectively.
Table 4 reports the Pearson’s correlation coefficients. The bivariate correlations show that the four proxy pollutant indicators can capture environmental performance from differentiated perspectives. Smoke (dust) intensity is positively correlated with SO2_intensity (r = 0.586, p < 0.01) and sewage intensity (r = 0.130, p < 0.01), and has the expected negative correlation with solid treatment rate (r = −0.213, p < 0.01). None of the absolute values of the correlations of other independent variables is more than 0.8, indicating that multicollinearity is not a concern (Hair, 1996; Kenny, 2003).
Table 4.
Pearson’s correlation matrix.
To test the hypotheses, this paper uses a multiple regression method to analyze the theoretical model (Figure 1). Table 5 presents the regression results examining the associations between the level of GEID and the CEP, using the full sample. F tests are reported for each model and show that all of the regressions are significant. In Table 5, Models M1, M3, M5, and M7 are restricted and are included for comparison purposes. We find that the estimated coefficients of the PITI in Model M4 (−0.141, p < 0.05) and in Model M6 (−0.216, p < 0.05) are negative and statistically significant, indicating that cities with better GEID levels have lower smoke (dust) and SO2 emission intensities as a whole, supporting Hypotheses 1c and 1d. In Model M2, the regression coefficient of the PITI is positive (i.e., 0.007) but statistically insignificant (p > 0.1); thus, GEID level is not yet related to industrial sewage discharge intensity. Model M8 shows that cities with better GEID levels have higher solid treatment rates, as expected (the coefficient of the PITI is 0.549 and significant at p < 0.01), supporting Hypothesis 1e. Except for Hypothesis 1b, Hypotheses 1a, 1c, 1d, 1e are verified. Possible reasons for these results are as follows. First, according to the theory of Maslow’s hierarchy of needs, public demand is hierarchical. Only when people’s survival needs are met can they form incentives to pursue other needs. The quality of the ecological environment is a “high-end good”; the most urgent need is the atmosphere, while the attention that needs to be paid to water pollution is relatively lower. This also fully reflects the low levels of public participation in the disclosure of government environmental information, especially in the prevention of water pollution [67]. Second, large state-owned enterprises are mostly engaged in industrial production activities; their administrative level is higher than that of the local environmental authorities, and they have the ability to interfere with local government behaviors [68], which causes the proportion of SOEs to have a negative impact on environmental performance (as shown in Model M2, the coefficient value is 0.387, although it is not significant).
Table 5.
Results of the multiple regression analysis.
Table 3 reveals that there are obvious regional differences in GEID level, public environmental appeals, the proportion of SOEs, the per capita GDP, and legal regulatory stringency. To further examine Hypotheses 2a–2e, we performed regression analysis regarding eastern, central, and western China, respectively. As Models A1–A4 in Table 6 show, the estimated coefficients and the statistical significance of the level of GEID on smoke (dust)_intensity, SO2_intensity, sewage_intensity, and solid treatment rate are −0.288 (p < 0.05), −0.273 (p < 0.01), −0.003 (p > 0.1), and 0.549 (p < 0.01), respectively. The association between the level of GEID and environmental performance indicators in the eastern China sub-sample is consistent with the results revealed in Table 5 using the full sample. In Models A1–A4 in Table 6, public appeal in eastern China has an impact on smoke (dust) and SO2 emissions, and sewage discharge at the p < 0.05 level, indicating that public environmental awareness in eastern China is not only higher but can also promote the environmental performance of the local government. In addition, we found that the cities with smaller proportions of SOEs and more stringent legal systems in eastern China have better environmental performance.
Table 6.
Regression results of the eastern region sample.
As shown in Models B1–B4 and C1–C4 in Table 7 and Table 8, different from those in the eastern China areas, the central and western sub-samples reported that the relationship between the level of GEID and the three environmental performance indicators are all statistically insignificant, though the regression coefficients regarding the level of GEID and environmental performance indicators in western China are consistent with those in eastern China. Hence, the level of GEID in China’s central and western cities cannot reflect the real environmental performance of the local government, which supports Hypothesis 2a; that is, there is a regional effect on the association between GEID and CEP. Unlike in the east of China, we find that local legal regulatory stringency in central and western China does not have an effect on the environmental performance of the local government. Further, public environmental appeals in central China still do not contribute to environmental improvement.
Table 7.
Regression results of the central region sample.
Table 8.
Regression results of the western region sample.
To test whether or not the results are robust, we check the dependence of error terms in the application of a panel dataset and exclude the particular samples (i.e., Shanghai, Beijing, Tianjin, and Chongqing), the four municipalities directly governed by the Chinese central government, and those with greater economic scales and populations, as well as other urban characteristics that are not comparable with those of other prefecture-level cities.
Since the panel datasets from 2013 to 2016 have lots of cities straddling across the four years, we adopt year dummy variables to absorb the time effect as far as possible. It is nevertheless necessary to estimate unbiased city-year two-way cluster standard errors in case the residuals are correlated across cities or years (that is, in which the residuals of a given city may be correlated across years, and the residuals of a given year may be correlated across different cities). Following the method developed by Petersen (2009), we provide the city-year two-way unbiased cluster-robust standard errors adjustment, with which we can check two general forms of dependence (the city effect and the year effect) (For further details, see Petersen (2009). The STATA programming code is available via (www.kellogg.northwestern.edu/faculty/petersen/htm/papers/se/se_programming.htm) (accessed on 20 April 2021). We ran regressions for each of the four resulting variables (see Models D1–D8 in Table 9) and, in each regression, we included all control variables. As Petersen (2009) suggested comparing the different standard errors, we can observe that the estimation of two-way standard errors is slightly bigger than the Eicker–Huber–White robust standard errors (rather than exceeding the threshold of two to four times), which indicates that the chance that city and time effects are present is very small and thus is not a concern.
Table 9.
Robustness analysis results.
In Table 9, the results of each of these regressions in Models D1–D8 yielded coefficients of the same significance as the main results in our original Models M1–M8 (Table 5), regardless of whether or not we excluded the samples with the four municipalities (i.e., Shanghai, Beijing, Tianjin, and Chongqing), as shown by Models E1–E8 in Table 10.
Table 10.
Regression results after removing municipalities.
We also assessed whether or not our results were robust for different regional sub-samples (i.e., eastern, central, and western China, respectively) using Petersen’s method and including and excluding the samples with the municipalities (The results are not presented in the article but are available from the authors upon request). We again found that the coefficients of the four consequent variables were of the same significance as Table 5 previously revealed. These results present strong evidence that our results are robust.
In summary, the findings are as follows. First, on the whole, the correlation between GEID and CEP is significant; the higher the level of GEID, the better the local environmental performance. Second, the level of GEID in the western region is much lower than the average of the whole country but is slightly higher than that in the central region. It is able to reflect the local environmental performance but is not significant. The level of GEID in the central region is the lowest. It is not able to reflect the local environmental performance. Third, the air pollutant information disclosed, such as sulfur dioxide, industrial smoke, and industrial dust, is highly consistent with the local environmental performance, while the sewage discharge information disclosed is not.
5. Discussion
The results reveal that, GEID can reflect the local environmental performance in the context of China, and to a certain extent, this proves that GEID policy could improve the ecological environment quality. But there is a regional effect on the relationship between GEID and environmental performance. In the eastern region, the policies regarding GEID are well implemented, and the published environmental information clearly reflects the local environmental conditions. In the central and western regions, however, the published environmental information and the actual environmental conditions are inconsistent. This means environmental information disclosed by local governments is distorted seriously, and local governments enforcement and public participation are far from adequate. The main recommendations of this study are as follows:
- (1)
- Improve the quality of GEID
With wide public participation, GEID can effectively improve the ecological environment [21], but there is still distortion between open environmental information and actual environmental performance. For the “beautiful” environmental indicators, some local governments “modify” the contents of GEID without achieving the ideal environmental governance effects [23], which results in the environmental information disclosed by governments becoming incompatible with local environmental performance. Therefore, local governments should change the traditional management line of thought that only partial environmental information should be released to the public for the purpose of political control, truly implement service-oriented government models, and further strengthen the laws and regulatory systems of GEID, so as to improve the authenticity and reliability of public environmental information, enhance the legitimacy of the governance in question and the extent to which public policies can be implemented, meet public environmental information demands, and improve GEID quality. This can be achieved by, for example, adding more inspection departments that supervise the authenticity of GEID; completing the indicators for evaluating the GEID level and sustainability performance based on the future scenarios of ecological environment [69]; encouraging and supporting the supervision of citizens, communities, and non-governmental environmental organizations [70,71]; and clarifying the substantive content of the environmental information disclosed by government environmental authorities. In addition, more than 80% of the relevant information and data in China are still in the hands of local governments [37], the scope of environmental information disclosure is still relatively small, and there is still a great deal of undisclosed and partially disclosed information. It is necessary to further expand the scope of the subjects of environmental information disclosure.
- (2)
- Coordinate GEID among regions
There are significant differences in economic development, production factors, and policy implementation among regions [37,72]. In the eastern region, the economic and citizen bases are great [37,72], but the ecological environment is not protected well. Therefore, the eastern region should make full use of its own resource endowments, develop regional characteristics, and create a dual optimal situation in which economic growth and ecological environment development are on a par with each other, for example, introducing renewable energy sources, developing innovative energy systems, etc. [73,74]. At the same time, the eastern region should provide environmental governance assistance, environmental protection funds, and technical support for less developed areas, as well as realizing cross-regional environmental co-governance. In the central regions, it is necessary to transform industries, develop diversified industries, and introduce advanced technologies to simultaneously improve the efficiency of resource use, control potential crises regarding the ecological environment, and improve the regional economy. In the western region, the number of industrial cities is relatively low, and the total amount of pollutants is relatively small. It is nevertheless necessary to improve the level of environmental information disclosure and strengthen cooperation and exchange with other regions.
There are significant differences in GEID level among regions. In the eastern region, the level of GEID effectively reflects local environmental performance. On this basis, the eastern region needs to further improve its environmental governance mechanisms, to encourage the public and enterprises to participate in environmental protection voluntarily. In the central and western regions, GEID is still in the initial stages of construction. These regions should therefore learn from the experiences of eastern China by actively promoting environmental law enforcement, strengthening the accounting capacity of ecological indicators, improving the quality of monitoring personnel, and developing the construction of information disclosure platforms.
There are significant differences in environmental performance among regions, so local governments must not only continue to pay attention to air quality but should also pay more attention to sewage discharge and soil.
- (3)
- Increase public participation in GEID
It is necessary to strengthen the breadth and depth of public participation in GEID. On the one hand, local governments should encourage and organize citizen participation, media promotions, and supervision by environmental organizations, and jointly build information feedback platforms to strengthen the interactions between stakeholders. On the other hand, local governments should develop a standardized procedure for public participation and allow the public to participate in the entire process of GEID, from the occurrence of any incident to environmental information feedback, so as to ensure interactions take place in an orderly manner, as well as the integrity and authenticity of the public environmental information.
It is further necessary to establish a remedying system in regard to the right to have access to environmental information. Without remedy, there is no right [75,76]. If there is legislation that gives rights, there must be legislation that remedies rights [76]. The government must formulate corresponding remedying systems while safeguarding the public’s right to have access to environmental information. This is a further development in the environmental information disclosure system. Outside the administrative system, an open information courtroom may be established to resolve disputes related to environmental information disclosure in a fair and open environment, and to compensate for losses caused by local government inaction [68]. Environmental information disclosure policies must not only protect the national information security, but also the interests of the public. Accordingly, it is important to improve the rights remedying mechanisms for environmental information disclosure.
6. Conclusions
In conclusion, this study further empirically verifies the theories of Polycentric Governance and Signal Transmission and extends their application to the research on GEID by integrating GEID and environmental performance into a new framework based on data from environmental protection cities in China. We tested this framework empirically and found that, in China, GEID can reflect local environmental performance on the whole, and there is a significant regional effect on this relationship.
Compared with existing research, this paper proposes a novel model that combines GEID, CEP, and regional effects. It empirically validates the theories of Polycentric Governance and Signal Transmission in the implementation of Chinese GEID policy.
There are some limitations to this study. One of the constraints is that this study only uses data from China, thus, we were unable to capture any cross-country effects that may alter the relationship between GEID and environmental performance. Prior studies have noted the significant variation in environmental behaviors across nations [77]. Another limitation is that the relationship between GEID and environmental performance may vary with the changing of environmental information regulations; for example, the Ministry of Ecology and Environment of China is planning an environmental information disclosure system reform to enhance the demands on environmental information disclosure; therefore, the relationship between GEID and environmental performance may change. In the future, we will carry out long-term follow-up research.
Author Contributions
Conceptualization, X.Z.; Data curation, Y.Z.; Investigation, Y.Z.; Methodology, X.Z.; Software, X.M.; Supervision, X.M.; Validation, X.M.; Visualization, X.Z.; Writing—original draft, Y.Z.; Writing—review & editing, X.Z. and X.M. All authors have read and agreed to the published version of the manuscript.
Funding
This research was funded by the National Natural Science Foundation of China (Grant No. 71573185) and the University Philosophy and Social Science Foundation of Jiangsu (Grant No. 2019SJA1213).
Institutional Review Board Statement
Not applicable.
Informed Consent Statement
Not applicable.
Data Availability Statement
The data presented in this study are available on reasonable request from the corresponding author.
Conflicts of Interest
The authors declare no conflict of interest.
Appendix A
Table A1.
Distribution of 120 sampled cities.
Table A1.
Distribution of 120 sampled cities.
| Region | Province/ Municipality | City | Region | Province/ Municipality | City |
|---|---|---|---|---|---|
| Eastern | Beijing | Beijing | Central | Heilongjiang | Harbin Qiqihar Daqing Mudanjiang |
| Tianjin | Tianjin | ||||
| Hebei | Shijiazhuang Tangshan Qinhuangdao Handan Baoding | ||||
| Anhui | Hefei Wuhu Maanshan | ||||
| Liaoning | Shenyang Dalian Anshan Fushun Benxi Jinzhou | Jiangxi | Nanchang Jiujiang | ||
| Henan | Kaifeng Zhengzhou Luoyang Pingdingshan Anyang Jiaozuo Sanmenxia | ||||
| Shanghai | Shanghai | ||||
| Jiangsu | Nanjing Wuxi Xuzhou Changzhou Suzhou Nantong Lianyungang Yangzhou Zhenjiang Yancheng | ||||
| Hubei | Wuhan Yichang Jingzhou | ||||
| Hunan | Changsha Zhuzhou Xiangtan Yueyang Changde Zhangjiajie | ||||
| Zhejiang | Hangzhou Ningbo Wenzhou Jiaxing Huzhou Shaoxing Taizhou | ||||
| Western | Inner Mongolia | Hohhot Baotou Chifeng Ordos | |||
| Guangxi | Nanning liuzhou Guilin Beihai | ||||
| Fujian | Fuzhou Xiamen Quanzhou | ||||
| Chongqing | Chongqing | ||||
| Shandong | Jinan Qingdao Zibo Zaozhuang Yantai Weifang Jining Taian Rizhao Weihai | Sichuan | Chengdu Zigong Panzhihua Huzhou Deyang Mianyang Nanchong | ||
| Yibin | |||||
| Guizhou | Guiyang Zunyi | ||||
| Guangdong | Guangzhou Shaoguan Shenzhen Zhuhai Shantou Foshan Zhanjiang Zhongshan Dongguan | Yunnan | Kunming Qujing Yuxi | ||
| Shaanxi | Xi’an Tongchuan Baoji Xianyang Weinan Yanan | ||||
| Central | Shanxi | Taiyuan Datong Yangquan Changzhi Linfen | Gansu | Lanzhou Jinchang | |
| Ningxia | Xining Yinchuan Shizuishan | ||||
| Jilin | Changchun Jilin | Xinjiang | Urumqi Karamay |
References
- Meng, K.X.; Yang, L.Y. The managerial effect of environmental information disclosure and enterprise environmental performance improvement: Based on the data of China’s heavy pollution enterprises from 2011 to 2015. J. Guizhou Univ. Financ. Econ. 2017, 6, 70–81. [Google Scholar]
- Wang, W.G. Legislation Studies on Right to Know Environment; China Leg. Press: Peking, China, 2012. [Google Scholar]
- Ostrom, V.; Charles, M.T.; Warren, R. The Organization of Government in Metropolitan Areas: A Theoretical Inquiry. Am. Political Sci. Rev. 1961, 55, 831–842. [Google Scholar] [CrossRef]
- Carlisle, K.; Gruby, R.L. Polycentric systems of governance: A theoretical model for the commons. Policy Stud. J. 2019, 47, 927–952. [Google Scholar] [CrossRef]
- Ma, S.Y. A theoretical analysis on government environmental disclosure in China. Leg. Syst. Expo. 2015, 9, 283. [Google Scholar]
- Liu, F.; Kong, X.F. Enlightenment and warning of multi-center governance theory: A political thinking on Elinor Ostrom obtaining Nobel Prize in Economics. Adm. Reform 2010, 1, 68–72. [Google Scholar]
- Ostrom, E. Governing the Commons: The Evolution of Institutions for Collective Action; Cambridge University Press: Cambridge, UK, 1990. [Google Scholar]
- Gerged, A.M.; Beddewela, E.S.; Cowton, C.J. Does the quality of country-level governance have an impact on corporate environmental disclosure? Evidence from Gulf Cooperation Council countries. Int. J. Financ. Econ. 2021. [Google Scholar] [CrossRef]
- Zhang, Q.; Chen, W.Y.; Feng, Y.C. The effectiveness of China’s environmental information disclosure at the corporate level: Empirical evidence from a quasi-natural experiment. Resour. Conserv. Recycl. 2021, 164, 105158. [Google Scholar] [CrossRef]
- Wiseman, J. An evaluation of environmental disclosures made in corporate annual reports. Account. Organ. Soc. 1982, 7, 53–63. [Google Scholar] [CrossRef]
- Dye, R.A. Disclosure of non-proprietary information. Account. Res. 1985, 23, 123–145. [Google Scholar] [CrossRef]
- Freedman, W.C. The association between environmental performance and environmental disclosure in annual report and 10-Ks. Adv. Public Interest Account. 1990, 3, 183–193. [Google Scholar]
- Ten, E. Determinants of environmental disclosures in a developing country: An application of the stakeholder theory. Fourth Asia Pac. Interdiscip. Res. Account. Conf. Singap. 2004, 4, 1–28. [Google Scholar]
- Clarkson, P.M.; Li, Y.; Richardson, G.D.; Vasvari, F.P. Revisiting the relation between environmental performance and environmental disclosure: An empirical analysis. Account. Organ. Soc. 2008, 33, 303–327. [Google Scholar] [CrossRef]
- Dawkins, C.; Fraas, J.W. Coming clean: The impact of environmental performance and visibility on corporate climate change disclosure. Bus. Ethics. 2011, 100, 302–322. [Google Scholar] [CrossRef]
- Wu, H.J. Environmental information disclosure, environmental performance and equity capital costs. J. Xiamen Univ. 2014, 3, 129–138. [Google Scholar]
- Li, J. Research on the Differences and Regulations of China’s Regional Environmental Efficiency; Academy of Social Sciences Press: Peking, China, 2012. [Google Scholar]
- Zeng, X.G.; Bi, R.H. An alysis on the overall evaluation and regional differences of green economy development. Res. Environ. Sci. 2014, 27, 1564–1570. [Google Scholar]
- Huang, Y.R.; Meng, F.R.; Chen, Z.T.; Liu, J. The determinants of government environmental disclosure: An empirical research based on the PITI of Chinese cities. J. Intell. 2017, 36, 149–155. [Google Scholar]
- Gao, S.; Ling, S.; Liu, W.H. The role of social media in promoting information disclosure on environmental incidents: An evolutionary game theory perspective. Sustainability 2018, 10, 4372. [Google Scholar] [CrossRef]
- Gao, S.; Ling, S.; Liu, X.; Dou, X.; Wu, R. Understanding local government’s information disclosure in China’s environmental project construction from the dual-pressure perspective. J. Clean. Prod. 2020, 263, 121311. [Google Scholar] [CrossRef]
- Zheng, L.L.; Li, X.H. Research on the influencing factors of government environmental disclosure from the perspective of information ecology. Theor. J. 2018, 3, 77–83. [Google Scholar]
- Yang, H.J. Research on the influencing factors of China’s local government environmental information disclosure. East China Univ. Political Sci. Law. 2019. [Google Scholar] [CrossRef]
- Feng, Y.; He, F. The effect of environmental information disclosure on environmental quality: Evidence from Chinese cities. J. Clean. Prod. 2020, 276, 124027. [Google Scholar] [CrossRef]
- Yang, Y.; Lu, A.J.; Zhang, Z.Q. Can government environmental information disclosure promote environmental governance? Based on empirical research in 120 cities. Trans. Beijing Inst. Technol. 2020, 22, 41–48. [Google Scholar]
- Song, L.; Jing, J.; Yan, Z.; Sun, C. Does government information transparency contribute to pollution abatement? Evidence from 264 Chinese cities. Environ. Sci. Pollut. Res. 2021, 1, 1–11. [Google Scholar]
- Zhang, Z.B. Public participation, regulatory information disclosure and urban environmental governance: Based on panel data analysis of 35 key cities. Theory Pract. Financ. Econ. 2021, 42, 109–116. [Google Scholar]
- Lu, J.; Li, H. The impact of government environmental information disclosure on enterprise location choices: Heterogeneity and threshold effect test. J. Clean. Prod. 2020, 277, 124055. [Google Scholar] [CrossRef]
- Sun, D.; Zeng, S.; Chen, H.; Meng, X.; Jin, Z. Monitoring effect of transparency: How does government environmental disclosure facilitate corporate environmentalism? Bus. Strategy Environ. 2019, 28, 1594–1607. [Google Scholar] [CrossRef]
- Ji, Z.; Yu, X.; Yang, J. Environmental information disclosure in capital raising. Aust. Econ. Pap. 2020, 59, 183–214. [Google Scholar] [CrossRef]
- Peng, J.; Tu, G.; Liu, Y.; Zhang, H.; Leng, B. The integration role of governmental information disclosure platform: An evolutionary game analysis of corporate environmental monitoring data fraud. Kybernetes 2020, 49, 1347–1379. [Google Scholar] [CrossRef]
- Tang, Y.; Yang, R.; Chen, Y.; Du, M.; Yang, Y.; Miao, X. Greenwashing of local government: The human- caused risks in the process of environmental information disclosure in China. Sustainability 2020, 12, 6329. [Google Scholar] [CrossRef]
- Kosajan, V.; Chang, M.; Xiong, X.Y.; Feng, Y.; Wang, S.W. The design and application of a government environmental information disclosure index in China. J. Clean. Prod. 2018, 202, 1192–1201. [Google Scholar] [CrossRef]
- Park, K. Environmental motivations, use of environmental performance measurement systems, and performance. J. Manag. Econ. 2018, 40, 1–30. [Google Scholar]
- Zhang, L. Research on the construction of government water environment performance audit evaluation index system based on DPSIR concept framework. Value Eng. 2018, 37, 25–27. [Google Scholar]
- Chen, Z.F.; Li, Q. Research on the government environmental performance auditing evaluation based on PSR model: Taking Dianchi lake pollution control project as an example. Sci. Technol. Econ. 2019, 32, 106–110. [Google Scholar]
- Huang, Y.M.; He, L.Y. Urbanization, environmental pollution and subjective well-being: An empirical study on China. China Soft Sci. 2013, 12, 81–93. [Google Scholar]
- Yang, W.P.; Zhao, J.K. Does government environmental disclosure contribute to the improvement of ecological environment quality? Econ. Manag. 2018, 8, 5–22. [Google Scholar]
- Clarkson, P.M.; Overell, M.B.; Chapple, L. Environmental reporting and its relation to corporate environmental performance. Abacus 2011, 47, 27–60. [Google Scholar] [CrossRef]
- Meng, X.H.; Zeng, S.X.; Shi, J.J.; Qi, G.Y.; Zhang, Z.B. The relationship between corporate environmental performance and environmental disclosure: An empirical study in China. J. Environ. Manag. 2014, 145, 357–367. [Google Scholar] [CrossRef]
- Al-Tuwaijri, S.A.; Christensen, T.E.; Hughes, K.E. The relations among environmental disclosure, environmental performance, and economic performance: A simultaneous equations approach. Account. Organ. Society. 2004, 29, 447–471. [Google Scholar] [CrossRef]
- Dawkins, C.E.; Fraas, J.W. Erratum to: Beyond acclamations and excuses: Environmental performance, voluntary environmental disclosure and the role of visibility. J. Bus. Ethics. 2011, 99, 383–397. [Google Scholar] [CrossRef]
- Cho, C.H.; Patten, D.M. The role of environmental disclosures as tools of legitimacy: A research note. Account. Organ. Soc. 2007, 32, 639–647. [Google Scholar] [CrossRef]
- Horváthová, E. The impact of environmental performance on firm performance: Short-term costs and long-term benefits? Ecol. Econ. 2012, 84, 91–97. [Google Scholar] [CrossRef]
- Das Neves Almeida, T.A.; García-Sánchez, I.M. A comparative analysis between composite indexes of environmental performance: An analysis on the CIEP and EPI. Environ. Sci. Policy. 2016, 64, 59–74. [Google Scholar] [CrossRef]
- García-Sánchez, I.M.; Almeida, T.; Camara, R.P.B. A proposal for a composite index of environmental performance (CIEP) for countries. Ecol. Indic. 2015, 48, 171–188. [Google Scholar] [CrossRef]
- Thomakos, D.D.; Alexopoulos, T.A. Carbon intensity as a proxy for environmental performance and the informational content of the EPI. Energy Policy 2016, 94, 179–190. [Google Scholar] [CrossRef]
- Qi, G.Y.; Zeng, S.X.; Shi, J.J.; Meng, X.H.; Lin, H.; Yang, Q.X. Revisiting the relationship between environmental and financial performance in Chinese industry. J. Environ. Manag. 2014, 145, 349–356. [Google Scholar] [CrossRef] [PubMed]
- Fujii, H.; Iwata, K.; Kaneko, S.; Managi, S. Corporate environmental and economic performance of Japanese manufacturing firms: Empirical study for sustainable development. Bus. Strategy Environ. 2013, 22, 187–201. [Google Scholar] [CrossRef]
- Li, Y. Environmental innovation practices and performance: Moderating effect of resource commitment. J. Clean. Prod. 2014, 66, 450–458. [Google Scholar] [CrossRef]
- Trumpp, C.; Endrikat, J.; Zopf, C.; Guenther, E. Definition, conceptualization, and measurement of corporate environmental performance: A critical examination of a multidimensional construct. J. Bus. Ethics. 2015, 126, 185–204. [Google Scholar] [CrossRef]
- Li, R.; Ramanathan, R. Impacts of Industrial Heterogeneity and Technical Innovation on the Relationship between Environmental Performance and Financial Performance. Sustainability 2018, 10, 1653. [Google Scholar] [CrossRef]
- Wagner, M. How to reconcile environmental and economic performance to improve corporate sustain-ability: Corporate environmental strategies in European paper industry. J. Environ. Manag. 2005, 76, 105–118. [Google Scholar] [CrossRef]
- Li, G.; He, Q.; Shao, S.; Cao, J. Environmental non-governmental organizations and urban environmental governance: Evidence from China. J. Environ. Manag. 2018, 206, 1296–1307. [Google Scholar] [CrossRef] [PubMed]
- Hu, J.L.; Wang, S.C. Total-factor energy efficiency of regions in China. Energy Policy 2006, 34, 3206–3217. [Google Scholar] [CrossRef]
- Yang, L.; Cheng, S.; Wang, X.; Nie, W.; Xu, P.; Gao, X.; Yuan, C.; Wang, W. Source identification and health impact of PM2.5 in a heavily polluted urban atmosphere in China. Atmos. Environ. 2013, 75, 265–269. [Google Scholar] [CrossRef]
- Wang, Y.; Ying, Q.; Hu, J.; Zhang, H. Spatial and temporal variations of six criteria air pollutants in 31 provincial capital cities in China during 2013-2014. Environ. Int. 2014, 73, 413–422. [Google Scholar] [CrossRef]
- Claessens, S.; Feijen, E.; Laeven, L. Political connections and preferential access to finance: The role of campaign contributions. J. Financ. Econ. 2008, 88, 554–580. [Google Scholar] [CrossRef]
- Yao, S. Political buffer and environmental regulation effect. Collect. Essays Financ. Econ. 2012, 1, 84–90. [Google Scholar]
- Guo, H.C.; Yao, S. Political Connections and Local Government’s Environmental Information Disclosure. Collect. Essays Financ. Econ. 2014, 9, 60–67. [Google Scholar]
- Brunel, C.; Levinson, A. Measuring the stringency of environmental regulations. Rev. Environ. Econ. Policy 2016, 10, 47–67. [Google Scholar] [CrossRef]
- Wang, R.; Wijen, F.; Heugens, P.P.M.A.R. Government’s green grip: Multifaceted state influence on corporate environmental actions in China. Strateg. Manag. J. 2017, 39, 403–428. [Google Scholar] [CrossRef]
- Shi, Q.L.; Guo, F.; Chen, S.Y. “Political Blue Sky” in fog and haze governance: Evidence from the local annual “Two Sessions” in China. China Ind. Econ. 2016, 33, 40–56. [Google Scholar]
- Zhang, S.; Li, Y.; Hao, Y.; Zhang, Y. Does public opinion affect air quality? Evidence based on the monthly data of 109 prefecture-level cities in China. Energy Policy 2018, 116, 299–311. [Google Scholar] [CrossRef]
- Shao, P.; Wang, Y. How does social media change Chinese political culture? The formation of fragmentized public sphere. Telemat. Inform. 2017, 34, 694–704. [Google Scholar] [CrossRef]
- Vaughan, L.; Chen, Y. Data mining from web search queries: A comparison of google trends and baidu index. J. Assoc. Inf. Sci. Technol. 2014, 66, 13–22. [Google Scholar] [CrossRef]
- Fu, H.L.; Liu, X.J. Verification and influence strategy of public psychological infection in reclaimed water reuse. Resour. Sci. 2018, 40, 1222–1229. [Google Scholar]
- Haley, G. Subsidies to Chinese Industry: State Capitalism, Business Strategy, and Trade Policy; Oxford University Press: New York, NY, USA, 2013. [Google Scholar]
- Boyko, C.T.; Gaterell, M.R.; Barber, A.R.G.; Brown, J.; Bryson, J.R.; Butler, D.; Rogers, C.D.F. Benchmarking sustainability in cities: The role of indicators and future scenarios. Glob. Environ. Chang. 2012, 22, 245–254. [Google Scholar] [CrossRef]
- De Matteis, F.; Preite, D.; Striani, F.; Borgonovi, E. Cities’ role in environmental sustainability policy: The Italian experience. Cities 2021, 111, 102991. [Google Scholar] [CrossRef]
- Martos, A.; Pacheco-Torres, R.; Ordóñez, J.; Jadraque-Gago, E. Towards successful environmental performance of sustainable cities: Intervening sectors. A review. Renew. Sustain. Energy Rev. 2016, 57, 479–495. [Google Scholar] [CrossRef]
- Dai, K.Z. Institutional environment, regional differences and knowledge productivity: Evidence from China’s provincial high-tech industries. Stud. Sci. Sci. 2015, 33, 369–377. [Google Scholar]
- Abu-Rayash, A.; Dincer, I. Development of integrated sustainability performance indicators for better management of smart cities. Sustain. Cities Soc. 2021, 67, 102704. [Google Scholar] [CrossRef]
- Ntanos, S.; Skordoulis, M.; Kyriakopoulos, G.; Arabatzis, G.; Chalikias, M.; Galatsidas, S.; Batzios, A.; Katsarou, A. Renewable Energy and Economic Growth: Evidence from European Countries. Sustainability 2018, 10, 2626. [Google Scholar] [CrossRef]
- Balcik, B.; Beamon, B.M.; Krejci, C.C.; Muramatsu, K.M.; Ramirez, M. Coordination in humanitarian relief chains: Practices, challenges and opportunities. Int. J. Prod. Econ. 2009, 126, 22–34. [Google Scholar] [CrossRef]
- Yang, W.P.; Zhao, J.K. Spatiotemporal differences and influencing factors of ecological environment quality of human settlements in China. East China Econ. Manag. 2018, 2, 58–67. [Google Scholar]
- Darnall, N.; Henriques, I.; Sadorsky, P. Adopting proactive environmental strategy: The influence of stakeholders and firm size. J. Manag. Stud. 2010, 47, 1072–1094. [Google Scholar] [CrossRef]
Publisher’s Note: MDPI stays neutral with regard to jurisdictional claims in published maps and institutional affiliations. |
© 2021 by the authors. Licensee MDPI, Basel, Switzerland. This article is an open access article distributed under the terms and conditions of the Creative Commons Attribution (CC BY) license (https://creativecommons.org/licenses/by/4.0/).