Article

The Order Selection Strategy of Polluting OEMs under Environmental Regulations

1
Harbin Institute of Technology, School of Management, Harbin 150001, China
2
China Special Economic Zone Research Center, Shenzhen University, Shenzhen 518057, China
*
Author to whom correspondence should be addressed.
Sustainability 2021, 13(12), 6835; https://doi.org/10.3390/su13126835
Submission received: 23 April 2021 / Revised: 8 June 2021 / Accepted: 8 June 2021 / Published: 17 June 2021

Abstract

:
Under environmental regulations, the government restricts the economic activities of polluting OEMs (Original Equipment Manufacturers) in order to improve ecological and economic efficiency. The most direct measure is to limit the production capacity of the companies. Under the condition of limited capacity, the order selection strategy of OEMs will be the direct determinant of the company’s own profits. In the foundry market, there are many low-profit orders, while the number of high-profit orders is limited and uncertain. Companies who choose to wait for high-profit orders must bear the waiting costs and the risk of losing a certain profit. Therefore, it is of great significance for the long-term development of the company to select orders to obtain the best profit under the condition of limited production capacity. This paper takes polluting OEMs as the research object and studies the optimal order selection problems of companies under environmental regulations by establishing order selection decision models for different foundry cycles under the condition of limited production capacity. The study found that in the single foundry cycle, there will be an optimal waiting-time threshold for high-profit orders. Based on this optimal waiting-time threshold, the corresponding order selection strategy can be effectively formulated. However, in the multi-foundation cycle, since the optimal waiting-time threshold of high-profit orders is affected by the long-term average profit, the company’s optimal order selection strategy is based on the long-term average profit maximization.

1. Introduction

Environmental regulation refers to the measures, policies, regulations and implementation processes that are restrictive to economic activities taken to improve ecological and economic efficiency with the goal of ecological civilization construction. Since polluting OEMs (Original Equipment Manufacturers) have the characteristics of high pollution, high energy consumption and high emissions in production, under the environmental regulation policies, polluting OEMs are important targets for a government to restrict pollution [1]. As we know, the existence of a government’s environmental regulation is to reduce the emissions of pollutants and protect the ecology. With the same technical level, the increasing capacity means more pollutants discharged. Therefore, the capacity of OEMs will be limited under environmental regulation. Although limiting the production capacity of polluting OEMs can reduce pollution emissions and improve the environment, it will also damage corporate profits and affect economic development, which hinders the implementation of environmental regulatory policies. In the foundry market, polluting OEMs often face the choice of two types of foundry orders. The first are high-value-added and high-profit orders, which we call the opportunity of high-profit orders (HPOs). Companies tend to prefer these kind of orders. However, due to the limited number of high-margin orders in the market and the uncertainty of their appearance, waiting for the emergence of high-margin orders requires bearing the waiting costs and the corresponding risks. Furthermore, companies can also choose low-value-added and low-profit orders (LPOs). These orders’ advantage lies in the large number of orders, and companies can obtain such orders at any time. Therefore, when enterprises are faced with capacity constraints brought about by environmental regulations, it is important for the long-term development of such OEMs and the construction of ecological civilization to formulate reasonable order selection strategies and maximize profits with limited capacity.
Meanwhile, for OEMs, the number of foundry cycles is also an important factor affecting profits [2], and two foundry opportunities (HPOs and LPOs) can be regarded as having the same foundry cycle in a single cycle. Therefore, on this basis, this paper first investigates the impact of the probability distribution of the occurrence of HPO foundry opportunities in the market on the optimal profit and order selection strategies of OEMs within a single foundry cycle. Then, the study is extended to multiple foundry cycles and the foundry cycles of the two orders cannot be considered the same, as the difference between the individual cycles of HPOs and LPOs will be cumulatively magnified in multiple foundry cycles. This requires companies to focus more on the acquisition of long-term average profits, and therefore the corresponding order selection strategy will change. Moreover, different countries have different ways to implement environmental regulation, but the purpose and results may be the same, namely, to reduce the pollution of OEMs. This paper studies how the polluting OEMs adjust their own strategies to obtain the higher benefits under environmental regulation, which is conducive to polluting OEMs to adapt to the corresponding environmental regulation and promote sustainable development.

2. Literature Review

The literature review is divided into three main areas: the impact of environmental regulations, firm order selection, and capacity allocation. With respect to the effects of environmental regulation, when a government restricts the production and operation of high-pollution and high-emission enterprises, it will prompt enterprises to improve their own environmental protection awareness as well as to upgrade their technology and industrial structure [3,4]. Landi et al. hold the opinion that products must have ecological designs. As a preventive method, ecological design not only optimizes the environmental performance of products, but also maintains its functional quality, which is conducive to the development of social ecology and puts forward higher requirements for enterprises [5]. Landi et al. analyze and compare the environmental and technical performance of two home oven technologies. It can be seen that technological innovation is the key factor to environmental protection [6]. However, Fan and Sun believe that because of the long cycle, large upfront investment and high risk of green technology innovation, enterprises will also increase their costs under the conditions of environmental regulations [7]. In this regard, Xu et al. trade off the optimal emissions of production with the optimal production volume, especially in the MTO (make-to-order) supply chain, and find that the trade-off between optimal emissions and optimal production volume benefits not only the firm but also the entire supply chain [8]. Guhlich et al. and Beemsterboer et al. prove the random nature of order emergence and the difficulty of controlling the production of multiple orders [9,10]. Moreover, the order selection problem of the enterprise can not only affect the profit acquisition of the enterprise, but also reduce the environmental pollution caused by the enterprise in the production and operation process [11,12,13]. This is of great significance to the sustainable development of the enterprise. In order to solve the order selection problem of enterprises, Wang et al. studied the response and scheduling system when new orders enter through the online optimization scheduling method of multi-prediction scenarios [14]. The sequence-related issues between orders are also the key to the issue of order selection and scheduling, especially for orders within different planning periods [15]. In this regard, Zhang establishes an order selection model that weighs the current and future profits based on the background of the single production method to solve the problems related to the time series of orders [16]. Moreover, Zhang et al. propose the regulation of the weighted average production time ranking. In addition, the periodicity of orders is also a problem that companies cannot ignore [17]. When OEMs process the ordered products, they need to fully consider the impact of time and switching costs, and formulate a reasonable order selection plan [2]. Therefore, Nobil et al. have conducted research on the optimal cycle length of each product in the order and the number of delivery batches, using hybrid genetic algorithms and other methods to minimize the total inventory cost [18]. Buergin et al. optimized the mid-term and short-term order planning and studied the robustness of order selection [19].
Furthermore, due to the capacity constraints brought about by environmental regulations, OEMs need to make reasonable order selection decisions so that they can use limited capacity to maximize profits. This is not only conducive to improving the industry competitiveness of OEMs, but is also conducive to solving the problem of upgrading the functions of OEMs [20,21]. Jayaswal and Jewkes believe that the use of differentiated strategies for promised delivery times and prices in market segments can bring greater profits to companies with advantages in capacity and cost, which is conducive to solving the problem of capacity constraints [22]. Boulaksil et al. studied how OEMs allocate their own production capacity when facing random demand and established a model to solve the optimal capacity allocation strategy based on demand distribution [23]. Xie and Zhang establish a production capacity decision model based on the sensitivity of promised delivery time and the randomness of demand under capacity constraints, and finally obtain the company’s optimal promised delivery time and optimal production capacity [24]. The research method of this article refers to Choi et al.’s warehoused management strategies under the conditions of uncertain demand and time-sensitive production costs [25]. When facing the problem of relatively inaccurate demand information, we need to establish a model to study the optimal waiting time and production decision in the warehouse ordering strategy. Hui et al. also apply a similar method in the research on the best waiting strategy for consumers to purchase goods [26].
This article takes pollution-based OEMs as a key research object. Because in the context of environmental regulations the production capacity of polluting OEMs is limited, the correct choice of orders has become an important factor in creating profits [11,12,13]. Companies can choose low-profit OEM orders with low profits but a large number of them in the market, or they can choose to wait for high-profit OEM orders with high profits but small numbers and random occurrences while at the same time needing to bear the waiting costs. Previous studies have also highlighted the influence of the foundry cycle on order selection and profit acquisition [2,18,19]. Therefore, how to use the limited production capacity to select reasonable OEM orders under different OEM cycles to maximize profits is the key research issue of this article. This paper takes the limited production capacity of polluting OEMs under environmental regulations as the research background, studies the optimal order selection strategies of such OEMs and provides a theoretical basis for the strategic formulation of such polluting OEMs with the same situation.

3. Optimal Order Selection Model and Strategy Formulation

3.1. Model Strategy Selection within a Single Foundry Cycle

3.1.1. Basic Model Construction

In practice, OEMs (Original Equipment Manufacturers) will provide a standard OEM cycle or range to the client for reference by combining the process system from raw material preparation to online production and past experience and finally, determine the OEM cycle in the contract through further negotiation with the client. Therefore, this paper defines the total production capacity of the firm in the same foundry cycle as K , the net profit (minus the corresponding foundry cost) from each unit of production capacity foundry HPOs as h , the net profit from each unit of production capacity foundry LPOs as l and h > l . Since the HPOs in the foundry market are limited and uncertain, it can be assumed without loss of generality that the waiting time for the HPOs to appear is a random variable X , X [ x _ , x ¯ ] , where x ¯ may tend to be infinite and x _ 0 , and the probability distribution function of the HPOs appearing in the decision time t s is f ( · ) . The model in this paper is suitable for OEMs with limited capacity under environmental regulation, and the OEMs know the distribution of HPOs based on their previous experience.
When the waiting time for the OEMs to obtain HPOs is x , the waiting cost is C ( x ) and is an increasing function of x . Therefore, the total profit of HPOs and LPOs in a foundry cycle is π h = h K and π l = l K , respectively. Decision makers in OEMs need to decide whether to continue to wait for HPOs or choose the LPOs at the constant cost of waiting, and how to determine the optimal waiting time within a foundry cycle to achieve higher profitability and management efficiency.
The differences between HPOs and LPOs are based on their comparison. When the profit of one strategy is higher than another, we consider it a high-profit order. Of course, the probability of obtaining higher profit orders is lower. When the profit of one order is higher than another, it is named as high-profit order. In order to make the variable symbols and definitions clearer, the following Table 1 is given here.
Business decision-makers have three foundry strategies to choose from when faced with HPOs and LPOs: (1) High-profit order strategy H.—Accept HPOs and OEM high-profit products only; (2) Low-profit order strategy L.—Accept LPOs and OEM low-profit products only; and (3) Mixed strategy M ( y ) .—Define a waiting time y , and the decision-maker will choose HPOs when it appears before y . Once the waiting time exceeds y , the decision makers will choose LPOs based on the expected profit. Since decision makers are rational and their business goal is often to maximize expected profits, the time value of money will be taken into account during the decision time t s . Thus, introducing the discount factor α ( 0 , 1 ] , the profits of strategies H and L after discounting are and Π H and Π L , respectively, calculated as:
Π L = π l α t s Π H ( X ) = α t s + X ( π l C ( x ) )
The formula indicates the emergence time of HPOs, i.e., the waiting time of the firm after choosing strategy H. From Equation (1), we can see that the longer the waiting time, the lower the profit from HPOs. In particular, if there is Π L > Π H ( x _ ) , the strategy L is a better choice. But if there is Π L < Π H ( x ¯ ) , strategy H brings higher profits. The formula for calculating the expected profit for strategy H can be further expressed as:
Π H = α t s x _ x ¯ ( π h C ( x ) ) f ( x ) d x
When Π L > Π H ( x _ ) or Π L < Π H ( x ¯ ) , the decision makers can easily determine which strategy is better. The next focus is on what strategy the OEMs should adopt when Π H ( x _ ) < Π L < Π H ( x ¯ ) , i.e., α x ¯ ( h K C ( x ¯ ) ) < l K < α x _ ( h K C ( x _ ) ) .
Consider the hybrid strategy M, whose profit calculation formula is:
Π M ( X ; y ) = α t s + X ( π h C ( x ) ) 1 { X y } + α t s + y ( π l C ( y ) ) 1 { X > y }
For Equation (3), y denotes the waiting-time threshold, and when HPOs appear before y , there is 1 { X y } = 1 , while at other moments there is 1 { X > y } = 1 . From Equation (3), it follows that strategies H and L are the two extreme cases of the hybrid strategy M. The expected profit after discounting for a hybrid strategy with waiting-time threshold y can be further expressed as:
Π M ( y ) = α t s { x _ y α x ( π h C ( x ) ) f ( x ) d x + α y ( π l C ( y ) ) ( 1 F ( y ) ) }
In the hybrid strategy, when α x ¯ ( h K C ( x ¯ ) ) < l K < α x _ ( h K C ( x _ ) ) , the decision-makers of the OEMs need to choose the optimal waiting-time threshold y * and satisfy y * = a r g m a x y [ x _ , x ¯ ] Π M ( y ) .   F ( y ) means the Integral function representing   f ( y ) , and f ( y ) means the probability distribution of HPOs before time node y.

3.1.2. Optimal Order Selection Strategy

This section focuses on the optimal order selection strategy for a polluting OEMs with limited production capacity (assuming that the production line can accept only one production order at the same time) in a foundry cycle. We model the solution based on the probability distribution of high profit orders in the market, i.e., the probability distribution function of the moment X at which HPOs occurs, where the mean and variance of the random variable X are E ( X ) = μ and   D ( X ) = σ 2 , respectively.
For strategies H and L adopted by firms facing high- and low-profit orders, the following propositions are made.
Proposition 1.
We know that π h C ( x ¯ ) . When the waiting cost C ( x ) is a concave function of the waiting time x and increases with x , the optimal strategy of a firm is to wait and accept a high profit order if there is Π H ( μ ) Π L .
Proof. 
The waiting cost function for a firm has C ( x ) = C ( x ) x and C ( x ) = 2 C ( x ) x 2 . Since the waiting cost C ( x ) is a concave function of the waiting time x and increases with x , we have C ( x ) > 0 and C ( x ) 0 . From Equation (1), the corresponding first- and second-order derivatives of Π H ( x ) are:
Π H ( x ) x = α t s + X [ ( π h C ( x ) ) log α C ( x ) ] < 0
2 Π H ( x ) x 2 = α t s + X [ ( π h C ( x ) ) ( log α ) 2 2 C ( x ) log α C ( x ) ] > 0
Thus, the profit function Π H ( x ) of strategy H with respect to x is a convex function of x and decreases with x . According to Jensen’s inequality, we have Π H ( E ( X ) ) E ( Π H ( x ) ) , i.e., Π H ( μ ) Π H . Π H is the expected profit of strategy H in Equation (2). Therefore, if there is Π H ( μ ) Π L , there must be Π H Π L . At this point, the optimal choice for polluting OEMs is to wait for high-profit order opportunities. □
Proposition 1 provides us with a choice of strategies for polluting OEMs when faced with two kinds of orders. Especially when the waiting cost is a concave function of waiting time and increases with waiting time, if the profit from an HPO is not less than the profit from accepting low-profit orders directly, the best choice for the company is to wait for a high-profit foundry opportunity. This also shows that the average waiting time of HPO plays an important reference role in the production decision process of OEMs.
Next, we discuss the hybrid strategy M, i.e., whether there exists an optimal waiting-time threshold y * that maximizes the expected profit obtained by the firm and is superior to the order acceptance strategies H and L. The first order derivative of the hybrid strategy M with respect to the waiting-time threshold y is:
Π M ( y ) y = α t s + y ( 1 F ( y ) ) [ ( π h π l ) f ( y ) 1 F ( y ) + ( π l C ( y ) ) log α C ( y ) ]
where λ ( y ) = f ( y ) 1 F ( y ) denotes the failure rate of the waiting time X for a high-profit foundry order at X = y (which, in this paper, means the probability that no high-profit foundry opportunity arises before a given threshold y ). If we let G ( y ) = ( π h π l ) λ ( y ) + ( π l C ( y ) ) log α C ( y ) , then we have the following equations:
Π M ( y ) y = α t s + y ( 1 F ( y ) ) G ( y )
G ( y ) y = ( π h π l ) λ ( y ) C ( y ) log α C ( y )
From Equations (6) and (7), it can be concluded that λ ( y ) (failure rate) as well as the waiting cost function C ( x ) play an important role in the firm’s hybrid strategy M. Since λ ( y ) denotes the probability that the waiting time X for a high-profit foundry order is at X = y , we distinguish three typical distribution functions according to the different characteristics of variation exhibited by λ ( x ) with waiting time x : monotonically increasing λ ( x ) , monotonically decreasing   λ ( x ) and constant   λ ( x ) . The role of the Failure rate can be understood as follows: λ ( y ) is used to describe the conditional probability of occurrence of a high-margin foundry order. A monotonically increasing λ ( x ) means that the conditional probability of occurrence of a high-profit foundry order increases with time.
Thus, for a certain time point y of waiting, ( π h π l ) λ ( y ) means the potential profit that the firm can earn by choosing to continue waiting at y . Given the waiting-time threshold   y , the expression G ( y ) measures the potential profit margin of waiting additional time at y . In addition, ( π l C ( y ) ) log α C ( y ) is the potential loss due to additional waiting. When G ( y ) is positive, the firm that chooses to continue to wait will gain higher profits. However, when G ( y ) is negative, the firm should immediately choose to accept low-profit foundry orders. Next, we will analyze the optimal waiting-time threshold y * in the hybrid strategy starting from these three typical failure rates.
Proposition 2.
When the waiting cost function C ( x ) is concave with respect to x and increases with x , for λ ( x ) monotonically increasing with x and constant λ ( x ) , there is the following conclusion: when G ( x _ ) 0 and the optimal waiting-time threshold is y * = x ¯ , the firm’s optimal order selection strategy is strategy H. When G ( x ¯ ) 0 and the optimal waiting time is y * = 0 , the corresponding optimal order selection strategy is strategy L. When G ( x _ ) 0   G ( x ¯ ) and the optimal waiting-time threshold is y * = x ¯ or y * = 0 , the corresponding optimal order selection strategy is H or L. For λ ( x ) that decreases monotonically with x , there may be an optimal threshold y * in the waiting time range [ x _ , x ¯ ] so that the hybrid strategy M is the optimal order selection strategy.
Proof. 
The waiting cost function C ( x ) is concave with respect to x and increases with x . We have C ( x ) and C ( x ) . For the case that λ ( x ) increases monotonically with x or does not change with x , we have G ( y ) 0 for any y [ x _ , x ¯ ] according to Equation (7). Therefore, when G ( x _ ) 0 , for any y [ x _ , x ¯ ] , Π M ( y ) y 0 can be obtained, and thus the optimal waiting-time threshold should be y * = x ¯ and the optimal order selection strategy for the firm should be strategy H. When G ( x ¯ ) 0 , for any y [ x _ , x ¯ ] , Π M ( y ) y 0 can be obtained when the optimal waiting-time threshold should be y * = 0 and the optimal order selection strategy of the firm should be L. In particular, if both G ( x _ ) < 0 and G ( x ¯ ) > 0 are satisfied, the firm’s optimal order selection strategy should pick the foundry opportunity that brings higher expected profits, i.e., m a x ( Π H , Π L ) . Furthermore, when λ ( x ) is monotonically decreasing with x , the positive and negative nature of G ( y ) cannot be discerned. However, it follows that the nature of marginal profit G ( y ) and the potential profit ( π h π l ) λ ( y ) obtained by continuing to wait gradually decreases as y increases while the marginal profit G ( y ) from continuing to wait decreases. Therefore, there exists a threshold y * so that the marginal profit G ( y * ) = 0 and the mixed strategy profit is maximized, and this threshold is the optimal waiting-time threshold. □
Proposition 2 shows that when the failure rate increases monotonically with x or is constant, the firm’s optimal order selection strategy is one of two special forms of the mixed strategy M, i.e., one of the strategies H or L. Decision-makers in polluting OEMs simply need to calculate and compare the expected profits of these two pure strategies and choose the more profitable option. When λ ( x ) corresponding to the probability distribution of waiting time X = y decreases with x , ( π h π l ) λ ( y ) will decrease, resulting in a lower marginal profit G ( y ) from the continued waiting, and the hybrid strategy will be the optimal order selection strategy. The firm needs to further find the optimal waiting-time threshold y * when making G ( y * ) = 0 and make the optimal order selection based on this threshold.

3.1.3. Numerical Analysis under Single-Cycle Model

In this section, two specific arithmetic examples are used to explore the optimal foundry order selection strategy under different market conditions. For the sake of discussion, we assume that the firm’s waiting time cost function is C ( x ) = c x , c > 0 . We next focus on the case where the market probability distribution of high-profit orders is uniformly and exponentially distributed.
Case 1: The market probability distribution of high-profit orders is uniformly distributed.
Suppose that the firm derives from its own experience and the information it has about the demand for foundry work in the market that the opportunities for highly profitable foundry orders show a uniform distribution on [ 0 ,   b ] with f ( y ) = { 1 b , y [ 0 , b ] 0 . o t h e r , and, according to λ ( y ) = f ( y ) 1 F ( y ) , we can get λ ( y ) = 1 b y . At this point, λ ( y ) increases with y . Considering the time value of money, according to Equation (2), the expected profit of strategy H after introducing the discount rate is expressed as follows.
Π H = { α t s [ ( π h + c l o g α ) ( α b 1 ) c b α b b l o g α ] , α ( 0 , 1 ) π h c b 2 , α = 1
The first order derivative of Π H with respect to b is shown below.
Π H b = { α t s [ α b ( π h c b ) b 0 b α x ( π h c x ) d x b 2 ] 0 , α ( 0 , 1 ) c 2 < 0 , α = 1
When α = 1 , there exists some critical value b 1 = 2 ( π h π l ) c so that Π H = Π L . Since the first order derivative of Π H with respect to b is negative, Π H decreases as b increases. When b b 1 , the firm’s optimal order selection strategy is H. When b > b 1 , the optimal selection strategy is L.
When α ( 0 , 1 ) , there is lim b 0 Π H = π h > π l . Since Π H is decreasing with respect to b , there is also a certain critical value b 1 . When b b 1 , the firm’s optimal order selection strategy is H. To more intuitively describe the variation of the optimal strategy with the discount rate α and the upper limit b of the uniform distribution (let K = 10 , 000 , c = 20 , h = 10 , l = 5 and t s = 5 ), the optimal strategy selection under the uniform distribution is shown in the following Figure 1.
The left panel of Figure 1 shows the trend of Π H   as well as Π L with the waiting-time threshold for a given special value. It can be obtained that Π H decreases gradually as the upper bound b on the waiting time increases, indicating that more waiting costs will be lost as the time horizon for the appearance of the order expands. As a result, OEMs reduce their willingness to substitute high-profit orders and thus shift to substitute low-profit orders, with the turning point being the intersection of the curves of Π H and Π L . The right panel of Figure 1 shows the impact of different discount rates and waiting-time thresholds on a firm’s foundry strategies. At a fixed discount rate, the OEMs should change its order strategy immediately when the upper bound b of the waiting time exceeds the waiting-time threshold. It is also clear that OEMs who are more sensitive to time costs will not wait patiently for high value-added orders to emerge, which provides different order selection strategies for different OEMs.
Case 2: The market probability distribution of high-profit orders is exponential
When the high-profit foundry order opportunity is exponentially distributed in the market with respect to the waiting time X , the failure rate is λ ( x ) =   λ . The expected profit obtained by the firm by adopting strategy H can be expressed as: Π H = α t s 0 α x ( π h c x ) λ e λ x d x . When α = 1 , we can get Π H = π h c λ , and Π H increases with λ . Therefore, there must exist a critical λ c = c ( π h π l ) so that Π H = Π L . When the failure rate satisfies λ λ c , the firm’s optimal order selection strategy is H. The corresponding optimal order selection strategy is L when λ < λ c . Next, we consider the case where the discount rate is α ( 0 , 1 ) and when the expected profit obtained by the firm adopting strategy H is as follows.
Π H = α t s 0 α x ( π h c x ) λ e λ x d x α t s ( π h c λ )
At a certain critical value of λ c λ c , e.g., when λ λ c , the firm’s optimal order selection strategy is H. When λ < λ c , the firm’s optimal order selection strategy is L. Let K = 10 , 000 , c = 20 , h = 10 , l = 5 and t s = 5 . The optimal strategy selection under the exponential distribution is shown in the following Figure 2.
The left panel of Figure 2 shows the trend of Π H as well as Π L with failure rate λ for a given discount rate. It can be seen that Π H increases with the gradual increase of λ . When the increase of λ crosses the intersection point, the firm will gain more profit by choosing high-profit orders. The right panel of Figure 2, on the other hand, shows the effect of the failure rate λ and the discount rate α on the firm’s optimal order selection strategy, given the other conditions. When the discount rate is constant and the failure rate is above the threshold λ c , the firm will adjust its order selection strategy to obtain the optimal profit. It can also be seen from the graph that those patient OEMs, when they are not sensitive to the cost of waiting time, will choose to continue to wait for high-profit orders to come in despite the relatively low failure rate.

3.2. Order Selection Strategy in Multi-Foundation Cycle

3.2.1. Optimal Order Selection Strategy

In Section 3.1, we analyze the order selection strategy of the polluting OEMs in a single foundry cycle under environmental regulations. We now expand the single foundry cycle model into a multi-foundation cycle model and study the order selection performance of the OEMs. Given the probability distribution of high-profit orders in this foundry market, we focus on the optimal order selection strategy of the OEMs from a multi-foundation cycle perspective, with the goal of maximizing the long-term average profit per unit time.
In this section, we believe that the OEMs are able to know the probability distribution of HPOs appearance time in each foundry cycle by virtue of years of operating experience. OEMs pursue maximum long-term average profits by adopting optimal order selection strategy for each foundry cycle. We should let t L denote the days required for producing LPOs, that is, the length of the LPO’s foundry cycle, and t G denote the days required for producing HPOs, i.e., the length of the HPO’s foundry cycle. To simplify, we assume that the probability distribution function of the HPO’s appearance time X in one foundry cycle is f ( · ) . This assumption implies that the business opportunity of HPOs is a renewal process. Next, we study the threshold decision in the mixed strategy. Specifically, if the HPOs appeared before y , the OEM will choose the HPOs. Otherwise, they will choose the LPOs based on the expected profit after y . Thus, the cumulative profit from the multiple shipping cycles follows a renewal reward process, and in each cycle the profit is calculated as:
R ( X ; y ) = ( π h C ( x ) ) 1 { X y } + ( π l C ( y ) ) 1 { X > y }
We define the expected profit of each foundry cycle with waiting time y as E R ( y ) :
E R ( y ) = E ( R ( X ; y ) ) = x _ y ( π h C ( x ) ) f ( x ) d x + ( π l C ( y ) ) ( 1 F ( y ) )
The length of each foundry cycle is:
S ( X ; y ) = ( X + t G ) 1 { X y } + ( y + t L ) 1 { X > y }
As a result, the expected profit of each foundry cycle is E S ( y ) , which is as follows:
E S ( y ) = E ( S ( X ; y ) ) = x _ y ( X + t G ) f ( x ) d x + ( y + t L ) ( 1 F ( y ) )
We let R ( t ) denote the cumulative profit function of time t , and R A ( y ) denote the long-term average profit per unit time. We have:
R A ( y ) = lim t R ( t ) t = l i m t i = 1 N R ( X i ; y ) t
i = 1 N m i n ( X i ; y ) t . N   is the number of foundry cycles, and X i denotes the waiting time for the HPOs in each foundry cycle. The long-term average profit under the mixed strategy with the waiting-time threshold y in multiple foundry cycles is expressed as:
R A ( y ) = lim t R ( t ) t = E R ( y ) E S ( y ) = x _ y ( π h C ( x ) ) f ( x ) d x + ( π l C ( y ) ) ( 1 F ( y ) ) x _ y ( X + t G ) f ( x ) d x + ( y + t L ) ( 1 F ( y ) )
The optimal strategy is to select the optimal waiting-time threshold y * for each cycle to maximize the long-term average profit per unit time. We have the following propositions.
Proposition 3.
For y [ x _ , x ¯ ] , if ( ( π h π l ) λ ( y ) C ( y ) ) E S ( y ) ( ( t G t L ) λ ( y ) + 1 ) E R ( y ) 0 is satisfied, the optimal order selection strategy is choosing HPOs; if ( ( π h π l ) λ ( y ) C ( y ) ) E S ( y ) ( ( t G t L ) λ ( y ) + 1 ) E R ( y ) < 0 is satisfied, the optimal strategy is choosing LPOs. In addition, there must exist an optimal waiting-time threshold y * [ x _ , x ¯ ] , which leads to maximizing the long-term average profit.
Proof. 
The first order of the long-term average profit with waiting time y :
R A ( y ) y = ( E R ( y ) ) E S ( y ) E R ( y ) ( E S ( y ) ) ( E S ( y ) ) 2
E R ( y ) y = ( π h π l ) f ( y ) C ( y ) ( 1 F ( y ) )
E S ( y ) y = ( t G t L ) f ( y ) + ( 1 F ( y ) )
When R A ( y ) y 0 , the long-term average profit increases in the waiting time, which indicates that waiting for the appearance of HPOs can bring greater long-term benefits to the OEMs, and thereby HPOs are the optimal choice. When R A ( y ) y < 0 , the long-term average profit decreases in the waiting time, which indicates that waiting for the appearance of HPOs will damage the long-term average profits of the OEMs, and thus LPOs are the optimal choice. The optimal waiting-time threshold in multiple foundry cycles can be expressed as:
y * = a r g { max y * [ x _ , x ¯ ] E R ( y ) E S ( y ) = m a x y * [ x _ , x ¯ ] x _ y ( π h C ( x ) ) f ( x ) d x + ( π l C ( y ) ) ( 1 F ( y ) ) x _ y ( X + t G ) f ( x ) d x + ( y + t L ) ( 1 F ( y ) ) }
The optimal waiting-time threshold has an impact on the order selection strategy. The long-term average profit is π l t L if the OEMs choose LPOs to produce in each cycle, and therefore, once E R ( y * ) E S ( y * ) π l t L , the OEMs will accept the strategy H with the optimal waiting-time threshold y * , which results in a higher long-term average profit. Otherwise, the OEMs keep adopting LPOs strategy continuously. □
Proposition 3 shows that under the multi-foundation cycle situation, the production decision of the OEMs will still be affected by the failure rate, but different from the single cycle, in this case, the order selection decision has no relation with the specific nature of λ ( y ) . In the mixed strategy, when R A ( y ) y 0 , for the OEMs, choosing HPOs can obtain more profits than choosing LPOs. The long-term average profit is the key factor in the order selection process of the OEMs because of the difference in the foundry time between HPOs and LPOs in multiple foundry cycles, and in addition, the existence of the optimal waiting-time threshold y * not only offers the OEMs convenience to make a quick order selection, but is also an important standard to measure the profit changes of the OEMs.

3.2.2. Numerical Analysis in Multi-Foundation Cycle

We discuss the optimal order selection strategy under different market conditions in a multi-foundation cycle by using two concrete examples. Here we keep the assumption that the waiting cost of the OEMs is C ( x ) = c x , c > 0 . And the probability distribution of HPOs in this market has two cases: uniform distribution and exponential distribution.
Case 1: The probability distribution of HPOs is a uniform distribution.
Suppose that the OEM knows the probability distribution of HPOs is a uniform distribution in the support [ 0 , b ] , and we have ( y ) = { 1 b , y [ 0 , b ] 0 . o t h e r . According to λ ( y ) = f ( y ) 1 F ( y ) , we have λ ( y ) = 1 b y , and λ ( y ) increases in y . Under the waiting-time threshold y [ 0 , b ] , the expected profit and the expected length of each cycle are as follows:
E R ( y ) = ( π h π l ) y b + c y 2 2 b + π l c y ,   E S ( y ) = ( t G t L ) y b y 2 2 b + t L + y .
Then the optimal waiting-time threshold y * is:
y * = a r g { max y * [ x _ , x ¯ ] E R ( y ) E S ( y ) = m a x y * [ x _ , x ¯ ] ( π h π l ) y b + c y 2 2 b + π l c y ( t G t L ) y b y 2 2 b + t L + y }
To more specifically express the relation of the long-term average profit of the OEM with the waiting-time threshold y , let K = 10 , 000 , c = 20 , h = 10 , l = 5 , t G = t L = 5 and b = 10 . We will get Figure 3 as follows:
Figure 3 shows how the long-term average profit R A ( y ) varies with the waiting-time threshold y when the probability distribution of HPOs is uniform under given other conditions. It can be seen that R A ( y ) gradually increases with the increase of y after a period of decrease, and there exists a minimum value. Comparing the minimum value with π l t L , the OEM can quickly make the optimal order selection decision in a multi-foundation cycle. However, R A ( y ) will not increase indefinitely, because there is a zero point at T ( y ) = ( t G t L ) y b y 2 2 b + t L + y , and R A ( y ) will reach the maximum before T ( y ) reaches the zero point.
Case 2: The probability distribution of HPOs is an exponential distribution.
If the OEM knows that the probability distribution of HPOs in this market is exponential with the waiting time X , we have λ ( y ) = λ , which is a fixed value. Under the waiting-time threshold y [ 0 ,   ) , the expected profit and expected length of each cycle are as follows:
E R ( y ) = π h c y ( π h π l c y ) e x p ( λ y ) ,   E S ( y ) = t G ( t G t L ) e x p ( λ y ) + 1 λ ( 1 exp ( λ y ) )
Then the optimal waiting-time threshold y * is:
y * = a r g { max y * [ x _ , x ¯ ] E R ( y ) E S ( y ) = m a x y * [ x _ , x ¯ ] π h c y ( π h π l c y ) e x p ( λ y ) t G ( t G t L ) e x p ( λ y ) + 1 λ ( 1 exp ( λ y ) ) }
To specifically express the relation of the long-term average profit of the OEM with the waiting-time threshold y , let K = 10 , 000 , c = 20 , h = 10 , l = 5 , t G = t L = 5 and λ = 0.15 . We will get Figure 4 as follows:
Figure 4 shows the change of the long-term average profit R A ( y ) with the change of the waiting-time threshold y when the probability distribution of HPOs is exponential under the other given conditions. We can get R A ( y ) decreases in y , which indicates that the increase in the time threshold for the appearance of HPOs will make the OEMs more inclined to choose LPOs. Therefore, in the multi-foundation cycle, once the probability distribution of HPOs shows an exponential distribution, the OEMs need to be more sensitive to the change of the waiting-time threshold to be able to switch order selection strategies.
Based on the above analysis of environmental regulation, we know that the capacity of polluting OEMs is limited. In order to obtain the higher profits, in a single cycle, the OEMs need to obtain the specific distribution of λ ( x ) according to their market research and experience, and calculate the corresponding revenue of strategies H, M and L. In a multi-foundation cycle, the OEMs should choose the strategy according to the long-term average income. OEMs can choose the most suitable optimal strategy according to the research results of this article, and then obtain the optimal benefits.

4. Conclusions

In this paper, we study the optimal order selection strategy of the polluting OEMs when their production capacity is limited in the context of environmental regulations. Due to the uncertainty of high-value-added foundry order opportunities, OEMs need to pay the waiting costs while waiting for these opportunities, and they can also choose to accept the low-profit foundry orders, which are numerous in the market at any time. In addition, the difference between a single foundry cycle and multiple foundry cycles has an important impact on the OEMs’ order selection and profits. This paper builds an order selection model with different foundry cycles and analyzes the optimal order selection problem of OEMs under environmental regulations, which helps both governments and OEMs solve the dilemma between environmental protection and economic development. According to the research results of this article, the better allocation of production capacity under environmental regulations will be conducive to the sustainable operation of polluting OEMs, which will contribute to the sustainable development of the environment and economy.
The conclusions of this paper are as follows:
(1)
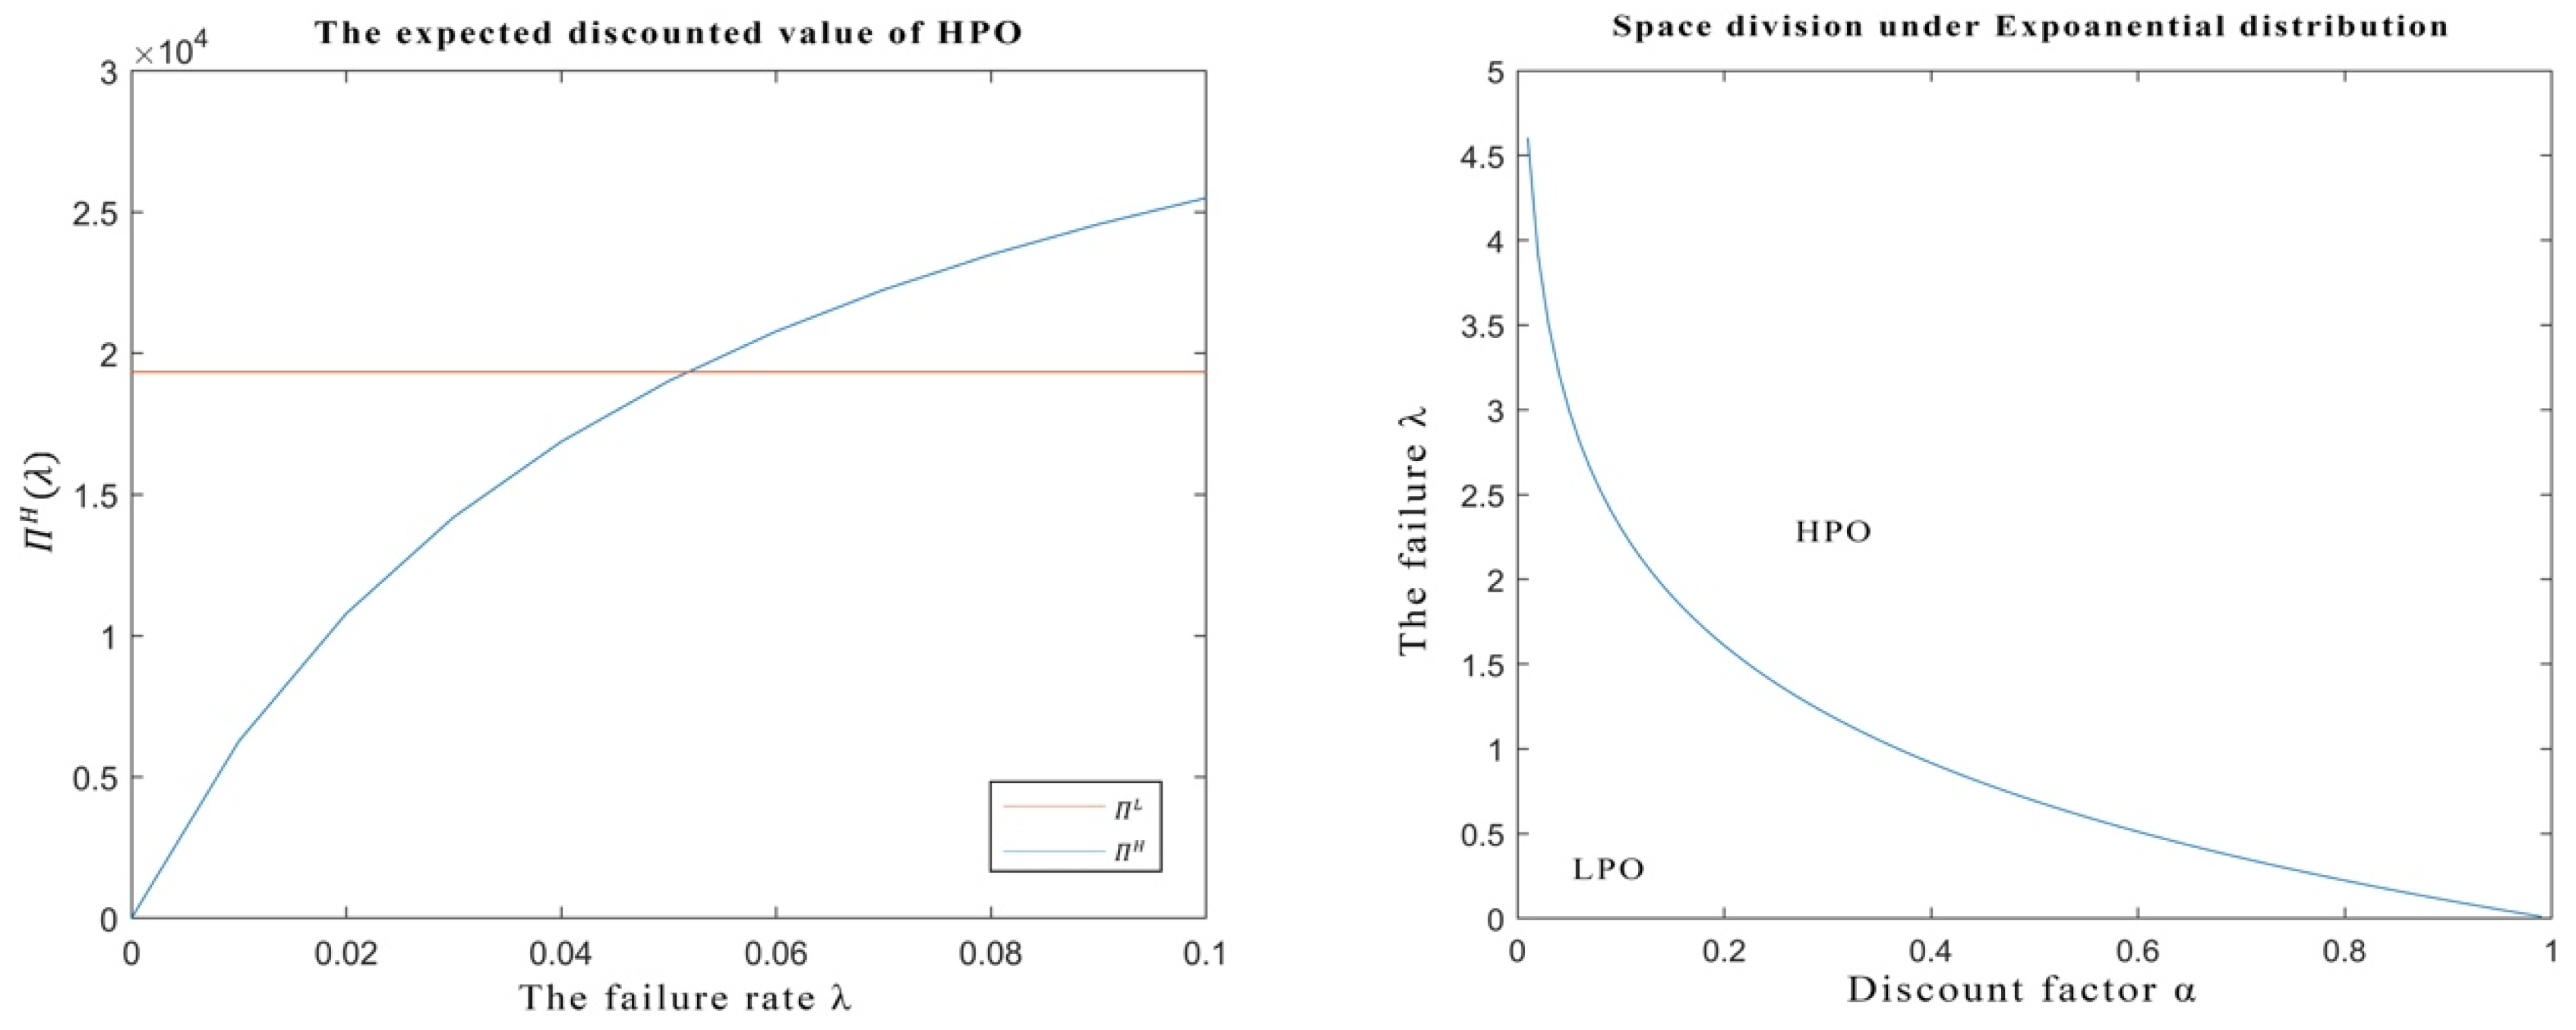
When the OEMs formulate the optimal strategy in single foundry cycle, the conditional probability λ ( x ) (failure rate) used to describe the appearance of high-profit foundry orders plays an important role in the decision-making process. Specifically, when λ ( x ) monotonically increases or remains unchanged in x , the optimal strategy of the firm is H or L, and there is no optimal mixed strategy M; when λ ( x ) monotonically decreases in x , there may be an optimal mixed strategy M so that the OEMs can obtain the maximum expected profit, which indicates that the conditional probability of high-profit orders is the key to the optimal order selection of the OEMs. In addition, regardless of the distribution of high-profit orders, the OEMs need to determine the corresponding optimal order selection strategy based on the optimal waiting time. Therefore, the optimal waiting-time threshold is important for making an order selection.
(2)
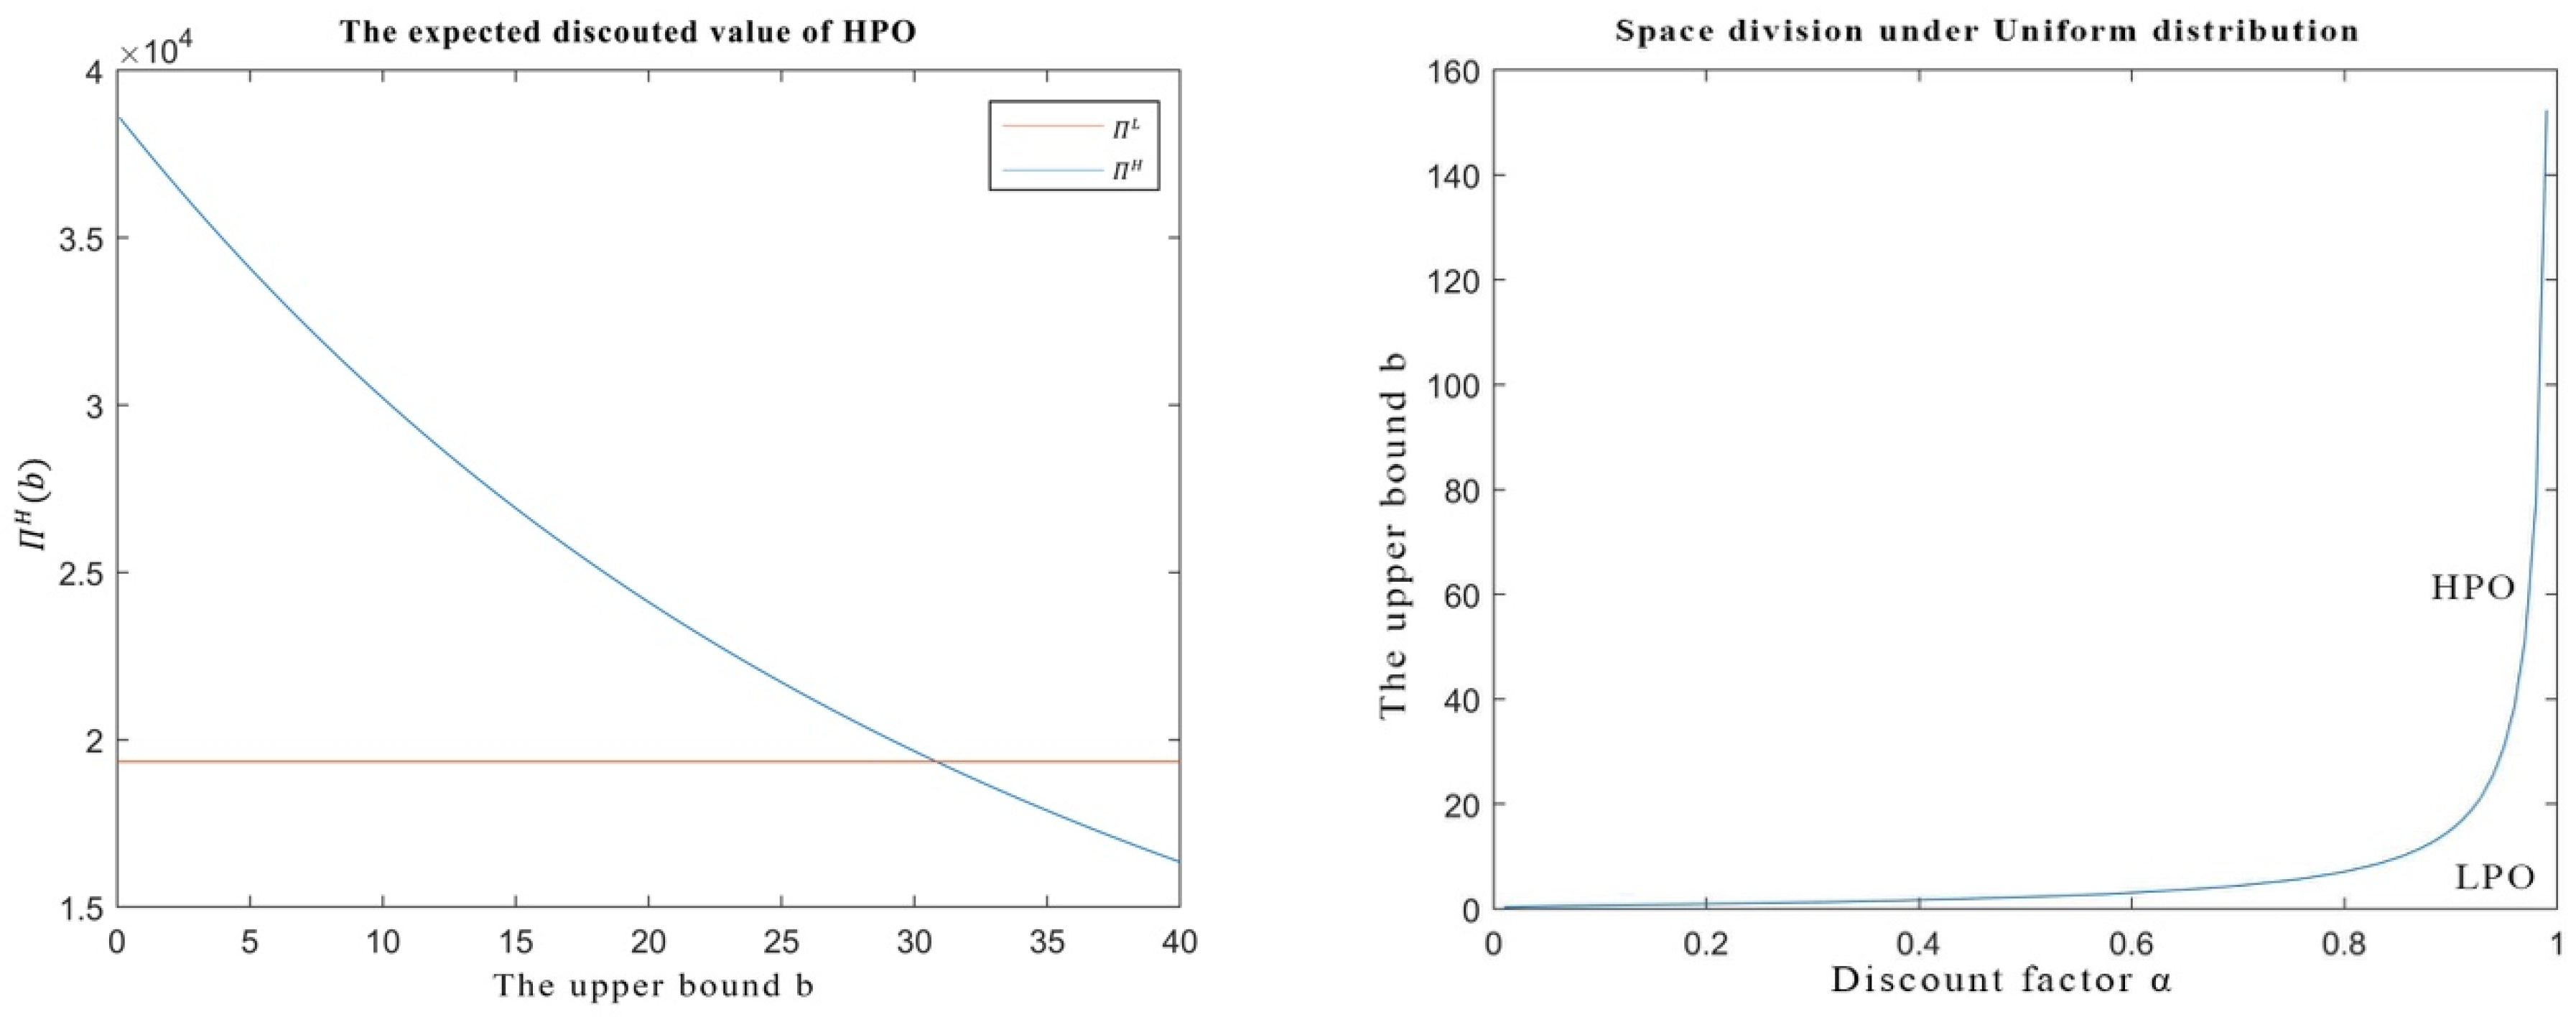
In a single foundry cycle, the time value of money is reflected by the discount rate, and the discount rate determines the risk factor and time cost of the OEMs when waiting for high-profit orders. Therefore, the discount rate can reflect the patience of the OEMs to the waiting time well and affect the decision of order selection. Based on the distribution of high-profit orders, the OEMs can combine the upper bound of waiting time or the conditional probability of high-profit orders in response to the discount rate to make optimal order selections. When the discount rate is constant, as long as the upper boundary of the waiting time exceeds the corresponding threshold, the OEMs will choose high-profit orders.
(3)
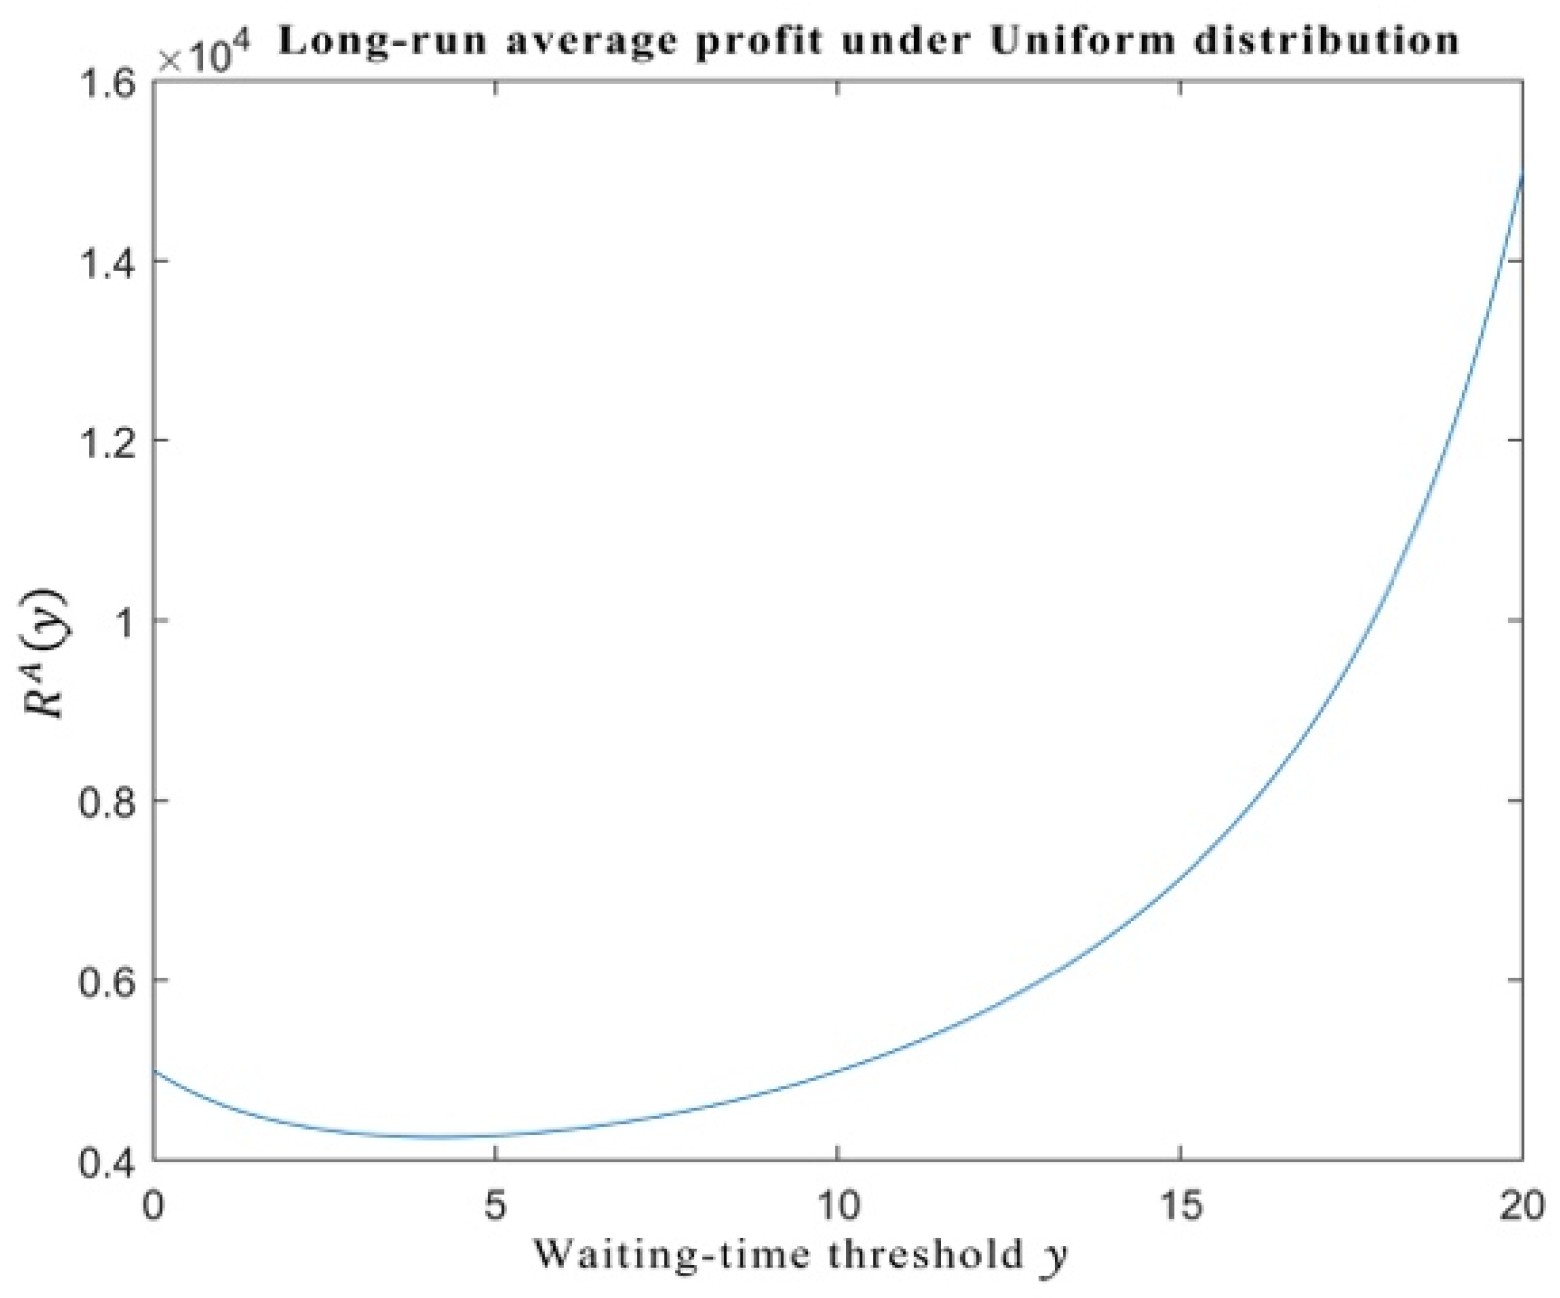
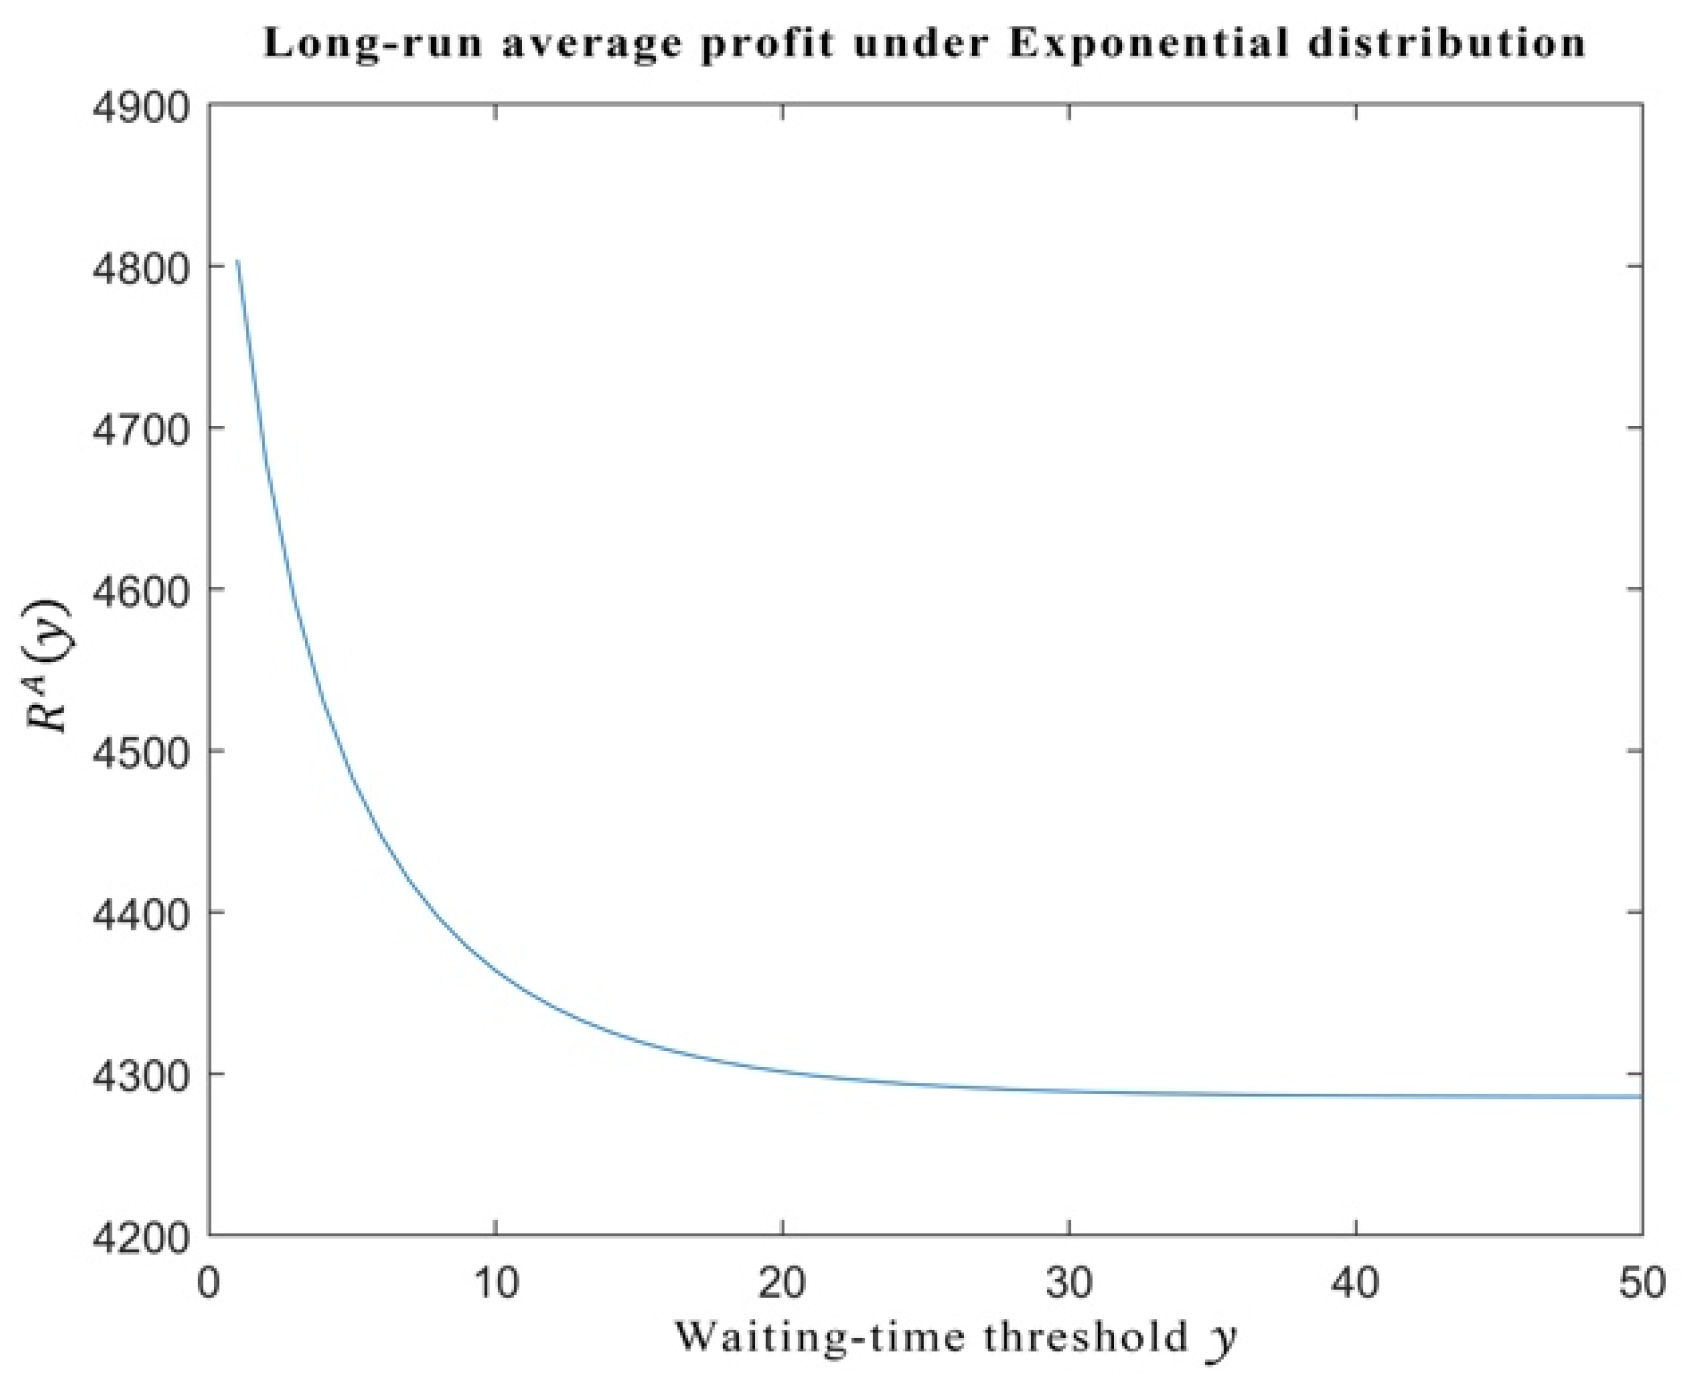
In a multi-foundation cycle, the OEMs pursue the optimal long-term profit when they make order selection decisions. The conditional probability λ ( x ) of the appearance of high-profit orders in multi-foundation cycles still affect the long-term average profits. However, unlike a single-cycle, the specific functional nature of λ ( x ) has no effect on the OEMs’ final order selection decision-making. Moreover, the optimal waiting-time threshold y * , as the main factor of waiting cost, has become the key criterion for the OEMs to make order selection decisions in multi-foundation cycles.
The limitation of the research is that, firstly, when the company cannot acquire accurate information about the probability distribution of foundry orders in the market, we can further use appropriate methods (such as the optimal stopping time model) to explore the polluting OEMs’ optimal order selection strategy in this case. Secondly, we do not consider the risk preference of OEMs as decision-makers. Therefore, incorporating the manufacturer’s risk preference into the model solution and optimal order selection strategy formulation is a topic worthy of in-depth study. In addition, in the future, we will also consider combining models and empirical methods to study the production strategies of OEMs.

Author Contributions

Methodology, N.Z., C.L. and W.Z.; software, W.Z., validation, N.Z. and C.L.; writing—original draft preparation, N.Z.; supervision, S.Q. All authors have read and agreed to the published version of the manuscript.

Funding

This research received no external funding.

Institutional Review Board Statement

Not applicable.

Informed Consent Statement

Not applicable.

Data Availability Statement

The study did not report any data.

Conflicts of Interest

The authors declare no conflict of interest.

References

  1. Wu, J. Using Analytic Hierarchy Process to Discuss the Conflict of Transnational Foundry Pollution Transfer. Ecol. Econ. 2014, 30, 86–88. (In Chinese) [Google Scholar]
  2. Lee, H.L.; So, K.C.; Tang, C.S. The value of information sharing in a two-level supply chain. Manag. Sci. 2000, 46, 626–643. [Google Scholar] [CrossRef] [Green Version]
  3. Ma, H. and Dong, S. The impact of different types of environmental regulations on carbon emission efficiency. J. Beijing Inst. Technol. (Soc. Sci. Ed.) 2020, 22, 1–10. (In Chinese) [Google Scholar]
  4. Fan, Q.; Chu, C.; Gao, J. The impact of environmental regulations and industrial structure upgrading on high-quality economic development. China Popul.·Resour. Environ. 2020, 6, 84–94. (In Chinese) [Google Scholar]
  5. Landi, D.; Capitanelli, A.; Germani, M. Ecodesign and energy labelling: The role of virtual prototyping. Procedia CIRP 2017, 61, 87–92. [Google Scholar] [CrossRef]
  6. Landi, D.; Consolini, A.; Germani, M.; Favi, C. Comparative life cycle assessment of electric and gas ovens in the italian context: An environmental and technical evaluation. J. Clean. Prod. 2019, 221, 189–201. [Google Scholar] [CrossRef]
  7. Fan, D.; Sun, X. Environmental Regulation, Green Technology Innovation and Green Economic Growth. China Popul.·Resour. Environ. 2020, 6, 105–115. (In Chinese) [Google Scholar]
  8. Xu, X.; Zhang, W.; He, P.; Xu, X. Production and pricing problems in make-to-order supply chain with cap-and-trade regulation. Omega 2017, 66, 248–257. [Google Scholar] [CrossRef]
  9. Guhlich, H.; Fleischmann, M.; Mönch, L.; Stolletz, R. A clearing function based bid-price approach to integrated order acceptance and release decisions. Eur. J. Oper. Res. 2018, 268, 243–254. [Google Scholar] [CrossRef]
  10. Beemsterboer, B.; Land, M.; Teunter, R. Flexible lot sizing in hybrid make-to-order/make-to-stock production planning. Eur. J. Oper. Res. 2017, 260, 1014–1023. [Google Scholar] [CrossRef]
  11. Huang, M.; Zhang, Y.; Wang, Y. Optimal decision-making method for merger and packaging of online supermarket split orders. Syst. Eng. Theory Pract. 2021, 41, 286–296. (In Chinese) [Google Scholar]
  12. Zhang, Y.; Hu, X.; Huang, M.; Sun, L. The Economic Decision Model of Online Supermarket Splitting Order Merging and Packaging Strategy. J. Manag. Sci. 2019, 22, 24–36. Available online: https://kns.cnki.net/kcms/detail/detail.aspx?dbcode=CJFD&dbname=CJFDLAST2020&filename=JCYJ201910003&v=Kw7MO1cZbDY46RdlVcoNzRWfeu7%25mmd2B5I89guG75JB%25mmd2BLyOl4GY%25mmd2BrT18WD7trarytNrK (accessed on 23 April 2021). (In Chinese).
  13. Xu, X.; He, P.; Xu, H.; Zhang, Q. Supply Chain Coordination with Green Technology under Cap-and-Trade Regulation. Int. J. Prod. Econ. 2016, 183, 433–442. [Google Scholar] [CrossRef]
  14. Wang, Z.; Li, T.; Yue, C. Online scheduling based on multiple prediction scenarios for the same-city instant delivery problem. Syst. Eng. Theory Pract. 2018, 38, 3197–3211. (In Chinese) [Google Scholar]
  15. Gao, H.; Dan, B.; Yan, J. Comprehensive decision-making of MTO enterprise order selection and scheduling considering demand timing correlation. Chin. J. Manag. Eng. 2017, 31, 108–116. (In Chinese) [Google Scholar]
  16. Zhang, R. Comparative Research on Order Selection Decisions Considering Time Series Correlation. J. Manag. Sci. 2009, 12, 44–55. (In Chinese) [Google Scholar]
  17. Zhang, Y.; Dan, B.; Gao, H. Research on Random Scheduling Problem of Product Service System Order with Time Assignment. China Manag. Sci. 2019, 27, 93–106. (In Chinese) [Google Scholar]
  18. Nobil, A.H.; Sedigh, A.; Leopoldo Eduardo Cárdenas-Barrón. A multiproduct single machine economic production quantity (epq) inventory model with discrete delivery order, joint production policy and budget constraints. Ann. Oper. Res. 2017, 286, 1–37. [Google Scholar] [CrossRef]
  19. Buergin, J.; Hammerschmidt, A.; Hao, H.; Kramer, S.; Tutsch, H.; Lanza, G. Robust order planning with planned orders for multi-variant series production in a production network. Int. J. Prod. Econ. 2019, 210, 107–119. [Google Scholar] [CrossRef]
  20. Wang, X.; Ma, C. The choice and coordination of multi-tier supply chain outsourcing model. Chin. Manag. Sci. 2019, 27, 151–161. (In Chinese) [Google Scholar]
  21. Gong, F.; Zeng, A. Functional Upgrade of my country’s Foundry Enterprises: Duality Based on Modularity. Manag. World 2016, 184–185. (In Chinese) [Google Scholar]
  22. Jayaswal, S.; Jewkes, E.M. Price and lead time differentiation, capacity strategy and market competition. Int. J. Prod. Res. 2016, 54, 2791–2806. [Google Scholar] [CrossRef]
  23. Boulaksil, Y.; Fransoo, J.C.; Tan, T. Capacity reservation and utilization for a manufacturer with uncertain capacity and demand. OR Spectr. 2017, 39, 689–709. [Google Scholar] [CrossRef] [Green Version]
  24. Xie, X.; Zhang, B. Determination of committed delivery time and capacity under uncertain demand. Chin. Manag. Sci. 2016, 24, 73–80. (In Chinese) [Google Scholar]
  25. Choi, T.M.; Li, D.; Yan, H. Optimal single ordering policy with multiple delivery models and Bayesian information updates. Comput. Oper. Res. 2004, 31, 1965–1984. [Google Scholar] [CrossRef]
  26. Hui, S.K.; Eliashberg, J.; George, E.I. Modeling DVD preorder and sales: An optimal stopping approach. Mark. Sci. 2008, 27, 1097–1110. [Google Scholar] [CrossRef]
Figure 1. The left panel illustrates the HPOs’ (high-profit orders) profit with respect to the waiting time upper bound b at discount rate α = 0.95 . The right panel illustrates the market probability distribution for uniformly distributed order decision space (the HPO means high-profit order and the LPO means low-profit order).
Sustainability 13 06835 g001
Figure 2. The left panel illustrates the HPOs’profit with respect to the failure rate λ at discount rate α = 0.95 . The right panel illustrates the Market probability distribution as exponentially distributed order decision space.
Sustainability 13 06835 g002
Figure 3. The relation of the long-term average profit R A ( y ) with the waiting-time threshold y in Case 1.
Sustainability 13 06835 g003
Figure 4. The relation of the long-term average profit R A ( y ) with the waiting-time threshold y in Case 2.
Sustainability 13 06835 g004
Table 1. Notations and definitions.
K Total production capacity α Discounting factor
h HPOs’ net profit y Waiting-time threshold
x Waiting time to obtain HPOs x ¯ Upper bound of x
l LPOs’ net profit λ ( y ) failure rate
t s Decision-making time C ( x ) Waiting cost
π h HPOs’ total profit Π H HPOs profit after discounting
π l LPOs’ total profit Π L LPOs profit after discounting
X Random variable of waiting time
Publisher’s Note: MDPI stays neutral with regard to jurisdictional claims in published maps and institutional affiliations.

