Abstract
Although most micro-level studies show the positive impact of adaptation on food security and household income, these are only a few of the outcomes adaptation is intended to achieve. Farmers’ livelihoods function in complex ways such that an understanding the multidimensional outcome of adaptation is important. These necessitate the use of multiple indicators in the evaluation of the impact of adaptation. Based on data collected from 810 randomly selected households in central Ethiopia, this study investigates the impacts of adaptation strategies on the sustainability of the livelihoods of farmers. The economic, social, and environmental outcomes were integrated to construct the Livelihood Sustainability Index. The endogenous switching regression model, which accounts for unobserved heterogeneity and possible endogeneity, was used to examine the impact of using adaptation strategies. With a mean score of 41, the farmers had lower levels of livelihood sustainability. Farmers switching crop type, diversifying crops, planting improved seeds, engaging in land management activities, and using irrigation had a higher livelihood sustainability index compared to the counterfactual case in which they did not use them. Non-farm employment and migration significantly increased livelihood sustainability for the using households. However, had these factors been used by the non-users, it would have resulted in reduced livelihood sustainability. Farmers using more than four adaptation strategies had more sustainable livelihoods than using fewer strategies. The findings affirm that adaptation contributes to livelihood improvement. However, since the farmers are far from achieving a higher level of sustainable livelihoods, policies shall focus on maximizing the returns to be obtained from using adaptation strategies. This includes improving access to ecosystem services through environmental protection measures, increasing production efficiency through improved access to and proper utilization of farm inputs, expanding irrigation facilities, creating decent employment opportunities, and enhancing farmers’ skills through entrepreneurial training.
1. Introduction
Climate change and variability (CCV) is among the major threats impinging on the livelihood of the rural population of developing countries. Vulnerability to CCV overlaps with poverty in a pronounced way in these countries, leading to distressed livelihoods [1]. Spatial differences and unpredictable temporal changes in climate variables make agricultural activities uncertain and livelihoods strained. The effects of CCV are more severe among smallholder farmers who rely heavily on rain-fed and climate-sensitive agriculture [2]. It is only when temperature and rainfall are adequate and optimal that farmers can benefit from their traditional farming systems and livelihood strategies. Boosting productivity of smallholder farming amidst variable and uncertain climate conditions is, therefore, essential to increase crop yields, generate employment opportunities, raise non-farm income, enhance food security, and improve the livelihoods of the rural population.
Adaptation is widely indicated as a promising strategy to respond to CCV and achieve sustainable development [3]. The tremendous effects of CCV on the livelihood of smallholder farmers necessitate supporting adaptation and ensuring that adaptation strategies are effective in sustaining livelihoods. According to Moser and Ekstrom [4], adaptation is “changes in social-ecological systems in response to actual and expected impacts of climate change in the context of interacting non-climatic changes” (p. 22026). Adaptation involves not only taking measures to minimize current vulnerability, but also behavioural change to adjust livelihood strategies to respond to future CCV. Farmers in Ethiopia utilize a wide range of adaptation strategies including, but not limited to, adjustments of cropping practices, resource management activities, and diversification to non-farm activities [5]. Adaptation can occur through planned intervention by the government and non-government organizations as well as based on the autonomous decisions of farmers. Agricultural adaptation is envisaged to mitigate the effects of CCV by improving production and food security. Micro-level studies indeed show the positive effect of agricultural adaptation in increasing crop yields and farm income, and improving food security [6,7,8].
The livelihood of smallholder farmers functions in complex ways such that understanding the multidimensional outcome of adaptation is important. According to the Sustainable Livelihoods Framework (SLF), livelihood comprises the capabilities, assets, and strategies utilized by farmers to achieve intended livelihood outcomes [9,10]. The livelihoods approach, focusing on the people-centred analysis of the intricate interaction between climate risks, assets, and strategies, mediated by institutions, help to provide deeper understanding of the diverse ways people make a living [11,12]. A livelihood is considered sustainable when, without undermining the natural resource base, it is able to offset risks, withstand or recover from climate risks, maintain or enhance capabilities and assets, and provide net livelihood benefits in the short and long term [9,10]. The SLF approach shifts livelihood research from narrowly focusing on the economic sense of increasing income to multi-sectoral consideration of entitlements and vulnerability [11]. The impact of adaptation is reflected in the livelihood outcomes. Livelihood outcomes refer to changes brought about by using adaptation strategies to a wide range of objectives including improvements in human wellbeing, food security, income, and health, and sustainably using natural resources [10]. In this vein, the effectiveness of adaptation is conceived in this study as the achievement of multidimensional economic, social, and environmental objectives, which, altogether, contribute to sustainable livelihoods.
Most studies on the micro-level impacts of adaptation in Ethiopia focus on livelihood outcomes such as crop yields, food security, and income/poverty. These studies are insightful because food security and income are the key components of human wellbeing and economic factors are the most anticipated objectives of farmers. However, these components constitute only a few of the several livelihood outcomes intended to be achieved [13]. Moreover, the chosen adaptation strategy may not necessarily achieve multiple objectives that are essential to sustain livelihoods. One adaptation strategy benefits farmers in one aspect, whereas it may adversely affect another aspect of their livelihoods. For instance, a study in Burkina Faso and Ethiopia showed that although the construction of water storage facilities for domestic consumption and irrigation improved water availability, it increased the transmission of water-related diseases such as schistosomiasis and malaria [14]. Adaptation strategies may also exacerbate vulnerability and the unintended negative effects may outweigh the benefits. In Mali, among households with temporary male migrants, the loss of manpower increased the burden of women to engage in activities traditionally undertaken by men, which increased their vulnerability and reduced their wellbeing [15]. Also, short-term benefits of an adaptation may eventually increase vulnerability in the long term. Cattle ranching as an adaptation strategy in Mexico and Guatemala, for instance, induced deforestation which has negative consequences on biodiversity, exacerbating future vulnerability to CCV [16].
In spite of the increasing importance of evidence on the effectiveness of adaptation for policy making and scaling-up of promising strategies, there are methodological challenges of evaluating the impact of adaptation. Although the outcome of adaptation can best be measured in the long term, this poses a challenge as adaptation is intertwined with other development interventions influencing livelihood [17]. Since livelihood changes are the functions of broader development interventions in which adaptation is only one component, it is also challenging to attribute observed livelihood outcomes to the use of specific adaptation strategies. Effective adaptation requires maximizing synergies between the different components of livelihoods [3]. The heterogeneities in the outcome of adaptation strategies on the one hand and the need to ensure multiple benefits to maximize synergies demand the consideration of diverse sets of outputs and short-term outcomes in adaptation evaluation. However, studies conducted so far have rarely addressed multiple dimensions of the livelihood outcomes of farmers’ use of adaptation strategies.
Therefore, in this study, we investigated the impact of using adaptation strategies on livelihood sustainability of smallholder farmers considering multiple economic, social, and environmental indicators. It adds to the extant literature on the multi-dimensional livelihood outcomes; the synergies between the different livelihood outcomes; and the sustainability implications of adaptation strategies pursued by smallholder farmers. The study also provides policy insights for the development of targeted interventions aimed at ensuring sustainable livelihoods.
2. Data and Methods
2.1. Description of the Study Areas
Ethiopia is one of the sub-Saharan African countries most vulnerable to CCV. Its vulnerability arises mainly from excessive dependence on climate-sensitive agriculture. This study was conducted in three districts (Kembibit, Kuyu, and Boset) from the Oromia region in central Ethiopia (Figure 1). The three districts dominantly represent highland, midland, and lowland areas, respectively. These agro-ecological settings cover, respectively, altitudinal ranges of 2300–3200, 1500–2300, and 500–1500 m above sea level. The midland areas are characterized by highly rugged terrain, whereas there are slightly sloping and undulating areas in the highland and lowland areas. About 85% of the population in these areas live in rural areas where farming and livestock production constitute the main sources of livelihoods. Farmers produce crops following the bimodal rainfall distribution: belg rain (short rainy season between March and May) and kiremt rain (long rainy season between June and September). Sorghum (Sorghum bicolor) and teff (Tef eragrostis) are the dominant crops produced in the lowland areas. Maize (Zea Mays), sorghum, teff, wheat (Triticum), and oil seeds are widely produced in the midland areas. In the highland areas, barley (Hordeum vulgare) and pulses are commonly produced. The areas are characterized by climate variability and recurrent extreme events. Due to exposure to climate risks and other socio-economic problems such as a shortage of farmland and limited use of improved agricultural technologies, the problem of food security is widespread.
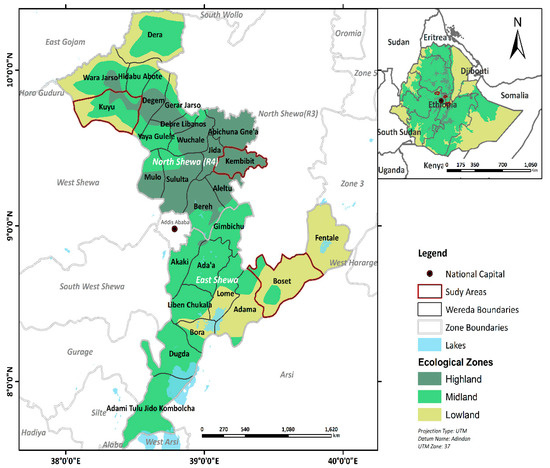
Figure 1.
Location map of the study areas.
2.2. Sample Size and Sampling Technique
The sample size was determined using sample size calculation for a finite population [18]. The computation assumptions were 95% confidence interval; 5% level of significance; and a 60% proportion of households using adaptation strategies. Taking the population size of one of the districts, the sample size was estimated to be 270 households. Considering each district as an independent unit, the total sample size was 810 households. A multi-stage sampling technique was used to identify the sample households. At the first stage, the three districts were selected considering similarity of livelihood systems (i.e., mixed farming), prevalence of food insecurity, and representation of different agro-ecological settings. At the second stage, nine kebele administrations (lowest administrative units in Ethiopia), three from each district, were selected using purposive sampling to ensure that the kebeles selected from each district fall in the same agro-ecological setting. At the last stage, households were selected using a simple random sampling technique. The sampling frame was the list of households living in each kebele.
2.3. Sources of Data and Method of Collection
Primary data were collected from the heads of the sampled households who are primarily responsible for making livelihood decisions. The data were collected using a cross-sectional survey questionnaire. A questionnaire with a set of structured questions was used to collect data on the households’ demographic and socio-economic characteristics, access to livelihood assets, crop production, access to environmental resources, food security, and use of adaptation strategies.
2.4. Definition and Computation of Variables
Dependent variable: a sustainable livelihood is measured at a micro level based on integration of context-specific sets of indicators [19]. The multidimensionality of the concept of sustainable livelihoods necessitate the use of multiple indicators, which increase the reliability and precision of its measurement. The Livelihood Sustainability Index (LSI), the dependent variable of the study, was computed from the list of eleven household-level proxy indicators, representing environmental, social, and economic dimensions of livelihood outcomes. The indicators were selected based on the consideration of relevance, capacity of representing a given dimension, and the availability of data [19].
The environmental aspect of livelihood outcomes can be conceived in terms of ecosystem services [20]. Among them, provisioning services are important for the livelihoods of rural populations [21]. They depend for subsistence on provisioning ecosystem services which include access to fuelwood for energy consumption, collection of wood for construction materials, access to pasture for livestock, etc. [21]. Hence, the environmental dimension of sustainable livelihoods was measured considering farmers’ access to and use of fuelwood, woods for construction materials, woods for preparation of farming tools, and access to pasture for livestock grazing.
Food security status, perceived health status, and life satisfaction were used to represent the social dimension of livelihood outcomes. Food security status was measured using the Household Food Insecurity Access Scale (HFIAS). Based on a nine-item scale and focusing on a four-week recall period, HFIAS measures the access component of household food insecurity [22]. Since higher values of the scale show severe levels of food insecurity, it was reversed for the computation of the index. The efforts made by households to improve their livelihoods is partly reflected in the health status of their members. In this vein, perceived health status was measured by asking a four-point scale question about perception of the health status of household members. Life satisfaction was used assuming that households can best assess their overall wellbeing. This indicator captures broader dimensions of livelihoods than the use of income and expenditure-based measures of wellbeing.
The economic dimension of livelihood outcomes was measured using land productivity, labour productivity, number of months of food self-sufficiency from own production during years of poor rainfall, and wealth index. Using self-reported cereal outputs per hectare of farmland, land productivity was computed as the quantity of yield obtained from the cultivated land. Labour productivity was measured by dividing total yield output per unit of man-equivalent labour force size. Land and labour productivity were considered as economic efficiency indicators because high productivity provides farmers with better access to food, income, and health. The wealth index was constructed from data on 10 types of productive and non-productive asset ownership (plough/beam, axe, shovel, radio/tape-recorder, mobile phone, table, chair, bed, sponge-mattress, and corrugated iron roof), which shows long-term economic status. These items were internally consistent to measure wealth index (Cronbach alpha = 0.74). Then, principal component analysis (PCA) was used to construct the wealth index of each household.
Since each variable was measured on a different scale, it was first standardized to a scale of 0 to 1. The standardized values of each component were calculated using the following equations which were used for variables whose functional relationship with sustainable livelihood was positive (1) and negative (2), respectively.
where Vij was the standardized value of variable i for household j, and Vx, Vmax, and Vmin were the observed, maximum, and minimum values of each variable, respectively.
After standardization, the index for each component was calculated using the following equation.
where Cij was index of the component i for the household j, Vij was the standardized values of the variables that make up the component i for household j, and n was the number of variables in each component.
Once the index for each component was computed, the LSI was calculated as follows:
where Cij was the index value of component i for household j, and WCi was the weight of each component C, determined by the number of variables in each component. The computation of LSI was made using a balanced weight average assuming that each component contributes equally to the overall LSI. The computed value of LSI was finally multiplied by 100 to be measured on a scale from 0 to 100, higher values showing more sustainable livelihoods.
Predictor variables: the predictor variables of the study were the major adaptation strategies used by the farming households. These strategies, which were commonly used by farmers in the study areas, were changing planting time, changing crop type, crop diversification, using improved seed varieties, land management activities, irrigation, engaging in non-farm activities, and pursuing migration [5,23]. The variables took the value of 1 if used by the households and 0 otherwise.
Control variables: livelihood sustainability is influenced by several demographic, socio-economic, institutional, and environmental factors. We controlled for these variables to examine the net effect of using adaptation strategies. These variables were age of the household head, sex of the household head (male, female), man-equivalent labour force size, dependency ratio, educational level of the household head (no education, primary and above), access to financial capital (no access, access to credit/saving/remittance), access to farmers’ trainings (no, yes), membership in farmers’ groups (no, yes), walking distance from a market centre (in minutes), and walking distance from a farmers’ training centre (FTC) (in minutes). To control for differences in climate conditions and other development variations, we included agro-ecological dummies as control variables. The results of a correlation test and collinearity diagnostic showed that there was no collinearity between these variables.
2.5. Data Analysis
In the absence of a random assignment of farming households into adapting and non-adapting households, construction of a counterfactual is one of the means through which livelihood outcome can be attributed to the use of adaptation strategies. Endogenous switching regression (ESR) is an econometric technique that is used to overcome the problem of endogeneity and self-selection through a construction of a counterfactual against which the impact of adaptation can be investigated [24]. ESR is widely used for impact assessment based on cross-sectional evidence [8,25,26]. Through estimation of the expected outcomes of adaptation in the actual and counterfactual cases for both adapting and non-adapting households, ESR helps to compare the difference between what has actually happened due to use of an adaptation strategy and what would have happened in the absence of its use. ESR addresses selection bias and endogeneity problem by simultaneously estimating the selection and outcome equations using the full information maximum likelihood method [24]. In the selection equation, we estimated the effects of household characteristics on the decision to adapt, which is a binary choice involving use or non-use. In the outcome equation, a separate model was fitted to examine livelihood sustainability for users and non-users. Given that most adaptation decisions are made at the household level, our unit of analysis was household.
Conditional on the use of adaptation strategies, the outcome equations are given as:
where Y1i and Y2i refer to the outcome variable, LSI, for adapting and non-adapting households, respectively; X1i and X2i are vectors of exogenous variables influencing livelihood sustainability; β1 and β2 are vectors of parameters to be estimated; and εi are error terms.
The accuracy of the estimates of ESR depends on the use of valid instruments to identify outcome equation from the selection equation. For model identification, we used exclusion restriction in which variables affecting the selection equation (i.e., adaptation decision) are excluded from the outcome equation (i.e., livelihood sustainability). We used membership in farmers’ group, attending farmers’ training, and access to weather information from government offices as selection instruments. These variables are sources of knowledge and information that help farmers to be aware of changes in weather conditions, the importance of taking action, and the use of adaptation strategies. They were also reported to be valid instruments in previous studies [8,25,26]. The validity of the instruments was further examined using a falsification test. The results show that the selected instruments were valid as they jointly and significantly influenced the decision to adapt but had insignificant effect on LSI for non-adapting households (Table A1 in Appendix A). In the case of irrigation, we used membership in farmers’ groups as an instrument.
After estimating the model parameters, the effect of each adaptation strategy was calculated by computing the expected livelihood outcome (i.e., LSI) for adapting households (Ai = 1) and non-adapting households (Ai = 0) using Equations (7)−(10). λ1 and λ2 show inverse mills ratio calculated from the selection equation and used to correct for selection bias in the ESR model. While 7 and 10 show the actual expected LSI, 8 and 9 show the counterfactual expected LSI, for users and non-users, respectively. Following Di Falco, Veronesi and Yesuf [8], the average treatment effect on the treated (ATT) was computed as the difference between the expected LSI for households that adapted (7) and the counterfactual hypothetical case that the households did not adapt (8). The average treatment effect on the untreated (ATU) was calculated as the difference between the expected LSI that would have been obtained in the counterfactual hypothetical case that farmers decide to adapt (9) and the expected LSI for households that did not adapt (10). In addition, base heterogeneity (BH) and transitional heterogeneity (TH) effects were calculated from the conditional expectation equations [8]. The LSI of households that used an adaptation strategy may be better than households that did not use regardless of their decision to use the strategy due to unobservable characteristics. The BH effect for the use and non-use of adaptation was measured as the difference between Equations (7) and (9), and (8) and (10), respectively. The effect of using an adaptation strategy could be larger or smaller for households that used an adaptation strategy compared to the households that did not use the strategy in the counterfactual case that they would have used. This statistics, given by the TH, was measured as the difference between ATT and ATU.
3. Results
3.1. Description of the Sample
The average age of the sample household heads (HHH) was 47 years (Table 1). The average man-equivalent labour force size of the households was about 2.4, which was nearly the same in the three agro-ecological settings. However, there was significant difference between the three areas in dependency ratio. The average size of landholding was 1.8 hectare in which farmers in the highland areas had relatively larger size of landholdings. The number of oxen owned by the farmers was 1.4. There was significant difference between the three areas in farmers’ access to financial capital, attending farmers’ training, and membership in farmers’ groups. Very high proportion of the households used fertilizer with nearly similar distribution in the three agro-ecological settings. Farmers travel more than an hour to reach a market centre in all areas whereas it took them less than an hour to reach FTCs. The average annual rainfall of both the short and long rainy seasons was relatively higher in the midland areas. The amount of belg rainfall was smaller in the highland areas and the of kiremt rainfall was smaller in the lowland areas. Higher average annual temperature was observed in the lowland areas.

Table 1.
Mean distribution of the characteristics of sample households by agro-ecological settings.
3.2. Adaptation Strategies
Farmers in the three agro-ecological settings mainly utilized eight adaptation strategies in varying proportions (Figure 2). In the highland areas, improved seeds were used by most households whereas irrigation was the least used strategy due mainly to lack of access to water. A relatively higher proportion of farmers used irrigation in the midland areas where small streams are commonly used to irrigate small plots of land to produce vegetables. However, use of improved seeds was very limited. In the lowland areas, irrigation was the second most used adaptation strategy. In areas adjacent to the Awash River, modern scheme irrigation was used to produce both crops and vegetables. In the lowland areas, non-farm activities, which include trading (grain, livestock, and small shops) and daily labour works, were mostly used. Few better-off farmers engaged in high-return activities such as livestock fattening. Farmers also utilized less capital-intensive and low-return non-farm activities such as daily labour works. Migration was used by many households in the highland and midland areas. Adjusting planting time based on the time of onset of rainfall, changing crop type following seasonal cropping calendar, crop diversification (i.e., production of cereals and pulses as well as vegetables), and land management activities (i.e., terracing, soil/stone bunds, and planting trees) were among the strategies used by comparable number of households. The average being four strategies, households used multiple adaptation strategies. Farm-based adaptation strategies were coupled with the use of production-enhancing farm inputs such as fertilizer, herbicide, and pesticide.
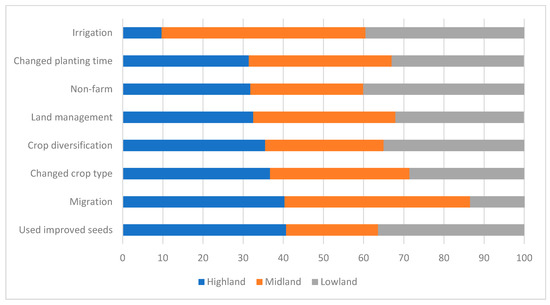
Figure 2.
Relative distribution of the use of adaptation strategies by agro-ecological settings.
3.3. Measurement of Livelihood Sustainability
We used PCA to construct LSI. The Kaiser–Meyer–Olkin measure of sampling adequacy (0.751) shows the suitability of the data for factor analysis. The Bartlett’s Test of Sphericity was statistically significant (Chi-Square = 2547.9; p < 0.001), indicating significant correlation between the variables. The results of the PCA indicated that the 11 indicators reliably contributed to livelihood sustainability (Table 2). Taking the Eigen values great than 1 and factor loadings of ≥0.4, these indicators represented three components of livelihood sustainability. The first factor, named Ecosystem Services Index (ESI), captured four variables referring to farmers’ access to natural resources. The second factor, labelled as Social Equity Index (SEI), constituted three variables measuring farmers’ overall wellbeing. The last component, Economic Efficiency Index (EEI), captured variables measuring productivity and household wealth. Overall, the three components explained 60% of the variance in farmers’ livelihood sustainability.
Table 2.
Factor matrix of farmers’ livelihood sustainability.
With average percentage point of 41, LSI of the sampled farmers was generally lower. The index was relatively higher in the lowland areas (50.3). The respective values for the highland and midland areas were 35.7 and 36.8. The post hoc test of comparison showed, contrary to our expectation, that the indices of both the highland and midland areas were significantly lower than that of the lowland areas (p < 0.001) whereas the difference between the highland and midland areas was not statistically significant. The average scores were relatively lower for land and labour productivity, but relatively higher for food security, perceived health status, and life satisfaction (Figure 3a). Overall, farmers in all the three agro-ecological settings performed well in relation to the social equity indicators but lower in the economic efficiency indicators (Figure 3b). A higher number of households in the lowland areas reported better access to ecosystem services. Both EEI and SEI were relatively higher in the highland areas but lower in the midland areas.
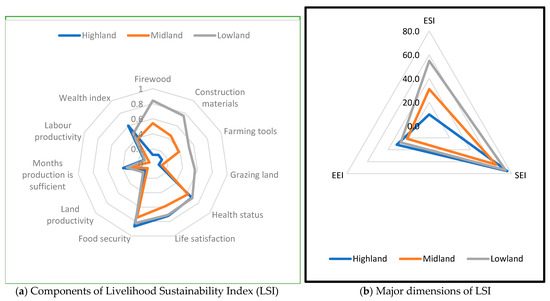
Figure 3.
Diagram of the distribution of the components (a) and dimensions (b) of livelihood sustainability index by agro-ecological settings.
3.4. Impact of Adaptation to Climate Change and Variability (CCV) on Sustainable Livelihoods
Table 3 shows the estimated LSI of the households under actual and counterfactual conditions. The values in cells “a” and “d” show LSI of households under actual conditions corresponding to adapting and non-adapting households, respectively. Values in cells “b” and “c” are LSI in the counterfactual cases for adapting and non-adapting households, respectively. Cells “e” and “f” show treatment effects of using adaptation strategies on LSI for adapting and non-adapting households, respectively. Cells “g” and “h” show, respectively, BH for farm households that adapted and did not adapt, whereas cell “i” shows TH in the same order. The results in Table 4 show the differences in the expected LSI by agro-ecological settings.
Table 3.
Results of the average expected livelihood sustainability index (LSI), and treatment and heterogeneity effects of using adaptation strategies.
Table 4.
Results of the endogenous switching regression model on the impact of adaptation strategies by agro-ecological settings.
Although changing planting time did not have significant effect in the lowland areas, it increased the LSI of farmers in the highland and lowland areas. For households that changed crop type in response to CCV, their LSI was 40.1 and it would have been significantly lower by 17 percentage points if they had not changed. This strategy had similar positive impact in the three agro-ecological areas. For households diversifying crops, their LSI would have been lowered by about 5 percentage points if they had not diversified. Likewise, for households that did not use this strategy, its use would have significantly increased their LSI by about 6 percentage points. Crop diversification had beneficial livelihood impacts in all the three areas. Although farmers who actually used improved seed varieties would have lower LSI if they had not used them, it was in the lowland areas that their use significantly improved the livelihoods of farmers. In all areas, farmers using land management activities have benefitted and the non-users would have also benefitted had they used. The LSI of farmers using irrigation was higher by about 21% than if they had failed to use it. Farmers using irrigation had higher LSI in all areas.
For households that actually used non-farm activities, their LSI was higher by about 5 percentage points than if they failed to use. However, for households not actually engaged in non-farm activities, their LSI would have been lower by about 8 percentage points had they decided to engage in them. The same pattern was observed in the three areas. The impact of migration was both positive and negative. Sending at least one member had increased LSI by about 21 percentage points than if they did not send a migrant. Conversely, for households that did not actually use migration, sending a household member in a counterfactual case would have resulted in the reduction of LSI by about 10 percentage points. Households using more than four adaptation strategies were about 3 percentage points higher LSI than households using utmost four strategies. Farmers in the three areas would also benefit from using more than four strategies.
The results of BH and TH effects show the differential impacts of adaptation strategies caused by households’ unobservable characteristics. Both the BH and TH effects of using improved seeds were negative in actual cases in the three agro-ecological settings. That is, farmers not using improved seeds would have benefitted the most from using the seeds than the actual users. The BH effect of using irrigation was positive in the three areas. The BH effect of the number of strategies used by households was not statistically significant and the difference between ATT and ATU was negligible in the three areas, implying that increasing the number of strategies was beneficial for all households. The TH effect on LSI (Table 3) was positive for changing crop type, land management activities, irrigation, non-farm activities, and migration, indicating that the effect of using these strategies was greater for farm households using these strategies compared to the counterfactual case that they were used by the non-using households.
4. Discussion
The study findings generally show that adaptation is helpful in improving the livelihoods of smallholder farmers in Ethiopia. Regardless of the extent of livelihood improvement, farmers using the strategies considered in this study have more sustainable livelihoods compared to the counterfactual case that they do not use them. Although the overall LSI was relatively lower, farmers using each adaptation strategy are able to significantly increase their livelihood sustainability scores. With slight variation, the use of adaptation strategies has similar beneficial livelihood impacts in the highland, midland, and lowland areas. However, there is heterogeneity among the users and non-users in benefitting from the use of the strategies. These findings are briefly explained below.
Adjustment of cropping practices improves farmers’ livelihoods by circumventing the risks of crop failure or yield reduction: we found that farmers have higher LSI scores when using crop switching, improved seeds, and crop diversification. Smallholder farmers in Ethiopia operate under uncertain production environments including rainfall variability and recurrent drought [27,28,29]. This necessitates adjustment of crop production practices to reduce the risks of crop failure and yield reduction. For instance, when belg rain fails, farmers in the three areas abandon production of long-duration belg crops and shift to short-duration crops, or wait for the long rainy season to plant long-duration crops. The use of improved seeds is particularly beneficial in the lowland areas. This may be related to the possibility to use modern irrigation schemes in some parts of these areas to produce crops and market-oriented fruits and vegetables. However, farmers in the lowland areas benefit less from changing planting time. In these areas, length of growth period of crops is shorter than in the highland and midland areas [29], implying limited option to adjust planting time in the lowland areas. Crop diversification is among the strategies used to cope with rainfall variability [30]. It lessens production risks as, owing to genetic differences, crops differently respond to varying weather conditions [28]. It increases productivity and improves yield stability [27]. Although the livelihood benefit of diversifying crops is expected to be higher for farmers with larger landholdings, farmers with small plots would also ensure their sustenance by consuming their own production. Consequently, crop diversification is beneficial to all households in which poor households are more likely to move out of poverty and non-poor households are highly likely to stay out of poverty [31].
Farmers in all agro-ecological settings can better adapt to CCV through the use of land management activities: the finding shows that the livelihood of farmers using land management activities (i.e., terracing, stone/soil bunds, and planting trees) is more sustainable compared to the counterfactual case that they do not use them. Farmers’ vulnerability to CCV is aggravated by other environmental problems. For instance, waterlogging is a critical problem for crop production in the highland areas whereas sloping topography is the cause of severe erosion in the midland areas. There is flash flood and erosion on the slightly sloping topography in the lowland areas. Hence, land management helps to mitigate these problems by raising the economic viability of farming; increasing agricultural production; improving ecosystem functioning, which, altogether, improve livelihood sustainability. Although the benefits vary by types of strategy and agro-climatic conditions, empirical works show that terracing, soil/stone bund, and tree planting are beneficial in reducing agricultural production risks [32,33]; increasing crop yields, household income, and food security [34,35]; increasing returns to labour [34]; and improving resilience to drought [36]. Furthermore, through its moisture- and nutrient-conserving benefits, terracing increases the number of crops to be produced [34]. Terracing and stone/soil bunds also have ecological benefits of improving soil quality and plant biomass production, preventing run-off and soil erosion, and loss of nutrients [32,37]. Witnessing its roles in adapting to CCV, the positive yield impacts of these strategies are higher in areas of low and variable rainfall [33,35,38]. In areas with high rainfall (e.g., the midland areas), terracing and soil/stone bunds are useful in reducing or preventing soil erosion and run-off.
Irrigation contributes to sustainable livelihoods in all areas by increasing household income: we found that farmers in all areas using irrigation have more sustainable livelihoods than in the counterfactual case that they do not use. At a micro level, irrigation contributes to betterment of livelihoods in multifaceted ways. First, it helps farmers to increase yields per hectare, farm income, and asset building [39]. Second, since rainfall variability often leads to either crop failure or abandoning the production of belg crops [29], irrigation provides farmers an option to increase cropping intensities by producing a higher number of crops. In particular, farmers in the highland and midland areas use small streams to produce market-oriented vegetables which, in addition to being used for household consumption, generates additional income, thus contributing to sustainable livelihoods. Although few farmers use irrigation in the highland areas due to lack of water, it is very beneficial for their livelihoods. Third, in some parts of the lowland areas located adjacent to Awash River, one of the largest rivers in Ethiopia, irrigation allows production multiple times a year, with significant livelihood benefits compared to rain-fed farming in which crops are produced only once or, at most, twice a year. Fourth, modern scheme irrigation in the lowland areas benefits farmers by creating off-farm employment opportunities. Hence, irrigation improves food security by reducing the risk of crop failure and offsetting yield reduction associated with CCV [40].
Migration is a livelihood sustenance strategy for vulnerable households in all the three areas: migration is one of the widely used strategies in the highland and midland areas. In the lowland areas, it is less common due partly to expansion of irrigation infrastructure in the adjacent areas, creating opportunities for non-farm activities which is the widely used strategy in these areas. The result of the study shows that households with at least one migrant in the three agro-ecological settings have higher values of LSI than in the counterfactual case that no one has migrated. The result is consistent with the findings of previous studies in the country showing the positive impact of migration, particularly short-term migration, on income, food security, asset accumulation, investment in agriculture, and poverty reduction [41,42,43,44]. Migration in Ethiopia is mainly survival-oriented induced by climate-related problems and other push factors such as shortage of farmland [23,42,45]. Hence, the decision to migrate is made to move out of poverty [45,46] as households living below the poverty line constitute sizeable share of migrants [44]. For vulnerable households, migration makes a significant contribution to sustainable livelihoods by insuring them against production risks. However, we found that migration would not benefit households with no migrant if they were to use migration. This might suggest that migration is not a viable option for households that can meet their livelihood needs through locally available adaptation options. This is apparent from evidence that family members are less likely to migrate from wealthier households [44] and from families holding larger sizes of farmland [45]. For better-off households, migration may reduce labour force availability, consequently undermining farming and other productive activities, leading to reduction in livelihood sustainability. The opportunity costs of labour migration on local productive activities and farm outputs are also high for these households as the foregone farm income may not be compensated by lucrative earnings from migration due to engagement in low-paying activities and high costs of living at urban destinations. Although some studies show that migration increases household income without inducing labour constraints in agriculture [43], this appears only true under the two-fold conditions of enough labour resources in the households and the high earning potential of the migrant.
Non-farm activities provide livelihood benefits for the users, but non-users would not benefit if they use these in the three agro-ecological settings: Non-farm activities are mostly used in the lowland areas due to income-earning opportunities created by expansion of modern irrigation schemes and availability of development projects in the nearby areas. A lower proportion of households use this strategy in the midland areas due partly to limited access to urban areas which are common centres of non-farm works. Our findings show that farmers in all areas involved in non-farm activities have more sustainable livelihoods compared to the counterfactual case that none of their household member has engaged in such activities. It suggests the key roles non-farm activities play in the livelihoods of smallholder farmers with low economic status. These farmers often rely on low-return non-farm activities for livelihood sustenance. Under the pressure of weather-related problems, farmers’ decision to engage in non-farm activities is rational and primarily motivated by push factors including poverty and lack of farmland or small landholdings [47,48,49] and low-potential agricultural production [46]. Consequently, non-farm employment increases income and wealth, productivity, consumption expenditure and food security; and reduces poverty [47,48,49,50]. For vulnerable households, non-farm employment is not only an insurance against climate risks but also a source of income to invest in farm inputs. Income earned from non-farm activities also helps poor farmers to avoid disposal of key productive assets such as oxen to meet subsistence requirements. On the other hand, we found that households not using non-farm activities, which appear to be better-off farmers, would not have benefitted had they engaged in these activities. A possible explanation is that, owing to the higher marginal labour productivity in the farming sector compared to the non-farm sector, better-off farmers do not benefit from participating in low-return non-farm activities, e.g., daily labour works. Better-off households are more likely to engage in and benefit from high-return non-farm employment due to better access to financial and human resources [47,51]. For these households, lack of high-return non-farm job opportunities in rural areas is a disincentive to engage in and substantially benefit from non-farm employment. Even when high-return activities are available, households with large landholdings have higher returns from farming labour and hence they are less motivated to engage in high-return non-farm activities demanding significant time, skill, and management [51]. Engagement in non-farm activities may also compete with and compromise the time and labour required for farming and related activities [52,53].
Number of adaptation strategies is positively associated with farmers’ livelihood sustainability in the three agro-ecological settings: we found that the livelihood of smallholder farmers in the three areas using more than four strategies was more sustainable than when using a smaller number of strategies. Increasing the number of strategies gives more options and creates more flexibility to improve agricultural production and farmers’ earnings [36]. First, it spreads risks across different strategies. Since adaptation decisions are made in an uncertain environment, there are always risks associated with the success of using each strategy. When an increased number of strategies are used, losses incurred from using a given strategy may be compensated by the benefits obtained from using another strategy. Second, increasing adaptation strategies contributes to sustainable livelihoods through the achievement of multiple objectives such as increasing crop productivity and conserving farmland. Third, the beneficial impact of some strategies depends on using them in combination rather than using them alone due to complementarities between different adaptation practices. For instance, provided that there are optimal crop growth conditions, improved seeds reduce production risks when used with both irrigation and fertilizer [33]. Likewise, fertilizers are beneficial when used with other adaptation strategies [36]. However, poor farmers are less likely to invest in and benefit from the use of multiple adaptation strategies due to lack of resources.
Households are heterogeneous in terms of benefitting from the use of adaptation strategies: the findings show households do not equally benefit from the use of adaptation strategies. For instance, the use of improved seeds is a necessary but not a sufficient condition to contribute to sustainable livelihoods. While the actual users did not benefit from planting improved seeds, the non-users would benefit if they used them. Poor farmers often use a mixture of improved and not improved seeds as well as second seeds replicated from first improved seeds, which are less productive. In some of the study areas, poor farmers gain the support of improved seeds through aid organizations. However, if these seeds are not complemented with other productivity-enhancing inputs such as fertilizers, which are not used in a proper amount and time by poor farmers due to financial problems, the contribution to livelihood sustainability is minimal. Crop diversification was beneficial for the actual users. This suggests that in addition to increasing the number of crops to be produced, unobserved factors such as the types of crops to be produced as well as the size of land allocated for the production of diversified crops, play important roles in influencing the livelihood sustainability effects of crop diversification. Likewise, for households using irrigation, the base heterogeneity effect was positive indicating that the beneficial impact of irrigation was significantly higher when compared to the counterfactual case that non-using farmers used irrigation. This also shows that, apart from the effects of CCV, there were other sources of heterogeneity that made the livelihood of farmers using irrigation more sustainable compared to the counterfactual case that irrigation was used by farmers who were not actually using it. This might be related to the higher capacity of these households to invest in irrigation-based production.
There are agro-ecological similarities and differences in livelihood sustainability and in the impact of adaptation strategies: despite improvements due to the use of adaptation strategies, the livelihood sustainability of farmers in the study areas is generally low. LSI was relatively higher in the lowland areas but lower in the midland and highland areas. This result contradicts the finding of Mekonnen, et al. [54] showing higher vulnerability in the lowland areas conceptualized in terms of exposure, sensitivity, and adaptive capacity. However, it is consistent with another study indicating lower vulnerability of the lowland areas and higher vulnerability of the highland areas [55]. The study described vulnerability in terms of economic, social, and environmental dimensions which, despite variation in the variables used to describe the index, is fairly similar to the approach used in our study. Although the lowland areas are exposed to highly erratic and variable rainfall, the higher LSI of the lowland areas is partly related to higher ESI reflecting better access to natural resources such as woodlands and grasslands. Management of natural resources are among the factors contributing to higher resilience to climate change [55]. In the highland areas, failure of the short rainy season and the consequent production only once a year, coupled with waterlogging during the main rainy season and extreme cold weather during the later stages of crop growth, lead to limited options to adjust farming practices, contributing to lower livelihood sustainability scores. In the midland areas, scarcity of farmland and severe problems of landslides contribute to lower livelihood sustainability.
5. Conclusions
Promoting adaptation is a key strategy to help smallholder farmers in Ethiopia who are under increasing threat of rainfall variability and extreme events to sustain their livelihoods. Adaptation contributes to sustainable livelihood if the strategies provide multi-dimensional benefits of meeting the economic needs of farmers while also ensuring social benefits and environmental protection. In this study, using ESR model, which accounts for bias arising from observable and unobservable farmers’ characteristics, we estimated the impact of adaptation strategies on the sustainability of the livelihoods of smallholder farmers in central Ethiopia. The study intends to address whether or not the use of adaptation strategies increases livelihood sustainability, measured as a composite indicator of 11 social, economic, and environmental variables.
The following key conclusions can be drawn. First, although most of the smallholder farmers in the study areas scored very low on the LSI scale, the findings generally show adaptation contributes to improvement of their livelihoods. Reduction of the risks of crop failure, obtaining higher and stable yields, creating opportunities to diversify crops, and generation of employment opportunities and alternative sources of income are the potential mechanisms through which these strategies contribute to livelihood sustainability. Second, non-farm employment and migration are beneficial strategies for vulnerable households. When exposed to climate risks, rural non-farm works and temporary migration are the most feasible option protecting highly vulnerable households. Third, there are additional sources of heterogeneity, other than CCV, that make farmers differently benefit from the use of adaptation strategies. This might include, among others, the length of crop growth period to flexibly change planting time, types of crops and size of farm plots to diversify crops, and quality of improved seeds used by farmers. Fourth, although most of the strategies considered in this study are beneficial in the three agro-ecological settings, there is slight variation between them. For instance, changing planting time benefits farmers in the highland and midland areas but not in the lowland areas. Lastly, the use of multiple adaptation strategies plays complementary roles to enhance livelihood sustainability of farmers.
The findings have important implications for interventions aimed at promoting sustainable livelihoods. Increasing the economic efficiency of agricultural production is the cornerstone of building sustainable livelihoods. Although there is a government initiative to enhance productivity through comprehensive agricultural production packages, it requires coordinated efforts to ensure the uptake of improved technologies by all farmers in all areas. Limited access to ecosystem services in the highland and midland areas calls for sustained environmental protection activities and restoration of natural resources as a means to improve the environmental dimension of livelihood sustainability. Farmers have ingrained experiential knowledge of adjusting their cropping practices in response to rainfall variability. Strengthening this system through strong and feasible outreach services is useful. For instance, since farmers not using improved seeds in all areas would benefit more if they use them, it is important to ensure the availability, accessibility, and proper utilization of these seed varieties. Although farmers who actually diversified crops in all areas similarly benefitted, the non-users in the midland and lowland areas would also improve their livelihoods through crop diversification. This denotes the importance of identifying agro-ecologically viable crop diversification options. Enhancing the skill of poor farmers through entrepreneurial training and improving their access to financial services increase the roles of non-farm activities as an alternative and/or additional sources of income. This not only reduces the volume of distress migration in search of employment in urban areas, but also creates a favourable environment for non-farm employment to make meaningful contributions to sustainable livelihoods.
Author Contributions
Conceptualization, D.E., D.J.R.M.S., C.F.A.v.W. and T.d.C.B.; Data curation, D.E.; Formal analysis, D.E., C.F.A.v.W. and T.d.C.B.; Investigation, D.E.; Methodology, D.E., D.J.R.M.S., C.F.A.v.W. and T.d.C.B.; Supervision, D.J.R.M.S., C.F.A.v.W. and T.d.C.B.; Visualization, D.E.; Writing—original draft, D.E.; Writing—review and editing, D.J.R.M.S., C.F.A.v.W. and T.d.C.B. All authors have read and agreed to the published version of the manuscript.
Funding
This research was funded by EP-Nuffic, grant number R/002597.01. The APC was funded by Amsterdam Centre for World Food Studies, Vrije Universiteit Amsterdam.
Institutional Review Board Statement
The study was conducted according to the guidelines of the Declaration of Helsinki.
Informed Consent Statement
Informed consent was obtained from all subjects involved in the study.
Data Availability Statement
The data presented in this study are available on request from the corresponding author.
Conflicts of Interest
The authors declare no conflict of interest.
Appendix A
Table A1.
Results of falsification test of the selection instruments.
Table A1.
Results of falsification test of the selection instruments.
| Adaptation Strategy | Selection Instruments | Adaptation | LSI for Households that Did Not Adapt |
|---|---|---|---|
| Changing planting time | Member of farmer group | 1.12(0.12) *** | −0.09(1.77) |
| Received farmer training | 0.22(0.11) ** | −1.60(1.12) | |
| Access to weather information | 0.32(0.11) ** | −0.03(1.05) | |
| Constant | −2.19(0.52) *** | 34.24(5.26) *** | |
| Wald test on selection instruments | 141.63 *** | 0.18 (0.912) | |
| Changing crop type | Member of farmer group | 0.03(0.12) | −1.96(1.45) |
| Received farmer training | 0.70(0.11) *** | 0.12(1.19) | |
| Access to weather information | −0.28(0.10) ** | −1.65(1.21) | |
| Constant | −1.37(0.49) ** | 35.77(5.38) *** | |
| Wald test on selection instruments | 72.86 *** | 0.79(0.501) | |
| Crop diversification | Member of farmer group | 0.02(0.15) | 0.23(3.34) |
| Received farmer training | 0.34(0.13) ** | −2.92(2.91) | |
| Access to weather information | −0.05(0.13) | 1.66(2.62) | |
| Constant | 1.77(0.64) ** | 20.13(13.44) | |
| Wald test on selection instruments | 16.32 *** | 0.18(0.911) | |
| Used improved seeds | Member of farmer group | 0.39(0.12) *** | −1.15(1.29) |
| Received farmer training | 0.29(0.11) ** | −0.96(1.03) | |
| Access to weather information | −0.13(0.10) | 1.01(1.01) | |
| Constant | −1.77(0.51) *** | 33.12(4.96) *** | |
| Wald test on selection instruments | 56.47 *** | 0.59(0.624) | |
| Land management | Member of farmer group | 0.83(0.16) *** | 2.75(3.03) |
| Received farmer training | 0.42(0.11) *** | −2.57(1.62) | |
| Access to weather information | −0.19(0.11) * | −0.83(1.59) | |
| Constant | −0.22(0.54) | 27.69(7.71) *** | |
| Wald test on selection instruments | 78.83 *** | 0.65(0.587) | |
| Irrigation | Member of farmer group | 0.26(0.13) ** | −0.02(1.21) |
| Constant | 0.35(0.52) | 33.37(4.84) *** | |
| Non-farm | Member of farmer group | 0.30(0.12) ** | −0.29(1.37) |
| Received farmer training | −0.02(0.11) | 0.39(1.24) | |
| Access to weather information | 0.36(0.11) *** | 0.47(1.16) | |
| Constant | 1.64(0.51) *** | 28.23(6.07) | |
| Wald test on selection instruments | 14.20 ** | 0.47(0.70) | |
| Migration | Member of farmer group | 0.21(0.12) * | 0.73(1.17) |
| Received farmer training | 0.14(0.12) | −1.09(0.99) | |
| Access to weather information | 0.12(0.11) | −0.09(0.96) | |
| Constant | −2.06(0.57) *** | 37.26(4.43) *** | |
| Wald test on selection instruments | 21.45 *** | 0.31(0.818) | |
| Used more than four adaptation strategies | Member of farmer group | 0.67(0.12) *** | −1.10(1.52) |
| Received farmer training | 0.45(0.11) *** | −1.41(1.09) | |
| Access to weather information | 0.09(0.10) | 0.08(1.07) | |
| Constant | −1.46(0.50) ** | 31.53(5.28) *** | |
| Wald test on selection instruments | 104.14 *** | 0.35 |
*** p < 0.001; ** p < 0.01; * p < 0.05; Note: Figures in parentheses are standard errors.
References
- Eriksen, S.H.; O’brien, K. Vulnerability, poverty and the need for sustainable adaptation measures. Clim. Policy 2007, 7, 337–352. [Google Scholar] [CrossRef]
- Waha, K.; Müller, C.; Bondeau, A.; Dietrich, J.P.; Kurukulasuriya, P.; Heinke, J.; Lotze-Campen, H. Adaptation to climate change through the choice of cropping system and sowing date in sub-Saharan Africa. Glob. Environ. Chang. 2013, 23, 130–143. [Google Scholar] [CrossRef]
- Rasul, G.; Sharma, B. The nexus approach to water–energy–food security: An option for adaptation to climate change. Clim. Policy 2016, 16, 682–702. [Google Scholar] [CrossRef]
- Moser, S.C.; Ekstrom, J.A. A framework to diagnose barriers to climate change adaptation. Proc. Natl. Acad. Sci. USA 2010, 107, 22026–22031. [Google Scholar] [CrossRef]
- Etana, D.; Snelder, D.J.R.M.; van Wesenbeeck, C.F.A.; de Cock Buning, T. Dynamics of smallholder farmers’ livelihood adaptation decision-making in Central Ethiopia. Sustainability 2020, 12, 4526. [Google Scholar] [CrossRef]
- Arslan, A.; McCarthy, N.; Lipper, L.; Asfaw, S.; Cattaneo, A.; Kokwe, M. Climate Smart Agriculture? Assessing the Adaptation Implications in Zambia. J. Agric. Econ. 2015, 66, 753–780. [Google Scholar] [CrossRef]
- Asfaw, S.; McCarthy, N.; Lipper, L.; Arslan, A.; Cattaneo, A. What determines farmers’ adaptive capacity? Empirical evidence from Malawi. Food Secur. 2016, 8, 643–664. [Google Scholar] [CrossRef]
- Di Falco, S.; Veronesi, M.; Yesuf, M. Does Adaptation to Climate Change Provide Food Security—A Micro-Perspective from Ethiopia. Am. J. Agric. Econ. 2011, 93, 829–846. [Google Scholar] [CrossRef]
- Chambers, R.; Conway, G. Sustainable Rural Livelihoods: Practical Concepts for the 21st Century; Institute of Development Studies: Brighton, UK, 1992. [Google Scholar]
- Scoones, I. Sustainable Rural Livelihoods: A Framework for Analysis; IDS Working Paper 72; Institute of Development Studies: Brighton, UK, 1998. [Google Scholar]
- De Haan, L.; Zoomers, A. Exploring the frontier of livelihoods research. Dev. Chang. 2005, 36, 27–47. [Google Scholar] [CrossRef]
- Scoones, I. Livelihoods perspectives and rural development. J. Peasant. Stud. 2009, 36, 171–196. [Google Scholar] [CrossRef]
- Connolly-Boutin, L.; Smit, B. Climate change, food security, and livelihoods in sub-Saharan Africa. Reg. Environ. Chang. 2016, 16, 385–399. [Google Scholar] [CrossRef]
- Boelee, E.; Yohannes, M.; Poda, J.-N.; McCartney, M.; Cecchi, P.; Kibret, S.; Hagos, F.; Laamrani, H. Options for water storage and rainwater harvesting to improve health and resilience against climate change in Africa. Reg. Environ. Chang. 2013, 13, 509–519. [Google Scholar] [CrossRef]
- Djoudi, H.; Brockhaus, M.; Locatelli, B. Once there was a lake: Vulnerability to environmental changes in northern Mali. Reg. Environ. Chang. 2013, 13, 493–508. [Google Scholar] [CrossRef]
- Rodriguez-Solorzano, C. Unintended outcomes of farmers’ adaptation to climate variability: Deforestation and conservation in Calakmul and Maya biosphere reserves. Ecol. Soc. 2014, 19, 53. [Google Scholar] [CrossRef]
- Dinshaw, A.; Fisher, S.; McGray, H.; Rai, N.; Schaar, J. Monitoring and evaluation of climate change adaptation: Methodological approaches. In OECD Environment Working Papers; No. 74; OECD Publishing: Paris, France, 2014. [Google Scholar]
- Kothari, C.R. Research Methodology: Methods and Techniques; New Age International: New Delhi, India, 2004. [Google Scholar]
- Singh, P.K.; Hiremath, B. Sustainable livelihood security index in a developing country: A tool for development planning. Ecol. Indic. 2010, 10, 442–451. [Google Scholar] [CrossRef]
- Fisher, J.A.; Patenaude, G.; Meir, P.; Nightingale, A.J.; Rounsevell, M.D.; Williams, M.; Woodhouse, I.H. Strengthening conceptual foundations: Analysing frameworks for ecosystem services and poverty alleviation research. Glob. Environ. Chang. 2013, 23, 1098–1111. [Google Scholar] [CrossRef]
- Egoh, B.N.; O’Farrell, P.J.; Charef, A.; Gurney, L.J.; Koellner, T.; Abi, H.N.; Egoh, M.; Willemen, L. An African account of ecosystem service provision: Use, threats and policy options for sustainable livelihoods. Ecosyst. Serv. 2012, 2, 71–81. [Google Scholar] [CrossRef]
- Coates, J.; Swindale, A.; Bilinsky, P. Household Food Insecurity Access Scale (HFIAS) for Measurement of Food Access: Indicator Guide, Version 3; Food and Nutrition Technical Assistance (FANTA) Project: Washington, DC, USA, 2007. [Google Scholar]
- Etana, D.; Snelder, D.J.R.M.; van Wesenbeeck, C.F.A.; de Cock Buning, T. Climate change, in-situ adaptation, and migration decisions of smallholder farmers in central Ethiopia. Migr. Dev. 2020, 1–25. [Google Scholar] [CrossRef]
- Lokshin, M.; Sajaia, Z. Maximum likelihood estimation of endogenous switching regression models. Stata J. 2004, 4, 282–289. [Google Scholar] [CrossRef]
- Khonje, M.; Manda, J.; Alene, A.D.; Kassie, M. Analysis of adoption and impacts of improved maize varieties in eastern Zambia. World Dev. 2015, 66, 695–706. [Google Scholar] [CrossRef]
- Shiferaw, B.; Kassie, M.; Jaleta, M.; Yirga, C. Adoption of improved wheat varieties and impacts on household food security in Ethiopia. Food Policy 2014, 44, 272–284. [Google Scholar] [CrossRef]
- Bangwayo-Skeete, P.F.; Bezabih, M.; Zikhali, P. Crop biodiversity, productivity and production risk: Panel data micro-evidence from Ethiopia. Nat. Resour. forum 2012, 36, 263–273. [Google Scholar] [CrossRef]
- Di Falco, S.; Chavas, J.-P. On crop biodiversity, risk exposure, and food security in the highlands of Ethiopia. Am. J. Agric. Econ. 2009, 91, 599–611. [Google Scholar] [CrossRef]
- Etana, D.; Snelder, D.J.R.M.; van Wesenbeeck, C.F.A.; de Cock Buning, T. Trends of Climate Change and Variability in Three Agro-Ecological Settings in Central Ethiopia: Contrasts of Meteorological Data and Farmers’ Perceptions. Climate 2020, 8, 121. [Google Scholar] [CrossRef]
- Bezabih, M.; Sarr, M. Risk preferences and environmental uncertainty: Implications for crop diversification decisions in Ethiopia. Environ. Resour. Econ. 2012, 53, 483–505. [Google Scholar] [CrossRef]
- Michler, J.D.; Josephson, A.L. To specialize or diversify: Agricultural diversity and poverty dynamics in Ethiopia. World Dev. 2017, 89, 214–226. [Google Scholar] [CrossRef]
- Araya, T.; Nyssen, J.; Govaerts, B.; Deckers, J.; Sommer, R.; Bauer, H.; Gebrehiwot, K.; Cornelis, W.M. Seven years resource-conserving agriculture effect on soil quality and crop productivity in the Ethiopian drylands. Soil Tillage Res. 2016, 163, 99–109. [Google Scholar] [CrossRef]
- Kato, E.; Ringler, C.; Yesuf, M.; Bryan, E. Soil and water conservation technologies: A buffer against production risk in the face of climate change? Insights from the Nile basin in Ethiopia. Agric. Econ. 2011, 42, 593–604. [Google Scholar] [CrossRef]
- Adgo, E.; Teshome, A.; Mati, B. Impacts of long-term soil and water conservation on agricultural productivity: The case of Anjenie watershed, Ethiopia. Agric. Water Manag. 2013, 117, 55–61. [Google Scholar] [CrossRef]
- Kassie, M.; Pender, J.; Yesuf, M.; Kohlin, G.; Bluffstone, R.; Mulugeta, E. Estimating returns to soil conservation adoption in the northern Ethiopian highlands. Agric. Econ. 2008, 38, 213–232. [Google Scholar] [CrossRef]
- Teklewold, H.; Mekonnen, A.; Köhlin, G. Climate change adaptation: A study of multiple climate-smart practices in the Nile Basin of Ethiopia. Clim. Dev. 2019, 11, 180–192. [Google Scholar] [CrossRef]
- Ebabu, K.; Tsunekawa, A.; Haregeweyn, N.; Adgo, E.; Meshesha, D.T.; Aklog, D.; Masunaga, T.; Tsubo, M.; Sultan, D.; Fenta, A.A.; et al. Effects of land use and sustainable land management practices on runoff and soil loss in the Upper Blue Nile basin, Ethiopia. Sci. Total Environ. 2019, 648, 1462–1475. [Google Scholar] [CrossRef]
- Branca, G.; Lipper, L.; McCarthy, N.; Jolejole, M.C. Food security, climate change, and sustainable land management. A review. Agron. Sustain. Dev. 2013, 33, 635–650. [Google Scholar] [CrossRef]
- Legesse, L.; Ayele, A.; Tasewu, W.; Alemu, A. Impact of Small Scale Irrigation on Household Farm Income and Asset Holding: Evidence from Shebedino District, Southern Ethiopia. J. Resour. Dev. Manag. 2018, 43, 8–15. [Google Scholar]
- Muluneh, A.; Stroosnijder, L.; Keesstra, S.; Biazin, B. Adapting to climate change for food security in the Rift Valley dry lands of Ethiopia: Supplemental irrigation, plant density and sowing date. J. Agric. Sci. 2016, 155, 703–724. [Google Scholar] [CrossRef]
- Abebaw, D.; Admassie, A.; Kassa, H.; Padoch, C. Does rural outmigration affect investment in agriculture? Evidence from Ethiopia. Migr. Dev. 2019, 10, 144–168. [Google Scholar] [CrossRef]
- Abebaw, D.; Admassie, A.; Kassa, H.; Padoch, C. Can rural outmigration improve household food security? Empirical evidence from Ethiopia. World Dev. 2020, 129, 104879. [Google Scholar] [CrossRef]
- Mueller, V.; Doss, C.; Quisumbing, A. Youth Migration and Labour Constraints in African Agrarian Households. J. Dev. Stud. 2018, 54, 875–894. [Google Scholar] [CrossRef]
- Redehegn, M.A.; Sun, D.; Eshete, A.M.; Gichuki, C.N. Development impacts of migration and remittances on migrant-sending communities: Evidence from Ethiopia. PLoS ONE 2019, 14, e0210034. [Google Scholar] [CrossRef]
- Bezu, S.; Holden, S. Are Rural Youth in Ethiopia Abandoning Agriculture? World Dev. 2014, 64, 259–272. [Google Scholar] [CrossRef]
- Matsumoto, T.; Kijima, Y.; Yamano, T. The role of local nonfarm activities and migration in reducing poverty: Evidence from Ethiopia, Kenya, and Uganda. Agric. Econ. 2006, 35, 449–458. [Google Scholar] [CrossRef]
- Bezu, S.; Barrett, C.B.; Holden, S.T. Does the Nonfarm Economy Offer Pathways for Upward Mobility? Evidence from a Panel Data Study in Ethiopia. World Dev. 2012, 40, 1634–1646. [Google Scholar] [CrossRef]
- Van Den Berg, M.; Kumbi, G.E. Poverty and the rural nonfarm economy in Oromia, Ethiopia. Agric. Econ. 2006, 35, 469–475. [Google Scholar] [CrossRef]
- Gebreyesus, B. The Effect of Livelihood Diversification on Household Income: Evidence from Rural Ethiopia. Int. J. Afr. Asian Stud. 2016, 20, 1–12. [Google Scholar]
- Ali, M.; Peerlings, J. Farm households and nonfarm activities in Ethiopia: Does clustering influence entry and exit? Agric. Econ. 2012, 43, 253–266. [Google Scholar] [CrossRef]
- Bezu, S.; Barrett, C. Employment Dynamics in the Rural Nonfarm Sector in Ethiopia: Do the Poor Have Time on Their Side? J. Dev. Stud. 2012, 48, 1223–1240. [Google Scholar] [CrossRef]
- Holden, S.; Shiferaw, B.; Pender, J. Non-farm income, household welfare, and sustainable land management in a less-favoured area in the Ethiopian highlands. Food Policy 2004, 29, 369–392. [Google Scholar] [CrossRef]
- Nasir, M.; Hundie, B. The effect of off farm employment on agricultural production and productivity: Evidence from Gurage Zone of Southern Ethiopia. J. Econ. Sustain. Dev. 2014, 5, 85–98. [Google Scholar]
- Mekonnen, Z.; Woldeamanuel, T.; Kassa, H. Socio-ecological vulnerability to climate change/variability in central rift valley, Ethiopia. Adv. Clim. Chang. Res. 2019, 10, 9–20. [Google Scholar] [CrossRef]
- Tesso, G.; Emana, B.; Ketema, M. Analysis of vulnerability and resilience to climate change induced shocks in North Shewa, Ethiopia. Agric. Sci. 2012, 3, 871–888. [Google Scholar] [CrossRef]
Publisher’s Note: MDPI stays neutral with regard to jurisdictional claims in published maps and institutional affiliations. |
© 2021 by the authors. Licensee MDPI, Basel, Switzerland. This article is an open access article distributed under the terms and conditions of the Creative Commons Attribution (CC BY) license (https://creativecommons.org/licenses/by/4.0/).