Abstract
Electrical energy and power demand will experience exponential increase with the rise of the global population. Power demand is predictable and can be estimated based on population and available historical data. However, renewable energy sources (RES) are intermittent, unpredictable, and environment-dependent. Interestingly, microgrids are becoming smarter but require adequate and an appropriate energy storage system (ESS) to support their smooth and optimal operation. The deep discharge caused by the charging–discharging operation of the ESS affects its state of health, depth of discharge (DOD), and life cycle, and inadvertently reduces its lifetime. Additionally, these parameters of the ESS are directly affected by the varying demand and intermittency of RES. This study presents an assessment of battery energy storage in wind-penetrated microgrids considering the DOD of the ESS. The study investigates two scenarios: a standalone microgrid, and a grid-connected microgrid. The problem is formulated based on the operation cost of the microgrid considering the DOD and the lifetime of the battery. The optimization problem is solved using non-linear programming. The scheduled operation cost of the microgrid, the daily scheduling cost of ESS, the power dispatch by distributed generators, and the DOD of the battery storage at any point in time are reported. Performance analysis showed that a power loss probability of less than 10% is achievable in all scenarios, demonstrating the effectiveness of the study.
1. Introduction
In recent years, when discussing the concept of electrical power in a microgrid (MG), many factors, such as power demand, population, level of industrialization, and geographical location, among many others, are usually the major concerns that require research and innovative solutions. Other aspects that are even more important when planning the operation of MGs are renewable energy sources (RES), energy storage, power demand, seasonal demand variation, and interest rate, to mention a few. Weather conditions not only affect electricity production from both solar and wind but also directly impact electricity demand [1]. The highest demand is observed in the summer and the lowest demand usually occurs in the spring [2]. Similarly, demand varies across the day; it is higher during working hours, i.e., from morning until evening [3,4]. Incidentally, renewable power generation from wind and solar also varies with season, and this has a significant impact on the operation of a wind-penetrated MG in these seasons [5]. However, the MG extensively relies on the support provided from the available dispatchable sources, such as battery energy storage systems (BESS), the grid, or any other source integrated within the MG system. Consequently, there will be more stress on these dispatchable sources, especially the BESS, whenever demand exceeds the renewable outputs [6]. Moreover, BESS depletion will be higher in the summer compared to other seasons due to higher ambient temperature [7].
Many countries have ambitions to increase their level of wind-based electric power generation within their energy mix, given progressive environmental concerns combined with technological and economic support. Recently, in the 2018 annual report, global renewable wind power generation experienced a growth of up to 80 GW [8]. Furthermore, at least 30 countries have successfully installed more than 10 GW of renewable power capacity, increasing the global renewable capacity by 8% in 2018 (Figure 1). In this respect, there exists a multi-faceted techno-economic challenge in the field of alternative green energy sources that retains its integrative potential in the power grid, which is pertinent for curbing/obviating the existing fossil fuel sources that significantly contribute to greenhouse gas emissions. Renewable electric power generation from wind and solar powers are identified as possessing the potential to reduce emissions from the electricity sector [9]. The aim for the future of the energy sector is the deregulation and establishment of a distributed electricity network that fulfills the requirements of RESs and offers the flexibility to integrate innovative technical solutions regarding generation, transmission, and distribution [10,11].
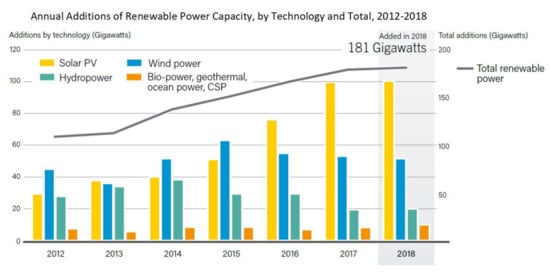
Figure 1.
Renewables 2019 Global status report [8].
The target is to reduce the dependency from centralized carbon-based utility generation and establish a smart grid that are self-reliant and allow large-scale interconnection [12]. Ultimately, the concept of MGs formulation is needed for a smooth deployment of renewables sources for both standalone and grid-integrated installations. The features of MG facilitates power supply for constant and variable loads in autonomous as well as utility integrated operations. The capability of integrating heterogeneous generation systems in MG increases the overall system reliability with efficient operation [13]. Therefore, distributed generators such as diesel generators (DG), storage systems, dump loads, and electric vehicles can be optimally used individually during grid transition and expansion in the future power grid [14,15]. These features predominantly differentiate MGs from centralized systems (Figure 2).
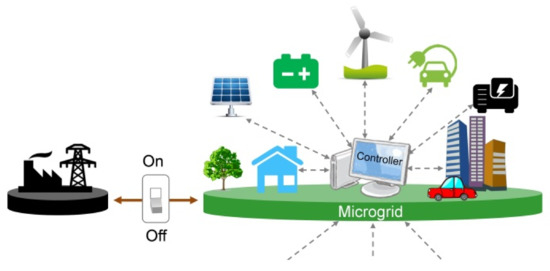
Figure 2.
A typical microgrid [16].
Accordingly, ESS provides a pivotal support in various phases of MG operation. For instance, BESS facilitates peak shifting and load levelling to support the system during peak demand periods and maintain the power quality of the system [17]. The study in [18] confirmed that fuel consumption in MG could be reduced by up to 75% if the ESS is combined with renewable energy sources. Numerous storage technologies and their potential applications is comprehensively presented in [19,20,21]. The capability of ESS as an energy buffer is directly affiliated to their technical characteristics such as charge/discharge rates, energy density, power density and self-discharging rates [22,23,24]. Consequently, use of ESS technologies (Figure 3) in accordance with their technical characteristics and maintaining an optimal operation based on size, weight, and rating proves to be an important concern towards the techno-economic justification of ESS integration.
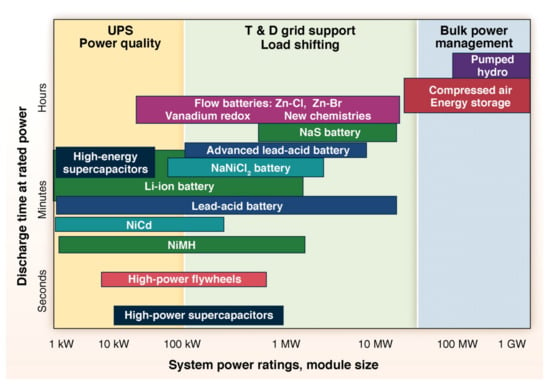
Figure 3.
Characteristics of different ESS technologies [24].
Considering the capital cost, operational cost, and maintenance cost it is important to ensure an optimal operation of the MG. Similarly, determining an optimal size of ESS is a technical and economic concern as the energy storage technologies, especially BESS are expensive. Numerous studies have been presented for optimal sizing and use of ESS. In [25], an optimal BESS sizing strategy is formulated using multi-scaled decision parameters to satisfy the system load demand. The authors presented a multi-time scale as well as multi-stage optimal planning strategy to map the BESS optimal size, performance and replacement cost using a long-term probabilistic optimization technique. In [26], power system probability framework is used to formulate a reliable power supply that concurrently provides an economic quantification of the required BESS using grasshopper optimization. This study was presented for islanded MG system consisting of solar PV, wind and diesel generators. Furthermore, a comparative analysis is also provided with other meta-heuristic techniques.
Accordingly, an optimal size for BESS is determined for DC MGs for reducing only their running cost [27]. The study formulates an economic dispatch problem combined with a droop controlled MG. Various case studies are presented using heuristic optimization technique based on this control architecture. Furthermore, a case-based comparative analysis is presented with dynamic programming technique considering an IEEE 33 bus system to outline the economic gain as well as highlighting the potential achievement of establishing a near-linear relationship between the BESS optimal size and the BESS efficiency. The study in [28], presents an economic dispatching framework for BESS using firefly algorithm. The authors aim to achieve a cost reduction with UPS for renewable-based MG systems. This study developed its optimization problem using reliability indices of power system combined with DOD of BESS and posited an optimal sizing technique.
The research presented in [29], determined an optimal BESS size for hybrid wind-solar system considering a grid-connected MG operation. The study uses power system probability indices to optimally size the renewable sources to ultimately maximize the overall system reliability with reduced cost. The authors developed a search space for the entire combination of solar and wind profiles and identified an optimal size of BESS to satisfy the load demand. The study in [30], provides an optimal BESS size for an islanded MG using a double layer strategy. The formulated model solves the optimization problem on an inner and an outer loop using iteration and dynamic programming with bellman algorithm [31]. The inner loop maintains the energy management of the MG using dynamic programming and the outer loop determines the optimal cost for the system considering the fuel cost, operational cost, and emission cost based on the physical and operational constraints of the system. Furthermore, the study in [32], proposes a framework for optimal sizing and management of lithium-ion batteries for a MG that consists of solar photovoltaic systems. The technique is developed based on dynamic programming combined with region-elimination [33] and network sensitivity technique [34]. The proposed framework aims to increase the BESS lifetime and profit margin. Based on the experimental validation presented for an industrial rooftop PV system the author posits that the applicability of the proposed technique can be further extended to other system dynamic system without bearing the impact of the non-linear functionalities.
The research in [35], presents an optimal sizing strategy for vanadium redox battery for an isolated MG system. The developed optimization problem is based on optimal scheduling and cost-benefit analysis that is solved using dynamic programming technique. The optimization problem is validated considering one year values of an Army base site in Missouri, USA. In case of grid-tied operation of the MG, the operation of the optimally sized vanadium redox battery is limited due to the economical constraints that aims to serve minimum loads when the cost of electricity is cheaper during high PV production time. Therefore, the author posits that for determining an optimal energy rating of the energy storage device an appropriate evaluation of the insolation and diesel fuel cost is needed that is dependant on the location. The study in [36], presented a capacity optimization technique for lithium iron phosphate battery considering their operating cost and capacity fading cost. The authors validates the efficacy of the proposed dynamic programming technique over other methodologies that are formulated using rule-based and genetic algorithm to quantify the effect on the battery degradation.
A BESS sizing methodology using a mix-mode energy management technique for different level of SOC is proposed in [37]. The objective function aims to maintain an economic operation that is solved using linear programming and mixed integer linear programming optimization framework. Several analysis are performed considering a 24 h operational time period of a utility network integrated with renewables to identify and prescribe an economic profile for the SOC. However, the non-linear operation of BESS, the technical constraints of the grid components, and the economic variables are required to be linearized that introduces inaccuracies in the result [38]. Numerous research propositions have been formulated that are based on neural network theory [39] and non-linear optimization [40] that aim to improve the deployment of BESS. However, the objectives of these methodologies deal solely with the energy management of the BESS.
In this paper, an optimal operation for a wind penetrated microgrids is performed based on techno-economic analysis of BESS. Two scenarios are investigated considering two cases of MG operation: (i) grid-connected MG supported with BESS, and (ii) stand-alone MG supported by DGs. These scenarios are simulated for two different wind profiles. The problem is formulated based on the economic operation cost for optimally scheduling the MG considering the DOD and lifetime of the BESS. The optimization problem is solved using non-linear dynamic programming. The scheduling cost of the MG, the power dispatched by distributed generators, and the DOD of the BESS are reported for the all scenarios. Therefore, the issues that are being addressed in this study are highlighted as follows:
- The operation of BESS under different real profiles of wind energy generation is investigated.
- The effect of wind power variation on the DOD and life-cycles of the BESS are investigated under two distinct scenarios of the MG and its operational modes.
- The paper investigates the performance of standalone and grid-connected MG by comparing the outcome of power loss probabilities and the cost of electricity obtained in each case.
- Reliability and techno-economic autonomous operation of standalone in comparison to grid-connected operational mode.
The remainder of this paper is outlined as follows. The problem formulation and test system scenarios are discussed in Section 2. The proposed methodology and numerous system constraints are presented in Section 3. The variables of the performance analysis are discussed in Section 4. Section 5 describes various system specification of the microgrid components. Section 6 presents the results and discussion followed by the conclusion in Section 7.
2. Problem Formulation
A wind-based microgrid, as shown in Figure 4 is considered to formulate the proposed strategy. The optimal operational costs of the MG components, namely wind turbine, battery energy storage system, and diesel generators are developed to compute their respective power dissipation costs. Two test scenarios are considered in this study. In scenario 1, power sources include the BESS and the utility grid, apart from the wind farm. The MG is operated to facilitate the consumption of maximum power generated by the wind farms () and additionally minimize the import of power from the grid (). In scenario 2, the MG is operated in an islanded mode with additional support taken from three diesel generators. In this scenario, the MG is off-grid and three diesel generators are used to facilitate as a backup energy source when the output from the wind and BESS are not able to meet the load demand. The required optimal BESS size is formulated over a 24 h horizon.
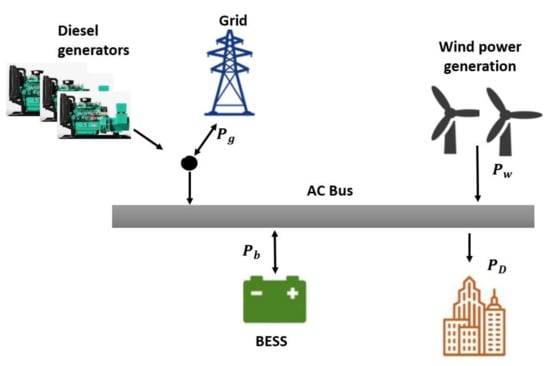
Figure 4.
The proposed microgrid architecture.
It is necessary that the generator output power () is optimally dispatched so that the wind power is effectively consumed. The charging/discharging of the BESS at the point of common coupling is achieved through power converters with appropriate controllers. However, an in-depth discussion on the converter topology and its control is not illustrated in this study. In both the test scenarios, BESS discharges during high demand time periods and/or during low . Similarly, BESS is charged during the low demand time intervals and/or during high . Furthermore, the BESS power () and BESS energy () are respectively regulated between a predetermined rated power () and rated energy () over the entire operational time period. Figure 4 shows the proposed MG structure which allows switching from grid-connect mode to stand alone mode to accommodate the proposed strategies.
2.1. Hybrid Microgrid Components
A microgrid system is broadly divided into the following three sub-systems: power demand, power generation, and power distribution. These subsystems constitutes a MG in an islanded mode. The utility integration of the MG is termed as grid-integrated mode of the MG. In this study, the distributed energy resources (DER) are the components of the hybrid MG system that consists of wind generators, BESS, and diesel generators. While the DER and the utility grid constitutes the power generation subsystem, the load demand () constitute the power demand subsystem and the MG itself serves as the power distribution subsystem. The cost model of the system is discussed in the following sections.
2.2. Wind Turbine System
Wind power () is largely dependent on wind speed (v) and the relationship between wind power and wind speed is cubical. The wind power equation (1) is formulated from the wind speed [41] that is used for computing the power output of the wind farms in this study [42].
where is the air density, is the power coefficient, and is the swept area by rotor of the wind turbine. Figure 5 and Figure 6 respectively depicts the wind speed and wind power profiles that were obtained from the Eastern Province of Saudi Arabia.
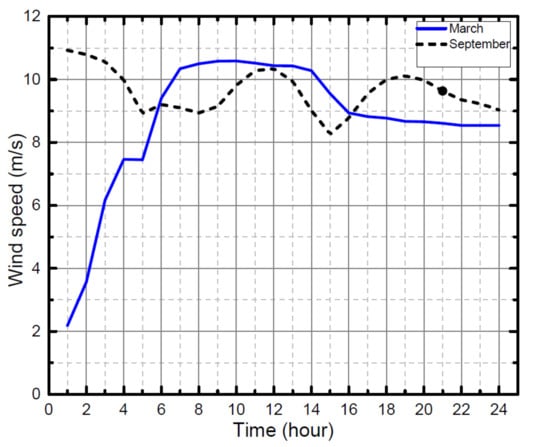
Figure 5.
Wind speed profile.
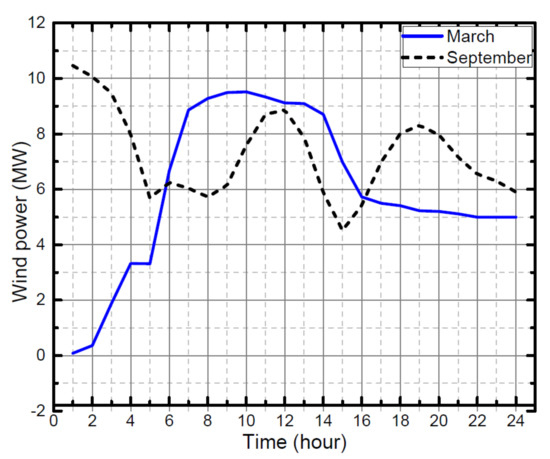
Figure 6.
Wind power profile.
The daily cost of wind power dissipation () is defined as the product of the power dispatch and the initial wind turbine cost, it is expressed as [28]:
The capital recovery factor () estimates the present value of the wind turbine in accordance with the lifetime of project and interest rate, that is expressed as:
2.3. Diesel Generation System
The DG in the MG serves as an additional backup source in concurrence to BESS during the intervals of wind power deficiency. This contributes towards an overall improvement of the system reliability and the smoothing of the wind power output. The power operational cost of the DG (4) is formulated based on the power dispatch by the generators [28]. The formulation of this equation consists of the fuel cost () as well as the emission cost () of the DG [43].
where i is the generation unit index, t is the hour index, I is the total number of generation units, and T is the total number of hours. The cost coefficients of the generation unit i are represented using , and . Furthermore, and are the cost coefficients of emission for generator unit i.
2.4. Utility Grid System
The utility grid interchangeably referred to as grid or main grid in this paper, facilitates as an alternative power source to the MG (beside DGs, wind farm, and BESS). The MG either buys or sells power to the utility depending on the required demand. The cost of the power exchange between the utility and the MG is quantified based on a developed cost model (7). This study assumes a positive sign convention for the grid power , when the power is imported from the main grid to the MG and a negative sign convention when the power is exported to the main grid by the MG. The cost of the exchanged power () is taken as 20 USD per MWh in this study. Therefore, a negative value of indicates that more power has been exported from the MG to the main grid.
2.5. Battery Energy Storage System
Lithium-ion (Li-ion) BESS technology is considered in this study. Li-ion based BESSs has appropriate power density, high charge/discharge efficiency, high energy density, and long life-cycle in comparison to other BESS technologies [44,45], as depicted in Figure 3. Although most BESS are suitable for uninterrupted power supply (UPS), power quality, and grid support. Li-ion battery can have more than 1MW power capacity with average discharge time in minutes. Both Figure 3 and Figure 7 show that the Li-ion battery has a comparatively higher energy capacity, low-self discharge rate, and high life-cycle.
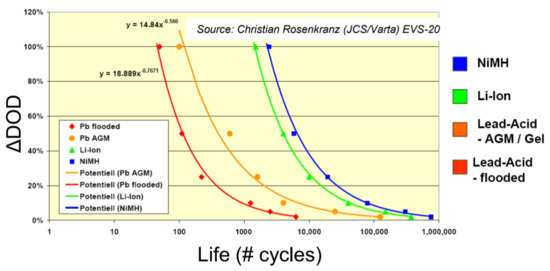
Figure 7.
Depth of discharge versus number of cycles of battery energy storage [46].
Principally, BESS obviates power mismatch in a MG. The cost of ESS proportionally increases with an increase in their depth-of-discharge (DOD). Accordingly, a decrease in the discharge power of the BESS decreases the ESS capacity and consequently the DOD becomes high. The cost function of BESS charge/discharge at a time interval (t) as a function of DOD and BESS power is formulated as [47]:
where in the degradation cost of BESS, is the total capacity of BESS in , is the investment cost of the BESS, is the incremental time (considered in 1 h step) for the optimization, and is the number of cycles of energy storage at a particular DOD. The relationship between DOD and the number of cycles of different battery energy storage technologies is shown in Figure 7. The dynamics of the BESS pertaining to its cycle number and corresponding to the DOD in defined in (9), and the dynamics of DOD is computed using (10). The state-of-charge (SOC) of the BESS is expressed by (11). Where BESS charging and discharging efficiency are represented by and respectively.
2.6. Load Demand Data
The load profile in Figure 8, is used in this study that is a real average load data collected from the city of Dhahran, located in the Eastern Province [48]. Similarly, the wind data is obtained from the meteorological station located at Al-Al-Khafji station (N25.500-E49.375).
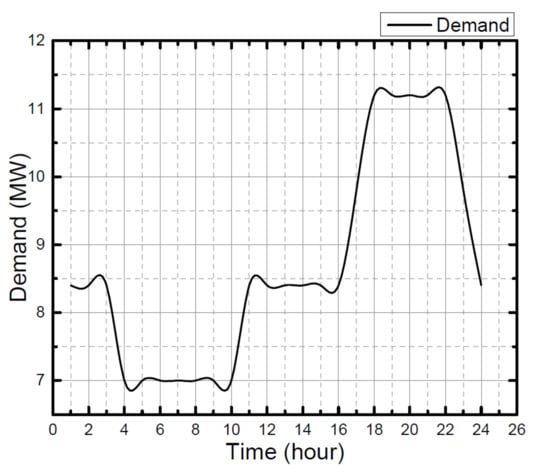
Figure 8.
Load demand of the microgrid system [48].
3. Methodology
3.1. Objective Function
The objective function aims to minimize the overall operational cost (J) of the MG system. The optimization problem is solved using NLP optimization through Antigone solver in GAMS software using the objective function, expressed as:
The daily schedule cost of the MG that is to be minimized is expressed as:
where is the cost of distributed generation expressed as sum of (2), (4) and (7). It is represented using (14) for the grid-connected MG and as (15) for stand-alone MG.
The daily cost of the battery () is expressed as:
where is the capital recovery factor and is the yearly maintenance cost of the BESS, covering the lifetime of the BESS.
3.2. System Constraints
The technical constraints of the system are defined in the following sub-sections.
3.2.1. Constraint for Power Exchange
The transmission line governs the capacity of power that can be exchanged between the utlity and the MG. The power exchange constraint is dependent on the line capacity of the transmission line that is expressed as:
where presents the maximum capacity of the transmission line that connects the utility and the MG.
3.2.2. Demand-Generation Constraint
The demand-generation constraint (18), primarily maintain the power balance of the network, this study uses the equality constraint [49], to maintain the power quality of the supplied power.
Here, is taken as zero when MG operates under scenario 1 and the value of is zero in the case of scenario 2.
3.2.3. Constraint for Diesel Generation System
The output power capability of DG unit i, is limited by their maximum and minimum constraints, that is expressed as:
here, I is the set of generation units, and are the minimum and maximum power that can be produced by a DG unit i.
3.2.4. Constraints for Battery Energy Storage System
The charging/discharging capability of BESS is limited by its maximum power. The BESS is considered as a load during its charging period and as a generator during its discharging intervals. Moreover, the power of BESS is considered to be positive while discharging and negative during its charging intervals. These constraints are expressed as:
The rated energy of BESS governs and limits its stored energy (always positive). The constraint is computed as:
where is the energy stored in BESS at hour t. The SOC of BESS is formulated as:
4. Performance Analysis
Reliability analysis and the cost of electricity ($/MWh) are used to measure the performance of the MG [50].
4.1. Reliability Analysis
The reliability analysis is statistically measured based on power loss probability (PLP). The probability that the total power generated is able or unable to meet the demand over a certain time horizon defines the PLP as a reliability index of power system. In mathematical terms, it is defined as the ratio of the energy shortage and the total energy demand over a time horizon [51]. This reliability index is also alternatively termed as Loss of Load Probability. The PLP equation postulated in [28] is adopted to calculate the PLP for scenario 1 (PLP1) and scenario 2 (PLP2), expressed as:
4.2. Cost of Electricity
The cost of electricity () is a parameter that is measured between all power generation sources and the demand within 24 h. It is calculated using (25) and (26) for Scenario 1 () and Scenario 2 () respectively.
The steps involved in solving the optimization problems of Scenario 1 and Scenario 2 are given in the flowcharts shown in Figure 9 and Figure 10 respectively.
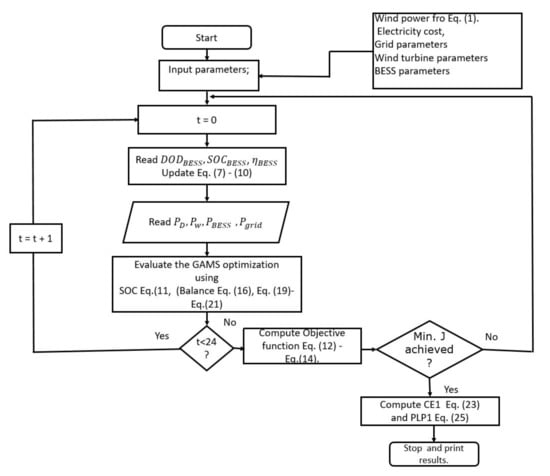
Figure 9.
Flow chart of the microgrid system operation in Scenario 1.
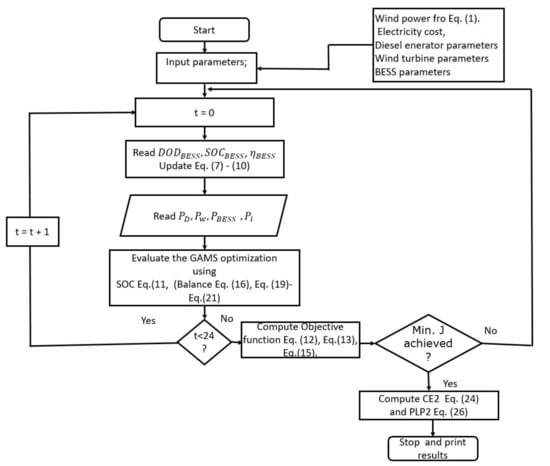
Figure 10.
Flow chart of the microgrid system operation in Scenario 2.
5. Case Study
The two scenarios as described in Section 2 are tested on the load profile as shown in Figure 8. The parameters of BESS, wind turbine, and all the assumed constants are given in Table 1 and Table 2. Accordingly, and radius of rotor turbine are taken as kgm, and 31 m respectively. Typically, the value of varies between 0.35–0.45 [52,53,54], for simplicity, in this study we have taken the maximum limit of as 0.45. The wind farm consists of 40 wind turbine generators each rated at 1 MW capacity. The corresponding wind speed and wind power are depicted in Figure 5 and Figure 6 respectively.

Table 1.
Technical parametric values of battery energy storage system.

Table 2.
Parameters of wind turbine.
6. Results and Discussion
6.1. Scenario 1
In Case A, the daily schedule cost of the MG is 976.719 USD while the daily cost of BESS is 139.366 USD, resulting in an electricity cost of 5.31 USDper MWh for the load profile. The daily power dispatch of the MG from all sources is shown in Figure 11 and the DOD in Figure 12. In Case B, the daily schedule cost of microgrid is 694.92 USD with a BESS daily schedule cost of 67.91047 USD and the daily electricity cost of 3.32 USDper MWh for the load profile. As seen from these results, it is cheaper to operate the MG in Case B than Case A. The justification for this comes from the excess wind power produced in Case B that surpasses Case A. Comparatively, with wind power and BESS, the cost of electricity per MWh is observably low in Case B.
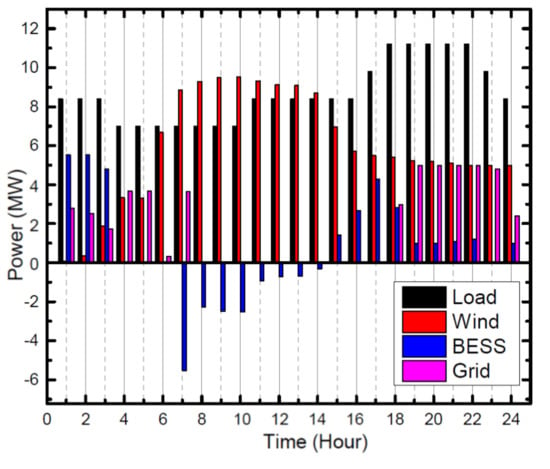
Figure 11.
Microgrid power dispatch in Scenario 1, Case A.
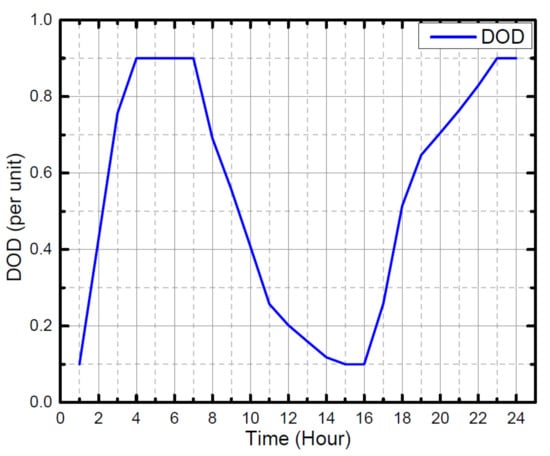
Figure 12.
DOD of BESS Case A, Scenario 1.
In Figure 11, it is seen that BESS dispatches its power when the wind output is low. However, the level of power dispatch could be seen in the DOD (Figure 12), which reached up to 0.9 from the 4th to 7th hour. The DOD is significantly high for about 7 h in the 24-h margin where it exceeds 0.8. The BESS operates in a safe condition for a majority of its operating hours.
An improved DOD is observed in case B of Scenario 1. The highest DOD is below 0.85. A constant DOD of nearly 0.8 is observed from the 15th hour up to the 24th hour because of the steady supply from the grid, as observed in Figure 13. An improved DOD is experienced in case B of Scenario 1 as seen in Figure 14. It is cheaper to consume from the grid at these hours thus limiting the dispatch from the BESS that improves its operating condition.
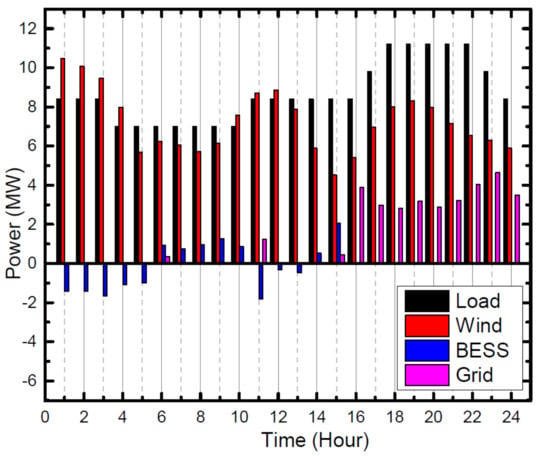
Figure 13.
Microgrid power dispatch in Case B, Scenario 1.
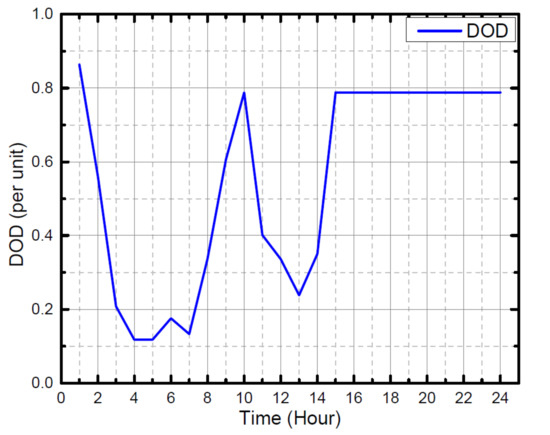
Figure 14.
DOD of BESS Case B, Scenario 1.
6.2. Scenario 2
In Scenario 2, the off-grid operation of the MG is supported by the DGs. In Case A, the daily schedule cost is calculated to be 642.542 USD while the daily cost of BESS is 235.98 USD and the price of electricity per MWh is 3.74 USD. In Case B, the schedule cost for a day is 519.52 USD, BESS cost is 43.02 USD, and the cost of electricity is 3.28 USD per MWh. It is observed that the price of daily electricity for the load profile dropped in Case B. However, the price per MWh of electricity is less than what was recorded in both cases of Scenario 1. Figure 15 and Figure 16 depict the profiles of the power dispatch by BESS, generators, and wind turbines to serve the load in Case A and Case B respectively.
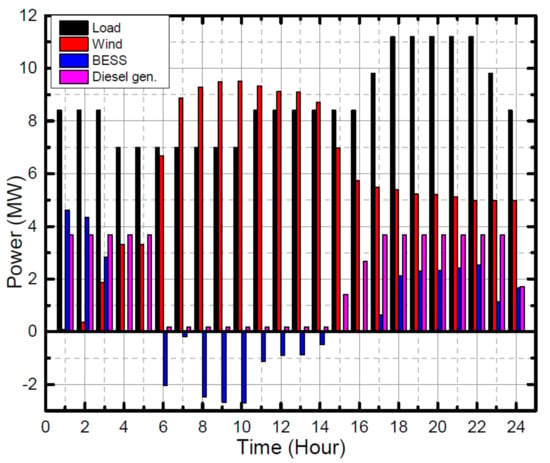
Figure 15.
Microgrid power dispatch in Case A, Scenario 2.
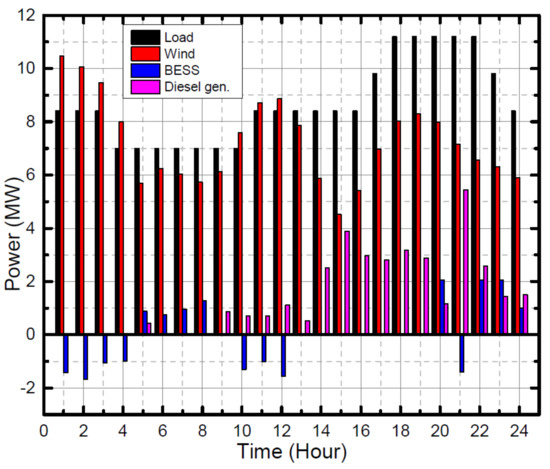
Figure 16.
Microgrid power dispatch in Case B, Scenario 2.
In Figure 15, it is observed that the BESS discharged from the 1st to 5th hour and then from the 15th to 24th hour, dispatching its power during the hours of lower wind power generation. The BESS is discharged up to its maximum allowable level and the generators also operated during high demand period. When there is an abundant power from the wind generation system, the BESS is charged as observed from the 6th to 14th hour. The dispatch by the BESS ensures that its DOD is maintained below 0.9 for most of the operational hours, as shown in Figure 17. In Figure 16, the power dispatch curves for Case B, Scenario 2 is shown. It is seen that the BESS charges during the hours of high wind powers generation. The BESS discharges only during the hours of high demand and when the output of the wind turbine is low, as observed from the 5th to 9th hour and from the 13th to 20th hour. The DOD of Case B, Scenario 1 is shown in Figure 17, the observed values are less than 0.8 for most of its operating hours. In case of Scenario 2, Case B (Figure 18), a high DOD is observed that is similar to the conditions observed for case B in Scenario 1, this shows an improved performance and condition of the BESS. Conclusively, the BESS is not over drained during its operation.
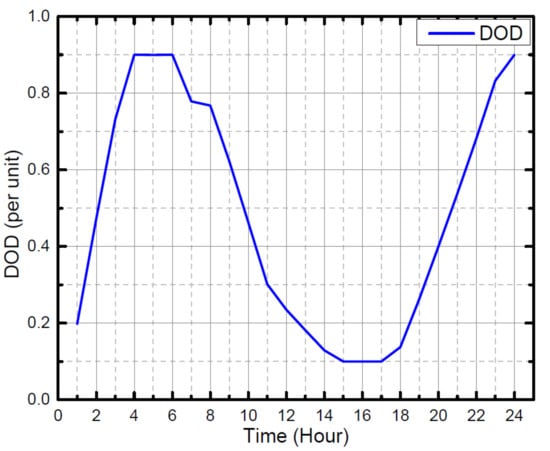
Figure 17.
DOD of BESS in Case A, Scenario 2.
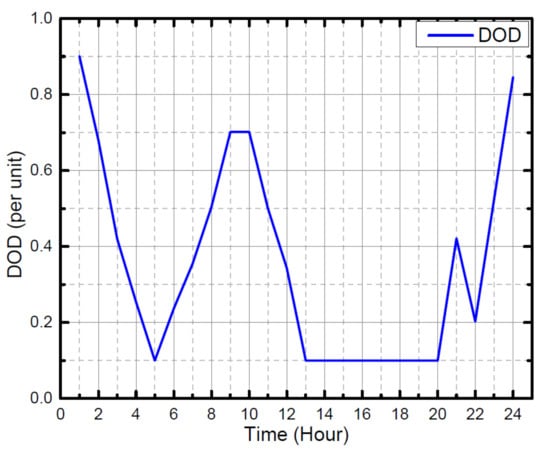
Figure 18.
DOD of BESS in Case B, Scenario 2.
Table 3 shows the summary of the costs obtained in all the scenarios. It should be noted that the daily schedule cost for the microgrid is cheaper for Scenario 2 than in Scenario 1 and Case B is the cheapest. Additionally, the daily schedule costs of BESS is higher in Scenario 2 than in Scenario 1 for both the cases. However, the high values of in Scenario 2 resort to a cheaper cost of electricity, and case B of both Scenario 1 and 2 are the cheapest as reported in Table 3. This table also shows the for both cases of the two scenarios. Observably, case B of Scenario 2 has the lowest PLP at 0.0306 followed by case A of Scenario 2 with a PLP of 0.0329, then Scenario 1 (case B) with a PLP of 0.042, and finally Scenario 1 (case A) has the highest PLP. The implication of this analysis is that, Scenario 2 is more reliable in terms of power generation failure in comparison to Scenario 1. Additionally, the fact that the obtained in Case B is lower than that of Case A indicates an abundance of back-up power support from diesel generator in Case B, which boost the reliability of the MG. It is important to mention that the cost computed in Table 3 are formulated based on some assumed parameters and data sets. Hence, they do not reflect the practical cost value but are aptly used to present the comparative analysis between the test scenarios in this study.

Table 3.
Schedule cost for all scenarios.
In Table 4 and Table 5, the operational results of both the scenarios are presented respectively. It is observed that the number of cycles of BESS at a particular DOD () decreases with increased wind power and demand variations. This is because the BESS charges when the wind power is greater than the demand. For instance, this trend is observable from the 7th to 14th hour in case A of Scenario 1 (Table 4). A similar observation is seen in Scenario 2 (Table 5) from the 8th to 14th hour for case A.

Table 4.
Scheduling results for Case A and Case B in Scenario 1.

Table 5.
Scheduling results for Case A and Case B in Scenario 2.
The BESS-SOC of all the scenarios are depicted in Figure 19. It can be observed that the SOC is high during the early hours, i.e., between the 3rd and 8th hour for Case B in both the Scenarios, in comparison to Case A of both the scenarios. These variations reflect the operation of BESS during the output power fluctuation of the wind power generation system. Moreover, the SOC changes with the demand. In Scenario 1, the SOC decreases for both the cases as the demand increases between the 17th to 24th hour, this is because the microgrid in Scenario 1 is grid-connected and the imported power into the MG is restricted to 5 MW. Therefore, BESS has to supply the remaining power to satisfy the power balance condition. However, for both the cases of Scenario 2 the SOCs are fairly high that is observed from the 17th to 22nd hour because the MG in Scenario 2 has three backup generators to serve the load and hence provide a good support to the BESS operation.
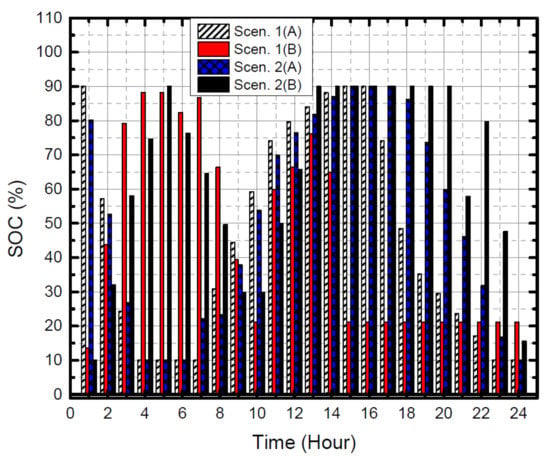
Figure 19.
SOC of BESS in all Scenarios.
7. Conclusions
In this paper, a dynamic programming framework for optimal operation of battery energy storage system considering its DOD for two cases of grid-connected and stand-alone MGs is presented. The study computes the daily schedule cost of the MG, the daily cost of operation of the BESS, and the cost of electricity under the assumed load profile. Furthermore, the DOD, state-of-charge, and the operational dispatch of the BESS and all MG components are presented for the test scenarios. Based on the reliability analysis of each scenario and values of power loss probabilities recorded in all the of the cases, the study postulates that Scenario 2 is potentially more reliable than Scenario 1. Moreover, Case B is more reliable than Case A for both Scenarios. Moreover, Scenario 2 is cheaper in terms of daily schedule cost and electricity cost. The efficacies of stand-alone MG supported by DGs and grid-connected MG were demonstrated using computer numerical simulations and a brief comparison is presented.
Author Contributions
Authors’ contribution are as follows: Conceptualization, U.S. and M.K.; Data curation, U.S. and F.A.; Formal analysis, U.S., K.K. and F.A.; Funding acquisition, F.A. and M.K.; Investigation, U.S., K.K. and M.K.; Methodology, U.S., K.K. and Fahad Alismail; Project administration, F.A. and M.K.; Resources, K.K., F.A. and M.K.; Software, U.S. and F.A.; Supervision, F.A. and M.K.; Validation, U.S., K.K. and M.K.; Visualization, K.K., F.A. and M.K.; Writing—original draft, U.S., K.K. and F.A.; Writing—review & editing, K.K. and M.K. All authors have read and agreed to the published version of the manuscript.
Funding
This project was funded by Deanship of Research (DSR) at King Fahd University of Petroleum & Minerals (KFUPM) through project No. DF201005.
Institutional Review Board Statement
Not applicable.
Informed Consent Statement
Not applicable.
Acknowledgments
The authors would like to acknowledge the support provided by the Deanship of Research (DSR) at King Fahd University of Petroleum & Minerals (KFUPM) for funding this work through project No. DF201005. The authors would also like to acknowledge the funding support provided by the King Abdullah City for Atomic and Renewable Energy (K.A.CARE).
Conflicts of Interest
The authors declare no conflict of interest.
Abbreviations
The following abbreviations are used in this manuscript:
| Area swept by the rotor of wind turbine, m | |
| Fuel cost coefficients for generation unit i | |
| Emission cost coefficients for generation unit i | |
| Battery energy storage system | |
| Cost of electricity, $/MWh | |
| Cost function of battery energy storage system | |
| Total operating cost of diesel generation units, $/MWh | |
| Daily cost of wind power dissipation, $/MWh | |
| Cost of power exchanged, $/MWh | |
| Capital recovery cost, $ | |
| Daily cost of battery energy storage system, $ | |
| Diesel generator | |
| Power generated by diesel generation unit i, MW | |
| Cost of distributed generators, $ | |
| Daily schedule cost of the microgrid, $ | |
| Depth of discharge of energy storage system, MWh | |
| Depth of discharge of battery energy storage system, MWh | |
| Battery energy | |
| Maximum rated energy of battery, MWh | |
| Total capacity of battery energy storage system, MWh | |
| Emission cost, $/MWh | |
| Energy storage system | |
| Cost of exchanged power, $/MWh | |
| Degradation cost of battery energy storage system, $/MWh | |
| Charging efficiency of battery | |
| Discharging efficiency of battery | |
| Fuel cost, $MWh | |
| I | Set of generation units |
| Investment cost of battery energy storage system, $/MW | |
| Initial investment of installed wind turbine, $ | |
| Interest rate | |
| J | Overall Operational cost, $/MWh |
| Power coefficient of the wind turbine | |
| Lifetime of the project, | |
| Yearly maintenance cost, $/MWh | |
| Microgrid | |
| Number of cycles of energy storage at a particular DOD | |
| Power loss probability | |
| Battery power, MW | |
| Battery energy, MWh | |
| Load power demand, MW | |
| Grid power, MW | |
| Output power of the generation unit im MW | |
| Wind power output, MW | |
| Battery power, MW | |
| Maximum rated power of battery, MW | |
| Maximum capacity of the transmission line, MVA | |
| Renewable energy sources | |
| Air density, kg/m | |
| State-of-charge of energy storage system. MWh | |
| State-of-charge of battery energy storage system, MWh | |
| Uninterrupted power supply | |
| v | Wind speed, m/s |
References
- Nguyen, T.T.; Pham, L.H.; Mohammadi, F.; Kien, L.C. Optimal scheduling of large-scale wind-hydro-thermal systems with fixed-head short-term model. Appl. Sci. 2020, 10, 2964. [Google Scholar] [CrossRef]
- Aguado, R.; Vera, D.; López-García, D.A.; Torreglosa, J.P.; Jurado, F. Techno-Economic assessment of a gasification plant for distributed cogeneration in the agrifood sector. Appl. Sci. 2021, 11, 660. [Google Scholar] [CrossRef]
- Dinh, B.H.; Pham, T.V.; Nguyen, T.T.; Sava, G.N.; Duong, M.Q. An effective method for minimizing electric generation costs of thermal systems with complex constraints and large scale. Appl. Sci. 2020, 10, 3507. [Google Scholar] [CrossRef]
- Ebeed, M.; Alhejji, A.; Kamel, S.; Jurado, F. Solving the optimal reactive power dispatch using marine predators algorithm considering the uncertainties in load and wind-solar generation systems. Energies 2020, 13, 4316. [Google Scholar] [CrossRef]
- Salman, U.T.; Al-Ismail, F.S.; Khalid, M. Optimal Sizing of Battery Energy Storage for Grid-Connected and Isolated Wind-Penetrated Microgrid. IEEE Access 2020, 8, 91129–91138. [Google Scholar] [CrossRef]
- Abdollahi, A.; Ghadimi, A.A.; Miveh, M.R.; Mohammadi, F.; Jurado, F. Optimal power flow incorporating FACTS devices and stochastic wind power generation using krill herd algorithm. Electronics 2020, 9, 1043. [Google Scholar] [CrossRef]
- Ma, G.; Cai, Z.; Xie, P.; Liu, P.; Xiang, S.; Sun, Y.; Guo, C.; Dai, G. A bi-level capacity optimization of an isolated microgrid with load demand management considering load and renewable generation uncertainties. IEEE Access 2019, 7, 83074–83087. [Google Scholar] [CrossRef]
- REN21. Renewables 2019 Global Status Report; REN21 Secretariat: Paris, France, 2019. [Google Scholar]
- Ding, Z.; Lee, W.J. A stochastic microgrid operation scheme to balance between system reliability and greenhouse gas emission. IEEE Trans. Ind. Appl. 2015, 52, 1157–1166. [Google Scholar]
- Imran, R.M.; Wang, S. Enhanced two-stage hierarchical control for a dual mode WECS-based microgrid. Energies 2018, 11, 1270. [Google Scholar] [CrossRef]
- Shojaei, A.H.; Ghadimi, A.A.; Miveh, M.R.; Mohammadi, F.; Jurado, F. Multi-objective optimal reactive power planning under load demand and wind power generation uncertainties using ε-constraint method. Appl. Sci. 2020, 10, 2859. [Google Scholar] [CrossRef]
- Zahoor, S.; Javaid, S.; Javaid, N.; Ashraf, M.; Ishmanov, F.; Afzal, M.K. Cloud–fog–based smart grid model for efficient resource management. Sustainability 2018, 10, 2079. [Google Scholar] [CrossRef]
- Salman, U.T.; Abdulgalil, M.A.; Wasiu, O.S.; Khalid, M. Energy Management Strategy Considering Battery Efficiency for Grid-Tied Microgrids During Summer in the Kingdom of Saudi Arabia. In Proceedings of the 2019 8th International Conference on Renewable Energy Research and Applications (ICRERA), Brasov, Romania, 3–6 November 2019; pp. 422–427. [Google Scholar]
- Shahab, M.; Wang, S.; Junejo, A.K. Improved control strategy for three-phase microgrid management with electric vehicles using multi objective optimization algorithm. Energies 2021, 14, 1146. [Google Scholar] [CrossRef]
- Mohammadi, F.; Nazri, G.A.; Saif, M. A bidirectional power charging control strategy for plug-in hybrid electric vehicles. Sustainability 2019, 11, 4317. [Google Scholar] [CrossRef]
- Community Microgrids: Building Sustainability and Resilience Online Kernel Description. Available online: http://localcleanenergy.org/20180510Microgrids (accessed on 11 February 2020).
- Khan, K.A.; Khalid, M. Improving the transient response of hybrid energy storage system for voltage stability in DC microgrids using an autonomous control strategy. IEEE Access 2021, 9, 10460–10472. [Google Scholar] [CrossRef]
- Darmansyah; Robandi, I. Photovoltaic parameter estimation using Grey Wolf Optimization. In Proceedings of the 2017 3rd International Conference on Control, Automation and Robotics (ICCAR), Nagoya, Japan, 24–26 April 2017. [Google Scholar]
- Parhizi, S.; Lotfi, H.; Khodaei, A.; Bahramirad, S. State of the art in research on microgrids: A review. IEEE Access 2015, 3, 890–925. [Google Scholar] [CrossRef]
- Ghiassi-Farrokhfal, Y.; Rosenberg, C.; Keshav, S.; Adjaho, M. Joint Optimal Design and Operation of Hybrid Energy Storage Systems. IEEE J. Sel. Areas Commun. 2016, 34, 639–650. [Google Scholar] [CrossRef]
- Khalid, M. A review on the selected applications of battery-supercapacitor hybrid energy storage systems for microgrids. Energies 2019, 12, 4559. [Google Scholar] [CrossRef]
- Akhil, A.A.; Huff, G.; Currier, A.B.; Kaun, B.C.; Rastler, D.M.; Chen, S.B.; Cotter, A.L.; Bradshaw, D.T.; Gauntlett, W.D. Electricity Storage Handbook in Collaboration with NRECA; Sandia National Laboratories (SNL-NM): Albuquerque, NM, USA, 2013. [Google Scholar]
- Khan, K.A.; Khalid, M. Hybrid energy storage system for voltage stability in a DC microgrid using a modified control strategy. In Proceedings of the IEEE Innovative Smart Grid Technologies-Asia (ISGT Asia), Chengdu, China, 21–24 May 2019; pp. 2760–2765. [Google Scholar]
- Dunn, B.; Kamath, H.; Tarascon, J.M. Electrical Energy Storage for the Grid: A Battery of Choices. Science 2011, 334, 928–935. [Google Scholar] [CrossRef] [PubMed]
- Zhang, Y.; Wang, J.; Berizzi, A.; Cao, X. Life cycle planning of battery energy storage system in off-grid wind–solar–diesel microgrid. IET Gener. Transm. Distrib. 2018, 12, 4451–4461. [Google Scholar] [CrossRef]
- Bukar, A.L.; Tan, C.W.; Lau, K.Y. Optimal sizing of an autonomous photovoltaic/wind/battery /diesel generator microgrid using grasshopper optimization algorithm. Sol. Energy 2019, 188, 685–696. [Google Scholar] [CrossRef]
- Hesaroor, K.; Das, D. Optimal sizing of energy storage system in islanded microgrid using incremental cost approach. J. Energy Storage 2019, 24, 100768. [Google Scholar] [CrossRef]
- Sufyan, M.; Abd Rahim, N.; Tan, C.; Muhammad, M.A.; Sheikh Raihan, S.R. Optimal sizing and energy scheduling of isolated microgrid considering the battery lifetime degradation. PLoS ONE 2019, 14, e0211642. [Google Scholar] [CrossRef] [PubMed]
- Akram, U.; Khalid, M.; Shafiq, S. Optimal sizing of a wind/solar/battery hybrid grid-connected microgrid system. IET Renew. Power Gener. 2017, 12, 72–80. [Google Scholar] [CrossRef]
- Pham, M.; Tran, T.Q.; Bacha, S.; Hably, A.; An, L.N. Optimal sizing of battery energy storage system for an islaned microgrid. In Proceedings of the 44th Annual Conference of the IEEE Industrial Electronics Society (IECON), Washington, DC, USA, 21–23 October 2018; pp. 1899–1903. [Google Scholar]
- Broumi, S.; Dey, A.; Talea, M.; Bakali, A.; Smarandache, F.; Nagarajan, D.; Lathamaheswari, M.; Kumar, R. Shortest path problem using Bellman algorithm under neutrosophic environment. Complex Intell. Syst. 2019, 5, 409–416. [Google Scholar] [CrossRef]
- Berrueta, A.; Heck, M.; Jantsch, M.; Ursúa, A.; Sanchis, P. Combined dynamic programming and region-elimination technique algorithm for optimal sizing and management of lithium-ion batteries for photovoltaic plants. Appl. Energy 2018, 228, 1–11. [Google Scholar] [CrossRef]
- Hanumaiah, N.; Ravi, B. Rapid tooling form accuracy estimation using region elimination adaptive search based sampling technique. Rapid Prototyp. J. 2007, 13, 182–190. [Google Scholar] [CrossRef]
- Raza, S.; Mokhlis, H.; Arof, H.; Laghari, J.; Mohamad, H. A sensitivity analysis of different power system parameters on islanding detection. IEEE Trans. Sustain. Energy 2015, 7, 461–470. [Google Scholar] [CrossRef]
- Nguyen, T.A.; Crow, M.L.; Elmore, A.C. Optimal sizing of a vanadium redox battery system for microgrid systems. IEEE Trans. Sustain. Energy 2015, 6, 729–737. [Google Scholar] [CrossRef]
- Liu, Y.; Wu, X.; Du, J.; Song, Z.; Wu, G. Optimal sizing of a wind-energy storage system considering battery life. Renew. Energy 2020, 147, 2470–2483. [Google Scholar] [CrossRef]
- Sukumar, S.; Mokhlis, H.; Mekhilef, S.; Naidu, K.; Karimi, M. Mix-mode energy management strategy and battery sizing for economic operation of grid-tied microgrid. Energy 2017, 118, 1322–1333. [Google Scholar] [CrossRef]
- Nemati, M.; Braun, M.; Tenbohlen, S. Optimization of unit commitment and economic dispatch in microgrids based on genetic algorithm and mixed integer linear programming. Appl. Energy 2018, 210, 944–963. [Google Scholar] [CrossRef]
- Olaszi, B.D.; Ladanyi, J. Comparison of different discharge strategies of grid-connected residential PV systems with energy storage in perspective of optimal battery energy storage system sizing. Renew. Sustain. Energy Rev. 2017, 75, 710–718. [Google Scholar] [CrossRef]
- Barsali, S.; Giglioli, R.; Lutzemberger, G.; Poli, D.; Valenti, G. Optimised operation of storage systems integrated with MV photovoltaic plants, considering the impact on the battery lifetime. J. Energy Storage 2017, 12, 178–185. [Google Scholar] [CrossRef]
- Bahramirad, S.; Reder, W.; Khodaei, A. Reliability-constrained optimal sizing of energy storage system in a microgrid. IEEE Trans. Smart Grid 2012, 3, 2056–2062. [Google Scholar] [CrossRef]
- Shafiqur, R.; Umar, T.; Salman, L.M.A. Wind Farm-Battery Energy Storage Assessment in Grid-Connected Microgrids. Energy Eng. 2020, 117, 343–365. [Google Scholar] [CrossRef]
- Soroudi, A. Power System Optimization Modeling in GAMS; Springer: Cham, Switzerland, 2017. [Google Scholar]
- Torreglosa, J.P.; Garcia, P.; Fernandez, L.M.; Jurado, F. Predictive control for the energy management of a fuel-cell–battery–supercapacitor tramway. IEEE Trans. Ind. Informatics 2013, 10, 276–285. [Google Scholar] [CrossRef]
- Khorramdel, H.; Aghaei, J.; Khorramdel, B.; Siano, P. Optimal battery sizing in microgrids using probabilistic unit commitment. IEEE Trans. Ind. Informatics 2015, 12, 834–843. [Google Scholar] [CrossRef]
- Rosenkranz, C. Plug in hybrid batteries. In 20th International Electric Vehicle Symposium and Exhibition (EVS20); Electric Drive Transportation Association: Long Beach, CA, USA, 2003. [Google Scholar]
- Han, S.; Han, S.; Aki, H. A practical battery wear model for electric vehicle charging applications. Appl. Energy 2014, 113, 1100–1108. [Google Scholar] [CrossRef]
- Electricity Consumption by Sectors. Online Kernel Description. Available online: https://datasource.kapsarc.org/explore/dataset/electricity-consumption-by-sectors/information/?disjunctive.region&disjunctive.type_of_consumption (accessed on 23 November 2019).
- Mohamed, F.A.; Koivo, H.N. Online management genetic algorithms of microgrid for residential application. Energy Convers. Manag. 2012, 64, 562–568. [Google Scholar] [CrossRef]
- Ju, C.; Wang, P.; Goel, L.; Xu, Y. A two-layer energy management system for microgrids with hybrid energy storage considering degradation costs. IEEE Trans. Smart Grid 2017, 9, 6047–6057. [Google Scholar] [CrossRef]
- Ayop, R.; Isa, N.M.; Tan, C.W. Components sizing of photovoltaic stand-alone system based on loss of power supply probability. Renew. Sustain. Energy Rev. 2018, 81, 2731–2743. [Google Scholar] [CrossRef]
- Ragheb, M.; Ragheb, A.M. Wind turbines theory-the betz equation and optimal rotor tip speed ratio. Fundam. Adv. Top. Wind. Power 2011, 1, 19–38. [Google Scholar]
- Rafique, M.; Rehman, S.; Alam, M.; Alhems, L. Feasibility of a 100 MW installed capacity wind farm for different climatic conditions. Energies 2018, 11, 2147. [Google Scholar] [CrossRef]
- Dragomirescu, A. Performance assessment of a small wind turbine with crossflow runner by numerical simulations. Renew. Energy 2011, 36, 957–965. [Google Scholar] [CrossRef]
Publisher’s Note: MDPI stays neutral with regard to jurisdictional claims in published maps and institutional affiliations. |
© 2021 by the authors. Licensee MDPI, Basel, Switzerland. This article is an open access article distributed under the terms and conditions of the Creative Commons Attribution (CC BY) license (https://creativecommons.org/licenses/by/4.0/).