
Residential Location and Travel in the Reykjavik Capital Region
by
 , and
, and
Petter Næss
1,* ,
,
Harpa Stefansdottir
1,
Sebastian Peters
1,
Michał Czepkiewicz
2 and
Jukka Heinonen
3
1
Department of Urban and Regional Planning, Norwegian University of Life Sciences, 1432 Ås, Norway
2
Faculty of Sociology, Adam Mickiewicz University in Poznań, 61-712 Poznań, Poland
3
Faculty of Civil and Environmental Engineering, University of Iceland, 102 Reykjavik, Iceland
*
Author to whom correspondence should be addressed.
Sustainability 2021, 13(12), 6714; https://doi.org/10.3390/su13126714
Submission received: 30 April 2021
/
Revised: 18 May 2021
/
Accepted: 18 May 2021
/
Published: 13 June 2021
(This article belongs to the Special Issue Transition towards Sustainable Urban Settlements)
Abstract
:This article presents findings from a mixed-methods study on residential location and travel in the Reykjavik capital region, Iceland, drawing on a combination of a tailor-made questionnaire survey and in-depth qualitative interviews, including cross-sectional and before–after analyses. A residential location close to the main city center of Reykjavik contributes to shorter travel distances and lower shares of car travel. The effect of proximity to the city center is particularly strong for commuting but exists for non-work travel and overall car-driving distances too. There are also effects of proximity to a main second-order center and local centers and of local-area population density, but these effects apply to fewer aspects of travel. The rationales for location of activities and travel mode choice identified in the qualitative interviews explain why travel distances and modes tend to depend more on proximity to the main city center than on neighborhood-scale built environment characteristics. The main patterns found in the Reykjavik area are in line with findings in several earlier studies in the Nordic countries and elsewhere. However, through its methodological approach, the investigation adds to the few studies on the topic where results are underpinned by combined qualitative and quantitative methods and inclusion of before–after analyses.
Keywords:
residential location; travel; mixed-methods; quantitative; qualitative; before–after; Reykjavik1. Introduction
1.1. Background and Research Questions
The purpose of this study was to provide evidence from a mixed-methods study of the influence of residential location and neighborhood characteristics on travel in a medium-sized Nordic city, thus adding to the small number of studies that have combined quantitative and qualitative methods within this field of research.
Transportation is the main cause of air pollution and noise in cities and accounts for nearly a quarter of Europe’s greenhouse gas emissions. Whereas greenhouse gas emissions from other European sectors have decreased substantially since 1990, those from the transportation sector were 20% higher in 2014 than in 1990. Road transportation accounted for almost three fourths of both the greenhouse gas emissions and energy use for transportation in Europe. For surface transport, road transportation accounted for 98.5% of the greenhouse gas emissions and 97% of the energy use [1]. In addition, the construction of transport infrastructure represents encroachments on natural areas, farmland, and built environments, resulting in substantial losses in biodiversity, food production capacity, heritage buildings, landscape quality, and outdoor recreation areas [2,3,4,5]. Highway construction also entails disturbances to wildlife and ecosystems in surrounding areas.
Transportation thus represents huge sustainability challenges, and calls for sustainable transportation [6,7] and sustainable mobility [8,9,10] have resounded for several decades. In a seminal article, Banister advocated for a new, sustainable mobility paradigm involving four main strategies: reducing the need for making trips (e.g., through internet-based communication), a modal shift to environmentally friendlier modes of transportation, reducing the movement of persons and goods, and making each separate mode of transportation more efficient [10]. Land use planning in cities and metropolitan areas can particularly contribute to the second and third of these strategies by providing a high population base close to transit lines and proximity between potential trip origins and destinations. The latter also increases the share of trips that can be made within acceptable walking or biking distance. Urban land use planning can also increase the capacity utilization of public transit, thus contributing to the fourth of Banister’s sustainable mobility strategies.
We use the term “built environment” as a concept encompassing the geographical distribution, fabric and design of the building stock, the location of different functions (such as residences, workplaces, public institutions, and services) relative to each other within the building stock, and the transport infrastructure system (road/street network, public transport infrastructure, and parking conditions). Most of the literature on the influences of built environment characteristics on travel is strongly dominated by purely quantitative studies, often employing advanced statistical methods but rarely with explicit reflection on the nature of causal influences underlying observed statistical patterns. Potential factors of influence rather seem to be included in the statistical analyses, based on previously found statistical associations, or in response to fashionable planning agendas such as new urbanism or transit-oriented development. With a few exceptions [11,12], the underlying fundamentals of the models, i.e., the mechanisms of causal influences, are rarely discussed. In our view, a lack of such theoretical and qualitative understanding is presently the Achilles’ heel of mainstream research on built environment influences on travel. It can lead to model specification error [13] in statistical analyses, such as the omission of relevant causal variables and/or the inclusion of irrelevant control variables. While the growing interest for longitudinal studies is promising, quantitative before-and-after studies still do not remove the need for theoretical understanding and qualitative evidence about causal mechanisms and processes. This study has applied a combination of qualitative and quantitative research methods to capture the complex ways in which built environment characteristics influence travel in interplay with time-geographical constraints and the backgrounds, motivations, and justifications that individuals draw on when making travel-relevant decisions about participation in activities, location of activities, and travel modes [14]. It also includes a before–after investigation of changes in travel behavior among recent movers.
The combination of qualitative and quantitative methods in a longitudinal research design is very rare in social science studies generally [15], and it is definitely uncommon within studies of the built environment and travel. For example, among 38 paper submissions since 2017 on the influences of the built environment on travel reviewed by one of the authors of this article, only one combined quantitative and qualitative methods. The remaining 37 submissions were based solely on quantitative data, and 32 of them were based on cross-sectional analyses only.
In the international research, the location of the residence relative to the main city center and lower-order centers as well as local built environment characteristics such as density, land use mix, distance to transit, etc. have been identified as important factors influencing daily-life travel of individuals and households (for reviews see [16,17,18,19,20,21]; see also [22,23,24,25]). Although studies on the interaction between residential built environment characteristics and travel differ in geographic scale, much attention has been directed to studying such characteristics framed in a scheme of d-variables: density, diversity, street design, distance to transit, and destination accessibility [16]. This framing tends to direct research interest toward local-scale rather than city- or metropolitan-scale built environment characteristics. This also applies to concepts such as the 15-minute city [26], the 15-minute neighborhood [27], the 20-minute city [28], and new urbanism [29], which have inspired planners and policy-makers in Europe, North America, and China. However, neighborhood-scale built environment characteristics are influenced by the location of the neighborhood within the urban structure [30,31]. Therefore, the location of the residence relative to the main center of the city or metropolitan area has most often been found to exert the strongest influence on vehicle kilometers traveled [16,17] (except in studies including only local-area variables, and thus failing to take the location of the investigated neighborhoods into consideration). The few studies conducted so far including qualitative interviews have shown how residents’ motivations and rationales for activity location and travel mode choice can help explain why metropolitan-scale built environment characteristics tend to exert stronger influences than neighborhood-scale characteristics on travel behavior [14,32].
Given this background, this study aimed to answer the following research questions:
- Which associations exist between residential built environment characteristics and travel for commuting, selected non-work purposes, and overall car-driving distance among respondents in the Reykjavik region?
- Through which causal mechanisms do residential built environment characteristics in the Reykjavik region influence travel distances and modes?
1.2. Theoretical Approach
A basic assumption of this study was that built environment characteristics have the capacity to exert causal influences on human actions such as travel [12,33,34]. These influences are not of a deterministic nature. The causal influences of built environment characteristics are always only contributory, since many other circumstances also influence individuals’ decisions about whether, where, and how to travel. The ensuing patterns of travel are a result of people’s resources, needs, and wishes, modified by the constraints and opportunities given by the built environment as well as several other structural conditions of society. Philosophically, our study is inspired by the position known as critical realism [35,36]. Critical realism acknowledges human agents and social structures as well as the natural environment as capable initiators of mechanisms that may (or may not) result in empirical events, depending on the context-dependent combination of the multitude of causal mechanisms always at work except under closed experimental conditions.
The location of the residence relative to various centers and facilities, combined with the transport infrastructure on relevant stretches, determines how accessible these centers and facilities are from the residence. As mentioned earlier, densities tend, for economic and cultural reasons, to be higher at central than at peripheral locations [30,31]. The central parts of a city or metropolitan area usually also have a wider range of specialized services and a higher concentration of jobs, stores, and other facilities than the outer parts because of agglomeration benefits and since facilities requiring a large population base tend to locate themselves in areas easily accessible for a large a catchment of users [37]. The location of a neighborhood relative to the city center (and to some extent also to lower-order centers) therefore influences neighborhood densities and other neighborhood-scale built environment characteristics depending on density levels, including the frequency of departures of public transit and walking distances to stops (Figure 1).
Since most commuting trips and many other daily-life trips in modern cities have destinations outside the confines of the residential neighborhood [22,38], overall travel distances are likely to depend more on the location of the residence relative to main clusters of potential trip destinations than on internal characteristics of the residential neighborhood. The density and other local built environment characteristics still influence the population base for transit, how easy it is to have a car, and hence how easily or inconveniently an address can be reached by different travel modes [39], as well as the provision of local service facilities. The physical design and esthetic appearance of neighborhoods also influence which travel modes are, or are not, perceived as “welcome” [40].
People’s transport rationales, i.e., their backgrounds, motivations, and justifications for travel-related actions, play an important role in the causal mechanisms through which residential location influences travel behavior [14,41]. Combined with time-geographical constraints [42] and the accessibility of various facilities, individuals’ transport rationales influence their choices of where to carry out their activities as well as their travel modes for reaching these destinations. As theorized in time-geography, people face three important types of interrelated restrictions when carrying out daily-life activities. Capability constraints are limitations to individuals’ activities due to their biological properties (e.g., need for sleep) and their capability for movement (e.g., the speed of available means of transportation). Coupling constraints are regulations requiring persons, instruments, materials, and signs to be coupled into co-operating groups, for example, the necessity of being present at a workplace. Authority/steering constraints include spatial and temporal restrictions such as the length of working hours and opening hours of stores or kindergartens [42]. Together, the different constraints limit people’s use of time and the spatial dispersal of their activities [43,44,45].
Important in the context of our study, those who need to overcome long distances to reach daily destinations need fast means of transportation, and they may therefore consider themselves as more car-dependent, particularly if they need to carry out several duties within a short time frame, such as picking up children and shopping on the way home from work.
Transport rationales are important when trying to understand why the statistical patterns presented in the literature appear as they do. Rationales for activity location have a bearing particularly on the impacts of polycentric versus monocentric urban structures on overall traveling distances. If people tend to choose local rather than more distant facilities, even if the perceived quality of the latter is higher, living close to a second-order or local center will contribute significantly to reduce traveling distances. If people instead tend to visit higher-quality facilities even if they are located far away from the residence, traveling distances tend to be shorter the closer people live to the urban region’s main concentration of facilities, which is usually the main city center and its closest surroundings. Rationales for travel mode choice are important to understand the extent to which residents living in areas at different distances from relevant trip destinations and with different levels of accessibility by car, transit, and non-motorized modes choose modes of transportation matching these physical conditions or instead choose modes of travel mainly based on ingrained habits and strong predilections for particular ways of traveling.
The influences of the built environment on travel (as well as on other human actions) are mediated through people’s perceptions of this environment (including perceptions of transport infrastructure) [46]. However, such perceptions, although subject-dependent, are not independent of the objects perceived. In the quantitative part of the study, we focused on measurable, physical built environment characteristics. Yet, in the qualitative interviews, it was precisely the perceptions of the interviewees, and their thoughts related to these perceptions, that were in focus.
1.3. Earlier Empirical Studies
Reflecting the fact that neighborhood-scale built environment characteristics are influenced by the location of the neighborhood relative to the main city center and other major centers within a metropolitan area, the present study focused on the influences on travel behavior from residential location relative to the main city center and lower-order centers. Because population densities may vary a good deal within the same distance from the city center and are important for transit provision as well as for the availability of several local service facilities, we also chose to include local-area density among the independent variables of the study. Since the early 1980s, a large number of studies have attempted to identify and estimate the effects of the above-mentioned built environment characteristics on travel behavior.
Regarding residential distance from the city center, numerous studies, mainly in Europe, but also in America, Australia, and Asia, have found that residents living close to the city center travel shorter overall distances and shorter distances by car and make a lower proportion of their travel by car compared to their suburban and exurban counterparts. The geographical cases of most of these studies are predominantly monocentric cities or city regions. Outside the Nordic countries, effects of residential distance to the city center on at least one of the above-mentioned aspects of travel behavior have been found in, among others, London and Paris [47], New York and Melbourne [48], Austin [49], Athens [50], Hangzhou [51], Santiago de Chile [52], the San Francisco bay area [38], and Changchun [53]. In the Nordic countries, such effects have been found in Trondheim and Bergen [54], Oslo [23,54,55,56,57], Frederikshavn [58], Aalborg [59], Copenhagen [22,32,60], Gothenburg [61,62], Helsinki [63], and Stavanger [23,54,55,56,57].
Internationally, studies investigating the influence of residential distance to lower-order centers have often been carried out without controlling for distance to the main city center. In many cases, the focus of such studies has been on walking trips (e.g., [64,65]). Comparatively fewer studies have investigated the effects of residential distance to medium-level (second-order) urban centers on overall travel distances or driving distance. Some such studies (e.g., [32,59,66], all in Danish city regions) show somewhat longer overall travel distance and distance traveled by car as a result of living far from the closest second-order urban center, but these effects are smaller than those of the distance to the main city center. Other studies show no significant effects (e.g., [62], with Swedish urban regions as cases). In a study of the polycentric Greater Oporto area in Portugal, the effect of the distance to the closest retail center was still found to be larger than that of the distance to the main city center [67].
Several international studies have investigated travel behavioral impacts of local-area density. A meta-analysis in 2010 identified nine international studies addressing population densities and six addressing job densities [16]. The effects of population density were found to be on average very modest, whereas job density showed practically no effect. On the other hand, a later study of commuters in the four largest Californian metropolitan areas showed a moderate tendency of higher shares of transit and lower car shares when living in dense neighborhoods [68]. In the Nordic countries, studies in Oslo have shown tendencies of shorter travel distances by car and higher proportions of car travel when living in higher-density areas [23,54,57], and, in an older study, a higher share of travel by public transit [55]. However, studies in Copenhagen [32], Frederikshavn [58], and Oslo [55,69] found no effect of residential neighborhood density on travel distances when accounting for the distance from the residences to the city center.
Apart from studies since 2004 by members of the research team of the present article, all the above-mentioned studies were based solely on quantitative analyses of questionnaire survey data.
2. Materials and Methods
2.1. The Reykjavik Region
The geographical case of the study is the Reykjavik region, which is Iceland’s capital region (called Höfuðborgarsvæðið in Icelandic) and which includes the municipalities of Reykjavík, Kópavogur, Hafnarfjördur, Gardabær, Mosfellsbær, Seltjarnarnes, and Kjósarhreppur. The region has 64% of the national population although its constituent municipalities cover only 1% of Iceland’s land area. Most of the region’s inhabitants live in the more or less continuous urbanized area (the morphological city of Reykjavik capital area, see Figure 2), with 232,000 inhabitants and a population density of 31.8 persons per hectare. The density has increased during recent years, with an average of 2.0% annually over the period of 2015–2020 [70].
Despite the emergence of more polycentric urban regions in certain parts of Europe [71,72], the capitals of the Nordic countries are predominantly monocentric, with a clearly higher concentration of population and jobs in their inner districts. This also applies to the Reykjavik capital region (Figure 3, referring to the entire number of inhabitants and jobs in the urban area). The concentration in the areas closest to the city center is even stronger for commercial and office premises than for population. Among our survey respondents, the number of inhabitants per hectare in their local neighborhoods decreases on average by 1.8 for each kilometer the distance to the main city center increases (beta = −0.56, p = 0.0000); there is also a weak tendency of decreased density with increasing distance from the closest local center (beta = −0.09, p = 0.0012)
Compared to Scandinavian cities of a similar size, Reykjavik still has a less densely developed inner core. The population density of the whole morphological city of Reykjavik capital region (31.8 per hectare) is nevertheless at a level similar to medium-sized Scandinavian cities such as Trondheim (32.5), Bergen (29.7), Stavanger/Sandnes (28.6). and Aarhus (28.5). This reflects that the suburbs of the Reykjavik capital region have a much lower share of single-family houses than in the above-mentioned Norwegian and Danish cities.
While the downtown area of Reykjavik has the highest concentration of offices, stores, and cultural and entertainment facilities and a high proportion of the jobs in general, there are also other important centers, both in the local downtown areas of previously separate towns now included in the conurbation that makes up the morphological city of Reykjavik capital region and in a few sub-centers developed since the late 1980s. An important sub-center in the latter category, Smáralind, is located 5–6 km from the city center of Reykjavik and is planned to grow considerably over the next decades. It could be considered as the upcoming main second-order center of shopping and of offices. Another sub-center, Kringlan, is located only 3 km from the city center and includes a large shopping mall as well as several office buildings and companies.
Figure 4 shows the locations of the main city center of Reykjavik, second-order centers and other centers, as well as the residential locations of interview participants and survey respondents (cf. Section 2.2).
Car ownership is high in Iceland (755 cars per 1000 inhabitants [74], and, in Reykjavik, 707 per 1000 inhabitants [75]), which is nearly one and a half times the EU average and higher than in most cities in Europe. Car ownership rates are almost equally high in the capital region, with only downtown hosting a considerable percentage of carless households [39]. Distinct from similar-sized Nordic cities such as Bergen and Aarhus, the Reykjavik region has no light rail lines (and there are also no ordinary railroad lines connecting Reykjavik with other parts of the country). The transit provision thus consists solely of buses. In 2019, about 74% of all trips in Reykjavik were taken by private car, 5% by bus, 5% by cycling, and 14% by walking [76].
The focus on the private vehicle was a prominent feature of most urban planning documents in the 20th century, which contributed to increased car dependency and urban sprawl and accommodated growing car ownership and use with new road infrastructure [77]. Car-oriented planning also materializes clearly in a generally high provision of parking space, particularly in the two sub-centers developed in the 1980s and onward (Kringlan and Smáralind) but also around newly developed office buildings relatively close to the city center (Figure 5). However, the current Reykjavik city plan 2010–2030 focuses on densification, mixed land use, and sustainable transportation [78]. There are cycling policies in place supporting the expansion of dedicated cycling infrastructure, and a bus rapid transit (BRT) system is planned for a near-term implementation.
Reykjavik has cool summers and relatively mild winters, with daily mean temperatures of 11 °C in July and August and 0 °C in January and February. Snow cover is usually moderate, with an average 2.5 cm of accumulation in December and January, and cycling is therefore normally possible all year round. The city is rather windy, given its location exposed to the North Atlantic Ocean, and weather changes are frequent.
2.2. Research Design and Data
The study drew on a mixed-methods research design combining a questionnaire survey with in-depth qualitative research interviews and careful studies of the geographical contexts of the investigated urban region. So far, this approach has been applied and gradually refined in studies of residential location and travel in the cities/urban regions of Frederikshavn [58], Copenhagen [32], Hangzhou [79], Oporto [67], Oslo and Stavanger [14,23,80], and, most recently, Reykjavik. Contrary to the purely quantitative approach dominating mainstream research on relationships between the built environment and travel, a key strength of this research design is its better ability to show causal mechanisms. The qualitative interviews offer insight into the rationales underlying people’s decisions about residential location choices, participation in activities, location of these activities, and modes of travel. (Rationales for residential location choice are not discussed in the present article, but see earlier articles on the “residential self-selection issue” [19,81,82,83,84])
The quantitative dataset was collected in May 2016 as an online survey distributed by letter invitations to a sample of 10,000 residents of the Reykjavik capital region aged 18 years or older. We ordered the selection from Registers Iceland. The sample was randomized but with a prominence given to newly built areas to capture more recently moved residents than their share of the general population. The sample consisted of 7000 randomly selected inhabitants of the Reykjavik capital region and 3000 inhabitants who had recently (during the last 2 years) moved to their present dwelling. Several recently developed areas were selected for the latter sub-sample. In addition to the respondents from the newly built residential areas, the remaining sample also included several recent movers. We thus obtained a sufficient number of recent movers to enable statistical analyses of changes in travel behavior after moving, in addition to the ordinary cross-sectional analyses. Altogether, we received 1148 completed questionnaires, yielding a response rate of 12.2%. The Appendix A compares key characteristics of the respondents with the general population of the Reykjavik capital region. Since the objective of the quantitative part of this study was not to describe the univariate distribution of travel behavior but to investigate its conditional relationship with built environment characteristics using multivariate analysis, the overrepresentation of certain groups of people in the sample was not expected to substantially affect the results [85].
The survey included questions about addresses of the present and (for recent movers) previous residences and (when relevant) workplace or place of education, sociodemographic characteristics of the respondents, their activity participation and travel behavior within as well as outside the Reykjavik capital region, and residential preferences. The latter questions were included to account for possible attitude-based residential self-selection bias [19]. With a few exceptions, the questionnaire was identical to the one used in a recent study in Norway, described in detail in [23]. Frequencies of trips by different travel modes were self-reported for non-work travel as well as commuting. Respondents’ answers about travel mode frequencies were transformed by recoding the original frequency values (not at all, less than 1 day a month, 1–3 days a month, one day a week, 2–3 days a week, and 4 or more days a week) into the following number of times per month: 0, 0.5, 2, 4.33, 10.83, and 21.66, respectively. For each respondent, a set of built environment characteristics was calculated using geographical information systems (GIS) and residential and workplace locations reported in the survey. The definition of centers refers to the centers shown in land use plans of the municipalities included in the Reykjavik capital region. Downtown Reykjavik is clearly the dominant center, whereas the Smaralind second-order center is pointed out in current plans as a major site for new construction and hence was defined as a second-order center in our analyses. The Kringlan second-order center is located only 3 km from the main city center of Reykjavik; in order to avoid multicollinearity problems, we did not include residential distance to Kringlan among the variables of the multivariate analyses. The distances from dwelling to the main city center, to the Smáralind second-order center, to the closest local center, and to the work- or study place (i.e., commuting distance) were calculated using the shortest path algorithm in the Network Analyst toolbox in ArcGIS Desktop 10. In addition, we calculated the population density within a 1 km2 circle around the dwelling of each respondent. Self-reported weekly travel distances for seven intra-metropolitan non-work purposes were also analyzed using charts. The non-work purposes were: shopping in a grocery store, and visits to places for exercise, places for picking up or dropping off a passenger, restaurants or cafés, places for entertainment/culture, civic or religious buildings, and service providers. The original values for distances from home to non-work activities (activity not relevant, less than 1 km, 1–2 km, 2–5 km, 5–10 km, and over 10 km) were recoded into system-missing, 0.5 km, 1 km, 3.5 km, 7.5 km, and 15 km, respectively.
In the multivariate statistical analyses, the following independent variables were included:
- Built environment characteristics: distance from dwelling to the main city center, distance from dwelling to the Smáralind second-order center, distance from dwelling to the closest local center, and local-area population density;
- Demographic characteristics: gender, age, number of household members younger than 7 years, number of household members aged 7–17, and number of household members 18 years or older;
- Socioeconomic characteristics: education level, workforce participation, personal income level, driver’s license for a car;
- Residential preferences for the following characteristics of the dwelling: nice view from the dwelling, proximity to green areas, undisturbed location, low housing costs, proximity to relatives and friends, proximity to workplace, proximity to a grocery store, proximity to a bus stop, private garden, high architectural and esthetic quality, familiar neighborhood, good school/kindergarten in the neighborhood, no social problems in the neighborhood, favorable investment object, easy access to shopping mall, not close to a major road, good opportunities for physical exercise, and proximity to the city center.
We did not include car ownership as a control variable since studies in several cities have demonstrated that car ownership is itself considerably influenced by built environment characteristics [81,86,87]. Our data show that this is also the case in the Reykjavik capital region.
The multivariate analyses were conducted using the generalized linear models (GENLIN) procedure. This method of analysis produces robust standard error estimates and, accordingly, also more correct p-values for variables that do not meet homoscedasticity assumptions. Despite the high number of variables, tests for multicollinearity indicate that this does not cause any problem to the regression analyses (with all variables included, no variable had a tolerance level lower than 0.49).
The qualitative material consisted of 13 interviews with survey respondents who had stated their willingness to participate in a follow-up interview. The interviewees were selected with an aim to include different household compositions, housing types, age groups, and residential locations. The number of interviewees was lower than in our earlier mixed-methods studies on residential location and travel. We do not claim that the number was high enough to reach saturated information about all relevant aspects influencing travel behavior. However, the narratives of the purposefully selected interviewees offer valuable insight into their backgrounds, motivations, and justifications for traveling to different destinations within the urban region and for their choices of travel modes. The interviews thus shed light on underlying reasons that could explain geographical aggregate-scale differences in travel behavior evident from the questionnaire data.
Key demographic and socioeconomic characteristics of the interviewees are shown in the Appendix A. The interviews took place in locations selected by interviewees, most often at their homes. The interviews and subsequent interpretation followed the explanatory qualitative research method, which is explained in detail in [88]. A semi-structured interview method was adopted, where the interviewees were only given a short list of topics beforehand. During the interviews they were encouraged to talk freely about the topics. Two interviewers were present at each interview. Each interview lasted for 1–1.5 h and was tape-recorded and transcribed. The interpretation was carried out in a two-step process. First, the transcriptions were used for interpreting answers for each individual interviewee to a set of 45 detailed research sub-questions formulated by the researchers. Second, the individual answers were summarized to an overall interpretation of the interviews regarding a smaller number of topics defined through a grouping of the sub-questions.
3. Results
3.1. Quantitative Patterns
The study provided rich quantitative material showing associations between built environment characteristics and various aspects of travel behavior. First, cross-sectional variations between respondents living in different built environment situations is presented. Thereupon, changes in travel behavior among recent movers is shown.
3.1.1. Cross-Sectional Associations
Geographical Differences in Travel Behavior
Figure 6 and Figure 7 show some of the key differences in travel behavior between respondents living in different distance belts from the city center of Reykjavik. The distance belts were chosen by dividing the respondents into quartiles, depending on their residential distance to the city center of Reykjavik. The quartile distances were then rounded to the closest whole kilometer.
As observed in Figure 6, suburbanites, on average, travel longer distances than inner-city residents do, especially for commuting but also for seven key intra-metropolitan non-work purposes. The center-periphery gradient in weekly travel distance is also clear for each individual non-work travel purpose except picking up or dropping off a passenger.
Moreover, motorized travel distances are considerably longer both for commuting and non-work purposes among suburbanites than among the respondents living close to the city center of Reykjavik. This pattern is particularly clear for car travel, which is the mode covering the longest travel distance among the respondents of all the four distance belts along the center–periphery gradient. However, suburbanites, on average, also travel longer distances by transit than their counterparts living close to the city center of Reykjavik do. Conversely, respondents living in the central parts of the metropolitan area travel longer distances by non-motorized modes than those living far from the city center of Reykjavik do. Given the longer overall travel distances of suburbanites than inner-city dwellers, this translates into substantially higher proportions of distance traveled by non-motorized modes and higher shares of car travel among centrally residing respondents. We also noticed that for intra-metropolitan travel, travel distances were, on average, longer for commuting than for the seven non-work purposes together.
Figure 7 shows that the pattern found for intra-metropolitan car travel persists when also including travel outside the metropolitan area, although the center–periphery gradient is then less steep. Distinct from Figure 6, where car travel included the distances traveled by car drivers as well as car passengers, Figure 7 includes only distances traveled as a car driver, i.e., vehicle kilometers by car. It is evident from Figure 7 that car driving outside the metropolitan does not offset the higher amounts of intra-metropolitan car travel among suburbanites than among inner-city dwellers. Instead, average extra-metropolitan car driving distances of inner-city residents and suburbanites are fairly similar. There is also no compensatory reversed tendency of less car driving on the weekend among respondents living in the parts of the metropolitan area where weekday driving distances are on average long. Instead, driving distances in the weekend follow the same patterns as for weekdays, with longer driving distances the further from the city center the respondents live (yet with a slightly less steep center–periphery gradient on the weekend than for the Monday to Friday period).
Multivariate Analyses
So far, we have only focused on one residential built environment characteristic: the distance from the residence to the main city center of the urban region. As will be shown later, this is indeed a feature of the residential built environment of high importance to travel behavior. But the location of the residence relative to lower-order centers and the density of the residential neighborhood also matter, as do individual characteristics of the respondents and their households. Let us therefore turn to multivariate analyses, where the statistical effects of each separate built environment feature as well as those of the socio-demographic characteristics and residential preferences of the respondents have been calculated.
Because of space constraints, we focus here on only a few aspects of travel behavior: commuting distance, the likelihood of being a regular car commuter, modal share of car travel for trips to grocery stores, and car-driving distance over the whole week. The analyses on which Table 1, Table 2, Table 3, Table 4 and Table 5 are based included all the independent variables mentioned in Section 3. Respondents with extreme commuting distances, overall driving distances, and changes in commuting distance, respectively, were excluded from the analyses on which Table 1, Table 2, Table 4, and Table 5 are based. Apart from the built environment characteristics, which were included in the tables regardless of significance level, only variables whose effects had a significance level below 0.1 were included in the tables.
Table 1 shows, based on a generalized linear model regression with scale linear response variables, associations of built environment, sociodemographic, and residential preference variables with employed respondents’ GIS-measured distance between the home and the workplace.
The distance from the dwelling to the city center of Reykjavik is the only residential built environment characteristic showing a statistically significant effect on respondents’ commuting distances. Controlling for the other investigated variables, respondents living 11 km from the city center of Reykjavik have, on average, a 5 km longer one-way commuting distance than those living only one km from the city center. Neither the distance from the dwelling to the Smáralind second-order center, its distance from the dwelling to the closest local center, nor the population density in the residential neighborhood showed any significant effect on commuting distance.
Three of the socio-demographic variables showed significant effects. These effects were all in line with expectations. Possessing a driver’s license enables workers to seek jobs within a larger radius and thus contributes to longer average commuting distances, whereas families with children 7–17 years in the household often have a tight daily schedule that can discourage long commutes. High income generally enables people to spend more money on travel, but the relationship between income and commuting distance can also reflect that people are willing to commute a longer distance if the job is well-paid. None of the three effects, however, is very strong.
Commuting distances are also associated with several residential preference variables. The strongest of these associations were, not surprisingly, with a preference for residential proximity to the workplace, which indicates that workers who are concerned about avoiding long commuting distance tend to choose residential locations not very far from their workplace (and probably also search for jobs not very far from their dwelling).
Table 2 shows, based on a generalized linear model regression with binary logistic response variables, associations of built environment, sociodemographic, and residential preference variables with employed respondents’ likelihood of being a regular car commuter.
Only one built environment characteristic showed a statistically significant association with the likelihood of being a regular car commuter, defined as commuting by car at least four days during the week. The further away from the city center of Reykjavik the respondents lived, the higher was the likelihood that their travel mode for commuting would be by car. None of the other investigated built environment characteristics appeared to play any role worth mentioning. Among the socio-demographic variables, holding a driver’s license and being a woman were associated with a higher likelihood of commuting by car. The effect of gender may appear surprising but is in line with findings in several other recent studies, possibly reflecting that women, more often than men, drive to bring and pick up children at kindergarten or school as part of their journey to and from work. One residential preference variable stands out with a particularly strong effect on the likelihood of car commuting. Respondents who emphasized proximity to a bus stop as an important feature of their preferred dwelling were, not surprisingly, less prone to use a car as their commuting mode.
Table 3 shows, based on a generalized linear model regression with scale linear response variables, associations of built environment, sociodemographic, and residential preference variables with respondents’ modal share of car travel for trips to grocery stores.
The proportion that car travel makes up of each respondent’s total number of trips to grocery stores tends to increase the further away the respondent lives from the city center of Reykjavik as well as from the closest local center and the lower the population density of the residential neighborhood. Thus, although the effect of the distance to the city center was the strongest, local built environment characteristics also played a role for trips to grocery stores, whereas the residential distance to the city center was the only built environment variable showing significant associations with commuting. A high proportion of car trips when shopping at grocery stores was also, as expected, associated with driver’s license possession and also with being a workforce participant and having a high income. Among the residential preference variables, preference for proximity to a bus stop was especially associated with a low proportion of car trips when visiting grocery stores, reflecting a motivation of these respondents to use public transport.
Table 4 shows, based on a generalized linear model regression with scale linear response variables, associations of built environment, sociodemographic, and residential preference variables with respondents’ average daily car-driving distances during typical whole weeks in the winter and spring (including travel within as well as outside the metropolitan area).
Two built environment characteristics showed statistically significant associations with the respondents’ weekly car-driving distance. A residential location far from the city center of Reykjavik and a long distance from the dwelling to the closest local center were both associated with a long weekly car-driving distance. The effect of distance to the city center was the strongest. As mentioned in Section 1 and Section 2, neighborhood densities tend to be lower the further away from the city center a neighborhood is located. Residents living at the urban fringe therefore also need to travel further than their more centrally residing counterparts to reach their closest local center, since the areas served by each local center are larger in the outskirts because of lower population densities. Residential distance to the city center therefore had some indirect effect on the weekly car-driving distance via distance to the closest local center. Among the socio-demographic characteristics, gender, driver’s license possession, and age show associations with weekly car-driving distances. The effect of gender is particularly strong, where being a woman was associated with shorter weekly car-driving distance. This effect stands in contrast with the effect of gender found for commuting travel mode, where women more often than men tended to be regular car commuters. A few residential preference variables were associated with the car-driving distance. Apart from preference for living close to a bus stop, these effects were rather modest.
3.1.2. Changes after Moving
Figure 8 shows changes in one-way commuting distances among respondents who had moved closer to or farther away from the city center of Reykjavik during the last five years. We saw a clear pattern where respondents who moved more than 2 km closer to the city center reduced their commuting distance by on average 3.8 km, whereas those who moved more than 2 km further away from the city center increased their commuting distance by on average 2.2 km. For respondents who changed their residential distance to the city center only moderately (i.e., by less than 2 km in either direction), there were only marginal changes in the mean commuting distances.
Table 5 shows, based on a generalized linear model regression with scale linear response variables, associations of built environment, sociodemographic, and residential preference variables with changes in commuting distance after having moved to a different residential address during the last five years. The built environment characteristic showing the strongest association with commuting distance was the residential distance from the city center of Reykjavik, where a residential location one kilometer further away from the city center was associated with an average increase in commuting distance of 0.34 km. This effect is somewhat smaller than the effect found in the cross-sectional analysis (cf. Table 1), where the corresponding increase in commuting distance was just below 0.5 km. This difference may indicate that some respondents who work at suburban workplaces have moved outward to get closer to their jobs, thus counteracting the dominant pattern. In addition to the distance to the city center, we also saw an effect of change in the residential distance to the Smáralind second-order center. Neither local-area density nor residential distance to the closest local center showed any statistically significant effect.
Table 6 shows, based on a generalized linear model regression with logistic binary response variables, associations of built environment variables with a likelihood of increasing the amount of travel totally and by different modes because of moving. Like in Table 5 and Figure 8, the analysis includes only respondents who had moved to their present dwelling less than five years ago. The changes in travel behavior included only those that the respondents stated were caused by the change in place of residence. Again, residential distance to the city center was the built environmental variable showing the strongest effects. Moving further away from the city center was associated with a higher amount of travel in total as well as by car and transit and a lower amount of non-motorized travel. Moving further away from the Smáralind second-order center was associated with a higher amount of travel totally and by car. Finally, we saw a weak and somewhat uncertain increase in the amount of car travel when moving further away from the closest local center.
3.2. Qualitative Insight
As mentioned in Section 2, people’s transport rationales play an important role in explaining causal mechanisms through which residential location influences travel behavior. This section presents and discusses the concrete statements of the interviewees about their choices of activity locations and choice of travel modes. On the analytical level, these concrete statements have been translated into interviewees’ rationales underlying their various practices related to activity location and travel mode choices. The rationales are thus at the abstract analytical level. The way a rationale tends to work is different from what any particular interviewee actually does. Once we have identified a rationale, we can infer what implications it has to the relationships between residential location and travel, regardless of the specific residential location and travel behavior of any individual interviewee.
After having identified the rationales, we thus inferred how they can explain causal mechanisms underlying the statistical relationships between residential location and travel identified in Section 3.1. Such an inference includes a logical judgment of how each rationale, in combination with time-geographical constraints and the spatial configuration of the geographical case area, tends to encourage people to choose destinations close to or far from home and to choose particular modes of travel, depending on where they live. The relevant spatial conditions involved in such judgments are, for example, the distribution of jobs, stores, services, dwellings, and other facilities over the metropolitan area and the accessibility by different modes of travel to and from these different parts. Table 7 and Table 8 summarize how this qualitative analysis relates to the overall research focus of this study, seeking to explain how residential location influences travel in the Reykjavik capital region.
3.2.1. Rationales for Activity Location
The interviewees’ two main rationales for activity location were minimizing the friction of distance and choosing the best facility. For all interviewees, both these rationales played a role, but their relative importance varied with activity types as well as between the interviewees. The friction of distance can be understood as the inverse of accessibility: the higher the friction of distance, the lower the accessibility. The friction of distance [90] includes the time consumption, costs, efforts, and inconveniences of going from one place to another. In some cases, the friction of distance can be reduced by choosing a certain travel mode.
The rationale of minimizing the friction of distance is evident in the emphasis of some interviewees on being able to “live within a small radius” (F30, F39, F43). This priority applies particularly to interviewees with caretaking responsibilities for either small children (F36) or an elderly or sick partner or relative (F72). However, the possibility of realizing a wish to stay local depends on the location of the residence. In many suburban neighborhoods, the availability of job opportunities and service facilities apart from the most basic ones is very limited.
For some interviewees, the rationale of minimizing the friction of distance applies specifically to the accessibility of the destinations by their preferred travel mode. A 63-year-old male interviewee (M63) chose a particular gym although another gym was closer to home because the chosen facility fit into his cycling route; another male interviewee, aged 60, was a “car lover” (M60) and chose most of his destinations based on how accessible they were by car (especially the possibility of parking close to the entrance); whereas a female 52-year-old interviewee (F52) chose some destinations (e.g., the pharmacy) because she emphasized the ability to access the facility on foot. Emphasis on accessibility by non-motorized modes strengthens the tendency of shorter overall travel distances among residents living in areas where relevant facilities are available close to home (i.e., residents living close to the city center or major local centers), whereas emphasis on accessibility by car encourages choosing suburban rather than inner-city destinations and may thus induce suburbanites to make fewer long trips to the city center.
While the rationale of minimizing the friction of distance is prominent for non-specialized activities such as grocery shopping, the rationale of choosing the best facility plays a strong role particularly when choosing workplaces and places of higher education. This still depends much on the type of work. The best facility rationale dominates particularly for jobs where higher education/skills are required. For some interviewees, the best facility is located close to the residence. This applies, for example, to the workplaces of two inner-city interviewees with an academic education who had found their jobs at a university (M44) and an embassy (F58), respectively, located in the inner city. For interviewees with less specialized jobs (for example, primary school teacher F30), the possibility of finding the preferred job close to home may be fair when also living at suburban locations.
The best facility rationale is also important when choosing locations for certain outdoor recreation (e.g., natural areas and paths with a view to the sea), exercise (e.g., gyms and swimming pools), and cultural activities (e.g., theaters and cinemas). In contrast, some interviewees, all female (F72, F52, F33, F30), emphasized being able to start their recreational trips from the doorstep of their home, for example, a 72-year-old woman (F72) who walks with her physically impaired husband.
Interviewees normally do not travel far to buy groceries. Some may still do grocery shopping at more distant locations (F30, M54) such as shopping malls but then do so when combined with other purposes such as meeting friends or buying construction materials or tools. Moreover, some interviewees chose stores further away from home where prices are lower or the assortment is larger.
The interviewees’ choices of activity locations were also influenced by some other rationales, usually in combination with the above-mentioned main rationales. These additional rationales were: maintaining social contacts, variety-seeking, place attachment, and urban atmosphere. The rationale of social contacts was hinted at in the above example of F30 choosing a shopping mall at some distance from home to meet with friends there in connection with the shopping trip. In such cases, the venue was chosen not primarily because of the instrumental qualities of the facility (e.g., range of commodities) but also with the aim to meet a group of friends there. Then, the location was chosen based on what is collectively most convenient. Another interviewee (M19) sometimes meets with friends in a swimming pool facility located in his childhood neighborhood where the friends still live. Encountering informally in the hot tubs to socialize with strangers in the form of conversation appears to be a common form of social contact in Iceland. The majority of restaurants, cafes, and facilities for going out to socialize are in the central parts of the capital region. The rationale of maintaining social contacts contributes to some extent to lower travel distances among inner-city dwellers than among suburbanites. The same applies to the rationale of variety-seeking, although this reason for location choice was not mentioned often by the interviewees. It still probably plays a role when interviewees vary between different places when visiting cafés, restaurants, etc. and possibly also for shopping. Since the possibility of choosing among several alternatives without having to travel far from home is higher when living centrally, this rationale too contributes (slightly) to longer overall travel distances among suburbanites. The difference is somewhat blurred between variety-seeking as a rationale for activity location and recreational trips. For example, one interviewee (52) and her husband (in their early 50s) sometimes takes a car ride and gets an ice cream underway, always at a kiosk belonging to the same ice cream chain but at different locations. Place attachment seems to play a role for a 54-year-old male interviewee (M54) who has a strong attachment to his neighborhood from childhood and chooses various local opportunities when going to a swimming pool, café, and when going for recreational walks. For persons who live close to the places they are attached to, this rationale stimulates people to choose local facilities and may then contribute to shorter travel distances when living close to a local center. However, if the place attachment is to a different place from where he/she lives, this rationale may lead to longer trips for suburbanites as well as inner-city dwellers. Finally, four interviewees, three living in the inner city (F52, M63, and M44) and one living close to a major local center (F39) chose destinations where they could experience the urban atmosphere on the way. This applied to activities such as visits to cafés, grocery stores, and other shops. The “atmospheric” qualities sought included esthetic aspects of the built environment (M63) as well as a vibrant street life (F52, M44). One of these interviewees (M44) also does part of his academic job in cafes downtown, chosen as the best facility location in terms of both atmosphere and what they sell.
Table 7 summarizes the ways in which the different rationales for activity location tend to influence the travel distances of people living in different parts of the metropolitan area. Some of the rationales were not encountered among interviewees living in all geographical contexts represented in the table. The table shows, however, how these rationales tend to influence relationships between residential location and travel distances.
3.2.2. Rationales for Travel Mode Choice
The interviewees’ four main rationales for choice of travel modes were time-saving, convenience and comfort, wish for physical exercise, and frustration aversion. In some cases, several other rationales may also play a significant role in travel mode choices.
The rationale of time-saving generally encourages interviewees to choose the car as their motorized travel mode. All the interviewees owned a car, except a teenager (F19) who did not have a driver’s license but often received lifts from her parents and from friends. The public transport seems to generally take too much time compared to the car, which has very good access within the whole metropolitan area (with only a few exceptions in the downtown of Reykjavik). Travel time by car is therefore favorable compared to other options. However, the time-saving rationale does not always encourage car driving. Especially in the core of the downtown area, travel time is often shortest on foot or by bike, encouraging non-motorized travel. M63 cycles to most of his important daily destinations, whereas F58 and M44 walk, including to the workplace. Distances are rather short, and driving would be time-costly in the downtown area because of one-way streets and limited parking spaces. The interviewees whose trips most often take place within the areas where non-motorized modes are fastest were of course those living in the inner parts of Reykjavik (M63, F58, and M44). By encouraging inner-city residents to choose non-motorized modes for many of their trips and the remaining residents to opt for the car, the time-saving rationale tends to contribute to higher shares of non-motorized travel and lower shares of car travel among downtown residents, compared to the rest of the capital region.
The rationale of convenience and comfort includes aspects such as flexibility and traveling with a minimum of physical effort (in case of motorized travel modes). This rationale was of overriding importance for almost all the interviewees. It was often linked with choosing the car as a transport mode but not always. In central Reykjavik, this rationale leads to more walking and cycling (as illustrated in interviews with F52, M44, and M63, who find driving in the downtown area inconvenient) compared to other neighborhoods. Often, the convenience and comfort rationale was coupled to a time-saving rationale. Using public transport was never mentioned in relation to the convenience and comfort rationale, except by one inner-city interviewee who lives close to one of Reykjavik’s main bus terminals, Hlemmur (M63).
The flexibility and freedom aspects are important elements of the convenience and comfort rationale. It is very easy to drive within the whole area (with the above-mentioned few exceptions in downtown Reykjavik), which may lead to car driving becoming a “habit” and even generating a passionate attitude towards the car, as expressed by some interviewees. For example, the freedom to go wherever and whenever he wants, as quickly as possible, decisively influenced the travel mode choice of M60. He drives everywhere and always, regardless of distance. Similarly, although some of her trips are very short, F43 drives to most destinations because it is easy, convenient, and flexible—she can, for example, quickly make errands during the workday.
A rationale of physical exercise frequently motivates mode choice among those interviewees who travel on foot or by bike. For example, the choice of F73 to walk to the grocery store/services at rather short distances from home is fitness/health-related, and for M63, living in the downtown area of Reykjavik, his choice of cycling as a travel mode is based partly on a wish for fitness (but also convenience, cf. above). The physical exercise rationale is rarely the only or the decisive rationale for interviewees’ choice of physically active travel modes. The multiple motivations for the travel mode choice of M44, living centrally, are illustrative: the main rationales for daily transport modes are a combination of convenience and comfort, physical exercise, frustration aversion, and environmental concerns—influencing him to mostly walk and sometimes bike. Another inner-city resident (F52) walks to most daily destinations in the downtown area. Although physical exercise is not the main reason for her travel mode choice, her walking may be importantly linked with a wish for physical exercise, as she stated that she does not do much other physical activity except walking in a neighborhood park and swimming in a swimming facility at some distance from home.
The physical exercise rationale motivates some suburban residents to travel by non-motorized modes instead of by car for short trips made on a regular basis, such as to a grocery store. Among our interviewees, the physical exercise rationale therefore contributes to some non-motorized travel also in suburban parts of the metropolitan area. The rationale as such encourages increased non-motorized travel not only for suburbanites but also for inner-city residents.
For most interviewees, frustration aversion was not important when it came to car driving. The accessibility by car is generally very good within the whole capital region. Only in downtown Reykjavik are there one-way streets and somewhat limited car parking, at least compared to the rest of the area. Although some interviewees said that they drive anyway although they do not like it, frustration aversion influences some informants who always or most often drive (notably M60) to avoid the downtown area (which may then influence their activity locations, cf. above). Moreover, for those interviewees who live in the core downtown area (F58, M63, M44), the frustration aversion rationale makes up an incentive for walking and cycling, since frustration aversion is also important when it comes to avoiding public transport. Infrequent departures, inconvenient routes (many detours through smaller streets), long distances to bus stops and unreliable schedules of departures make travel times by bus not only long but also unpredictable—and thus frustrating. Because it is difficult to rely on the bus as travel mode, many of the interviewees (e.g., F52) do not consider using public transport as a real option. Frustration aversion is, however, not mentioned in combination with walking or cycling. For those interviewees who can reach relevant destinations within walking and cycling distance, the frustration aversion rationale thus encourages the use of these modes. This applies mainly to inner-city residents. In this way, the frustration aversion rationale contributes to the higher shares of non-motorized travel and lower shares of car travel among interviewees living close to the city center of Reykjavik.
Like the choices of activity locations, the interviewees’ travel mode choices are influenced by some rationales in addition to the main ones, usually in combination with the latter rationales. These additional rationales are: ingrained habits, economic expenses, safety, social contact, caretaking, and environmental concerns. The ingrained habits rationale (M60, F47, M63, and partly also M44) refers to long-standing practices and cultural attitudes developed since adolescence. The economic expenses rationale (F39, 36, and the son of 43) refers to mode choice based on considerations about gasoline costs, parking costs, vehicle maintenance costs, and public transport prices. The safety rationale refers to abstaining from certain modes based on a perceived higher risk of accidents when traveling by the mode in question, as in F52′s avoidance of cycling after an earlier accident. The social contact rationale refers to a motivation for traveling in company with other people. For example, F30 seems to use the bus only when traveling downtown with her family. Her walking to kindergarten and to grocery store/services is also linked with a wish to have nice time with her children, combined with caretaking and a wish for physical exercise. For F52, seeing other people in the streets, both strangers and meeting acquaintances by coincidence, plays a role in her pleasure of walking in downtown Reykjavik, which is her local area. The caretaking rationale refers to choosing travel modes in order to facilitate others’ mobility in combination with caring for their wellbeing, such as a child (F36, F36) or a sick relative (F73). For F39, driving together in their car seems to contribute to glue the family together. The “service” of driving children is thus not only functionally motivated, it provides the possibility to be with the children while moving around. The caretaking rationale is thus strongly interrelated with the social contacts rationale. Finally, environmental concerns apparently play a very modest role as a rationale among the interviewees. Such concerns are mentioned only as a partial reason for one inner-city interviewee for walking (M44). In addition, a suburban interviewee mentions environmental concerns as one of the reasons for choosing an electric car (F39). This is, however, a choice between different types of cars and thus does not seem to affect the interviewee’s choice of travel mode.
None of the above-mentioned, “additional” rationales seem to play any strong role in the relation between residential location and travel mode choice. The ingrained habits rationale contributes to make people travel by the same mode more or regardless of residential location and thus weakens the relationship somewhat. The safety rationale encourages travel by motorized modes, since one will then be less vulnerable than non-motorized travelers in the case of an accident, particularly in an urban context where driving speeds are usually moderate enough to cause few fatalities from traffic accidents among car travelers. The remaining rationales do not seem to affect the relationship between residential location and travel mode choice much. Therefore, what matters to this relationship are the four main rationales, which all contribute to a higher propensity of non-motorized travel and a lower propensity of car travel among inner-city residents than among suburbanites.
Table 8 summarizes the ways in which the different rationales for travel mode choice tend to influence on the travel modes of people living in different parts of the metropolitan area. Some of the rationales were not encountered among interviewees living in all geo-graphical contexts represented in the table. The table shows, however, how these rationales tend to influence relationships between residential location and travel mode choices.
These findings show how the strongest rationales resonate with and help explain our quantitative findings. The stronger effects of residential distance to the city center than of more local built environment variables in the quantitative part reflects that the rationales strengthening the former relationships are strongest and more visible in the interviews than the rationales contributing to the effects of proximity to lower-order or local centers.
For most travel purposes, most people do not necessarily choose the closest facility, but rather, they travel slightly further if they can then find a better facility. This is especially true for workplaces. Travel distances therefore depend more on the location of the dwelling relative to large concentrations of facilities, typically found in the inner city, than on the distance to suburban centers, although the closest facilities may exist in the latter centers. People who live close to the city center have a large number of facilities within a short distance from the dwelling and therefore do not have to travel long, even if they are very selective as to the quality of the facility.
The dominant rationales for travel mode choice encourage suburbanites to choose car as their travel mode more frequently than inner-city dwellers, and oppositely for transit and non-motorized travel. Notably, as theorized by Hägerstrand [42], those who need to overcome long distances to reach daily destinations need fast means of transportation. The time-saving rationale therefore tends to encourage suburbanites to travel by motorized modes, especially car. Conversely, travel distances of inner-city residents are often short, and they therefore tend to carry out a higher proportion of trips by bike or on foot. Moreover, travel modes perceived as convenient, simple, and non-frustrating for inner-city residents are often perceived as the opposite among suburbanites.
4. Discussion
This study set out to identify associations between built environment characteristics and travel behavior for commuting and non-work purposes and aimed to uncover the main causal mechanisms underlying these associations. We found that a residential location close to the main city center of Reykjavik contributes to shorter travel distances, lower proportions of car travel, and somewhat higher shares of non-motorized travel. The effect of proximity to the city center is particularly strong for commuting but exists for non-work travel and overall car-driving distances as well. There are also effects of proximity to a main second-order center and local centers and of local-area population density, but these effects apply to fewer aspects of travel. The rationales for activity location and travel mode choice identified in our qualitative interviews provide plausible explanations for the existence of the above-mentioned statistical relationships between residential location and travel behavior.
The results of this study resemble those found in other Nordic monocentric cities and metropolitan areas with a population size comparable to the Reykjavik capital region, such as Aarhus [60] and Trondheim and Bergen [54]. In all these cases, strong effects of residential distance to the main city center have been found, especially for commuting. In the polycentric Stavanger metropolitan area, the influences of residential location on non-work travel were also quite similar to the effects found in the Reykjavik capital region, but, for commuting, the two city regions show different patterns. Distinct from the Reykjavik region, where commuting distances are strongly influenced by residential distance to the main city center, commuting distances in the Stavanger region are influenced more by how far the dwelling is located from a second-order center with the region’s largest employment concentration. The strong relationship between residential distance to the city center and travel distances found in the Reykjavik region and several other studies thus refers mainly to monocentric city regions. In polycentric city regions such as Stavanger there is still a strong center–periphery gradient in terms of travel modes, since the large suburban employment center has a clearly car-oriented transport infrastructure [23].
The main findings in the Reykjavik capital region are also in line with findings in studies of residential location and travel in larger Nordic city regions as well as in other corners of the world [16,23,32,38,47,48,49,50,51,52,53,63,91]. In all these studies, clear effects of residential distance to the main city center on travel behavior have been found, where suburbanites typically travel longer distances in total and by car than inner-city residents do, in addition to carrying out a higher share of their transportation by car and a lower proportion by non-motorized modes.
The transport rationales identified in the interviews are similar to those found in other qualitative studies of the influences of the built environment on travel over the last two decades [14,32,58,67,79,80]. Choosing the best facility and limiting the friction of distance have been identified in all these studies as the main rationales for activity location, traded off against each other and with the emphasis laid on each rationale depending on activity types and, to some extent, varying between population groups as well. Similarly, time-saving and convenience/comfort have been identified across studies as the main rationales for travel mode choice. Together, the rationales for activity location and travel mode choice help explain why residents living close to the main center of a city or urban region typically travel shorter distances per day and use cars less than those living in the outer parts of the city or urban region. Although ingrained norms and habits underpinning a practice of car driving may be quite widespread in the Icelandic capital region, this does not do away with the typical differences between suburbanites and inner-city dwellers in travel behavior. It should be noted that the number of interviewees in the Reykjavik study was lower than in the above-mentioned earlier studies.
Despite the high provision of parking opportunities in parts of the inner city of Reykjavik and the recent strong growth in workplaces in the suburban second-order center of Smáralind, commuting distances and modes are strongly influenced by how far from the city center the residence is located. The location of the dwelling relative to the city center is the spatial characteristic associated with the widest range of travel behavior variables. Local-area density and proximity to local centers also play a role for some aspects of travel behavior, notably for non-work travel. The stronger influence of local-scale characteristics on non-work travel is in line with earlier Nordic studies, among others in the Oslo and Stavanger metropolitan areas in Norway [23].
The results from the qualitative interviews, the cross-sectional statistical analyses, and the analyses of changes in travel behavior among recent movers converge on the same message: residential location in central and dense parts of the metropolitan area contributes to shorter overall travel distances, lower shares of car driving, and higher shares of non-motorized travel. In particular, residential location close to the main city center is favorable, as seen from a sustainable mobility [10] perspective. The findings from the Reykjavik study are in line with the results of earlier mixed-methods studies of residential location and travel (as well as from most studies applying only the traditional cross-sectional quantitative approach) and thus add robustness to the conclusions about the sustainability benefits of inner-city densification rather than polycentric suburban development.
Author Contributions
Conceptualization, P.N.; methodology, P.N., H.S., S.P., M.C., and J.H.; formal analysis, P.N., H.S., S.P., and M.C.; investigation, H.S., H.S., and J.H.; writing—original draft preparation, P.N., H.S., and S.P.; writing—review and editing, P.N., H.S., S.P., M.C., and J.H.; visualization, P.N. and M.C.; project administration, H.S.; funding acquisition, H.S. All authors have read and agreed to the published version of the manuscript.
Funding
This research received partial funding from The National Planning Agency in Iceland and The Icelandic Road and Coastal Administration (IRCA) but has mainly been carried out as part of the authors’ general, free research time at their respective universities.
Data Availability Statement
Anonymized quantitative data file (SPSS) can be obtained on request from Harpa Stefansdottir, email: [email protected]. For anonymity reasons, qualitative interview transcripts cannot be released.
Acknowledgments
The authors are thankful to student at the University of Iceland Hildur Hafbergsdóttir for her inputs to the interpretation of qualitative interviews.
Conflicts of Interest
The authors declare no conflict of interest.
Appendix A

Table A1.
Comparison of demographic and socioeconomic characteristics of the survey respondents with the population of the Reykjavik capital region.
Table A1.
Comparison of demographic and socioeconomic characteristics of the survey respondents with the population of the Reykjavik capital region.
| Variables | Respondents of the Reykjavik Capital Region (in 2019, N = 1146) | Population of the Reykjavik Capital Region (in 2011) [92,93] |
|---|---|---|
| Average number of persons per household | 2.89 | 2.53 |
| Average number of children aged 0–6 years per household | 0.31 | 0.27 |
| Average number of children aged 7–17 years per household | 0.49 | 0.38 |
| Average age among residents above 18 years of age | 49.4 | 45.1 |
| Gender (proportion female) | 56.2% | 50.3% |
| Proportion of workforce participants among residents above 18 years of age | 69.6% | 75.0% |
| Proportion with education at master’s level or higher among residents above 18 years of age | 33.0% | 27.5% |
| Average number of cars per household | 1.54 | 1.60 |
Table A2.
Key demographic and socioeconomic characteristics of the interviewees.
| ID | Location Type | Age | Gender | Employment | Completed Education | Household Annual Income (mill. ISK) | Housing Type | Time of Living in Residence | Household Members |
|---|---|---|---|---|---|---|---|---|---|
| M63 | Central downtown | 63 | Male | Employed | Education as skilled worker or craftsman/-woman | 14–16.99 | Duplex house | 5–10 years | 2 adults |
| F36 | Inner suburb | 36 | Female | Student | University college education, bachelor or similar | Missing | Apartment building (student housing | 1–2 years | 1 adult, 2 children 3 and 7 years |
| F73 | Close to local center | 73 | Female | Retired | High school or professional secondary school | 5–7.99 | Duplex house | More than 10 years | 2 adults |
| F58 | Central downtown | 58 | Female | Employed | University education, master’s or higher | 14–16.99 | Apartment building | Less than 1 year | Single |
| F30 | Close to peripheral local center | 30 | Female | Employed | University education, master’s or higher | 8–10.99 | Detached single-family house | 1–2 years | 2 adults, 2 children: 2 and 5 years |
| F52 | Close to Smáralind | 52 | Female | Employed | High school or professional secondary school | 5–7.99 | Apartment building | 1–2 years | 2 adults |
| M54 | Inner suburb | 54 | Male | Employed | University education, master’s or higher | 14–16.99 | Detached single-family house | More than 10 years | 3 adults |
| F39 | Center | 39 | Female | Neither employed nor student | University education, master’s or higher | 27 or more | Detached single-family house | 1–2 years | 2 adults, 3 children: 2, 7 and 12 years |
| F43 | Suburban | 43 | Female | Employed | University college education, bachelor or similar | 8–10.99 | Row house | 1–2 years | 3 adults, child 11 years |
| F47 | Suburban | 47 | Female | Employed | University education, master’s or higher | 24–26.99 | Detached single-family house | more than 10 years | 3 adults, child 11 years |
| M60 | Suburban | 60 | Male | Employed | High school or professional secondary school | 27 or more | Apartment building | 1–2 years | 1 adult |
| M19 | Suburban | 19 | Male | Pupil | Elementary school | missing | Duplex house | Under 1 year | 3 adults |
| M44 | Central downtown | 44 | Male | Employed | University education, master’s or higher | 27 or more | Apartment building | 1–2 years | 4 adults in survey/2 adults in interview after divorce |
References
- European Commission. A European Strategy for Low-Emission Mobility. Available online: https://ec.europa.eu/clima/policies/transport_en (accessed on 14 May 2021).
- Alexander, D.E. Highways, environmental impact. In Environmental Geology. Encyclopedia of Earth Science; Springer: Dordrecht, The Netherlands, 1999. [Google Scholar] [CrossRef]
- Seiler, A. Effects of infrastructure on nature. In COST Action 341, Habitat Fragmentation Due to Transportation Infrastructure: The European Review; European Commission Directorate-General for Research: Luxembourg, 2003; pp. 31–50, 201–211. [Google Scholar]
- EU DG Environment. Soil Sealing; EU DG Environment: Brussels, Belgium, 2018; Available online: https://ec.europa.eu/environment/soil/sealing_guidelines.htm (accessed on 23 March 2021).
- Ivehammar, P. How to Deal with the Encroachment Costs in Road Investment CBA. Ph.D. Thesis, Linköping University, Linköping, Sweden, 2006. [Google Scholar]
- OECD. OECD Proceedings: Towards Sustainable Transportation. The Vancouver Conference; OECD: Paris, France, 1997; Available online: https://www.oecd.org/greengrowth/greening-transport/2396815.pdf (accessed on 14 May 2021).
- European Conference of Ministers of Transport. Assessment and Decision Making for Sustainable Transport; OECD Publications Service: Paris, France, 2004. [Google Scholar] [CrossRef]
- Commission of European Communities. Green Paper on the Impact of Transport on the Environment: A Community Strategy for Sustainable Mobility; Commission of European Communities: Brussels, Belgium, 1992; Available online: https://op.europa.eu/en/publication-detail/-/publication/98dc7e2c-6a66-483a-875e-87648c1d75c8/language-en (accessed on 14 May 2021).
- Holden, E. Achieving Sustainable Mobility: Everyday and Leisure-Time Travel in the EU; Routledge: London, UK, 2016. [Google Scholar]
- Banister, D. The sustainable mobility paradigm. Transp. Policy 2008, 15, 73–80. [Google Scholar] [CrossRef]
- Van Acker, V.; Van Wee, B.; Witlox, F. When Transport Geography Meets Social Psychology: Toward a Conceptual Model of Travel Behaviour. Transp. Rev. 2010, 30, 219–240. [Google Scholar] [CrossRef] [Green Version]
- Næss, P. Built environment, causality and travel. Transp. Rev. 2015, 35, 275–291. [Google Scholar] [CrossRef] [Green Version]
- Lewis-Beck, M. Applied Regression: An Introduction; Sage Publication: Newbury Park, CA, USA, 1980. [Google Scholar]
- Næss, P.; Peters, S.; Stefansdottir, H.; Strand, A. Causality, not just correlation: Residential location, transport rationales and travel behavior across metropolitan contexts. J. Transp. Geogr. 2018, 69, 181–195. [Google Scholar] [CrossRef]
- Plano-Clark, V.; Anderson, N.; Wertz, J.; Zhou, Y.; Schumacher, K.; Miaskowski, C. Conceptualizing longitudinal mixed methods designs: A methodological review of health sciences research. J. Mix. Method Res. 2015, 9, 297–319. [Google Scholar] [CrossRef]
- Ewing, R.; Cervero, R. Travel and the built environment. J. Am. Plan. Assoc. 2010, 76, 1–30. [Google Scholar] [CrossRef]
- Stevens, M.R. Does compact development make people drive less? J. Am. Plan. Assoc. 2017, 83, 7–18. [Google Scholar] [CrossRef]
- Handy, S.L.; Boarnet, M.G.; Ewing, R.; Killingsworth, R.E. How the built environment affects physical activity: Views from urban planning. Am. J. Prev. Med. 2002, 23, 64–73. [Google Scholar] [CrossRef]
- Cao, X.; Mokhtarian, P.L.; Handy, S. Examining the impacts of residential self-selection on travel behavior: A focus on empirical findings. Transp. Rev. 2009, 29, 359–395. [Google Scholar] [CrossRef]
- Saelens, B.E.; Handy, S. Built environment correlates of walking: A review. Med. Sci. Sport Exer. 2008, 40, S550–S566. [Google Scholar] [CrossRef] [PubMed] [Green Version]
- Næss, P. Urban form and travel behavior: Experience from a Nordic context. J. Transp. Land Use 2012, 5, 21–45. [Google Scholar] [CrossRef]
- Næss, P. ‘New urbanism’ or metropolitan-level centralization? A comparison of the influences of metropolitan-level and neighborhood-level urban form characteristics on travel behavior. J. Transp. Land Use 2011, 4, 25–44. [Google Scholar]
- Næss, P.; Strand, A.; Wolday, F.; Stefansdottir, H. Residential location, commuting and non-work travel in two urban areas of different size and with different center structures. Prog. Plan. 2019, 128, 1–36. [Google Scholar] [CrossRef] [Green Version]
- Van Acker, V.; Witlox, F. Commuting trips within tours: How is commuting related to land use? Transportation 2011, 38, 465–486. [Google Scholar] [CrossRef]
- Scheiner, J.; Holz-Rau, C. Travel mode choice: Affected by objective or subjective determinants? Transportation 2007, 34, 487–511. [Google Scholar] [CrossRef]
- Moreno, C.; Transcript of “La ville d’un quart d’heure”. TED Talks. 2020. Available online: https://www.ted.com/talks/carlos_moreno_the_15_minute_city/transcript?language=fr (accessed on 14 May 2021).
- Weng, M.; Ding, N.; Li, J.; Jin, X.; Xiao, H.; He, Z.; Su, S. The 15-minute walkable neighborhoods: Measurement, social inequalities and implications for building healthy communities in urban China. J. Transp. Health 2019, 13, 259–273. [Google Scholar] [CrossRef]
- Da Silva, D.C.; King, D.A.; Lemar, S. Accessibility in practice: 20-minute city as a sustainability planning goal. Sustainability 2019, 12, 129. [Google Scholar] [CrossRef] [Green Version]
- CNU. Canons of Sustainable Architecture and Urbanism: A Companion to the Charter of New Urbanism. Available online: http://www.cnu.org/sites/files/Canons.pdf (accessed on 25 March 2013).
- Alonso, W. Location and Land Use; Harvard University Press: Cambridge, MA, USA, 1964. [Google Scholar]
- Fishman, R. Bourgeois utopias: Visions of suburbia. In Readings in Urban Theory; Fainstein, S., Campbell, S., Eds.; Blackwell: Malden, MA, USA, 1996; pp. 23–71. [Google Scholar]
- Næss, P. Residential location affects travel behavior—But how and why? The case of Copenhagen Metropolitan Area. Prog. Plan. 2005, 63, 167–257. [Google Scholar] [CrossRef]
- Gibson, J. The theory of affordances. In Perceiving, Acting, and Knowing: Toward an Ecological Psychology; Shaw, R., Bransford, J., Eds.; Lawrence Erlbaum Associates: Hillsdale, NJ, USA, 1977; pp. 67–82. [Google Scholar]
- Østerberg, D. Arkitektur og Sosiologi i Oslo: En Sosiomateriell Fortolkning; Pax: Oslo, Norway, 1998. [Google Scholar]
- Bhaskar, R. Enlightened Common Sense. The Philosophy of Critical Realism; Routledge: London, UK, 2016. [Google Scholar]
- Danermark, B.; Ekström, M.; Karlsson, J.C. Explaining Society. Critical Realism in the Social Sciences, 2nd ed.; Routledge: London, UK, 2019. [Google Scholar]
- Berry, B.J.; Garrison, W.L. Recent developments of central place theory. Pap. Reg. Sci. 1958, 4, 107–120. [Google Scholar] [CrossRef]
- Milakis, D.; Cervero, R.; van Wee, B. Stay local or go regional? Urban form effects on vehicle use at different spatial scales: A theoretical concept and its application to the San Francisco Bay Area. J. Transp. Land Use 2015, 8, 59–86. [Google Scholar] [CrossRef] [Green Version]
- Heinonen, J.; Czepkiewicz, M.; Ottelin, J. Drivers of car ownership in a car-oriented city: A mixed-method study. Sustainability 2021, 13, 619. [Google Scholar] [CrossRef]
- Stefánsdóttir, H. Pleasurable Cycling to Work. Urban Spaces and Aesthetic Experiences of Commuting Cyclists. Ph.D. Thesis, Norwegian University of Life Sciences, Ås, Norway, 2014. [Google Scholar]
- Næss, P.; Jensen, O.B. Bilringene og Cykelnavet. Boliglokalisering, Bilafhængighed og Transportadfærd i Hovedstadsområdet; Aalborg University Press: Aalborg, Denmark, 2005. [Google Scholar]
- Hägerstrand, T. What about people in regional science? Pap. Reg. Sci. Assoc. 1970, 24, 7–21. [Google Scholar] [CrossRef]
- Schwanen, T. Struggling with time: Investigating coupling constraints. Transp. Rev. 2008, 28, 337–356. [Google Scholar] [CrossRef] [Green Version]
- Ellegård, K.; Svedin, U. Torsten Hägerstrand’s time-geography as the cradle of the activity approach in transport geography. J. Transp. Geogr. 2012, 23, 17–25. [Google Scholar] [CrossRef] [Green Version]
- Ellegård, K. Thinking Time Geography; Routledge: London, UK, 2019. [Google Scholar]
- Ma, L.; Cao, J. How perceptions mediate the effects of the built environment on travel behavior? Transportation 2019, 46, 175–197. [Google Scholar] [CrossRef]
- Mogridge, M.H.J. Transport, land use and energy interaction. Urban Stud. 1985, 22, 481–492. [Google Scholar] [CrossRef]
- Newman, P.W.G.; Kenworthy, J.R. Cities and Automobile Dependence; Gower Publications: Aldershot, UK, 1989. [Google Scholar]
- Zhou, B.; Kockelman, K. Self-selection in home choice: Use of treatment effects in evaluating the relationship between the built environment and travel behavior. Transp. Res. Rec. 2008, 2077, 54–61. [Google Scholar] [CrossRef] [Green Version]
- Milakis, D.; Vlastos, T.; Barbopoplos, N. Relationships between urban form and travel behaviour in Athens, Greece. A comparison with western European and North American results. Eur. J. Transp. Infrast. 2008, 8, 201–215. [Google Scholar]
- Næss, P. Residential location, travel and energy use: The case of Hangzhou Metropolitan Area. J. Transp. Land Use 2010, 3, 27–59. [Google Scholar] [CrossRef]
- Zegras, C. The built environment and motor vehicle ownership and use: Evidence from Santiago de Chile. Urban Stud. 2010, 47, 1793. [Google Scholar] [CrossRef]
- Wang, X.; Shao, C.; Yin, C.; Zhuge, C. Exploring the influence of built environment on car ownership and use with a spatial multilevel model: A case study of Changchun, China. Int. J. Environ. Res. Public Health 2018, 15, 1868. [Google Scholar] [CrossRef] [PubMed] [Green Version]
- Engebretsen, Ø.; Næss, P.; Strand, A. Residential location, workplace location and car driving in four Norwegian cities. Eur. Plan. Stud. 2018, 26, 2036–2057. [Google Scholar] [CrossRef] [Green Version]
- Næss, P.; Røe, P.G.; Larsen, S.L. Travelling distances, modal split and transportation energy in thirty residential areas in Oslo. J. Environ. Plan. Manag. 1995, 38, 349–370. [Google Scholar] [CrossRef]
- Røe, P.G. Storbymenneskets Hverdagsreiser. Sammenhenger Mellom Bosted, Livsstil og Hverdagsreisepraksis i et Senmoderne Perspektiv. Ph.D. Thesis, Norwegian University of Technology and Science, Trondheim, Norway, 2001. [Google Scholar]
- Næss, P.; Cao, X.; Strand, A. Which D’s are the important ones? The effects of built environment characteristics on driving distance in Oslo and Stavanger. J. Transp. Land Use 2017, 10, 945–964. [Google Scholar] [CrossRef] [Green Version]
- Næss, P.; Jensen, O.B. Urban structure matters, even in a small town. J. Environ. Plan. Manag. 2004, 47, 35–56. [Google Scholar] [CrossRef]
- Nielsen, T.A.S. Boliglokalisering og Transport i Aalborg. Ph.D. Thesis, Aalborg University, Aalborg, Denmark, 2002. [Google Scholar]
- Hartoft-Nielsen, P. Boliglokalisering og Transportadfærd; Danish Forest and Landscape Research Institute: Hørsholm, Denmark, 2001. [Google Scholar]
- Elldér, E. Residential location and daily travel distances: The influence of trip purpose. J. Transp. Geogr. 2014, 34, 121–130. [Google Scholar] [CrossRef]
- Elldér, E. Does telework weaken urban structure–travel relationships? J. Transp. Land Use 2017, 10, 187–210. [Google Scholar] [CrossRef]
- Czepkiewicz, M.; Ottelin, J.; Ala-Mantila, S.; Heinonen, J.; Hasanzadeh, K.; Kyttä, M. Urban structural and socioeconomic effects on local, national and international travel patterns and greenhouse gas emissions of young adults. J. Transp. Geogr. 2018, 68, 130–141. [Google Scholar] [CrossRef]
- Handy, S.L. Regional versus local accessibility: Implication for non-work travel. Transp. Res. Rec. 1993, 1400, 58–66. [Google Scholar]
- Handy, S.L.; Clifton, K.L. Local shopping as a strategy for reducing automobile travel. Transportation 2001, 28, 317–346. [Google Scholar] [CrossRef]
- Nielsen, T.A.S. The role of subcentres for commuting and non-work travel distances and modes in the Copenhagen metropolitan region. Built Environ. 2019, 45, 462–475. [Google Scholar] [CrossRef]
- Næss, P. Residential location and travel behavior. In Mobility Patterns and Urban Structure; Pinho, P., Silva, C., Eds.; Ashgate: Farnham, UK, 2015; pp. 151–186. [Google Scholar]
- Lee, B.; Gordon, P.; Moore II, J.E.; Richardson, H. The attributes of residence/workplace areas and transit commuting. J. Transp. Land Use 2011, 4, 43–63. [Google Scholar] [CrossRef]
- Holden, E.; Norland, I.T. En Undersøkelse av Husholdningers Forbruk av Energi Til Bolig og Transport i Stor-Oslo; University of Oslo: Oslo, Norway, 2004. [Google Scholar]
- City Population, Iceland, Major Localities, Reykjavik. Available online: https://www.citypopulation.de/en/iceland/ (accessed on 23 April 2021).
- Sieverts, T. Zwischenstadt: Zwischen Ort und Welt, Raum und Zeit, Stadt und Land; Birkhäuser: Basel, Switzerland, 1999. [Google Scholar]
- Meijers, E.; Hoogerbrugge, M.; Cardoso, C. Beyond polycentricity: Does stronger integration between cities in polycentric urban regions improve performance? Tijdschr. Econ. Soc. Geogr. 2017, 109, 1–21. [Google Scholar] [CrossRef] [Green Version]
- Association of Municipalities in the Reykjavik Capital Region. Available online: https://geo.alta.is/ssh/ (accessed on 28 April 2021).
- Statistics Iceland, Registered Motor Vehicles. Passenger Cars, 1–8 Passengers. Available online: https://www.statice.is/statistics/business-sectors/transport/vehicles/ (accessed on 20 January 2020).
- Reykjavík City, Reykjavík í Tölum. Available online: http://tolur.reykjavik.is/ (accessed on 14 May 2020).
- Gallup Iceland, Samgöngu-og Sveitarstjórnarráðuneytið, Samtök sveitarfélaga á höfuðborgarsvæðinu, Vegagerðin, Samgöngustofa og Isavia—Ferðir íbúa Höfuðborgarsvæðisins, Október-Nóvember. 2019. Available online: https://www.stjornarradid.is/library/01--Frettatengt---myndir-og-skrar/SAM/02_H%c3%b6fu%c3%b0borgarsv%c3%a6%c3%b0i%c3%b0.pdf (accessed on 30 October 2020).
- Valsson, T. Planning in Iceland: From Settlement to Present Times; University of Iceland Press: Reykjavík, Iceland, 2003. [Google Scholar]
- Reykjavík City, Reykjavík Municipal Plan 2010–2030. Available online: http://adalskipulag.is (accessed on 20 January 2020).
- Næss, P. Residential location, transport rationales and daily-life travel behavior: The case of Hangzhou Metropolitan Area, China. Prog. Plan. 2013, 79, 1–50. [Google Scholar] [CrossRef]
- Næss, P.; Tønnesen, A.; Wolday, F. How and why does intra-metropolitan workplace location affect car commuting? Sustainability 2019, 11, 1196. [Google Scholar] [CrossRef] [Green Version]
- Næss, P. Residential self-selection and appropriate control variables in land use–travel studies. Transp. Rev. 2009, 29, 293–324. [Google Scholar] [CrossRef]
- Næss, P. Tempest in a teapot: The exaggerated problem of transport-related residential self-selection as a source of error in empirical studies. J. Transp. Land Use 2014, 7, 57–77. [Google Scholar] [CrossRef]
- Wolday, F.; Cao, X.; Næss, P. Examining factors that keep residents with high transit preference away from transit-rich zones and associated behavior outcomes. J. Transp. Geogr. 2018, 66, 224–234. [Google Scholar] [CrossRef]
- Wolday, F.; Næss, P.; Cao, J. Travel-based residential self-selection: A qualitatively improved understanding from Norway. Cities 2019, 87, 87–102. [Google Scholar] [CrossRef]
- Crano, W.D.; Brewer, M.B.; Lac, A. Principles and Methods of Social Research, 3rd ed.; Routledge: New York, NY, USA, 2015. [Google Scholar]
- Giuliano, G.; Narayan, D. Another look at travel patterns and urban form: The US and Great Britain. Urban Stud. 2003, 40, 2295–2312. [Google Scholar] [CrossRef] [Green Version]
- Cao, J.; Næss, P.; Wolday, F. Examining the effects of the built environment on auto ownership in two Norwegian urban regions. Transp. Res. 2019, 67, 464–474. [Google Scholar]
- Næss, P. Validating explanatory qualitative research: Enhancing the interpretation of interviews in urban planning and transportation research. Appl. Mobilities 2020, 5, 186–205. [Google Scholar] [CrossRef]
- Norusis, M.J. SPSS Base System User’s Guide; SPSS Inc.: Chicago, IL, USA, 1990. [Google Scholar]
- Lloyd, P.E.; Dicken, P. Location in Space—A Theoretical Approach to Economic Geography; Harper and Row: London, UK, 1977. [Google Scholar]
- Headicar, P. The exploding city region: Should it, can it, be reversed? In Achieving Sustainable Urban Form; Williams, K., Burton, E., Jenks, M., Eds.; Spon: London, UK, 2000; pp. 160–173. [Google Scholar]
- Statistics Iceland Online Database. Available online: https://px.hagstofa.is/pxen/pxweb/en/?rxid=44a7b72d-c137-4b86-8150-3c4a6a758600 (accessed on 20 February 2021).
- Reykjavikurborg Online Database. Available online: https://tolur.reykjavik.is/PxWeb/pxweb/en/05%20Transport/05%20Transport__01.%20Car%20ownership%20and%20traffic/SAM01001.px/?rxid=0895a024-ab8a-4a03-b122-540838af0989 (accessed on 20 February 2021).
Figure 1.
Assumed causal relationships between different built environment characteristics and travel behavior. Characteristics included in the statistical analyses of this study are shown with bold outlines.
Figure 1.
Assumed causal relationships between different built environment characteristics and travel behavior. Characteristics included in the statistical analyses of this study are shown with bold outlines.
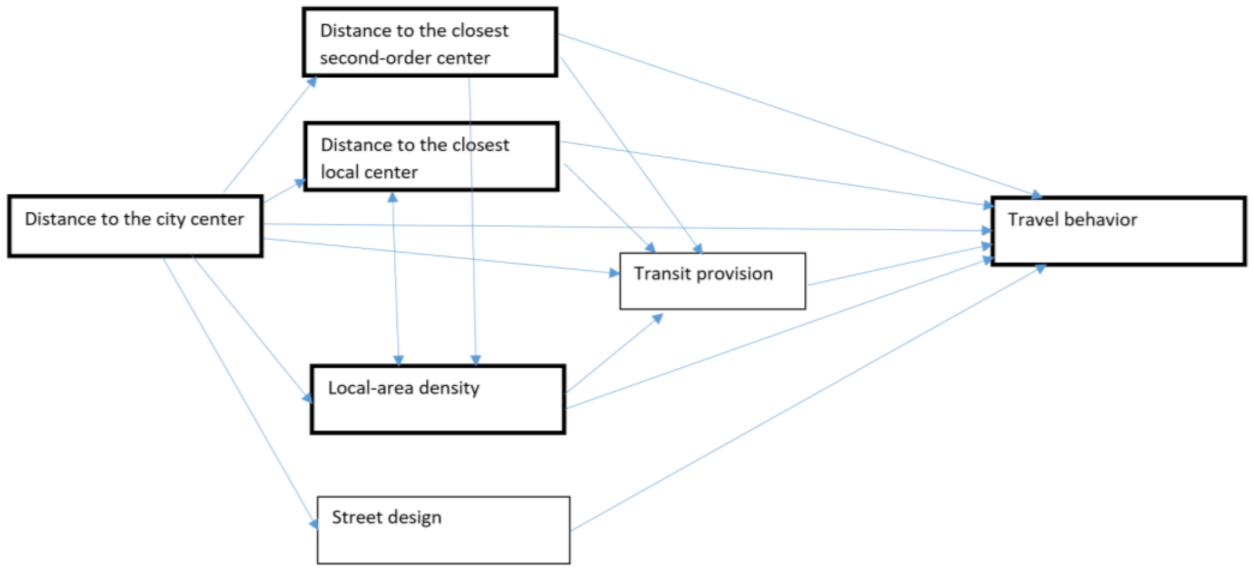
Figure 2.
The morphological city of the Reykjavik capital area as of 2020. Urbanized land is shown in orange, main roads in white, forested land in green, open land in light gray, and water in blue. The blue asterisk indicates the location of the downtown area of Reykjavik. The graph in the right bottom of the figure shows the population growth of the urban settlement since 2000. (Adapted from ref. [70]).
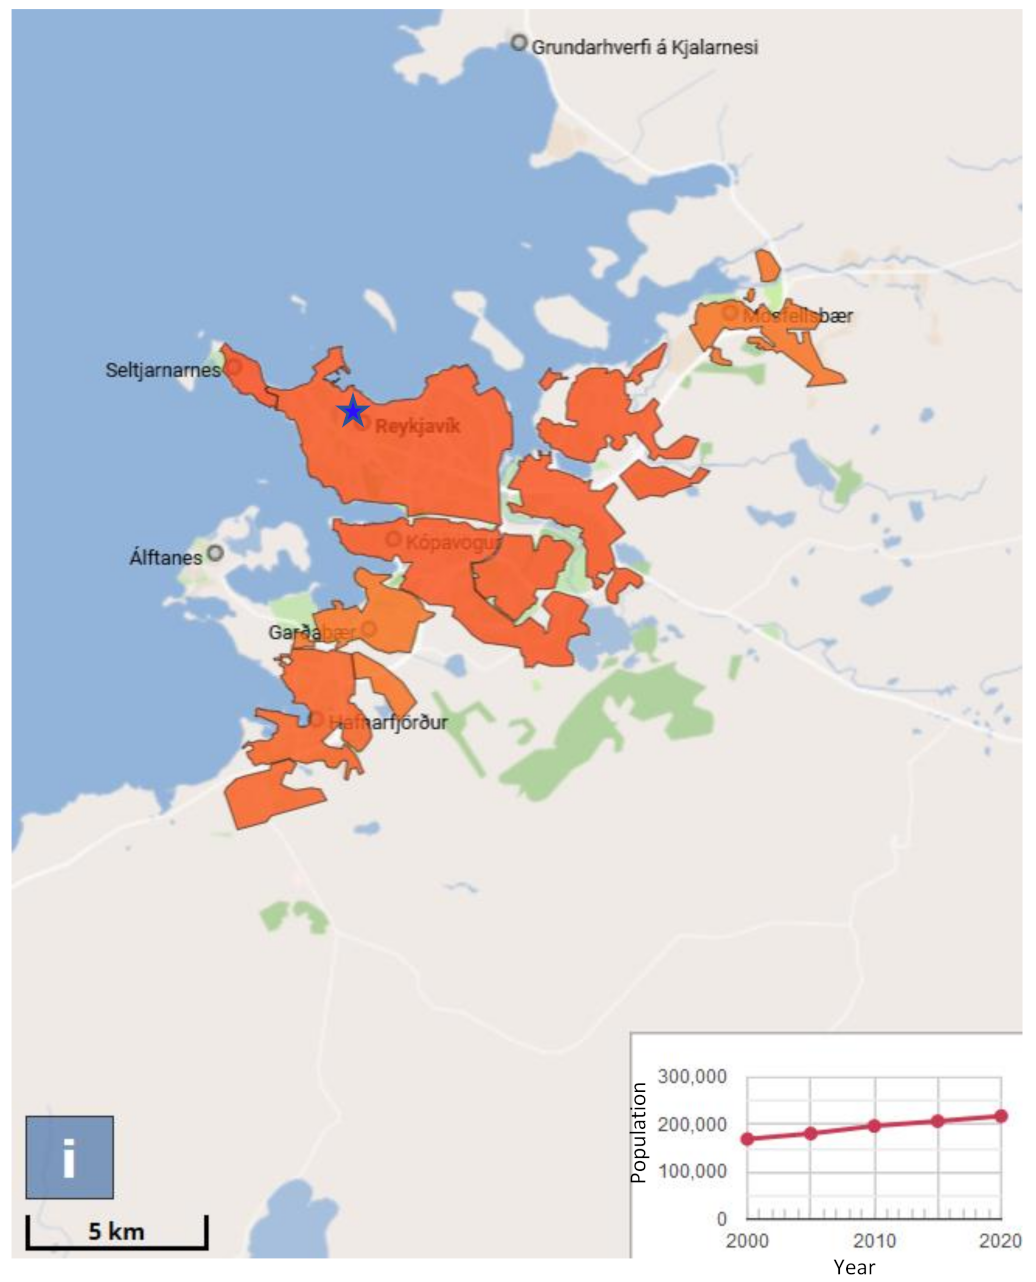
Figure 3.
Local population density (above) and floor area density for commercial and office functions (below) calculated in 500 m buffers around residential locations at different distances from the city center of Reykjavik. Data source: [73].
Figure 3.
Local population density (above) and floor area density for commercial and office functions (below) calculated in 500 m buffers around residential locations at different distances from the city center of Reykjavik. Data source: [73].

Figure 4.
Locations of the main city center of Reykjavik, second-order centers and other centers, as well as the residences of interview participants and survey respondents.
Figure 4.
Locations of the main city center of Reykjavik, second-order centers and other centers, as well as the residences of interview participants and survey respondents.
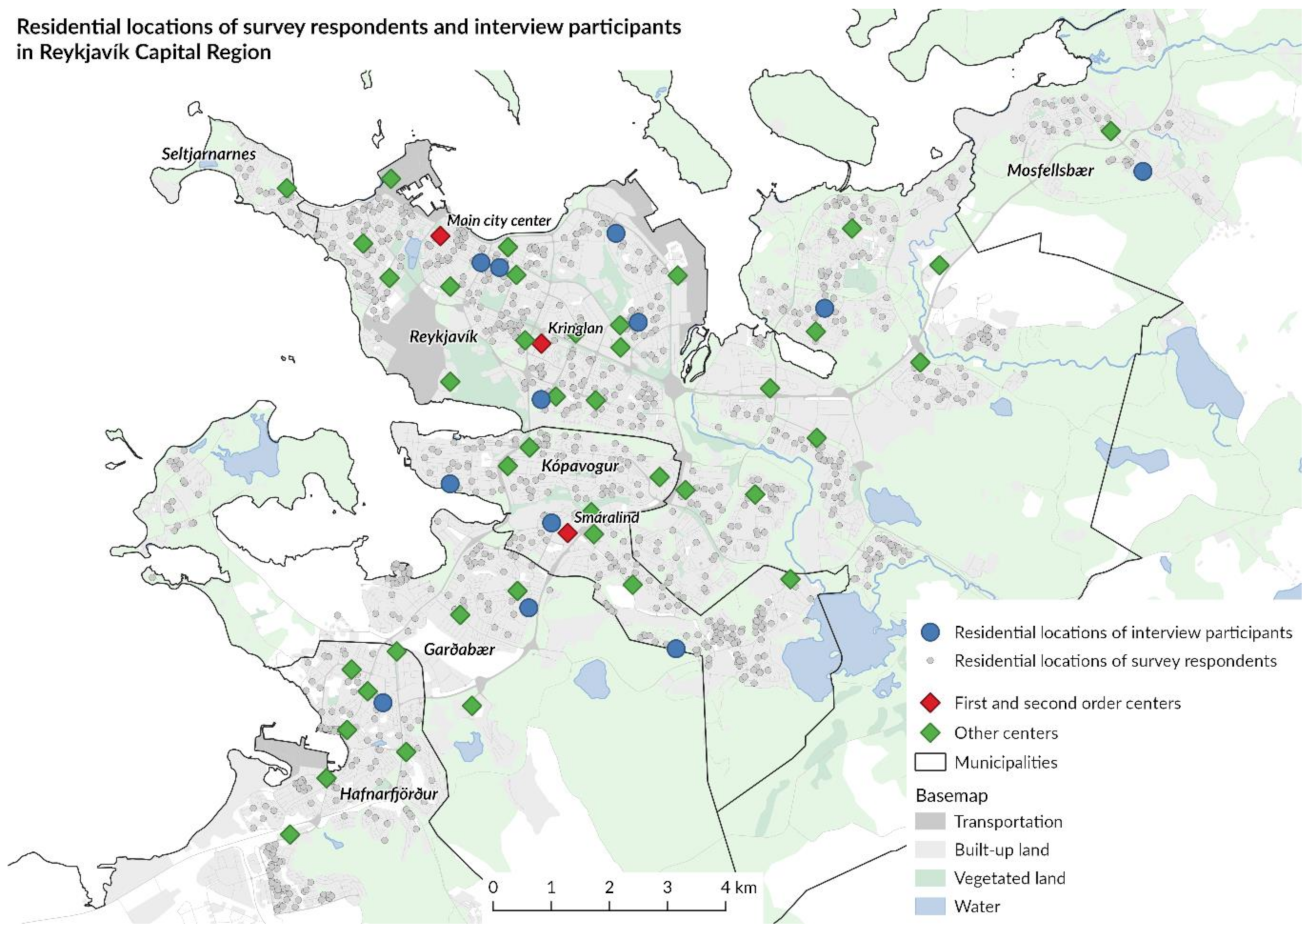
Figure 5.
Parking space around office buildings at Borgartun, only 1.5 km from the city center of Reykjavik.
Figure 5.
Parking space around office buildings at Borgartun, only 1.5 km from the city center of Reykjavik.
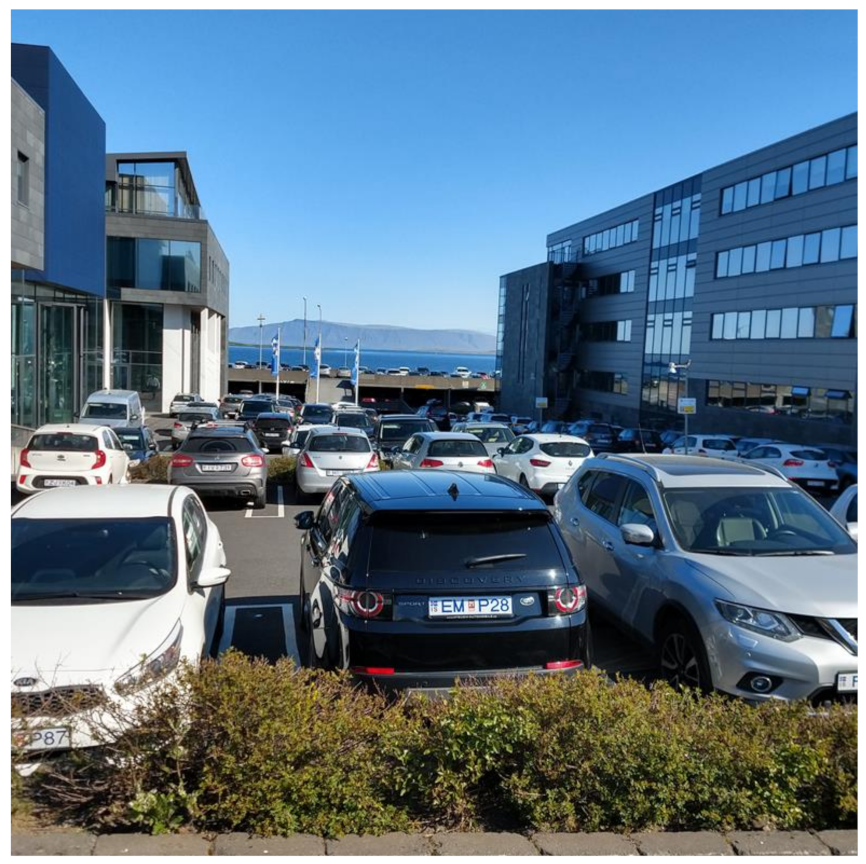
Figure 6.
Weekly GIS-measured commuting distances (left) and self-reported weekly travel distances for seven intra-metropolitan non-work purposes (right) by different modes among respondents living in different distance belts form the city center of Reykjavik. N = 528–783 (commuting) and 809–1058 (non-work purposes). “Motorcycle or other” is shown only for commuting. Respondents with extreme commuting distances, defined as more than three interquartile ranges above the upper quartile [89], i.e., with their workplace located more than 31 km from the residence, were excluded as well as workers whose workplace is in their home (i.e., with no out-of-home workplace.
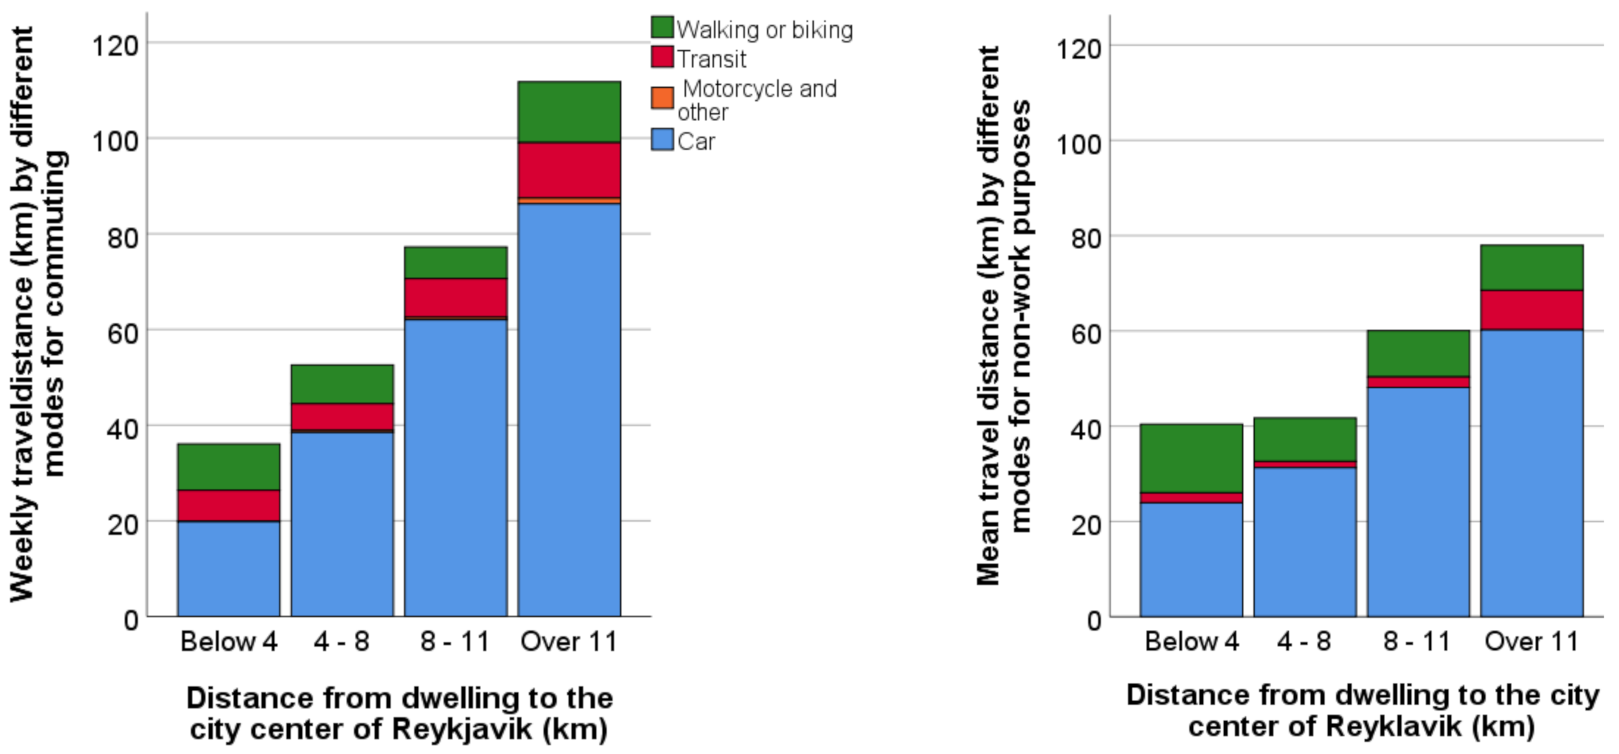
Figure 7.
Mean daily car-driving distances (including travel outside the metropolitan area) for Monday–Friday (blue) and Saturday–Sunday (red) in typical weeks during the winter and spring among respondents living in different distance belts from the city center of Reykjavik. N = 941 and 919, respectively. Respondents with extreme weekly driving distances (more than 81.5 km per day on average for the winter and spring week) have been excluded.

Figure 8.
Changes in commuting distances after having moved closer to or farther away from the city center of Reykjavik. N = 275.
Figure 8.
Changes in commuting distances after having moved closer to or farther away from the city center of Reykjavik. N = 275.
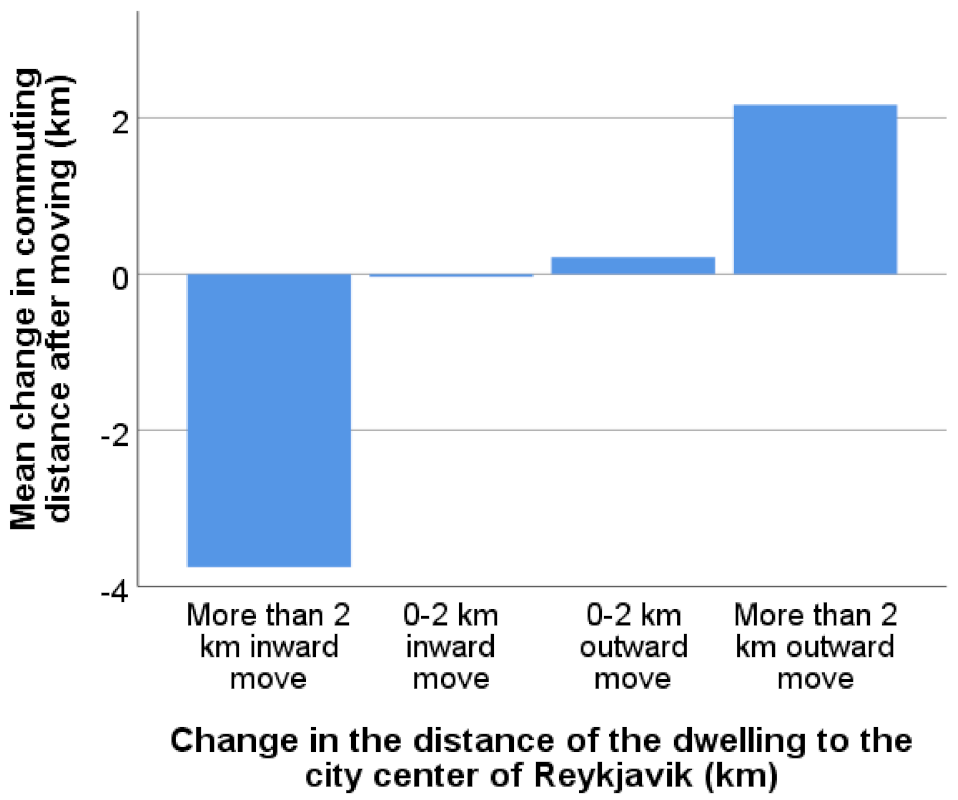
Table 1.
Generalized linear regression analysis (scale linear) on the associations of built environment characteristics, sociodemographic characteristics, and residential preferences with GIS-measured commuting distances. N = 688, R2 = 0.457. Apart from the built environment characteristics, only variables whose effects had a significance level below 0.1 were included in the table. Respondents with extreme commuting distances (i.e., with their workplace located more than 31 km from the residence) were excluded as well as workers whose workplace is in their home (i.e., with no out-of-home workplace).
| Estimate | Robust Standard Error | 95% CI | p-Value | |
|---|---|---|---|---|
| Built environment characteristics | ||||
| Distance from residence to the city center of Reykjavik (km) | 0.491 | 0.046 | (0.401–0.582) | 0.000 |
| Distance from residence to the Smáralind second-order center (km) | 0.067 | 0.052 | (−0.034–0.168) | 0.192 |
| Distance from residence to the closest local center (km) | 0.148 | 0.271 | (−0.382–0.679) | 0.583 |
| Inhabitants per hectare within the 1 km2 circle around the dwelling | −0.0026 | 0.0115 | (−0.025–0.020) | 0.824 |
| Demographic and socioeconomic characteristics | ||||
| Driver’s license for a car | 1.160 | 0.524 | (2.188–4.894) | 0.027 |
| Personal income level | 0.088 | 0.042 | (0.006–0.171) | 0.036 |
| Number of household members below 7 years of age | 0.452 | 0.238 | (−0.015–0.919) | 0.058 |
| Residential preferences | ||||
| Preference for proximity to workplace | −1.341 | 0.157 | (−1.649–−1.034) | 0.000 |
| Preference for proximity to a grocery store | 0.529 | 0.175 | (0.186–0.871) | 0.003 |
| Preference for good opportunities for physical exercise | 0.304 | 0.155 | (0.000–0.608) | 0.050 |
| Preference for proximity to green areas | −0.288 | 0.158 | (−0.598–0.022) | 0.068 |
| Constant | −0.898 | 1.499 | (−3.835–2.040) | 0.549 |
Table 2.
Generalized linear regression analysis (binary logistic) on the associations of built environment characteristics, sociodemographic characteristics, and residential preferences with the likelihood of commuting by car at least four days during the week. N = 658, Nagelkerke R2 = 0.353. Apart from the built environment characteristics, only variables whose effects had a significance level below 0.1 were included in the table. Respondents with extreme commuting distances (i.e., with their workplace located more than 31 km from the residence) were excluded, as well as workers whose workplace is in their home (i.e., with no out-of-home workplace).
| Estimate | Robust Standard Error | 95% CI | p-Value | |
|---|---|---|---|---|
| Built environment characteristics | ||||
| Distance from residence to the city center of Reykjavik (km) | 0.157 | 0.038 | (0.083–0.232) | 0.000 |
| Distance from residence to the closest local center (km) | −0.158 | 0.181 | (−0.512–0.196) | 0.383 |
| Inhabitants per hectare within the 1 km2 circle around the dwelling | 0.002 | 0.009 | (−0.016–0.020) | 0.825 |
| Distance from residence to the Smáralind second-order center (km) | 0.005 | 0.394 | (−0.072–0.082) | 0.897 |
| Demographic and socioeconomic characteristics | ||||
| Driver’s license for a car | 2.632 | 0.790 | (1.083–4.181) | 0.001 |
| Female | 0.536 | 0.213 | (0.118–0.953) | 0.012 |
| Residential preferences | ||||
| Preference for proximity to a bus stop | −0.652 | 0.112 | (−0.871–−0.434) | 0.000 |
| Preference for proximity to workplace | −0.333 | 0.121 | (−0.871–−0.434) | 0.006 |
| Preference for easy access to shopping mall | 0.354 | 0.138 | (−0.084–−0.624) | 0.010 |
| Preference for undisturbed location | 0.338 | 0.140 | (0.064–0.611) | 0.015 |
| Preference for good opportunities for physical exercise | −0.273 | 0.119 | (−0.507–−0.039) | 0.022 |
| Preference for low housing costs | −0.196 | 0.098 | (−0.389–−0.004) | 0.046 |
| Preference for private garden | 0.169 | 0.095 | (−0.018–0.356) | 0.076 |
| Constant | 4.61 | 1.31 | (2.03–7.19) | 0.000 |
Table 3.
Generalized linear regression analysis (scale linear) on the associations of built environment characteristics, sociodemographic characteristics, and residential preferences with the modal share of car travel for trips to grocery stores. N = 905, R2 = 0.302. Apart from the built environment characteristics, only variables whose effects had a significance level below 0.1 were included in the table.
| Estimate | Robust Standard Error | 95% CI | p-Value | |
|---|---|---|---|---|
| Built environment characteristics | ||||
| Logarithm of distance from residence to the city center of Reykjavik (km) | 0.064 | 0.016 | (0.031–0.096) | 0.000 |
| Logarithm of distance from residence to the closest local center (km) | 0.049 | 0.017 | (0.017–0.082) | 0.003 |
| Inhabitants per hectare within the 1 km2 circle around the dwelling | −0.0017 | 0.0009 | (−0.0033–0.0000) | 0.052 |
| Logarithm of distance from residence to the Smáralind second-order center (km) | 0.000 | 0.017 | (−0.034–0.034) | 0.990 |
| Demographic and socioeconomic characteristics | ||||
| Driver’s license for a car | 0.277 | 0.061 | (0.158–0.397) | 0.000 |
| Workforce participation (yes = 1, no = 0) | 0.057 | 0.024 | (0.009–0.104) | 0.019 |
| Personal income level | 0.006 | 0.003 | (0.000–0.012) | 0.070 |
| Residential preferences | ||||
| Preference for proximity to a bus stop | −0.057 | 0.009 | (−0.074–−0.039) | 0.000 |
| Preference for easy access to shopping mall | 0.040 | 0.012 | (0.016–0.064) | 0.001 |
| Preference for undisturbed location | 0.044 | 0.014 | (0.018–0.071) | 0.001 |
| Preference for proximity to a grocery store | −0.035 | 0.014 | (−0.062–−0.008) | 0.011 |
| Preference for location not close to major road | −0.019 | 0.010 | (−0.039–0.001) | 0.059 |
| Constant | 0.330 | 0.107 | (0.121–0.539) | 0.002 |
Table 4.
Generalized linear regression analysis (scale linear) on the associations of built environment characteristics, sociodemographic characteristics, and residential preferences with average daily self-reported car-driving distances during typical whole weeks in the winter and spring. N = 823, R2 = 0.194. Apart from the built environment characteristics, only variables whose effects had a significance level below 0.1 were included in the table. Respondents with extreme weekly driving distances (more than 81.5 km per day on average for the winter and spring week) were excluded.
| Estimate | Robust Standard Error | 95% CI | p-Value | |
|---|---|---|---|---|
| Built environment characteristics | ||||
| Distance from residence to the city center of Reykjavik (km) | 0.787 | 0.182 | (0.430–1.145) | 0.000 |
| Distance from residence to the closest local center (km) | 1.430 | 0.459 | (0.530–2.331) | 0.002 |
| Distance from residence to the Smáralind second-order center (km) | −0.140 | 0.204 | (−0.541–0.260) | 0.492 |
| Inhabitants per hectare within the 1 km2 circle around the dwelling | −0.032 | 0.049 | (−0.128–0.065) | 0.520 |
| Demographic and socioeconomic characteristics | ||||
| Female | −7.243 | 1.107 | (−9.412–−5.074) | 0.000 |
| Driver’s license for a car | 9.038 | 2.827 | (3.499–14.58) | 0.001 |
| Age | 0.075 | 0.045 | (−0.013–0.162) | 0.094 |
| Residential preferences | ||||
| Preference for proximity to a bus stop | −1.793 | 0.516 | (−2.805–−0.781) | 0.001 |
| Preference for neighborhood without social problems | −1.597 | 0.613 | (−2.797–−0.396) | 0.009 |
| Preference for a familiar neighborhood | 1.253 | 0.548 | (0.178–2.327) | 0.022 |
| Constant | 7.23 | 6.49 | (−5.48–19.95) | 0.265 |
Table 5.
Generalized linear regression analysis (scale linear) on the associations of built environment characteristics, sociodemographic characteristics, and residential preferences with increase in commuting distance after moving. N = 225, R2 = 0.433. Persons whose commuting distance decreased were registered with a negative increase. Apart from the built environment characteristics, only variables whose effects had a significance level below 0.1 were included in the table. Respondents whose commuting distance changed by more than 30 km were excluded, as were respondents whose residential distance from the city center changed by more than 50 km.
| Estimate | Robust Standard Error | 95% CI | p-Value | |
|---|---|---|---|---|
| Built environment characteristics | ||||
| Change in distance from residence to the city center of Reykjavik (km) | 0.341 | 0.075 | (0.194–0.488) | 0.000 |
| Change in distance from residence to the Smáralind second-order center (km) | 0.242 | 0.070 | (0.116–0.389) | 0.000 |
| Change in distance from residence to the closest local center (km) | −0.224 | 0.204 | (−0.624–0.175) | 0.271 |
| Change in inhabitants per hectare within the 1 km2 circle around the dwelling | −0.0022 | 0.0056 | (−0.013–0.009) | 0.691 |
| Demographic and socioeconomic characteristics | ||||
| Number of household members aged 7–17 | 0.467 | 0.230 | (0.015–0.919) | 0.043 |
| Residential preferences | ||||
| Preference for proximity to workplace | −0.412 | 0.180 | (−0.765–−0.059) | 0.022 |
| Preference for proximity to a grocery store | 0.397 | 0.209 | (−0.029–0.823) | 0.068 |
| Preference for neighborhood without social problems | −0.287 | 0.159 | (−0.598–0.024) | 0.071 |
| Constant |
Table 6.
Generalized linear regression analysis (scale linear) on the associations of built environment characteristics with the likelihood of having increased the amount of travel totally and by different modes because of moving. Estimates, robust standard error (in parentheses), and p-values.
Table 6.
Generalized linear regression analysis (scale linear) on the associations of built environment characteristics with the likelihood of having increased the amount of travel totally and by different modes because of moving. Estimates, robust standard error (in parentheses), and p-values.
| Trip Purpose | Increase in Total Amount of Travel (N = 340) | Increase in Travel by Car (N = 336) | Increase in Travel by Transit (N = 332) | Increase in Travel by Non-Motorized Modes (N = 336) | ||||
|---|---|---|---|---|---|---|---|---|
| Estimate and Robust Std. Error | p-Value | Estimate and Robust Std. Error | p-Value | Estimate and Robust Std. Error | p-Value | Estimate and Robust Std. Error | p-Value | |
| Increase in the distance (in km) to the main city center | 0.167 (0.049) | 0.001 | 0.176 (0.046) | 0.000 | 0.099(0.050) | 0.049 | −0.117 (0.045) | 0.009 |
| Increase in the distance (in km) to the Smáralind second-order center | 0.163 (0.052) | 0.002 | 0.165 (0.064) | 0.002 | 0.035 (0.056) | 0.535 | 0.057 (0.049) | 0.241 |
| Increase in the distance (in km) to the closest local center | 0.210 (0.151) | 0.166 | 0.260 (0.157) | 0.098 | −0.023 (0.217) | 0.916 | −0.009 (0.151) | 0.950 |
| Increase in inhabitants per hectare within the 1 km2 circle around the dwelling | 0.000 (0.0043) | 0.953 | −0.0006 (0.0043) | 0.881 | −0.000 (0.0061) | 0.975 | −0.0047 (0.0044) | 0.280 |
Table 7.
Rationales for activity location and their implications for geographical differences (inner-city, suburban centers, and non-central locations) in trip distances compared to the trip distances of persons with “average” residential locations.
Table 7.
Rationales for activity location and their implications for geographical differences (inner-city, suburban centers, and non-central locations) in trip distances compared to the trip distances of persons with “average” residential locations.
| Rationales for Location of Activities | Encourages Trip Distances among Inner-City Residents to Become | Encourages Trip Distances among Residents Living Close to Suburban Centers to Become | Encourages Trip Distances among Residents Living at Non-Central Locations to Become |
|---|---|---|---|
| Main rationales, applying to commuting as well as non-work trips: | |||
| Choosing the “best facility” | |||
| Generally | Shorter | Somewhat longer | Considerably longer |
| Workplace/place of education | Considerably shorter | Longer | Considerably longer |
| Non-work facilities | Shorter | Somewhat shorter | Longer |
| Minimizing the friction of distance | |||
| Generally | Shorter | Shorter | Longer |
| Accessibility by car | Longer | Somewhat shorter | Somewhat longer |
| Accessibility by non-motorized modes | Considerably shorter | Shorter | Longer |
| Less important rationales, applying mainly to non-wok trips: | |||
| Social contacts | Shorter | Somewhat shorter | Longer |
| Variety-seeking | Somewhat shorter | Slightly shorter | Somewhat longer |
| Place attachment | Ambiguous effect | Ambiguous effect | Ambiguous effect |
| Urban atmosphere | Somewhat shorter | Somewhat longer | Longer |
Table 8.
Travel mode choice rationales and their implications for geographical differences in travel mode choices compared to the typical travel mode choices of persons with “average” residential locations.
Table 8.
Travel mode choice rationales and their implications for geographical differences in travel mode choices compared to the typical travel mode choices of persons with “average” residential locations.
| Rationales for Travel Mode Choice | Travel Modes Encouraged for Inner-City Residents | Travel Modes Encouraged for Residents Living Close to Suburban Centers | Travel Modes Encouraged for Residents Living at Non-Central Locations |
|---|---|---|---|
| Main rationales | |||
| Time-saving | Non-motorized (local trips) and car (longer trips) | Car | Car |
| Convenience and comfort | Non-motorized (local trips) and car (longer trips) | Car | Car |
| Physical exercise | More non-motorized trips | More non-motorized trips | More non-motorized trips |
| Frustration aversion | Non-motorized | Car | Car |
| Secondary, less important rationales | |||
| Ingrained habits | Depending on background | Depending on background | Car |
| Economic expenses | Transit and non-motorized | Transit and non-motorized | Transit and non-motorized |
| Safety | Motorized | Motorized | Motorized |
| Social contact | All modes | All modes | All modes |
| Caretaking | Most often car | Most often car | Most often car |
| Environmental concerns | Non-motorized and transit | Non-motorized and transit | Non-motorized and transit |
Publisher’s Note: MDPI stays neutral with regard to jurisdictional claims in published maps and institutional affiliations. |
© 2021 by the authors. Licensee MDPI, Basel, Switzerland. This article is an open access article distributed under the terms and conditions of the Creative Commons Attribution (CC BY) license (https://creativecommons.org/licenses/by/4.0/).
Share and Cite
MDPI and ACS Style
Næss, P.; Stefansdottir, H.; Peters, S.; Czepkiewicz, M.; Heinonen, J. Residential Location and Travel in the Reykjavik Capital Region. Sustainability 2021, 13, 6714. https://doi.org/10.3390/su13126714
AMA Style
Næss P, Stefansdottir H, Peters S, Czepkiewicz M, Heinonen J. Residential Location and Travel in the Reykjavik Capital Region. Sustainability. 2021; 13(12):6714. https://doi.org/10.3390/su13126714
Chicago/Turabian StyleNæss, Petter, Harpa Stefansdottir, Sebastian Peters, Michał Czepkiewicz, and Jukka Heinonen. 2021. "Residential Location and Travel in the Reykjavik Capital Region" Sustainability 13, no. 12: 6714. https://doi.org/10.3390/su13126714
Note that from the first issue of 2016, this journal uses article numbers instead of page numbers. See further details here.