Article

Environmental Behaviors of Procymidone in Different Types of Chinese Soil

1
Jiangsu Key Laboratory of Pesticide, Nanjing Agricultural University, Nanjing 210095, China
2
College of Sciences, Nanjing Agricultural University, Nanjing 210095, China
3
College of Plant Protection, Nanjing Agricultural University, Nanjing 210095, China
*
Author to whom correspondence should be addressed.
These two authors contributed equally.
Sustainability 2021, 13(12), 6712; https://doi.org/10.3390/su13126712
Submission received: 25 April 2021 / Revised: 9 June 2021 / Accepted: 10 June 2021 / Published: 13 June 2021
(This article belongs to the Special Issue Environmental Education and Green Behavior)

Abstract

:
Procymidone is a widely used fungicide in the prevention and treatment of fungal diseases on many crops in China. Part of the procymidone will enter the soil during the application process. Procymidone may exhibit environmental behavior diversity in different soils. Therefore, it is extremely important to clarify the environmental behavior of procymidone in soil for its environmental safety evaluation. Here, the degradation, adsorption, and mobility behaviors of procymidone in four typical types of Chinese soil were investigated for the first time. The half-lives of procymidone in the soils ranged from 14.3 d to 24.1 d. The degradation rates of procymidone in the soils were promoted by organic matter content, moisture content, and microorganisms. Furthermore, the degradation of procymidone on the soil surface was promoted by light. The desorption rates of procymidone in laterite soil, yellow brown soil, black soil, and chestnut soil were 27.52 ± 0.85%, 16.22 ± 0.78%, 13.67 ± 1.29%, and 7.62 ± 0.06%, respectively, which were contrary to the adsorption ability. The mobility order of procymidone in the soils was: laterite soil > yellow brown soil > black soil > chestnut soil, with the Rf values of 0.28, 0.22, 0.18, and 0.16, respectively. Three degradation products of procymidone were identified by liquid chromatography coupled with quadrupole/time-of-flight mass spectrometry, and the degradation pathway of procymidone in the soil was speculated. The results will provide a theoretical basis for the removal of procymidone in the soil environment.

1. Introduction

Pesticides play an important role in improving the yield of crops by preventing and treating plant diseases, pests, and weeds [1]. According to statistics, only a small amount of the applied pesticides reaches the target plant, and most of them are scattered in the environment [2]. Soil is the most important passive receptor for pesticides. Pesticides may disrupt the ecology of the soil environment and act as contaminants, affecting human health. Adsorption, mobility, and degradation are the main environmental behaviors for pesticides in soil. These behaviors are affected by a series of biological or abiotic factors [3]. For example, the physicochemical properties of both pesticides (structure, solubility, concentration, etc.) and soil (pH, clay and organic matter content, etc.) affect the adsorption and degradation of the pesticides in soil [4]. The microbial activity also plays an important role in the degradation of pesticides in soil [5]. In addition, pesticides transfer from soil to water by leaching and runoff and negatively influence aquatic environments and non-targeted organisms [6]. Therefore, it is necessary for researchers to illustrate the environmental fate of pesticides in soil.
Procymidone (N-(3,5-dichlorophenyl)-1,2-dimethylcyclopropane-1,2-dicarboximide) is widely used to control Sclerotinia sclerotiorum (Lib.), Botrytis cinerea, and Pestalotia eriobofolia Desm as a preventive and curative fungicide [7]. At present, there are 117 procymidone products within the valid period of registration in China, including 7 original medicines, 56 wettable powders, 15 suspending agents, 6 water-dispersible granules, 32 smoke agents, and 1 smoke tablet. The main application methods are spraying and igniting smoke. The registered crops include tomato, cucumber, grape and oilseed rape (http://www.icama.org.cn/fwb/index.jhtml, 16 May 2021). Some studies have focused on the environmental fate of procymidone. The attenuation and transport behaviors of procymidone in a volcanic pumice sand aquifer were studied by field tracer experiments [8]. Sarmah et al. found that the half-lives of procymidone ranged from 13 d to 60 d in two types of New Zealand soils under laboratory conditions [3]. The previous study found that both chemical and biological processes have important roles in the degradation of procymidone in coastal sand aquifer media. The metabolism of procymidone has also generated much attention [9]. The metabolism and excretion differences of procymidone between rats and humans were illustrated; in contrast to rats, humans extensively metabolized procymidone through glucuronide conjugation and excreted the conjugates in urine [10]. Two metabolites of procymidone in isopropanol and four metabolites in beans and cucumbers were reported [11,12]. To date, the environmental behaviors and metabolites of procymidone in soil have not been systematically studied.
The widespread use of procymidone is bound to cause environmental residue, especially residues in soil. Therefore, paying attention to the environmental behavior of procymidone in the soil is important for its environmental ecological risk management and control. In this study, the degradation, adsorption, and mobility of procymidone in different types of soil were studied by incubation experiments. Moreover, the degradation products of procymidone in soil were identified by liquid chromatography coupled with quadrupole/time-of-flight mass spectrometry (LC-Q-TOF-MS/MS).

2. Materials and Methods

2.1. Chemicals and Reagents

Procymidone (purity, 99.5%) was purchased from Beijing Helishun Technology Co., Ltd., China. LC-grade acetonitrile was purchased from TEDIA (Fairfield, CT, USA). The other analytical pure chemical reagents including acetone, sodium chloride, and anhydrous sodium sulfate, which were acquired through commercial sources. Ultra-pure water was obtained using MUL-9000 water purification systems (Nanjing Zongxin Water Equipment Co. Ltd., Nanjing, China).

2.2. Soil Samples

Four types of soil (top 20-cm layer) including black soil, laterite soil, chestnut soil, and yellow brown soil were collected from Ji Lin (44.36° N, 126.18° E), Jiang Xi (28.2° N, 117.0° E), Qinghai (36.8° N, 102.0° E), and Jiang Su (32.26° N, 118.50° E), respectively. The physicochemical properties of the soils are shown in Supplementary Material (Table S1). These soils are the main types of agricultural soil in China from different climatic environments with different physicochemical properties. The collected soils were air-dried, ground, sieved through a 2-mm mesh, and stored at 4 ± 2 °C in the dark (less than half a year).

2.3. Degradation of Procymidone in the Soils

The soil moisture content was adjusted to 24% by ultra-pure water, and the soils were preincubated at 25 °C for 14 d before the experiments. Black soil, laterite soil, chestnut soil, and yellow brown soil were used to study the degradation of procymidone in different types of soil. Yellow brown soil was selected as the typical soil to study the effects of the moisture content, microorganisms, organic matter, and light on the degradation of procymidone. The absolute water content was set to 10%, 20%, 30%, 40%, and a waterlogged condition (a water layer of approximately 1 cm on the top of the soil surface) by adding ultra-pure water. The soil microorganisms were removed by autoclaving twice for 20 min at 121 °C (111 kPa). The organic matter in the soil was removed by hydrogen peroxide. Briefly, approximately 100 g soil was added to a 2 L beaker with 25 mL of ultra-pure water. Then, 25 mL of 30% H2O2 was added slowly, and the mixture was stirred until no heat was released. After the reaction, the soil was washed with ultra-pure water until the conductivity of the solution was less than 50 µS.
The spiked concentrations of procymidone in the degradation experiments were 2 mg/kg. Five grams of the procymidone-contaminated soil (dry weight) were weighed into 50 mL centrifuge tubes. After recording the weight, the soils were incubated at 25 °C in darkness. The soils were weighed regularly, and ultra-pure water was replenished to maintain moisture of 24% (or the set amount in the experiment of moisture content). The samples were collected at different time points (0, 1, 3, 7, 14, 21, 28, 35 d) and immediately transferred to a freezer (−20 °C) for determination.
The soil surface photolysis tests were used to explore the effect of light on procymidone degradation in soil. The photolysis experiments were performed with an ultraviolet lamp. Four grams of soil were evenly paved in a quartz glass dish with a diameter of 9 cm [13,14]. The n-hexane dissolved procymidone was evenly dripped onto the soil surface, reaching a concentration of 5 mg/kg. The soil moisture was adjusted to 24% and covered with a quartz glass. The quartz glass dish was put on the light rotating plate, the distance between the quartz glass dish and the light source was adjusted to 10 cm, the temperature was kept at 25 ± 0.5 °C, the intensity of the ultraviolet lamp was 3.00 MW cm–2, and the rated power was 8 W × 2. The soil was sampled for HPLC analysis after the illumination of 2 h, and 1, 3, 5, and 7 d. The above treatments were performed in triplicate.
The degradation of procymidone in soil was described by a first order kinetic equation. The degradation equations and half-lives of procymidone under different conditions were calculated as the following equations:
Ct = Co e−kt
T1/2 = ln2/k = 0.693/k
where Ct is the mass concentration (mg/kg) of procymidone at time t, C0 is the initial mass concentration (mg/kg) of procymidone, and the half-life of T1/2 is the 50% procymidone degradation time.

2.4. Adsorption and Desorption of Procymidone in Soil

The adsorption and desorption tests of procymidone in soil were conducted in 250 mL triangular flasks. For the adsorption kinetics experiment, 5 g of soil were weighed into the flask, and then 25 mL of 0.01 mol/L CaCl2 solution containing 2.0 mg/L of procymidone were added. The flask was shaken in an oscillator at 180 rpm and 25 °C. After 0.5, 1, 2, 4, 8, 12, and 24 h, 2 mL of the solution was transferred to 4 mL centrifuge tubes and centrifuged at 900× g for 5 min. The supernatant was transferred to a sample bottle by a 0.22 mm nylon syringe filter for HPLC analysis.
The desorption experiment was conducted as follows: First, the mixture (5 g of soil and 25 mL of 0.01 mol/L CaCl2 solution containing 2.0 mg/L) was shaken in oscillator at 180 rpm and 25 °C for 24 h to make procymidone reach adsorption equilibrium in the soil. Then, the mixture was centrifuged at 900× g for 5 min, and the CaCl2 solution was poured out. Next, 25 mL of 0.01 mol L−1 CaCl2 solution was used to resuspend the soil, which was shaken at 180 rpm at 25 °C for another 24 h. After centrifugation, the concentration of procymidone in the solution was detected by HPLC. The above tests were performed in triplicate, and a blank control was set up.
The adsorption and desorption rates were calculated from Equations (3) and (4):
A = 100 (M − Ce × V0)/M = 100x/M
where A is the adsorption rate, M (mg) is the content of procymidone in the initial water solution without soil, Ce (mg/L) is the content of procymidone in the water solution after soil adsorption equilibrium, V0 (mL) is the aqueous solution volume, and x (mg) is the content of procymidone adsorbed in the soil.
D = 100 [C × V − (V0 − V) × Ce]/x
where D is the desorption rate, C (mg L−1) is the content of procymidone before the desorption experiment, Ce (mg L−1) is the content of procymidone in the water solution after soil desorption equilibrium, V (mL) is the volume of the water solution after the desorption experiment, V0 (mL) is the volume of the water solution before the desorption experiment, and x (mg) is the content of procymidone in the soil before the desorption experiment.

2.5. Isothermal Adsorption Experiment

Five grams of soil were weighed into a triangular flask, and to it was added 25 mL of 0.01 mol/L CaCl2 solution containing a series of concentrations of procymidone (0.05, 0.2, 1.0, 2.0, and 5.0 mg/L). The mixture was shaken at 180 rpm and 25 °C for 24 h. After centrifugation of 5 min at 900× g, the concentration of procymidone in the solution was detected by HPLC. The Freundlich model was used to describe the isothermal adsorption behaviors, and the calculated equations as follows:
Cs = Kf Ce1/n
where Cs (mg/kg) is the content of procymidone adsorbed by the soil, Kf is the Freundlich adsorption constant, Ce (mg/L) is the content of procymidone in the water solution after soil adsorption equilibrium, and 1/n is the slope of the curve between Cs and Ce.
KOC = 100 Kf/OM%
where KOC is the organic adsorption coefficient, Kf is the Freundlich adsorption constant, and OM% is the soil organic matter content.

2.6. Mobility of Procymidone in Soil

2.6.1. Thin-Layer Chromatography

The soil mobility test was carried out by thin-layer chromatography (TLC). Ten grams of soil were mixed with 7 mL of ultra-pure water and evenly coated on a glass chromatographic plate with a size of 20 cm × 20 cm. The thickness of the soil was approximately 0.5–1 mm, and the surface of the soil plate was smooth. The prepared plate was placed in the shade to dry by ventilation. A line was drawn on the plate at 1.5 cm from the bottom by pencil, and 0.5 mL of 20 mg/L n-hexane-dissolved procymidone was dripped on the line. After volatilization of the solvent, the plate was set into the chromatographic trough with 0.5 cm of ultra-pure water. When water reached 2 cm in the front of the soil plate, the soil plate was dried and divided into six segments on average. The concentrations of procymidone in the segments were detected by HPLC. The Rf value can be calculated according to the following equation:
Rf = L/Lmax
where L (mm) is the moving distance of the pesticide, Lmax (mm) is the moving distance of water, and Rf is the ratio shift value.

2.6.2. Soil Column Leaching

Four hundred and fifty grams of soil were weighed in a PVC plastic pipe with an inner diameter of 5 cm and a column length of 35 cm. The PVC plastic pipe was fixed on a shelf, the bottom was sealed with gauze, and 108 mL of 0.01 mol L−1 CaCl2 was added slowly from the top to ensure an absolute water content of 24%. A 30 cm high soil column was maintained overnight until the water was evenly immersed into the soil. The top surface of the soil column was covered with 1 cm of quartz sand, and 5 mL of 100 mg/L procymidone–acetone solution was added to the surface of the quartz sand. The soil column was leached with 300 mL of the 0.01 mol L−1 CaCl2 solution by a peristaltic pump at a speed of 30 mL/h, and the leachate was collected. After leaching, the soil column was divided into three sections, and the content of procymidone in the sections and leachate were detected by HPLC. The percentage of soil column leaching was calculated according to the following formula:
R i = m i m 0 × 100 %
where Ri is the percentage of pesticide content in the soil and the leachate in each section, mi (mg) is the quality of procymidone in each soil section, m0 (mg) is the total amount of procymidone, i = 1, 2, and 3 represent soils from depths of 0–10 cm, 10–20 cm, and 20–30 cm, respectively.

2.7. Extraction and Analysis

The samples of soil (5 g) were extracted by 30 mL acetonitrile and 3 mL ultra-pure water with vortexing for 5 min and ultrasonic for 10 min. Four grams of NaCl and 1.5 g of magnesium sulfate anhydrous were added, the mixture was vortexed for 2 min and centrifuged for 5 min at 900× g. The organic phase was transferred to a flat-bottomed flask and evaporated. Finally, the residuum was dissolved with 2 mL of acetonitrile for HPLC detection. The quantitative determination of procymidone was performed on Agilent 1260 HPLC with an Eclipse Plus C18 column (4.6 mm × 150 mm, 4.0 μC). The column temperature was 30 °C, the flow rate was 1 mL/min, the mobile phase was acetonitrile and water with the rate of 60/40 (V/V), and the detection wavelength was set as 208 nm.

2.8. Identification of Procymidone Metabolites by LC-Q-TOF-MS/MS

LC-Q-TOF-MS/MS analysis was performed on a Shimadzu LC 20ADXR LC system with an AB SCIEX Triple TOF 5600 mass spectrometer. The autosampler temperature was set at 4 °C, and the injection volume was set as 5 µL. LC was performed using a Poroshell 120 EC-C18 207 column (2.7 µm, 2.1 mm × 50 mm, Agilent) and a gradient system with the mobile phase consisting of solvent A (ultra-pure water with 0.1% formic acid) and solvent B (methanol) at a flow rate of 0.3 mL/min. The gradient program was as follows: (1) 5% B at 0–0.5 min, 10%–60% B at 0.5–2.5 min, 60% B at 2.5–9 min, 60%–95% B at 9–10 min, and 95% B at 10–14 min; (2) back to the initial conditions; and (3) equilibrating for 1 min before the next sample was injected. The MS experiments were performed using an AB Sciex Triple TOF TM 5600 system with an Accelerator TOF TM Analyzer and an electrospray ionization source. The mass spectrometer was operated in the positive product ion mode. TOF-MS parameters included ion source gas 1 of 65 psi, ion source gas 2 of 65 psi, curtain gas of 35 psi, source temperature of 550 °C, and ion spray voltage of 5500 V. The APCI positive calibration solution for the AB SCIEX Triple TOF TM systems on calibration delivery system was employed every 2 samples to ensure a working mass accuracy of <5 ppm. PeakView and Masterview software were used for data processing.

3. Results

3.1. Method Validation

Different concentrations of procymidone standards (0.05, 0.1, 0.5, 1.0, 5.0, and 10.0 mg/L) were prepared by dilution with acetonitrile, and each concentration of standard was tested three times. The standard curve was established by plotting the analyte concentrations versus average peak areas. A good linearity was achieved in the range of 0.05 to 10 mg/L (R2 > 0.999). The accuracy and precision of this method were evaluated by the recoveries. The spiked concentrations of procymidone in the soils were 0.05, 0.2, and 2 mg/kg (n = 5); the average recoveries were 88.1–96.5% with RSD of 2.7–4.8%. The limit of quantification (LOQ) was defined as the lowest spiked concentration (0.05 mg/L) with satisfactory recoveries in the range of 70% to 120%. The limit of detection (LOD) was 0.0006 ng, which was calculated by 3 times of signal/noise. These results indicated that the analysis is accurate and repeatable.

3.2. Degradation of Procymidone in Soil

3.2.1. Degradation in Four Types of Soil

The degradation of procymidone in the four types of soil followed the first-order kinetic equation. The degradation kinetic parameters are shown in Table 1. The degradation rates from fast to slow were as follows: black soil > chestnut soil > yellow brown soil > laterite soil, with the half-lives of 14.3, 18.9, 20.2, and 24.1 d, respectively. Procymidone showed the fastest degradation rate in black soil, which might be caused by the highest content of organic carbon. However, the degradation rate order of procymidone in the soils was not completely consistent with the organic carbon content. The degradation was also affected by the soil pH. The degradation rate of procymidone ranked second in the chestnut soil with the highest pH.

3.2.2. Degradation in Soils with Different Moisture Content

The half-lives were 45.9, 20.4, 16.8, 15.1, and 11.3 d in the soils with the moisture contents of 10%, 20%, 30%, 40%, and waterlogged, respectively (Table 1). With the increase of moisture content, the degradation rate was accelerated, and the half-life was shortened noticeably.

3.2.3. Degradation in Removed Organic Matter and Sterilized Soils

As shown in Table 1, the half-lives of procymidone in the control, removed organic matter soil, sterilized soil, and removed organic matter and sterilized soil were 18.9, 30.4, 40.1, and 64.0 d, respectively. The degradation rates of procymidone in the treated soils were slower than control. Remarkably, the removed organic matter and sterilized soil showed the longest half-life, which was 3.4 times that of the control.

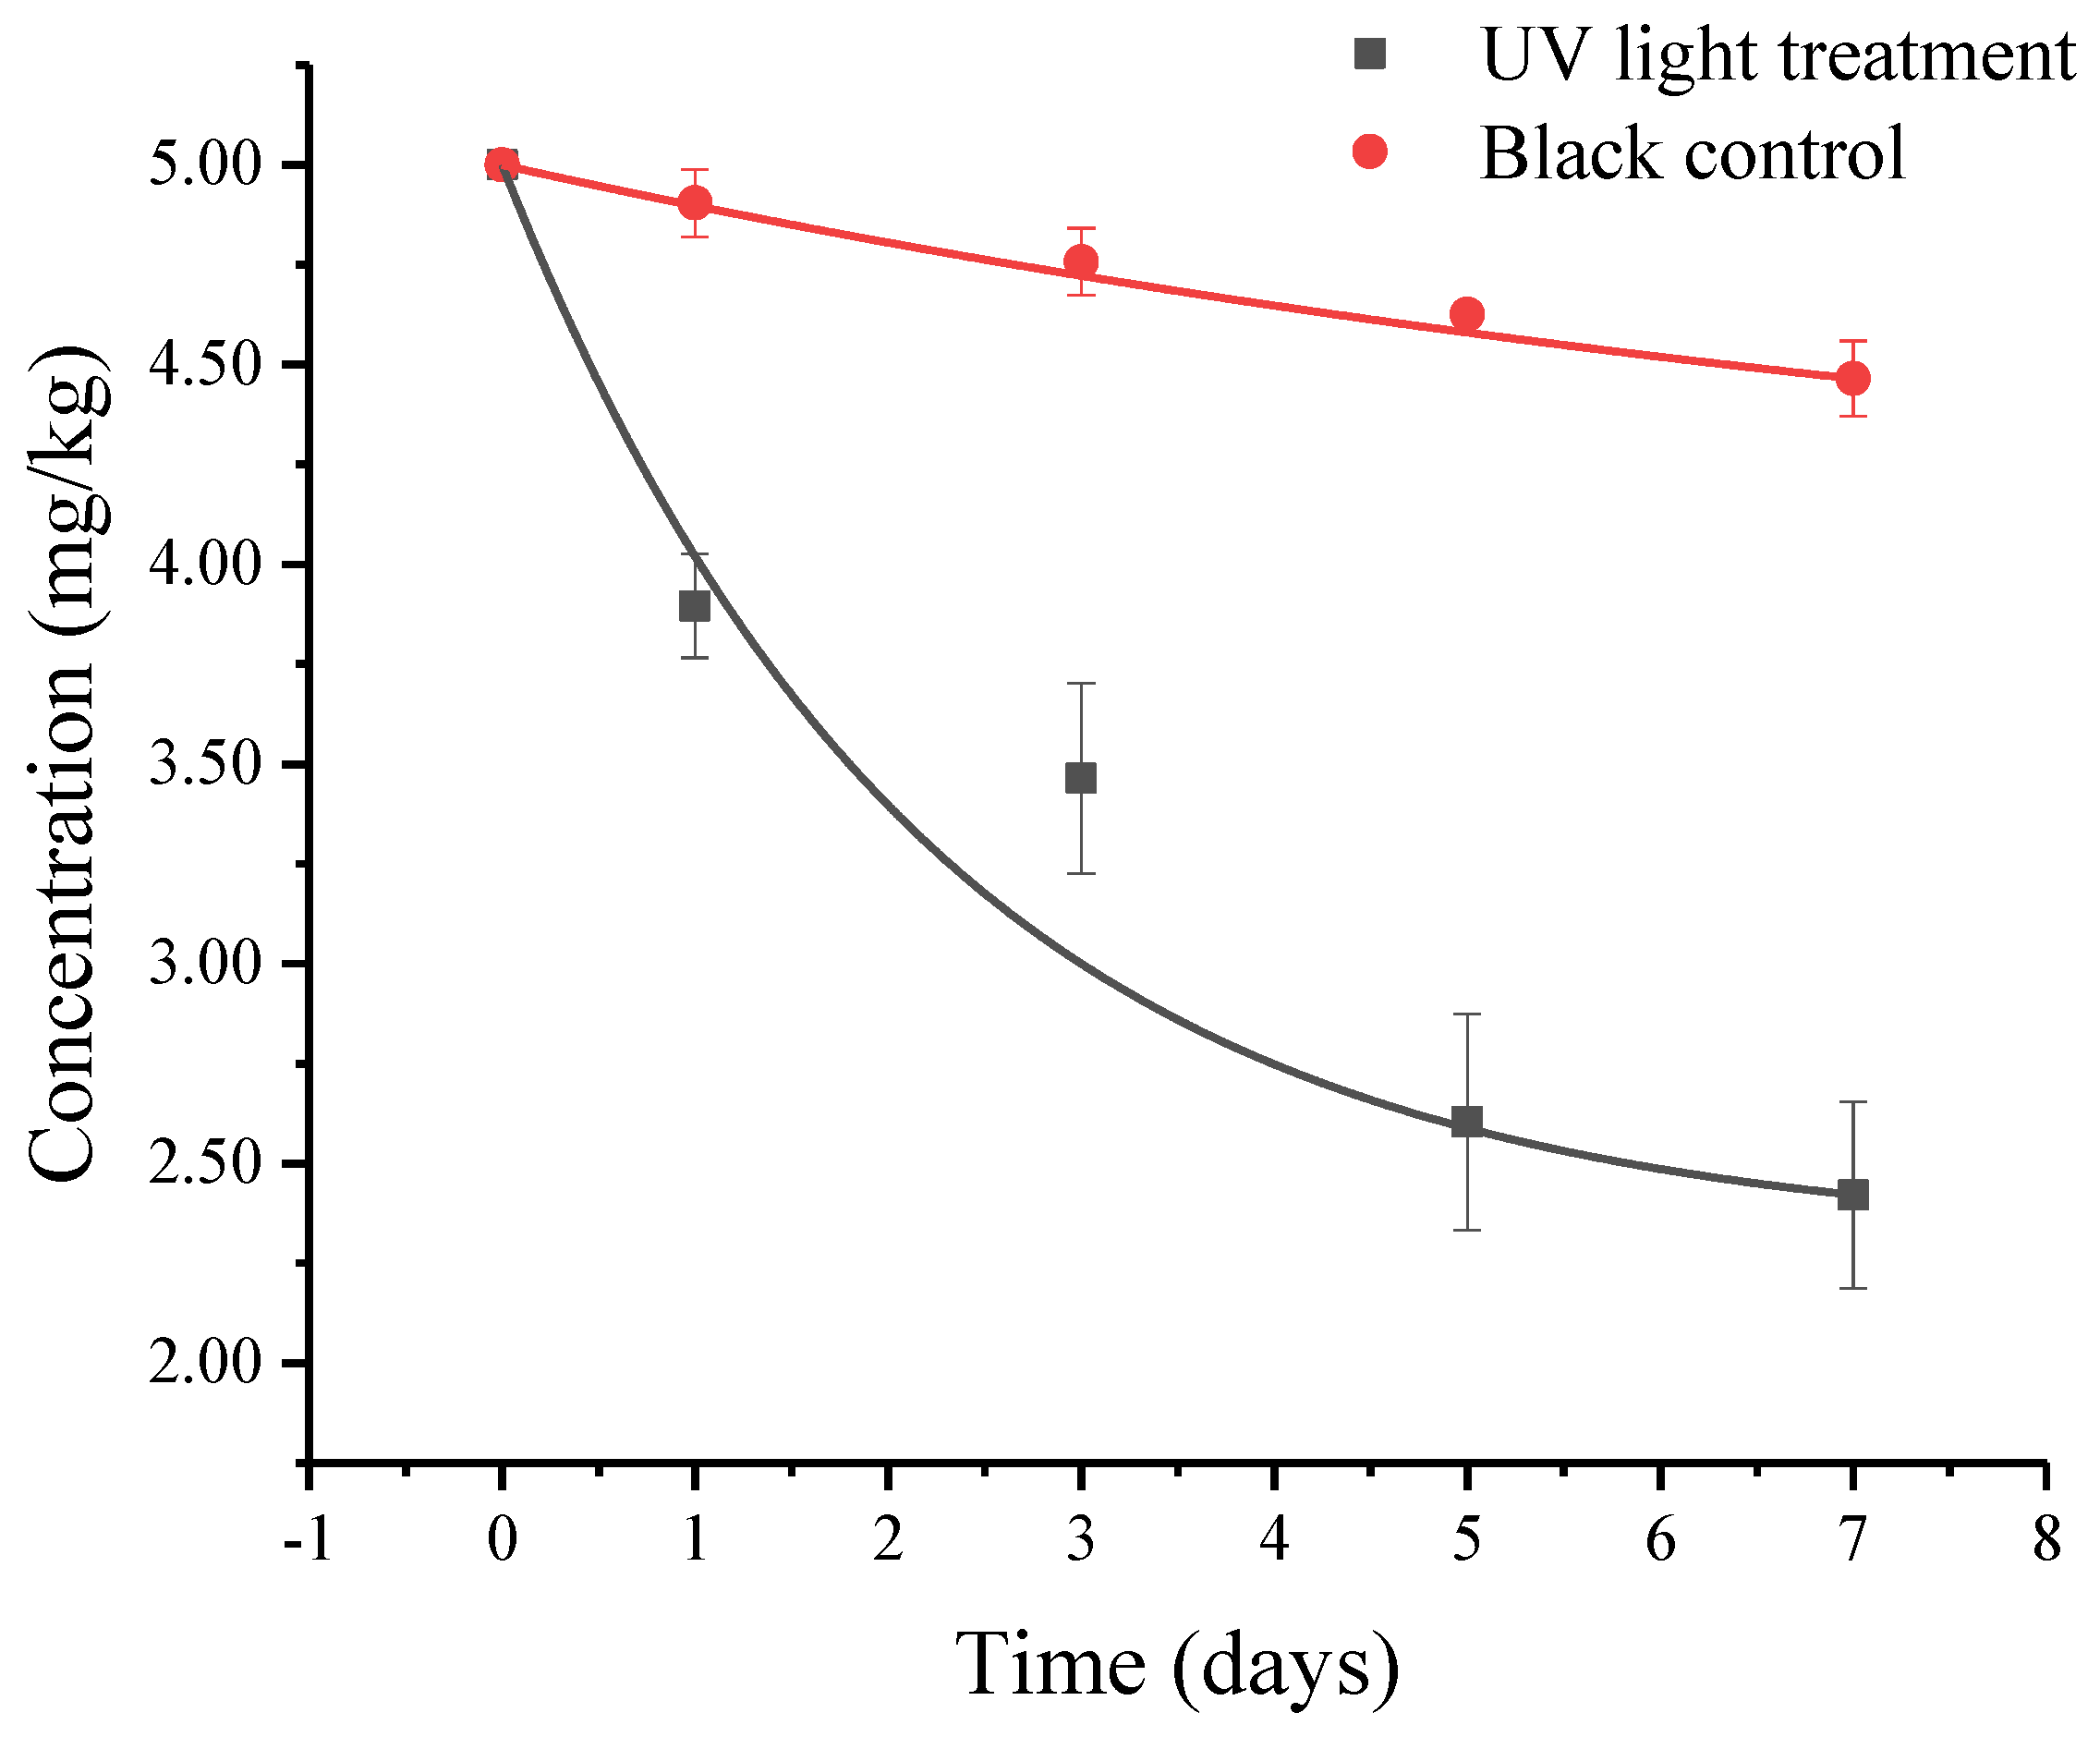
3.2.4. Soil Surface Photolysis

As the photolysis curve shows in Figure 1, the photolysis of procymidone in the yellow brown soil surface followed the first-order kinetic. Furthermore, the kinetic equation was 4.6436e–0.1013t with the correlation coefficient (R2) of 0.9432. The photolysis rate constant was 0.1013 d−1, and the half-life was 6.8 d. On the seventh day, 51.58% of procymidone was degraded in the light processing, while only 10.7% of that was degraded under dark conditions (control). Therefore, the light significantly promotes the degradation of procymidone on the soil surface.

3.3. Adsorption and Desorption of Procymidone in Soil

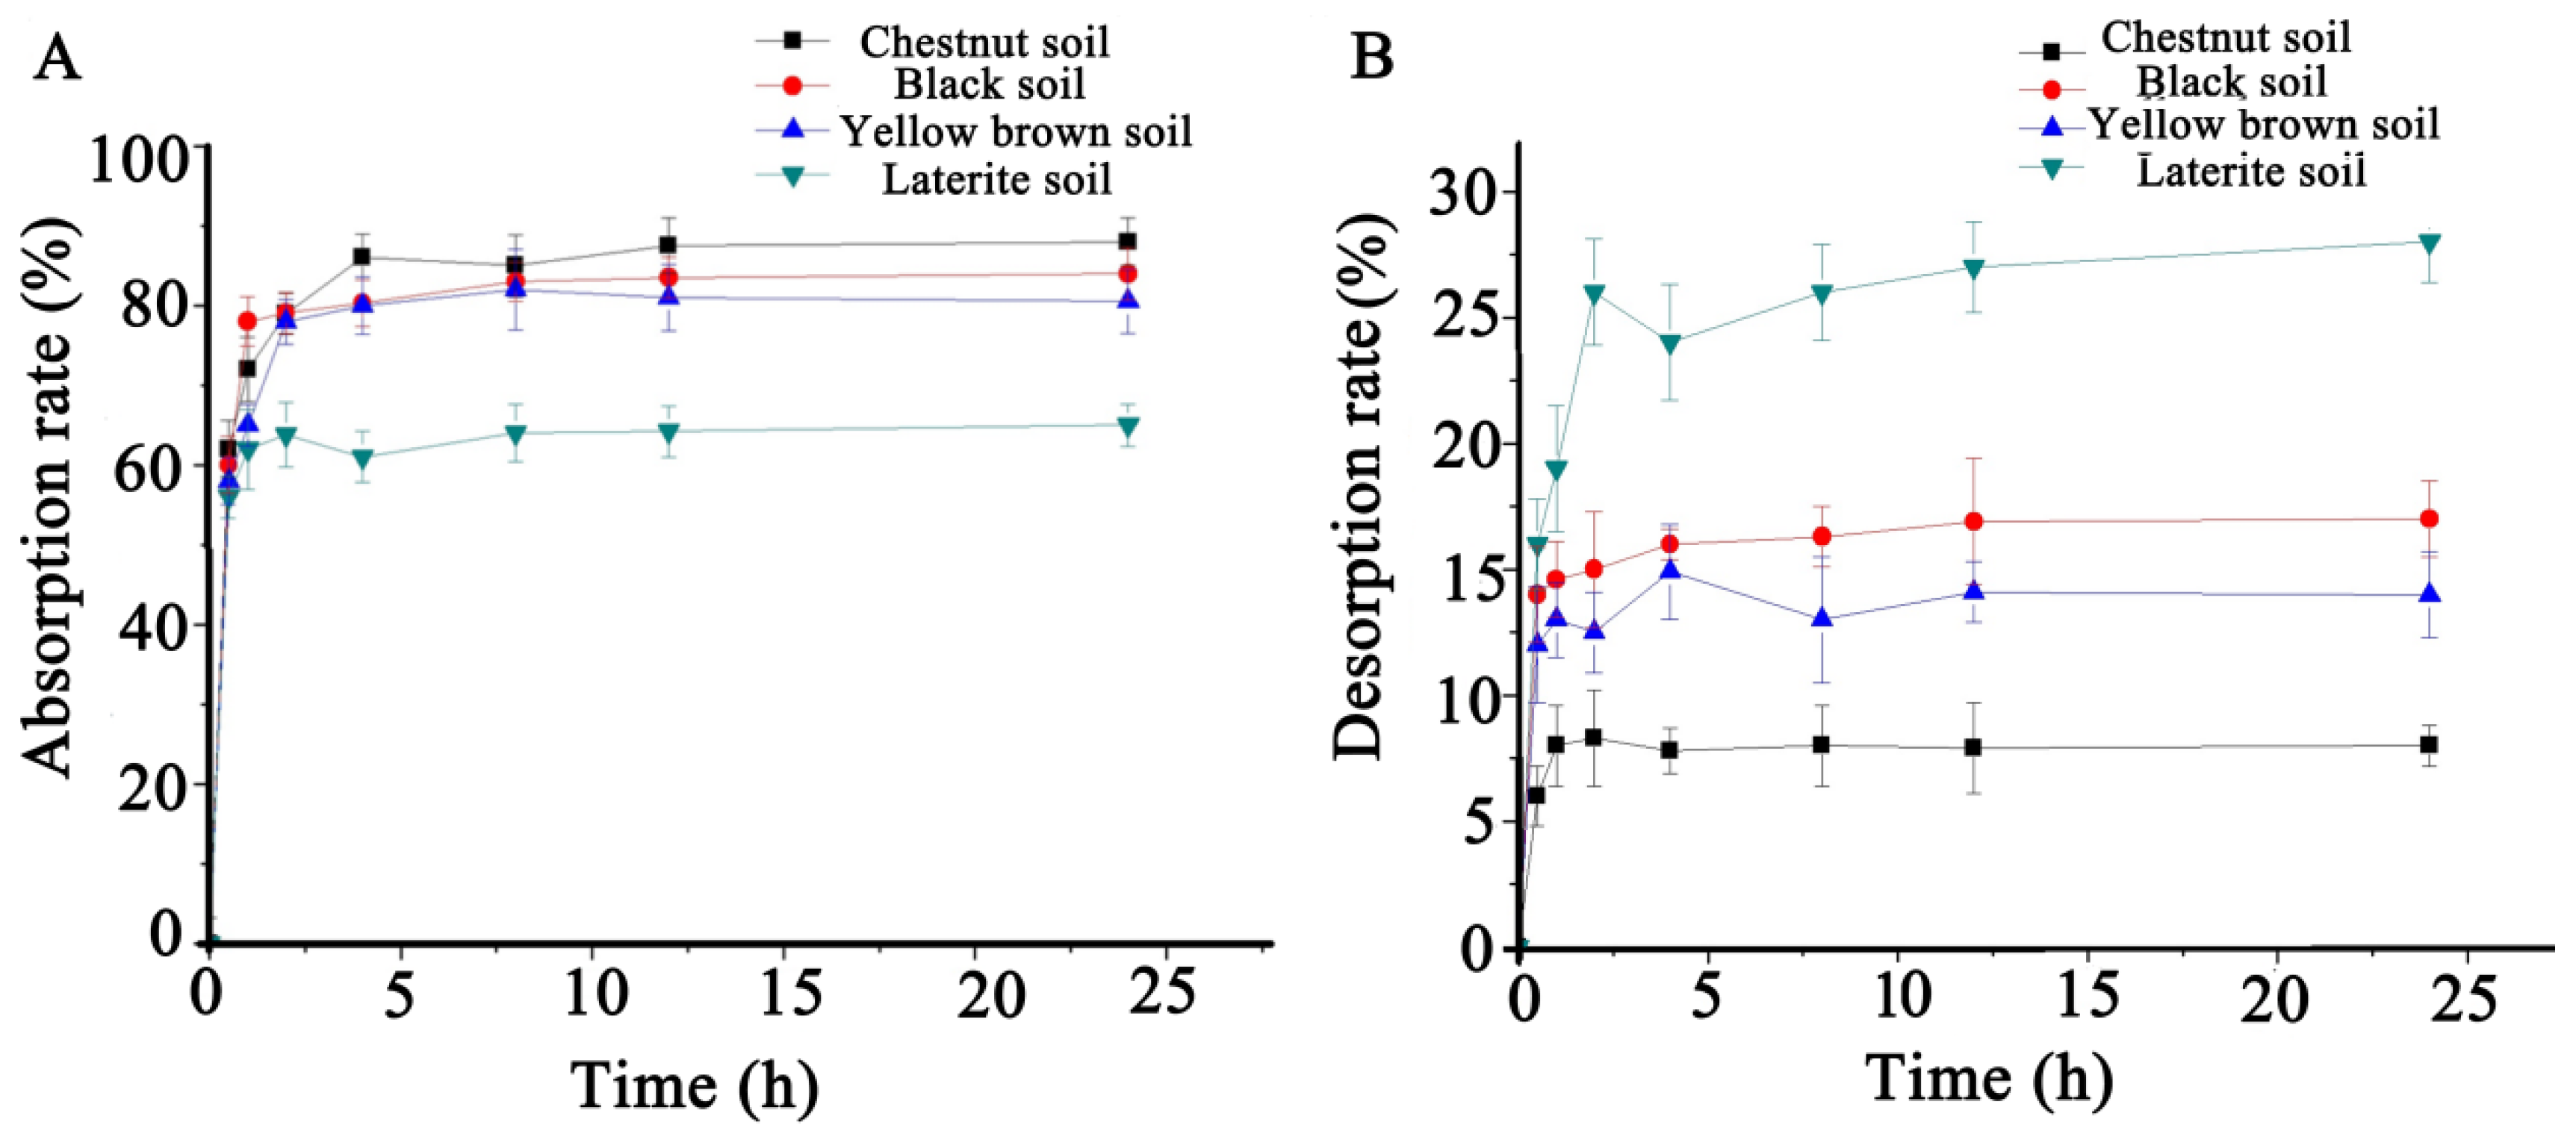
3.3.1. Adsorption and Desorption

As shown in Figure 2, the surface adsorption mainly occurred in the first hour and reached the adsorption equilibrium stage in the fourth hour. Furthermore, the adsorption ability of the soils for procymidone from high to low was chestnut soil, black soil, yellow brown soil, and laterite soil. The desorption of procymidone in the soils reached the equilibrium stage at the eighth hour. The desorption rates of procymidone in laterite soil, yellow brown soil, black soil, and chestnut soil were 27.52 ± 0.85%, 16.22 ± 0.78%, 13.67 ± 1.29%, and 7.62 ± 0.06%, respectively, which was contrary to the adsorption ability.

3.3.2. Isothermal Adsorption

The Freundlich adsorption isotherm equation was used to describe the isothermal adsorption behavior of procymidone in the soils. As shown in Table 2, the Kf values for the black soil, chestnut soil, yellow brown soil, and laterite soil were 314.4, 137.3, 141.1, and 21.1, while the Koc values were 11,716.4, 14,010.2, 8656.4 and 2579.3, respectively. In addition, the adsorption coefficients in the soils were less than 1 (0.9751, 0.9825, 0.9279, and 0.8913 for the black soil, chestnut soil, yellow brown soil, and laterite soil, respectively), which indicated that the adsorptions belonged to the L-type isotherm, and the adsorption capacity was decreased with the increase of the procymidone concentration.

3.4. Mobility of Procymidone in Soil

The Rf values of procymidone in the black soil, yellow brown soil, chestnut soil, and laterite soil were 0.22, 0.16, 0.18 and 0.28, respectively. The mobility order of procymidone in the soils was laterite soil > yellow brown soil > black soil > chestnut soil, which was opposite to the adsorption ability of the soils. Thus, procymidone showed that the largest Rf value and the strongest mobility in the laterite soil because of the lowest adsorption capacity. The soil column leaching results showed that 65.8%, 80.9%, 82.5%, and 92.2% of procymidone presented in the 0–10 cm of the laterite soil, yellow brown soil, black soil, and chestnut soil columns, respectively (Table S2). More than 50% of procymidone was in the 0–10 cm of soil columns (R1 > 50%). The migration and leaching of pesticides in the soil would be affected by the physicochemical properties of the soil and pesticide.

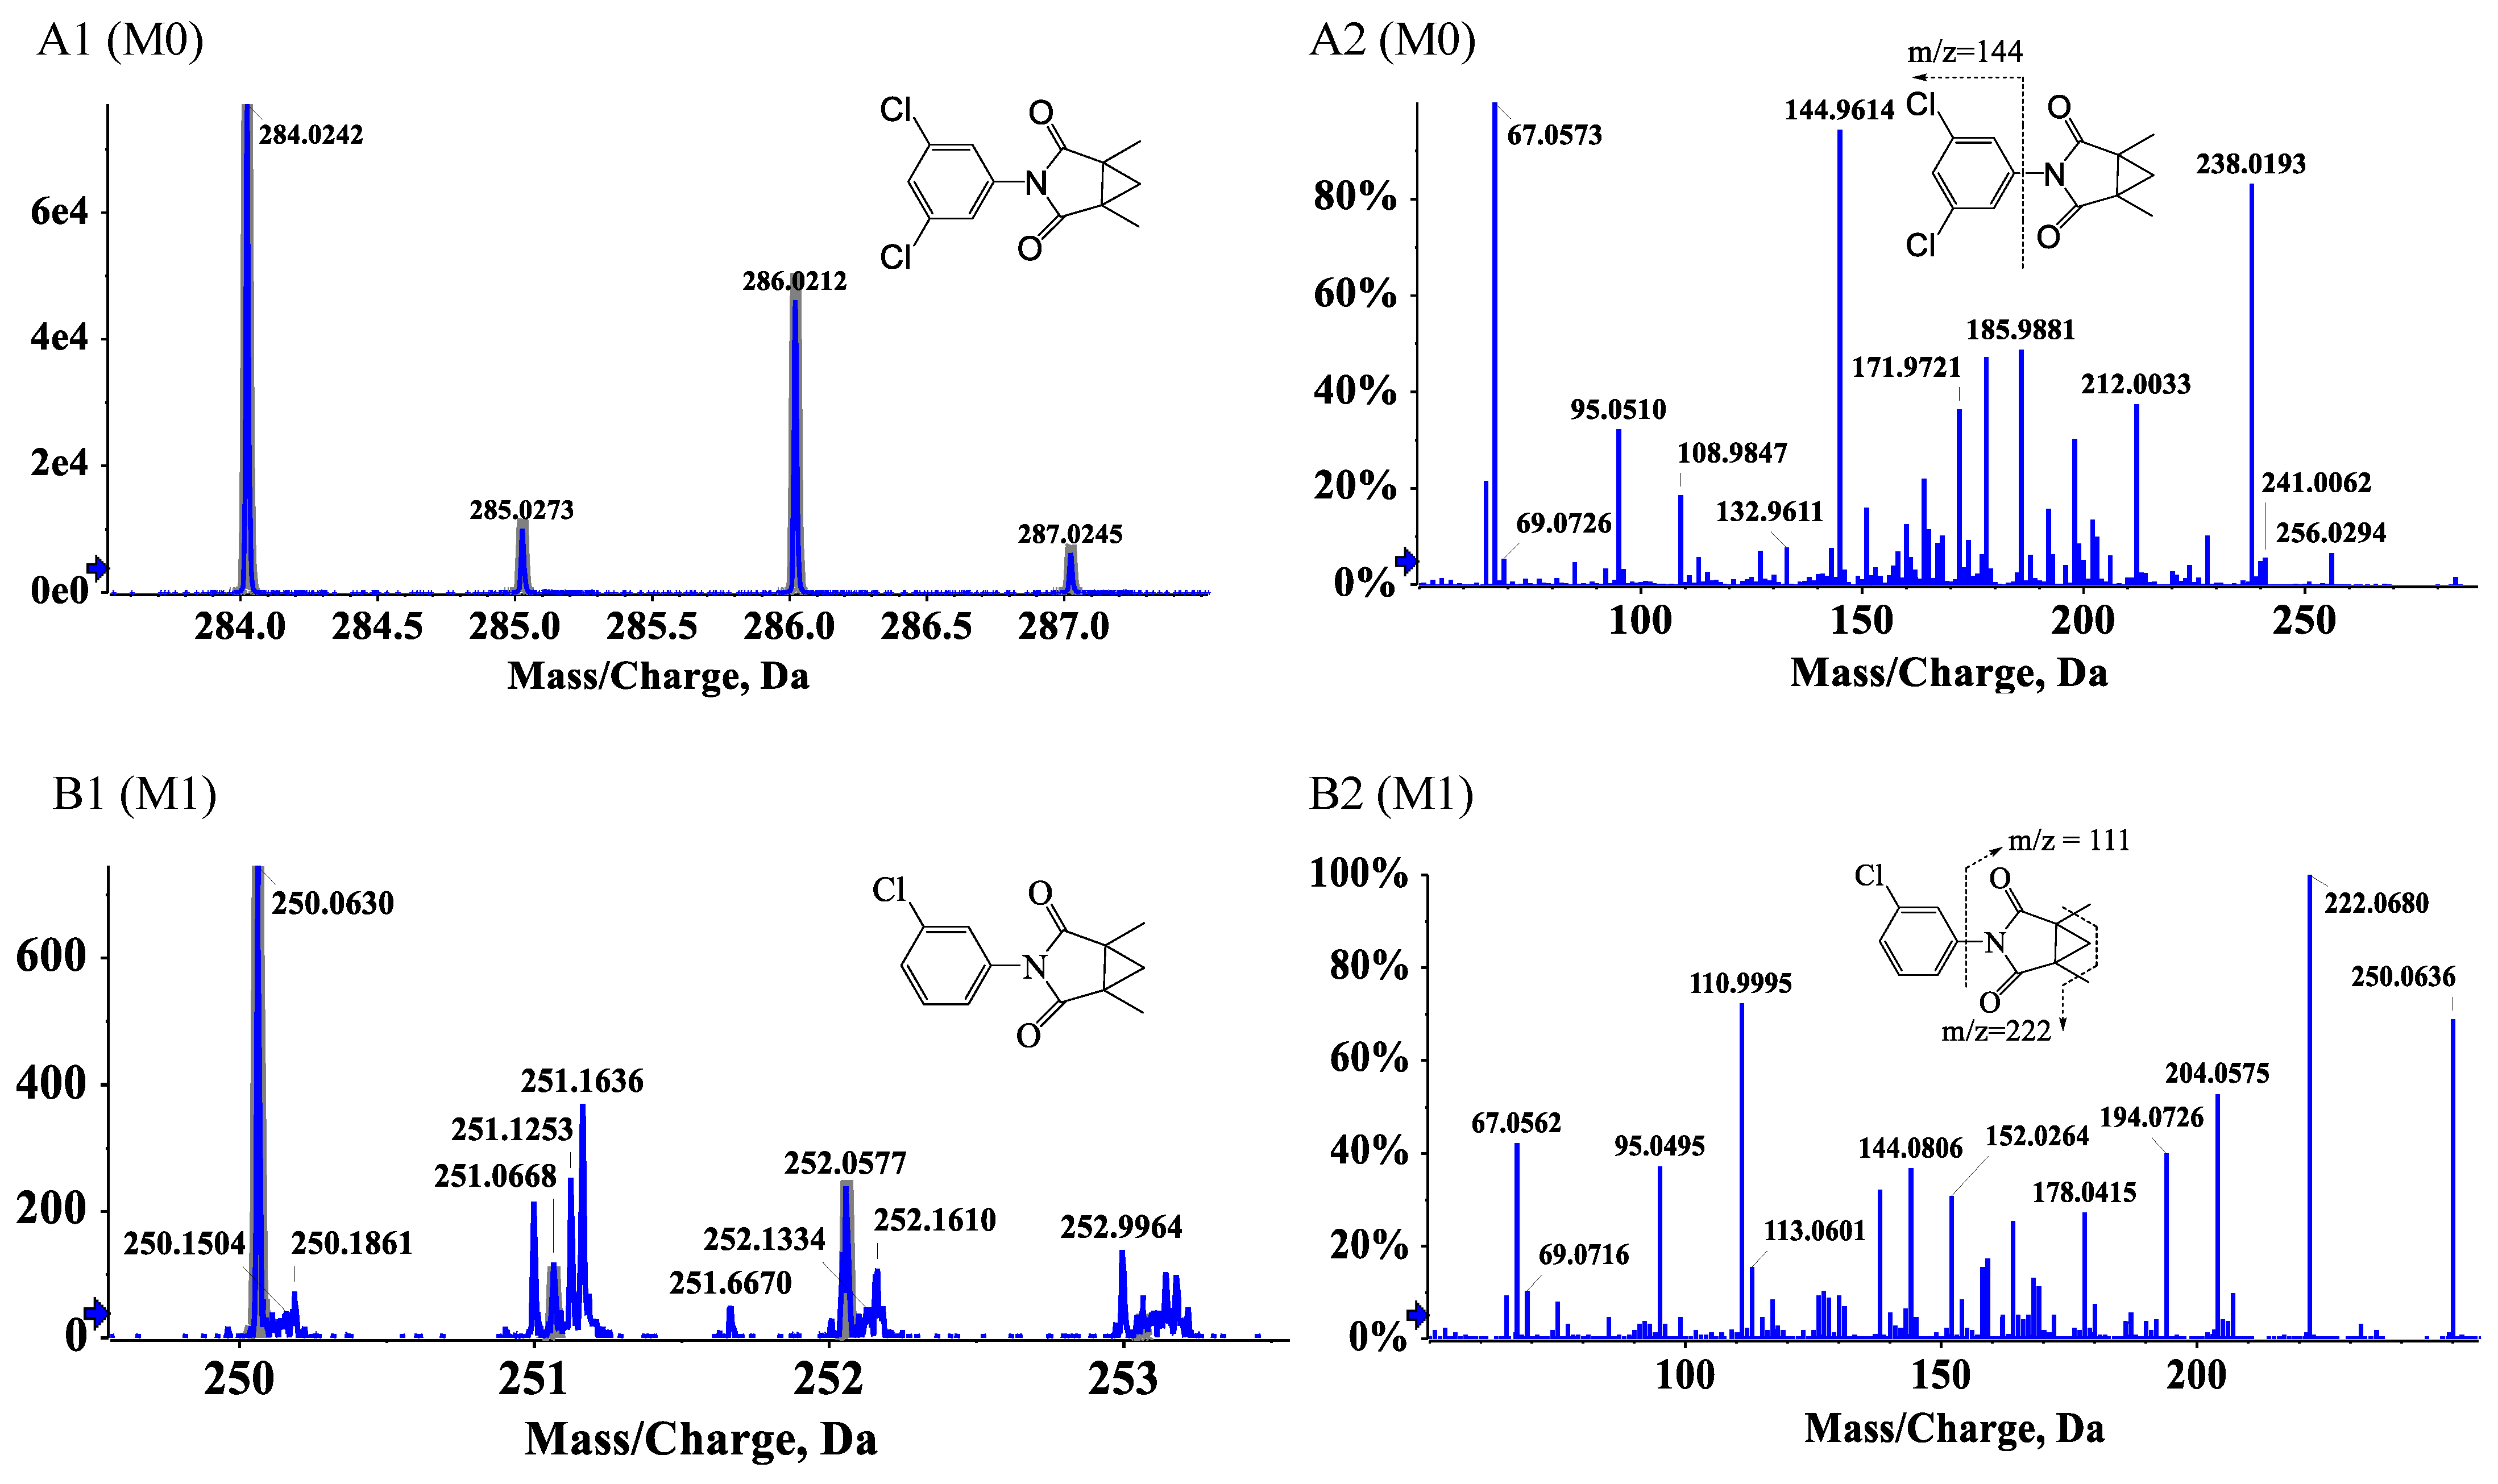
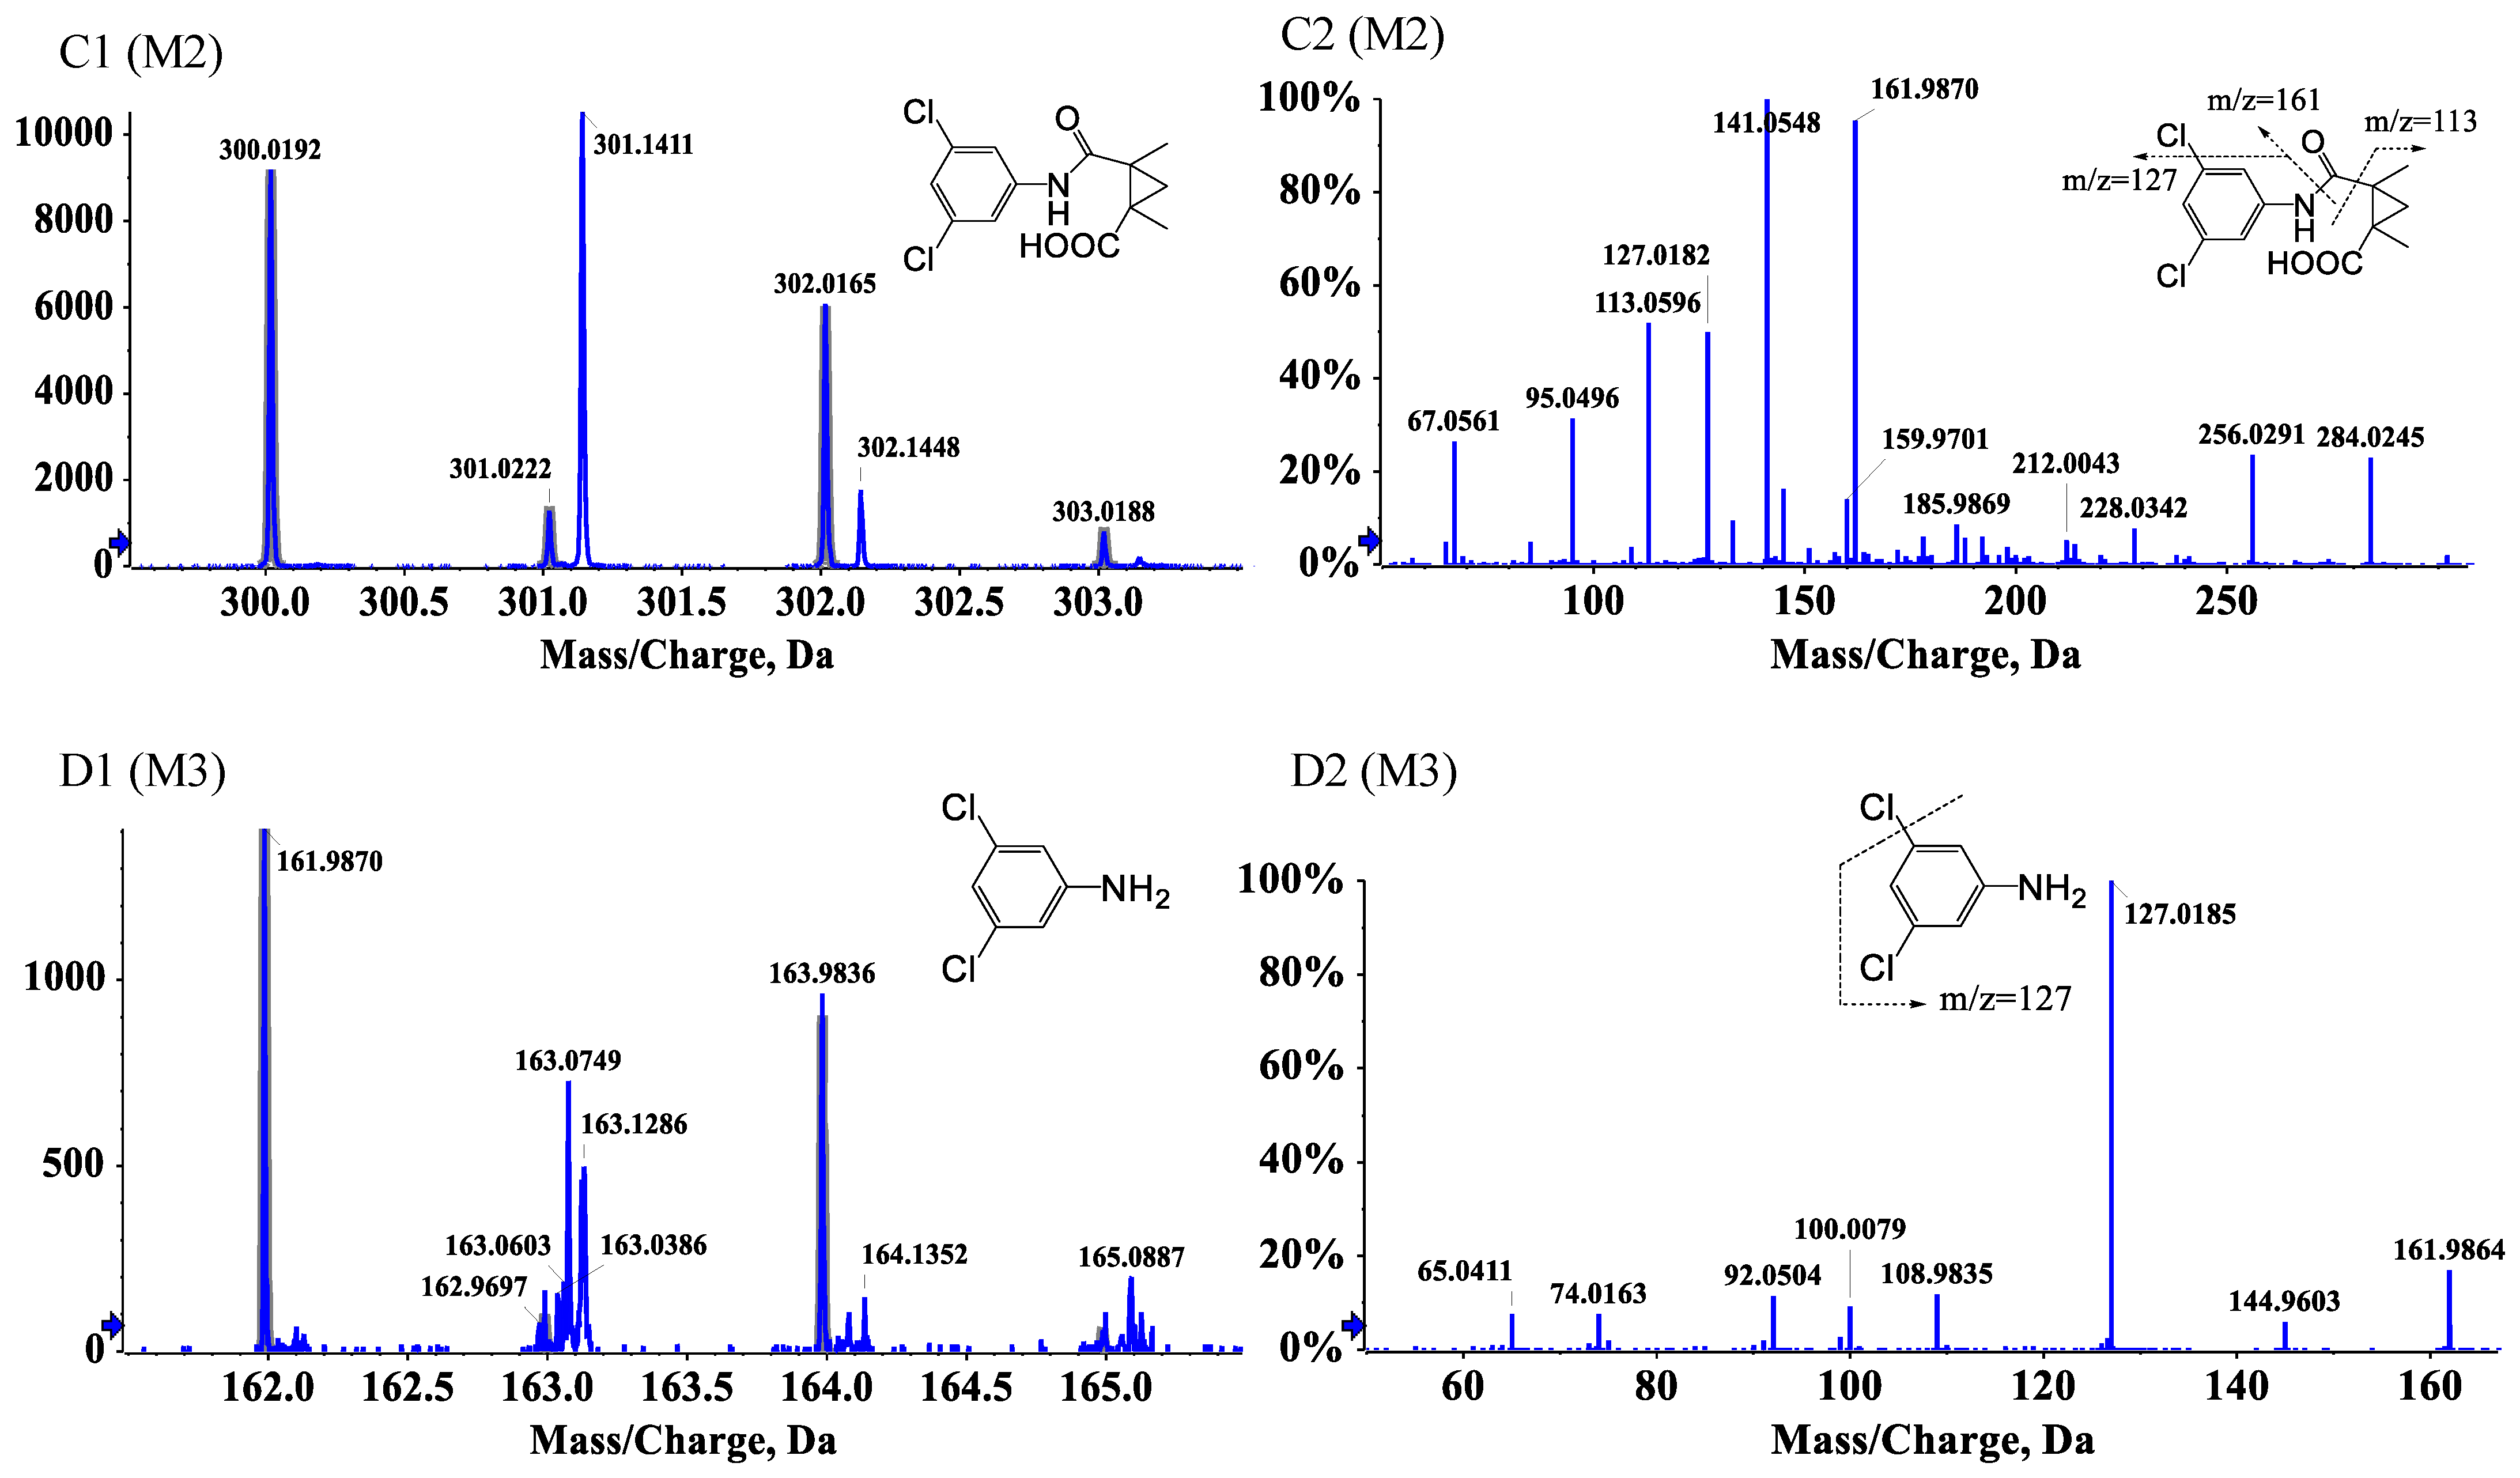
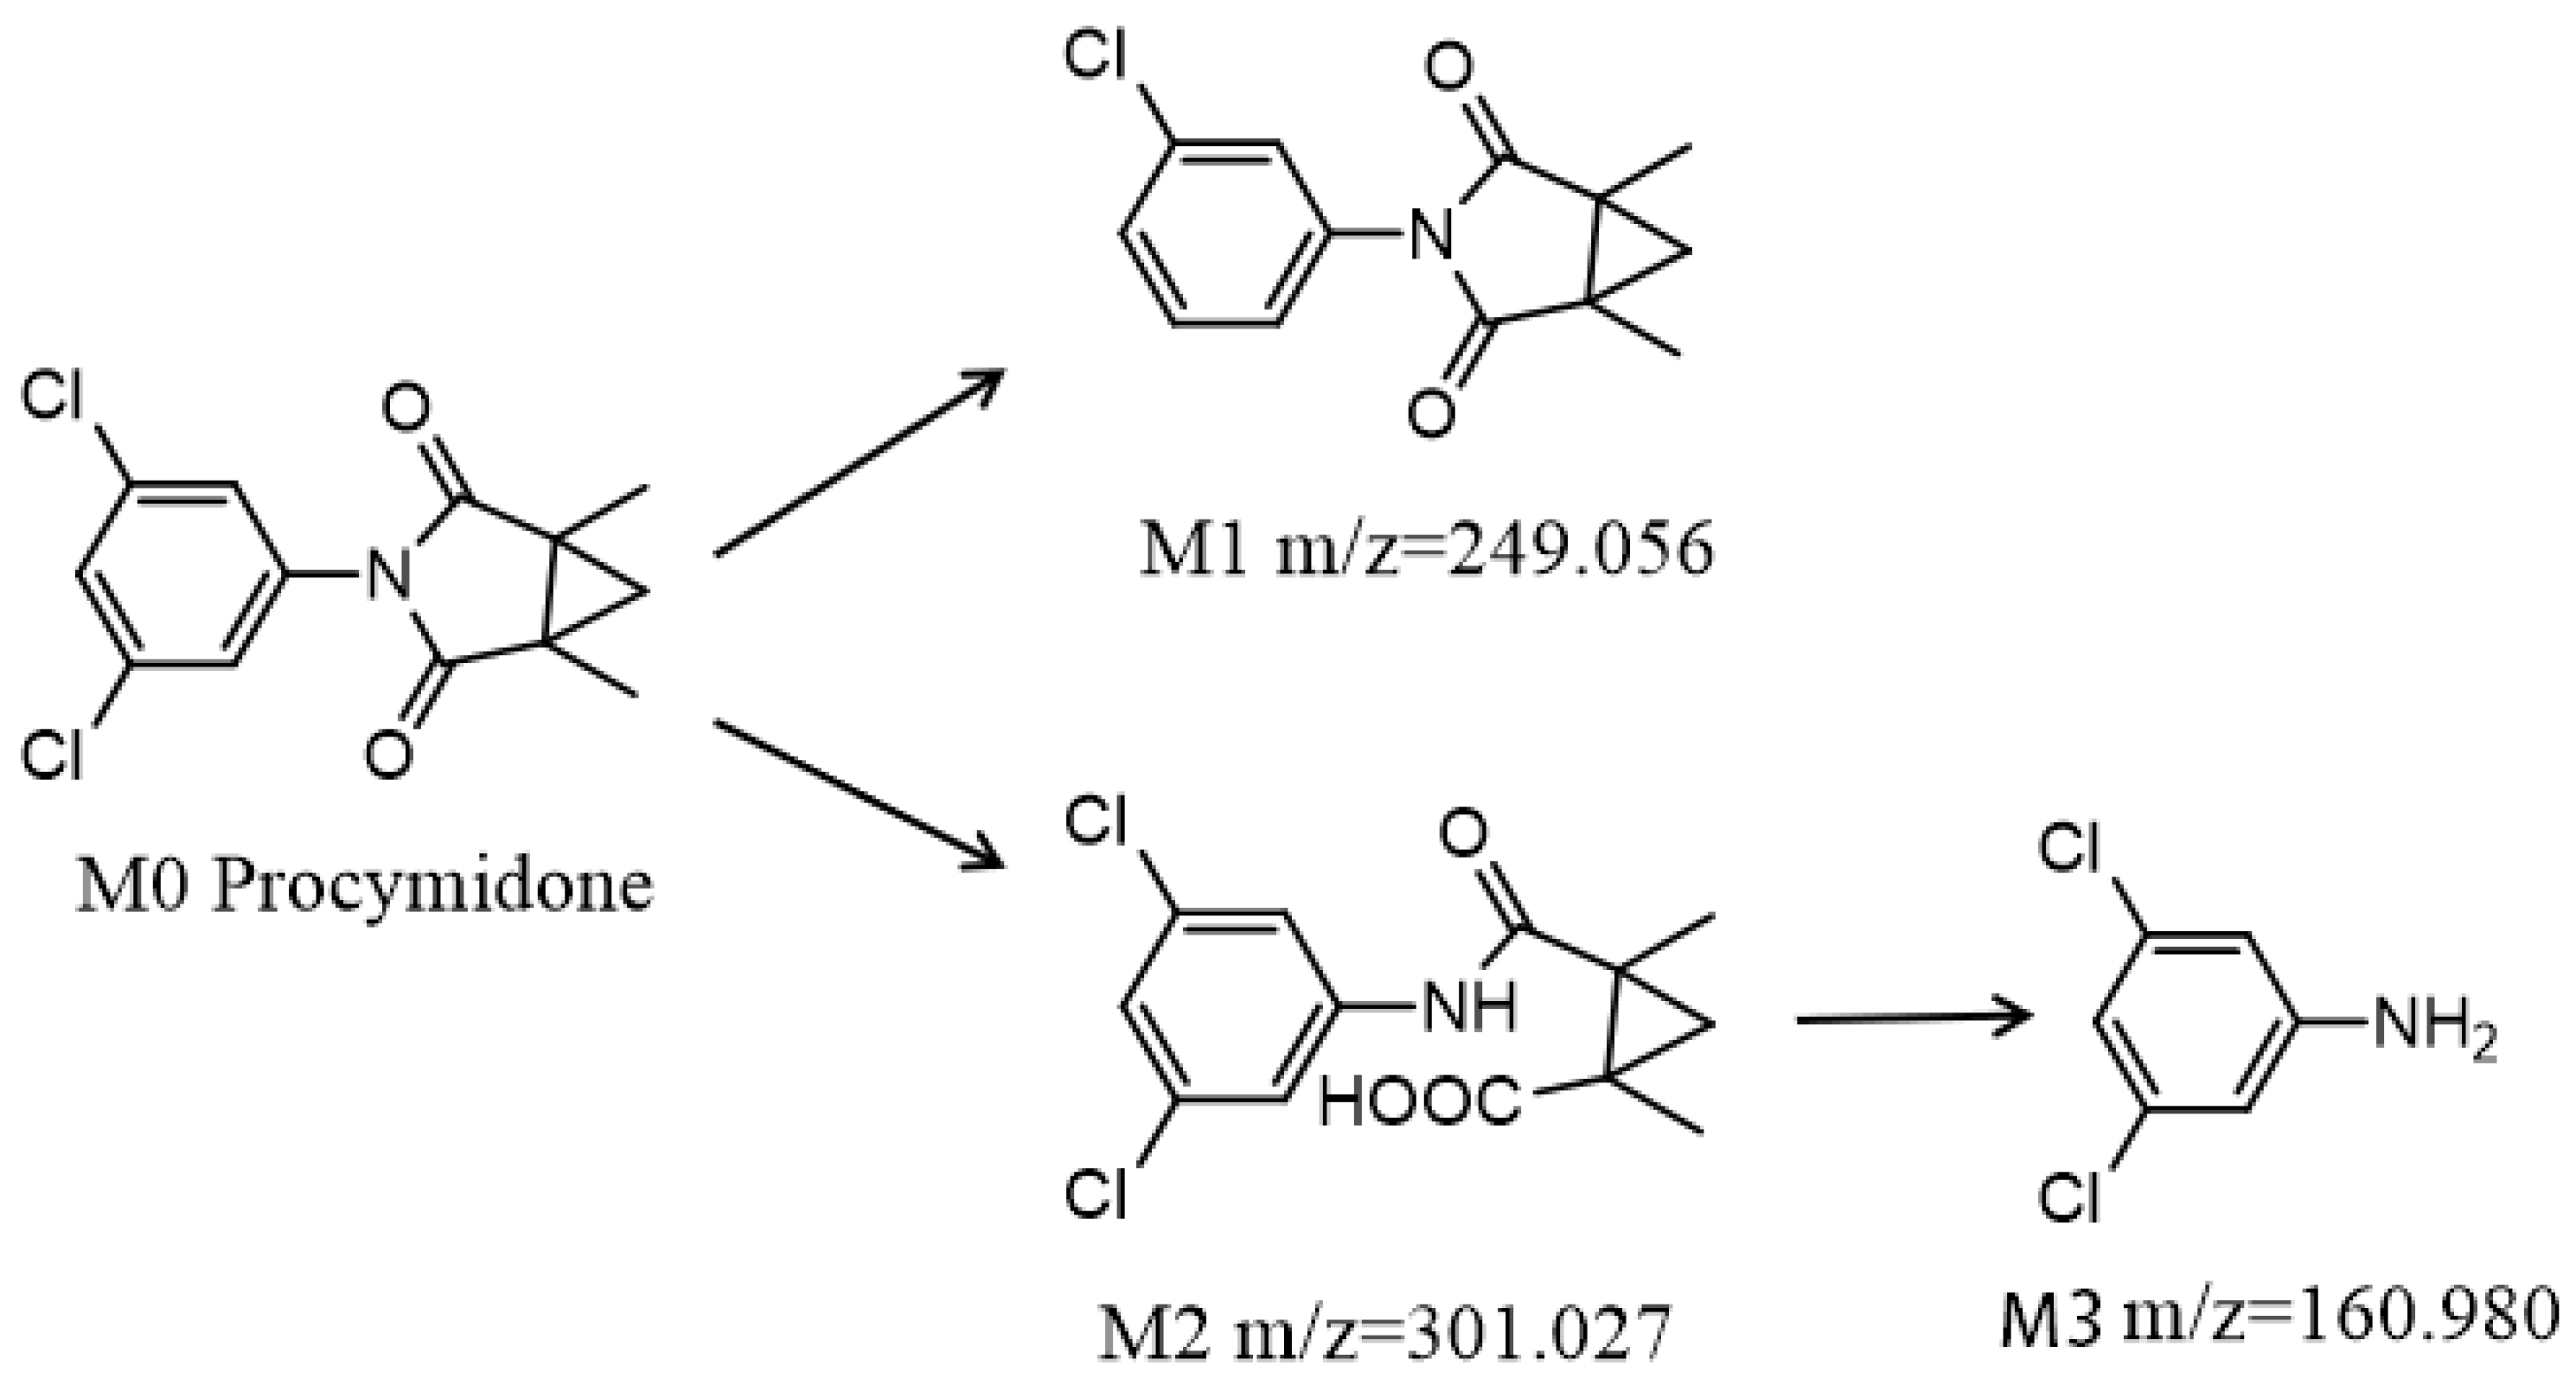
3.5. Identification of Metabolites of Procymidone in Soil

Three degradation products of procymidone including C13H12ClNO2 (M1, 3-(3-chlorophenyl)-1,5-dimethyl-3-azabicyclo [3.1.0]hexane-2,4-dione), C13H13Cl2NO3 (M2, 2-((3-chlorophenyl)carbamoyl)-1,2-dimethylcyclopropane-1-carboxylic acid), and C6H5Cl2N (M3, 3,5-dichloroaniline) were identified by UPLC-Q-TOF-MS/MS in the soil samples. Procymidone had a retention time of 7.76 min (Figure 3A1,A2). The extracted ion chromatograms of the degradation products are shown in Figure S1. M1, M2, and M3 had retention times of approximately 5.50, 5.89, and 5.84 min, respectively. According to the analysis of the fragment ions in the tandem mass spectrum, we inferred that M1 was the single dechlorination degradation product of procymidone (Figure 3B1,B2), M2 was the oxidation degradation product of procymidone (Figure 3C1,C2), and M3 was the hydrolysis degradation product of procymidone (Figure 3D1,D2). The degradation pathway of procymidone in the soil is shown in Figure 4.

4. Discussion

Chen et al. found that the degradation rates of procymidone in four field trials were different, suggesting that they might be affected by some physical and chemical factors, growth dilution factor, soil characteristics, and microorganisms [15]. Mikami et al. found that procymidone had faster degradation rate in water with pH = 9 than that with pH = 5. Therefore, the degradation of procymidone in soil was mainly promoted by the higher organic carbon content and pH [11]. The previous studies proved that the degradation of pesticides in soil was mainly influenced by soil microorganisms [16,17,18]. Moreover, Tao and Yang found that there is a positive correlation between the soil microbial biomass and the content of organic matter in soil [19]. Therefore, organic matter and microorganisms have a positive influence on the degradation of procymidone in soil. The appropriate moisture content could increase the microorganism activity [20]. Therefore, this result indicated that the soil moisture constant in the soil promoted procymidone degradation in soil, because the degradation rate was faster with higher soil moisture constant.
The soil organic matter content and soil texture have important influences on the procymidone adsorption and desorption behaviors. Pan et al. found that the application of biomass charcoal significantly improved soil fertility and increased the ability of soil to adsorb and fix procymidone [20]. The adsorption and desorption behaviors of procymidone in the soils are consistent with the reported pesticides, including methyl-parathion, endosulfan, atrazine, and carbofuran [21,22,23,24,25]. Bajeer et al. reported similar adsorption behaviors of triazophos in different Pakistan soils. The functional groups (carboxyl, hydroxyl, amino, etc.) of soil organic matter and clay particles were not conducive to the mobility of pesticides [26]. Furthermore, the mobility of pesticides in soil was also related to their solubility, the pesticides with good solubility were not easily adsorbed but easily leached [27,28,29].
Previous studies reported that the M1 was a photolysis product of procymidone, and the M2 was the metabolite of procymidone in water and rats [9,10]. The Joint FAO/WHO Meeting on Pesticide Residues (World Health Organization) (JMPR) listed six metabolites of procymidone in rats, including M2 and M3. The International Union of Pure and Applied Chemistry (IUPAC) reported that M2 and M3 were the metabolites of procymidone in soil and rats, respectively. In this study, M3 was found in the soil for the first time. Abe et al. reported that M2 posed a teratogenic risk to rats [9]. Racine et al. also found that M3 was the most potent nephrotoxicant in vivo and in vitro among the mono- and dichloroanilines [30].

5. Conclusions

In this work, the degradation, adsorption, and mobility of procymidone in the soils were systematically studied. The results indicated that procymidone was a degradable pesticide in the black soil, laterite soil, chestnut soil, and yellow brown soil. Soil moisture, organic matter, microorganisms, and light were favorable to procymidone degradation. Procymidone poses little risk of contaminating groundwater due to poor mobility. Three degradation products of procymidone, namely C13H12ClNO2 (M1), C13H13Cl2NO3 (M2), and C6H5Cl2N (M3), were identified by UPLC-Q-TOF-MS/MS. Among them, M3 was found in the soil for the first time. The results provide great insights into the fate of procymidone in the soils, which will attract more researchers to pay attention to the environmental behavior of pesticides. Notably, pesticides not only have a series of environmental behaviors in the soil, but also have an impact on the soil ecological environment, especially soil microorganisms. In the future, studies will not only focus on the environmental behavior of pesticides alone but will also pay attention to the negative effects of the pesticides to the environmental microorganism.

Supplementary Materials

The following are available online at https://www.mdpi.com/article/10.3390/su13126712/s1: Table S1 Physical and chemical characterization of the selected soils; Table S2 Vertical distribution of procymidone in soil column; Figure S1 The extracted ion chromatograms of three products of procymidone in soil.

Author Contributions

Conceptualization, L.L. and S.Z.; methodology, L.L.; software, G.M.; validation, L.L., and L.H.; formal analysis, X.Z.; investigation, G.M.; resources, M.W.; data curation, X.Z.; writing—original draft preparation, G.M., X.Z.; writing—review and editing, L.L., X.H.; visualization, X.H.; supervision, M.W.; project administration, X.H.; funding acquisition, X.H. All authors have read and agreed to the published version of the manuscript.

Funding

This study was supported by the National Key Research and Development Program of China (2016YFD0200207).

Conflicts of Interest

The authors declare that they have no known competing financial interests.

References

  1. Fismes, J.; Schwartz, C.; Ganier, C.P.; Morel, J.L.; Charissou, A.M.; Jourdain, M.J. Risk of contamination for edible vegetables growing on soils polluted by polycyclic aromatic hydrocarbons. Polycycl. Aromat. Comp. 2004, 24, 827–836. [Google Scholar] [CrossRef]
  2. Silva, V.; Mol, H.G.J.; Zomer, P.; Tienstra, M.; Ritsema, C.J.; Geissen, V. Pesticide residues in european agricultural soils–A hidden reality unfolded. Sci. Total Environ. 2019, 653, 1532–1545. [Google Scholar] [CrossRef] [PubMed]
  3. Sarmah, A.K.; Close, M.E.; Mason, N.W.H. Dissipation and sorption of six commonly used pesticides in two contrasting soils of New Zealand. J. Environ. Sci. Health B 2009, 44, 325–336. [Google Scholar] [CrossRef] [Green Version]
  4. Sarmah, A.K.; Muller, K.; Ahmad, R. Fate and behaviour of pesticides in the agro-ecosystem–A review with a New Zealand perspective. Aust. J. Soil Res. 2004, 42, 125–257. [Google Scholar] [CrossRef]
  5. Allen, R.; Walker, A. The influence of soil properties on the rates of degradation of metamitron, metazachlor and metribuzin. Pest Manag. Sci. 2010, 18, 95–111. [Google Scholar] [CrossRef]
  6. Gevao, B.; Semple, K.T.; Jones, K.C. Bound pesticide residues in soils: A review. Environ. Pollut. 2000, 108, 3–14. [Google Scholar] [CrossRef]
  7. Lin, S.H.; Han, Y.Y.; Jiangyuan, C.Z.; Luo, Y.B.; Xu, W.T.; Luo, H.X.; Pang, G.F. Revealing the biodiversity and the response of pathogen to a combined use of procymidone and thiamethoxam in tomatoes. Food Chem. 2019, 284, 73–79. [Google Scholar] [CrossRef]
  8. Pang, L.; Close, M.E. A field tracer study of attenuation of atrazine, hexazinone and procymidone in a pumice sand aquifer. Pest Manag. Sci. 2001, 57, 1142–1150. [Google Scholar] [CrossRef]
  9. Pang, D.L.; Close, M.; Flintoft, M. Degradation and sorption of atrazine, hexazinone and procymidone in coastal sand aquifer media. Pest Manag. Sci. 2005, 61, 133–143. [Google Scholar] [CrossRef]
  10. Abe, J.; Tomigahara, Y.; Tarui, H.; Omori, R.; Kawamura, S. Identification of metabolism and excretion differences of procymidone between rats and humans using chimeric mice: Implications for differential developmental toxicity. J. Agric. Food Chem. 2018, 66, 1955–1963. [Google Scholar] [CrossRef]
  11. Mikami, N.; Imanishi, K.; Yamada, H. Photolysis and hydrolysis of the fungicide procymidone in water. J. Pestic. Sci. 1984, 9, 223–228. [Google Scholar] [CrossRef] [Green Version]
  12. Ambrus, A.; Buys, M.; Miyamoto, J.; Otto, S.; Smart, N.A. IUPAC reports on pesticides (28)–Some aspects of the analysis of residues of dicarboximide fungicides in food. Pure Appl. Chem. 1991, 63, 747–762. [Google Scholar] [CrossRef]
  13. Xia, S.; Yan, N.; Zhu, J.; Popov, V.K.; Semchishen, V.A.; Tsypina, S.I. Biofilm coupled with UV irradiation for phenol degradation and change of its community structure. Bioproc. Biosyst. Eng. 2011, 34, 607. [Google Scholar] [CrossRef] [PubMed]
  14. Laufs, S.; Kleffmann, J. Investigations on HONO formation from photolysis of adsorbed HNO3 on quartz glass surfaces. Peys. Chem. Chem. Phys. 2016, 18, 9616–9625. [Google Scholar] [CrossRef] [PubMed] [Green Version]
  15. Chen, L.; Li, X.S.; Wang, Z.Q.; Pan, C.P.; Jin, R.C. Residue dynamics of procymidone in leeks and soil in greenhouses by smoke generator application. Ecotox. Environ. Safe. 2010, 73, 73–77. [Google Scholar] [CrossRef] [PubMed]
  16. Dechesne, A.; Badawi, N.; Aamand, J.; Smets, B.F. Fine scale spatial variability of microbial pesticide degradation in soil: Scales, controlling factors, and implications. Front. Microbiol. 2014, 5, 667. [Google Scholar] [CrossRef] [PubMed] [Green Version]
  17. Sims, G.K.; Cupples, A.M. Factors controlling degradation of pesticides in soil. Pest Manag. Sci. 2015, 55, 598–601. [Google Scholar] [CrossRef]
  18. Pan, Z.P.; Guo, D.; Chen, J.Q.; Chen, D.; Zheng, J.W.; Li, L.Q.; Pan, G.X. Effect of biochar application on soil and procymidone residues of panax notoginseng. J. Chin. Med. Mater. 2016, 39, 2431–2436. [Google Scholar]
  19. Tao, L.; Yang, H. Fluroxypyr biodegradation in soils by multiple factors. Environ. Monit. Assess. 2011, 175, 227–238. [Google Scholar] [CrossRef]
  20. Pan, M.; Chu, L.M. Adsorption and degradation of five selected antibiotics in agricultural soil. Sci. Total Environ. 2016, 545–546, 48–56. [Google Scholar] [CrossRef]
  21. Yu, Y.L.; Wu, X.M.; Li, S.N.; Fang, H.; Zhan, H.Y.; Yu, J.Q. An exploration of the relationship between adsorption and bioavailability of pesticides in soil to earthworm. Environ. Pollut. 2006, 141, 428–433. [Google Scholar] [CrossRef]
  22. Kumar, M.; Philip, L. Adsorption and desorption characteristics of hydrophobic pesticide endosulfan in four Indian soils. Chemosphere 2006, 62, 1064–1077. [Google Scholar] [CrossRef]
  23. Rama, K.K.; Philip, L. Adsorption and desorption characteristics of lindane, carbofuran and methyl parathion on various Indian soils. J. Hazard. Mater. 2008, 160, 559–567. [Google Scholar] [CrossRef]
  24. Đurović, R.; Gajić-Umiljendić, J.; Đorđević, T. Effects of organic matter and clay content in soil on pesticide adsorption processes. Pesticidi I Fitomedicina 2009, 24, 51–57. [Google Scholar] [CrossRef]
  25. Qian, S.; Zhu, H.; Xiong, B.; Zheng, G.; Xu, W. Adsorption and desorption characteristics of endosulfan in two typical agricultural soils in Southwest China. Environ. Sci. Pollut. R. 2017, 24, 11493–11503. [Google Scholar] [CrossRef] [PubMed]
  26. Bajeer, M.A.; Mallah, M.A.; Sherazi, S.T.H.; Bhanger, M.I.; Nizamani, S.M. Investigation of dissipation, adsorption, degradation, and leaching of triazophos pesticide in various soils. Polycycl. Aromat. Comp. 2015, 36, 229–241. [Google Scholar] [CrossRef]
  27. Morillo, E.; Undabeytia, T.; Cabrera, A.; Villaverde, J.; Maqueda, C. Effect of soil type on adsorption-desorption, mobility, and activity of the herbicide norflurazon. J. Agric. Food Chem. 2004, 52, 884–890. [Google Scholar] [CrossRef] [Green Version]
  28. Wu, X.M.; Li, M.; Long, Y.H.; Liu, R.X.; Li, S.N. Effects of adsorption on degradation and bioavailability of metolachlor in soil. J. Soil. Sci. Plant Nut. 2011, 11, 83–97. [Google Scholar]
  29. Fenoll, J.; Vela, N.; Navarro, G.; Pérez-Lucas, G.; Navarro, S. Assessment of agro-industrial and composted organic wastes for reducing the potential leaching of triazine herbicide residues through the soil. Sci. Total Environ. 2014, 493, 124–132. [Google Scholar] [CrossRef] [PubMed]
  30. Racine, C.R.; Ferguson, T.; Preston, D.; Ward, D.; Ball, J.; Anestis, D. The role of biotransformation and oxidative stress in 3,5-dichloroaniline (3,5-DCA) induced nephrotoxicity in isolated renal cortical cells from male Fischer 344 rats. Toxicology 2016, 341–343, 47–55. [Google Scholar] [CrossRef] [Green Version]
Figure 1. Photolysis dynamics of procymidone on soil surface.
Sustainability 13 06712 g001
Figure 2. Kinetic adsorption (A) and desorption (B) of procymidone in four kinds.
Sustainability 13 06712 g002
Figure 3. The tandem mass spectrum of procymidone (A1,A2), M1 m/z = 249.056 (B1,B2), M2 m/z = 301.027 (C1,C2), and M3 m/z = 160.980 (D1,D2).
Sustainability 13 06712 g003aSustainability 13 06712 g003b
Figure 4. The metabolic pathway of procymidone in soil.
Sustainability 13 06712 g004
Table 1. The degradation parameters of procymidone in soil under different treatment.
TreatmentDegradation Kinetic Equation (Ct = Co e–kt)Degradation Constant (k/d−1)Half-Lives (T1/2/d)Determination Coefficient (R2)
Four types of soilBlack soilCt = 1.9201 × 10–0.0485t0.048514.30.9632
Chestnut soilCt = 1.9954 × 10–0.0367t0.036718.90.9821
Yellow brown soilCt = 1.9787 × 10–0.0343t0.034320.20.9901
Laterite soilCt = 1.9332 × 10–0.0288t0.028824.10.9855
Soil moisture content (%)10Ct = 1.9201 × 10–0.0151t0.015145.90.9732
20Ct = 1.9954 × 10–0.0340t0.034020.40.9002
30Ct = 1.9787 × 10–0.0413t0.041316.80.9101
40Ct = 1.9332 × 10–0.0459t0.045915.10.9335
WaterloggingCt = 1.9398 × 10–0.0558t0.055811.30.9445
Sterilization or/and removing organic matterSterilizationCt = 1.9064 × 10–0.0228t0.022830.40.9601
Removing organic matterCt = 1.9347 × 10–0.0173t0.017340.10.9453
Sterilization and removing organic matterCt = 1.8939 × 10–0.0108t0.010864.00.9235
Table 2. The isothermal adsorption parameters of procymidone in soils.
SoilOrganic Carbon Content (%)Freundlich
KfKoc 1/n adsR2
Black soil2.68314.411,716.40.97510.9249
Chestnut soil0.88137.314,010.20.98250.9742
Yellow brown soil0.92141.18656.40.92790.9972
Laterite soil1.6321.12579.30.89130.9831
Publisher’s Note: MDPI stays neutral with regard to jurisdictional claims in published maps and institutional affiliations.

