Article

Condition-Based Maintenance Strategies to Enhance the Durability of ETICS

1
CERIS, Instituto Superior Técnico, Universidade de Lisboa, Avenue Rovisco Pais, 1049-001 Lisbon, Portugal
2
Department of Civil Engineering, Architecture and Georesources, Instituto Superior Técnico, Universidade de Lisboa, Avenue Rovisco Pais, 1049-001 Lisbon, Portugal
*
Author to whom correspondence should be addressed.
Sustainability 2021, 13(12), 6677; https://doi.org/10.3390/su13126677
Submission received: 4 May 2021 / Revised: 7 June 2021 / Accepted: 9 June 2021 / Published: 11 June 2021

Abstract

:
The increase of awareness with sustainability and the desire of reducing the energy consumption in the construction sector haved increased the application of External Thermal Insulation Composite Systems (ETICS) across Europe in the last decades. Nevertheless, the implementation of appropriate maintenance strategies is still neglected. The aim of this study is to analyse the impact of different maintenance strategies. For that purpose, a condition-based maintenance model, based on Petri nets, is used to evaluate three maintenance strategies: MS1—total replacement only; MS2—combination of minor intervention and total replacement; and MS3—combination of cleaning operations, minor intervention, and total replacement. In the end, a multi-criteria analysis is used to discuss the impact of the three maintenance strategies proposed, evaluating the remaining service life, the global costs over time, the ETICS’ degradation condition, and the number of replacements (end of service life) over the time horizon. For this purpose, a sample of 378 ETICS was analysed, based on in situ visual inspections, carried out in Portugal. The results from this study reveal that maintenance plays an important role to increase the durability of ETICS, and therefore their sustainability. Regular maintenance can promote the extension of the ETICS’s service life between 88% and 159% (between 15 to 27 years), improve the global degradation condition of the ETICS, and reduce the impact on users by reducing the number of deeper interventions. Further research is essential to optimise the maintenance strategies (time interval between inspections, stakeholders’ performance criteria, and environmental exposure).

1. Introduction and Background

In the last decades, with the increase of awareness of the concept of sustainability and the need of reducing the energy consumption in the construction sector [1], the application of External Thermal Insulation Composite Systems (ETICS) has increased across Europe [2]. ETICS is an insulation system applied directly to façades, composed, in general, of a thermal insulation layer fastened to the substrate, a base coat and a finishing coat [2], being an excellent choice in rehabilitation [3,4]. According to the European Association for ETICS [2], their use decreases thermal transmission through the walls, allowing costs savings from heating and cooling of 50% or more (consequently, a reduction of the CO2 emissions) and increasing the thermal comfort and indoor air quality of the buildings. Furthermore, ETICS increase the durability of buildings as they protect the structure from the environmental exposure conditions.
However, the implementation of appropriate maintenance strategies is still neglected. To start with, as for other façade cladding materials, maintenance is still unplanned, unsystematic, and cost-inefficient [5]. Then, since it is a more recent solution (when compared with the more traditional façade claddings, such as render, natural stone or ceramics), information in the technical specifications is vague about maintenance needed (in terms of technology, application, and periodicity) [6]. The natural phenomena of ageing and the impact of the external factors have a great contribution to the performance over time of ETICS [6]. For instance, surface dirt it is not just an aesthetical anomaly. It can be the beginning of more serious problems. The presence of surface dirt increases the probability of growth of microorganisms and, consequently, the development of cracks and corrosion, influencing the functionality, safety, and durability of ETICS [6].

1.1. Background

Consequently, to obtain more sustainable and durable ETICS over time, the increase of the knowledge about its characteristics and behaviour is fundamental. Over the last years, several studies have been performed in this field. To facilitate and standardize the inspection, diagnosis, and repair processes, Amaro et al. [7] developed an expert knowledge-based system. The information provided by the system aids the analysis of ETICS’ degradation condition based on visual assessment. The failure modes are another important feature to understand the ETICS’ durability. Daniotti et al. [8] refer that studying the agents-actions-effects chains allows differentiating the most common failure modes and, consequently, identifying the most adequate response. According to the authors, the failure modes depend on the properties of the coat and the insulation used, and are influenced by the weather, design and application errors. The durability of ETICS was also studied by Edis and Türkeri [9], who refer that durability is dependent of the workmanship’s quality during the construction and the maintenance process. Furthermore, the authors conclude that the existence of defects increase the risk of vulnerability to premature degradation and, consequently, affects the ETICS’ performance over time. Krause and Nowoświat [10,11] studied the influence of solar radiation intensity on unprotected thermal insulation boards during the construction works. The results reveal that strong radiation intensity and windless conditions can damage the insulation boards, affecting their physical properties. Antošová [5,6] analysed the impact of biocorrosion on the durability of ETICS. The author refers that lack of maintenance can reduce the service life from 16 to 11 years. The importance of maintenance is a common observation in the studies on ETICS’ durability. Several authors refer that regular monitoring and maintenance considerably increase the performance and durability of ETICS [5,6,8,9] and are fundamental to develop more accurate service life predictions [12]. For example, Parracha et al. [13] refer that the adequate protection of the finishing coat can increase the service life beyond the 25 years defined by the Guideline for European Technical Approval of ETICS [14]. Furthermore, the development of these studies is the first step to convince stakeholders that maintenance is essential to ensure the functionality of the buildings and their components [5,6].
Literature about maintenance of ETICS is scarce [15]. In this sense, to develop economic and/or environmental analysis tools for this constructive solution, it is essential to understand its degradation process and the impact of maintenance activities [16]. During the last years, maintenance models have been widely developed for different types of structures and components, such as: mechanical items [17,18]; bridges [19,20]; steel structures [21,22]; and/or buildings and their components [23,24,25,26,27,28]. Although different, all these methodologies have three common parts: data collection, predicting process, and maintenance planning [22].
The degradation condition of the elements is not continuously known. The data collection, through inspections and/or surveys [21,23,24,25,26,27,28], allows detecting and identifying damage, and are the foundation of the degradation process. The degradation process of ETICS can be influenced by several causes, due to the different environmental conditions, the nature of the materials, the cladding’s technology, and the characteristics of the substrate, among others. During the last years, different service life models were developed and used to estimate the service life of ETICS and other constructive solutions. Among them are: (i) statistical analysis [29]; (ii) simple regression analysis [30]; (iii) multiple liner regression analysis [31]; (iv) factor method [32]; (v) Markov chains [33]; and (vi) fuzzy models [34]. The information gathered from these studies proved to be fundamental to define maintenance planning, optimize the use of resources, and minimize the overall costs of the building over its service life [35]. Non-deterministic models are especially advantageous since they can capture the uncertainty associated with the subjectivity of the data collection and the natural variability of the degradation process [19,20,21,27,28]. Furthermore, the knowledge acquired through service life models can be used to support decision-making and optimize maintenance activities and costs. In maintenance planning, the identification of the most suitable maintenance activities is essential in order to avoid accelerating the degradation process or damage the cladding [36].
Therefore, the literature reveals that an efficient maintenance and management methodology is needed to increase the durability, guarantee the performance, and extend the service life, not just of ETICS, but also of other types of structures and components. Moreover, this is only possible after understanding the natural ageing phenomena and the behaviour towards environmental exposure and maintenance interventions [37].

1.2. Objectives

Therefore, the main purpose of this work is to analyse the impact of different maintenance strategies have on the durability of ETICS. In this study, the impact is assessed through four parameters: service life, whole-life maintenance costs, efficiency index and total number of interventions. For that purpose, a condition-based maintenance, based on Petri nets, is used. Three maintenance strategies are considered: MS1—total replacement only; MS2—combination of minor intervention and total replacement; and MS3—combination of cleaning operations, minor intervention, and total replacement. MS1 represents the most solution adopted by buildings’ owners [38]. MS2 and MS3 are two alternatives to analyse the impact that regular maintenance can have on the ETICS’ service life and on the whole-life maintenance costs [39,40]. In the end, a multi-criteria decision analysis (MCDA) is performed to assess the impact of the different maintenance strategies. As a case study, a sample of 378 ETICS is analysed, based on in situ visual inspections carried out in Portugal. Although there is an increase in maintenance costs, the outcomes reveal that regular maintenance promotes the durability of ETICS and, consequently, their sustainability.
The incorporation of the simplified multi-criteria analysis to weight the different parameters that influence the adoption of maintenance strategies allows supporting the stakeholders in the decision-making process. In the literature, there are some studies about the standardization of the inspection, diagnosis, and repair processes of ETICS, as well as about the impact that given agents/actions have on its durability. However, none of the existing studies implement a full life-cycle model that includes the degradation, inspection, maintenance, and renewal processes. Moreover, none of these studies adopt multi-criteria decision analysis to aid the selection of a given maintenance strategy, considering its stakeholders’ maintenance requirements over the claddings’ life cycle.

2. Methodology

To assess the performance of ETICS, a condition-based maintenance model based on Petri nets is implemented. In this model, the interventions are planned after the degradation condition has been assessed through inspections. The assessment of the degradation condition is carried out based on the visual evaluation of existing damage/anomalies. The influence of the different maintenance strategies is assessed through a multi-criteria analysis, by analysing the remaining service life, the global costs over time, the ETICS’ degradation condition, and the number of replacements (end of service life) over the time horizon. This methodology was previously applied to different constructive solutions: ceramic tiling systems [41], natural stone claddings [42], and ceramic claddings in pitched roofs [43].

2.1. Classification System

The definition of a classification system is essential in any maintenance methodology. This system allows tracing the degradation condition of ETICS over their service life. In this study, the classification system is based on the visual evaluation of the existing defects and their number, size and area affected [30]. The classification system is divided into five degradation conditions (Table 1). Condition A exemplifies an ETICS in an excellent condition: with no visible degradation. Condition B illustrates an ETICS in a good condition. This ETICS presents some signals of surface dirt and microbial grown, and some small cracks. Condition C represents an ETICS with slight degradation, where there is an evolution of the condition B defects and some signals of loss of adherence and/or increase of the crack width. Condition D corresponds to an ETICS with moderate degradation, with pronounced signals of loss of integrity and adherence. Finally, in condition E, the ETICS shows a generalized degradation with severe defects.
In this classification system [30], the overall degradation condition of the ETICS is quantified through the severity of degradation index, Sw, which is given by the ratio between the area affected by the defects observed in an ETICS, weighted according to their severity, and a reference area equivalent to the total cladding area with the highest possible degradation condition (Equation (1)).
S w = A n × k n A × k m a x  
where kn is the multiplying factor of defect n (varies between 0 and 4—Table 1); An the area of cladding affected by defect n (in m2); A the façade’s area (in m2); ∑(kmax) the sum of the multiplying factors for the highest degradation condition of each defect type. Table 1 presents the relationship between severity of degradation, Sw, and degradation condition, C.
A limitation of this classification system is the fact that it does not directly assess the condition of the insulation boards. A damage insulation board can significantly influence the performance of the ETICS [4,10,11]. In this study, the condition of ETICS is analysed based only in visual inspections and, for a strict assessment of the thermal insulation boards, destructive tests must be carried out, which is rarely feasible in practice.

2.2. Condition-Based Maintenance Model

In this study, the effects of different maintenance strategies on the durability of ETICS is carried out through a condition-based maintenance model, based on Petri nets. This model can be considered a life cycle model. Besides stochastically assessing the degradation condition of the ETICS, this model incorporates the uncertainty of the inspection and maintenance processes. The impact of maintenance actions is quantified by assessing the effect of these actions on the severity of degradation, Sw, i.e., through the probability transition between the different degradation conditions. A detailed description of the maintenance model is given in Ferreira et al. [41].
Since the degradation condition of ETICS is not continuously known, the maintenance model assumes that the decision of intervening is made based on the inspection results, i.e., based on the real degradation condition of the ETICS. In addition to inspections, the following interventions are included in the model: cleaning operations, minor interventions, and total replacement [41,44,45]. Cleaning operations are applied to remove part of the aesthetical and visual defects (e.g., surface dirt, stains, and efflorescence) and reduce the microbiological grown. Minor intervention is a more detailed action than cleaning operations. Besides covering cleaning operations, it also consider localized repair and/or partial replacement of the ETICS due to cracks or local loss of adhesion. Finally, in the last level, the whole cladding is replaced. In terms of implementation, it is assumed that a cleaning operation is required when cladding presents a condition B of degradation; a minor intervention when the degradation condition is C; and a total replacement when condition is D or E.
The impact of the different maintenance strategies on the durability of ETICS is assessed through the analysis of four parameters. In the following sections, these parameters are explained.

2.2.1. Service Life

The end of the service life is computed through the cumulative distribution functions of the degradation condition over the time horizon. Based on previous works [46] and experts’ judgement, it is assumed, for ETICS, that the expected end of the service life occurs when condition D is achieved. Mathematically, this instant is reached when the probability of transition between conditions C and D is equal to 50% [41].

2.2.2. Maintenance Costs

The total maintenance cost over the time horizon, th, represents the accumulate costs required to keep the cladding in operation [47] and corresponds to the sum of the costs related with inspections, ∑Cinspections,t, and the costs related with other maintenance activities, ∑Cmaintenance,t (Equation (2)).
L C C = t = 0 t h C i n s p e c t i o n , t + t = 0 t h C m a i n t e n a n c e , t
To consider the future costs, Equations (3) and (4) are used to compute the net present value of the inspection and maintenance activities, respectively [48,49].
t = 0 t h C i n s p e c t i o n , t = t = 0 t h C i n s p e c t i o n 1 + υ t
t = 0 t h C m a i n t e n a n c e , t = t = 0 t h C m a i n t e n a n c e 1 + υ t
where Cinspections and Cmaintenance are the costs of the inspection and other maintenance activities at time t, respectively, and υ the real discount rate. In this study, a υ value of 6% is adopted (a private sector environment is adopted) [47,50].

2.2.3. Efficiency Index

The efficiency index, EI, measures the ability of a maintenance strategy to maintain the ETICS in a good condition—Equation (5).
E I = 0 t h S w t d t 100 · t h
where ∫ Sw(t) dt represents the area underneath the degradation curve (loss of performance), and 100 · th the area underneath the degradation profile when there is no degradation (theoretical situation). EI varies between 0 and 1. The more efficient maintenance strategies present higher EI values.

2.2.4. Number of Interventions

The number of interventions represents the average number of times that the different actions (cleaning operations, minor interventions, and total replacement) are carried out in the cladding during the time horizon.

2.3. Multi-Criteria Decision Analysis

Since the definition of maintenance strategies is a multi-objective problem, in this study, a multi-criteria decision analysis (MCDA) is implemented to analyse the impact of the different maintenance strategies. Besides aiding stakeholders to evaluate the information available, MCDA can be implemented to identify a single alternative, reduce the number of alternatives for more detailed assessment or divide the available options in acceptable and unacceptable possibilities [51]. In this study, Equation (6) is used to globally rank the options [52,53].
X i = j = 1 m w j · x i j ,   with   j = 1 m w j = 1   or   100 %
where Xi is the global rank of the option i, wj the weight of criterion j, and xij the normalized classification of option i according to criterion j. The normalization of the criteria is performed through Equations (7) and (8) for an increased and decreased order of preference, respectively [54].
x i j = X i j min X i j max X i j min X i j ,
x i j = max X i j X i j max X i j min X i j
where Xij is the classification of option i according to criterion j, and min Xij and max Xij are, respectively, the minimum and maximum value of criterion j.

3. Results and Discussions

In this case study, three maintenance strategies are analysed to investigate their influence on ETICS. The maintenance strategies selected range from total replacement of the cladding (MS1), a moderate intervention (MS2) that includes minor interventions and total replacement, and a more careful intervention (MS3) that combines cleaning operations, minor interventions, and total replacement. The aim of MS1 is to represent the maintenance strategy most commonly used by owners/managers [38], while MS2 and MS3 represent maintenance strategies more complete.
Table 2 and Table 3 present the input data of the maintenance model. In Table 2, the optimal parameters of the degradation process are identified. In this study, it is considered that the degradation process follows a Weibull distribution [55]. The parameters in Table 2 are presented in terms of mean, Ti, and standard deviation, SDi, of the sojourn time in each degradation condition. For instance, for ETICS, the transition between conditions A and B takes, on average, 1.8 years to occur, with a standard deviation of 2.4 years. The same analysis can be used for other condition transitions. In Table 3, the data related with the maintenance activities are presented, namely costs, application zones and the impacts in the cladding (in terms of probabilities, P). The information presented in this table can be understood in the following way: for ETICS, a cleaning operation has a cost of 26.88 €/m2 (including scaffolding installation), can only be applied when the cladding is in condition B, and has a probability of 34.9% of improving the cladding’s condition to A and 65.1% of maintaining condition B. Furthermore, a time horizon, th, of 50 years, a time interval between inspection of 3 years, and an initial severity of degradation, Sw, of 0% (condition A) at the beginning of the analysis are assumed.
In Table 3, all costs are estimated based on CYPE cost database [56] and the impact of the maintenance activities is based on the historical in situ inspection data, by assessing the impact that the different interventions have on the severity of degradation index, Sw [57]. The following assumptions are adopted to estimate the costs and the impact of the maintenance activities:
  • Construction solution: An expanded polystyrene boards with a thickness of 6 mm as thermal insulation material and acrylic-based coat as finishing material is considered;
  • Cleaning operations: Clean 100% of the cladding area affected by superficial dirt, drainage marks, efflorescence, lichen, and algae. This action includes scaffolding installation, water jet cleaning, brushing of the efflorescence, and application of biocides to remove the biological colonization;
  • Minor intervention: Repair up to 19% of superficial cracks by replacing the finishing coat, and 4% of deeper cracks through localized replacement of the entire ETICS. Replacement up to 8% of the reinforcement corner profiles caps deteriorated. Repair up to 30% of the area affected by blistering, peeling and visible joints between panels by replacing the finishing coat;
  • Total replacement: Corresponds to the replacement of the entire cladding. This intervention includes scaffolding installation, demolition of the old cladding, application of a new cladding and transport, deposition and treatment of constructive waste generated by the intervention.

3.1. Individual Analysis of the Parameters

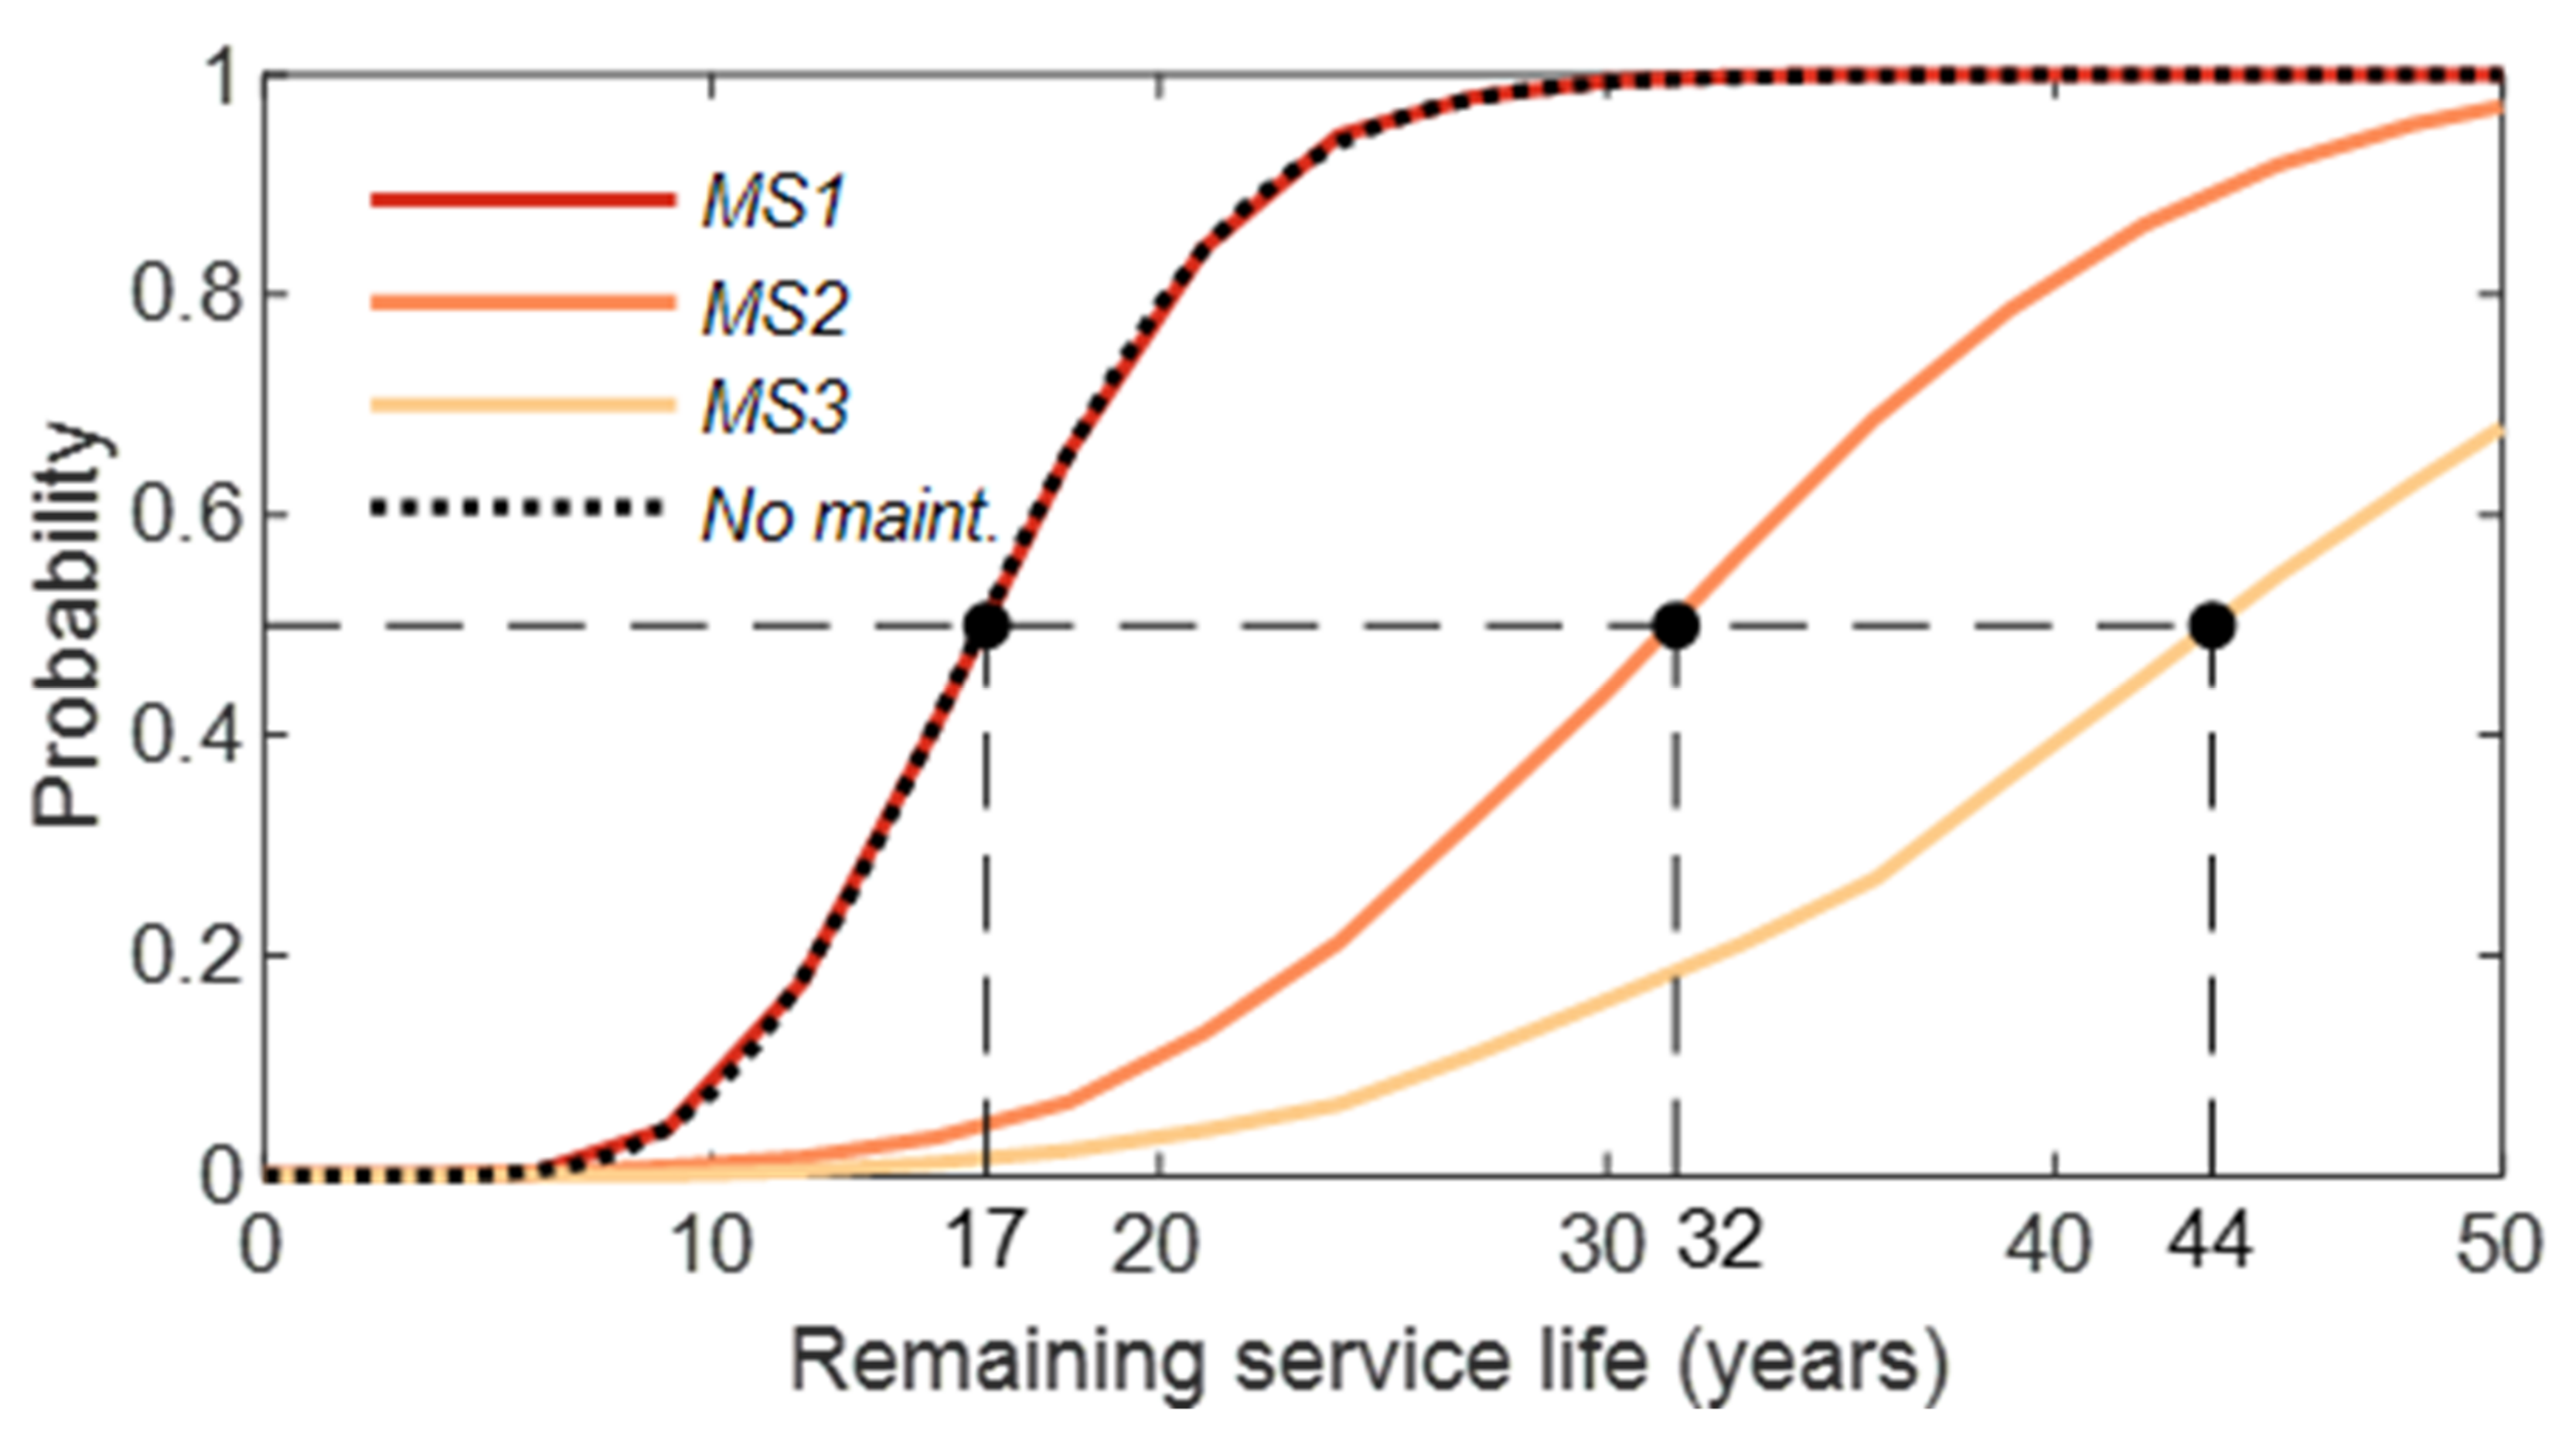
For this case study, the end of the service life for the three maintenance strategies (MS1 to MS3) and for the situation without maintenance is presented in Figure 1 as black dots. This figure reveals that the performance of regular preventive maintenance activities (such as cleaning operations minor interventions) over the time horizon has a significant impact on the service life of the ETICS. For example, by comparing with MS1 or no maintenance, MS2 allows delaying the ETICS’s total replacement by 15 years (increasing the service life from 17 to 32 years) and MS3 by 27 years (increasing the service life from 17 to 44 years).
Furthermore, two other observations should be made based on 
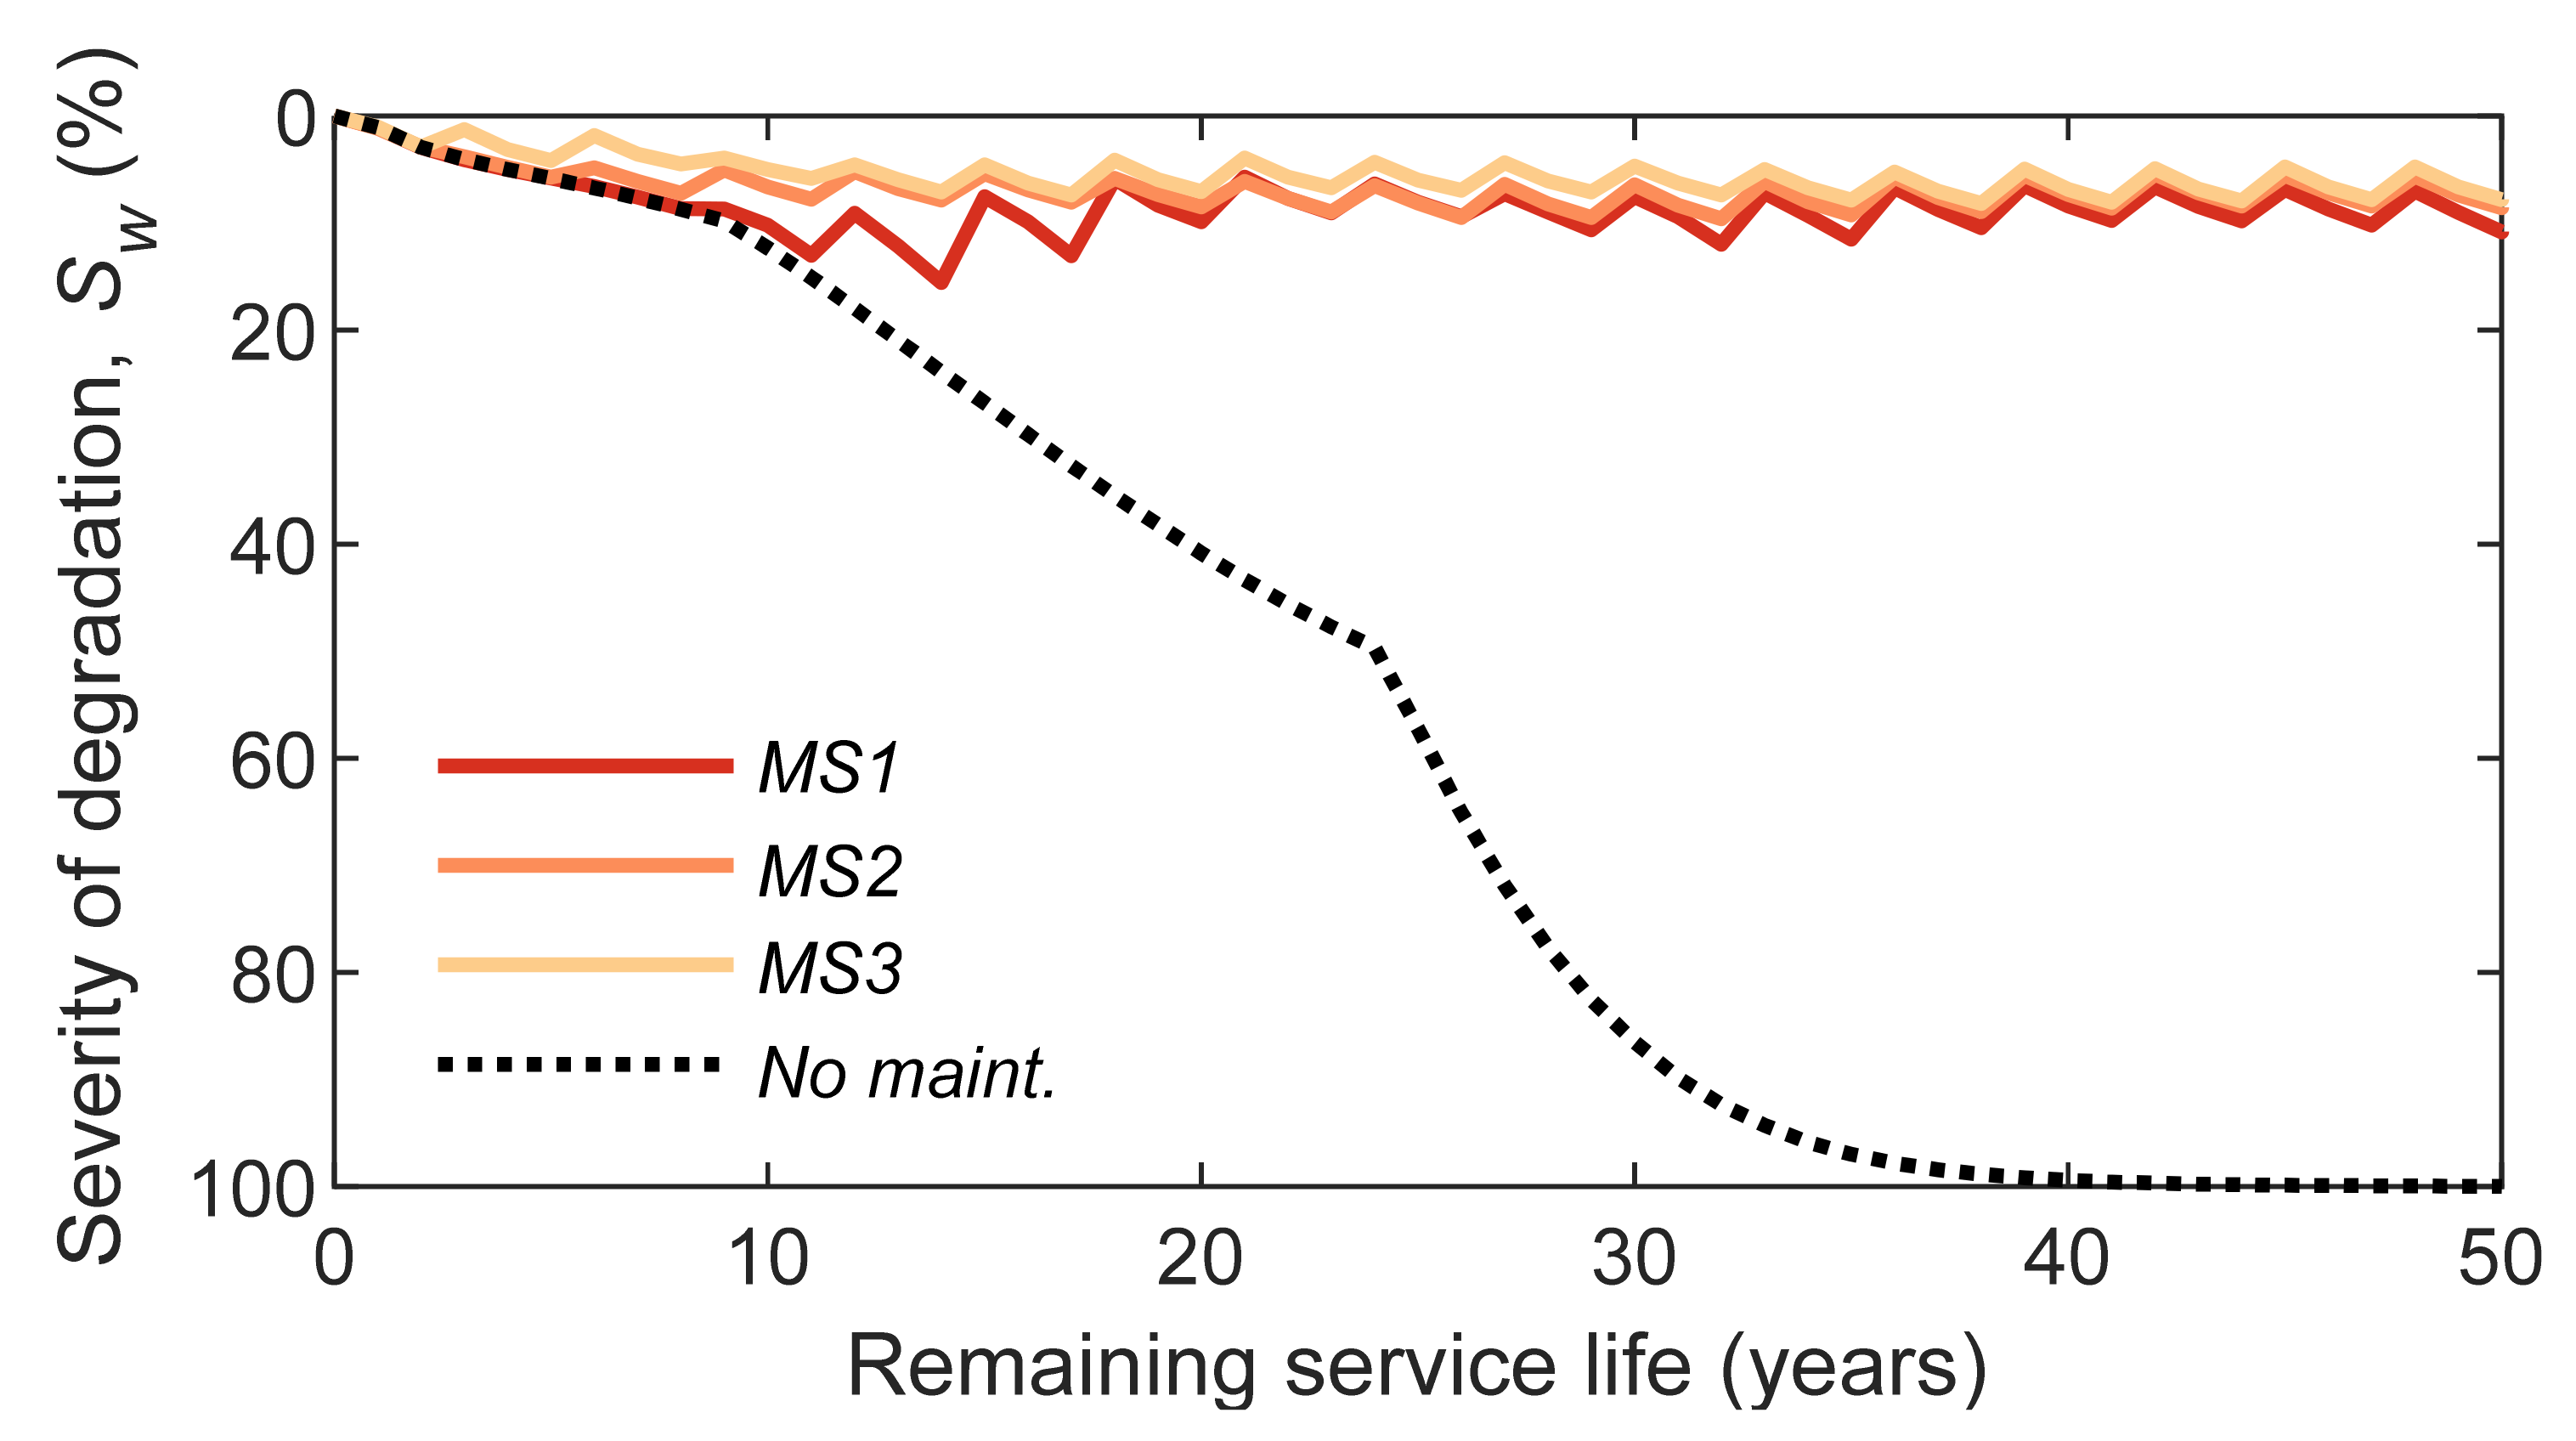
Figure 1. First, the cumulative distribution functions of the three maintenance strategies are related with the first total replacement performed on the ETICS, i.e., according to the time horizon defined, it is possible that the ETICS go through more than one total replacement. However, to estimate the service life of the maintenance strategy, only the cumulative distribution function of the first replacement is relevant. Secondly, the service lives obtained for MS1 and for the situation without maintenance are equal. As mentioned before, in MS1 only total replacement is considered; therefore, these two situations will have the same behaviour until condition D is reached. In other words, for the two situations, the ETICS degrades continuously until condition D without any maintenance being performed. When condition D is achieved, for MS1 the cladding is completely replaced while, in the situation without maintenance, the cladding continues to degrade. This can be checked through the average degradation curves (Figure 2).
In Figure 2, the average degradation curves, in terms of severity of degradation, are compared for the three maintenance strategies and for the situation without maintenance. In contrast to the degradation curve of MS1, the degradation curve of the situation without maintenance degrades continuously until condition E (Sw > 50%—Table 1). Once this condition is reached, the cladding remains in condition E until some action is taken (replacement or demolition). In MS1, since the maintenance plan specifies that the cladding is replaced whenever condition D (30% < Sw ≤ 50%) is reached (Table 3), the average severity of degradation, Sw, improves significantly over the time horizon, ranging between 0 and 20%. In Figure 2, each “peak” in the degradation curves corresponds to an inspection moment where the ETICS is intervened in an independent degradation curve. Since Monte Carlo simulation is implemented in the maintenance model to deal with uncertainty, in the degradation curve not only one “peak” that would correspond to the exact moment in which the intervention would be performed is visible, but rather several “peaks” that propagate over time, because the moments in which the interventions are carried out are distinct in the different independent degradation curves. In addition, by comparing the three maintenance strategies, it is found that, as the maintenance strategies become more complex (from MS1 to MS3), the average severity of degradation, Sw, becomes better (more favourable) over time. This observation can be corroborated by the efficiency index, EI, (Table 4).
As explained in Section 2.2, the efficiency index measures the ability of one maintenance strategy to maintain the cladding in a good condition, and is given by the percentage of area underneath the degradation curve (Figure 2)—Equation (4). Table 4 shows that, as the maintenance strategies become more complex, the efficiency index increases (from 0.37 to 0.93 for the time horizon of 50 years), meaning that the maintenance strategies are more efficient and, consequently, the claddings remain longer in the most favourable degradation conditions, such as conditions A and B, over the time horizon.
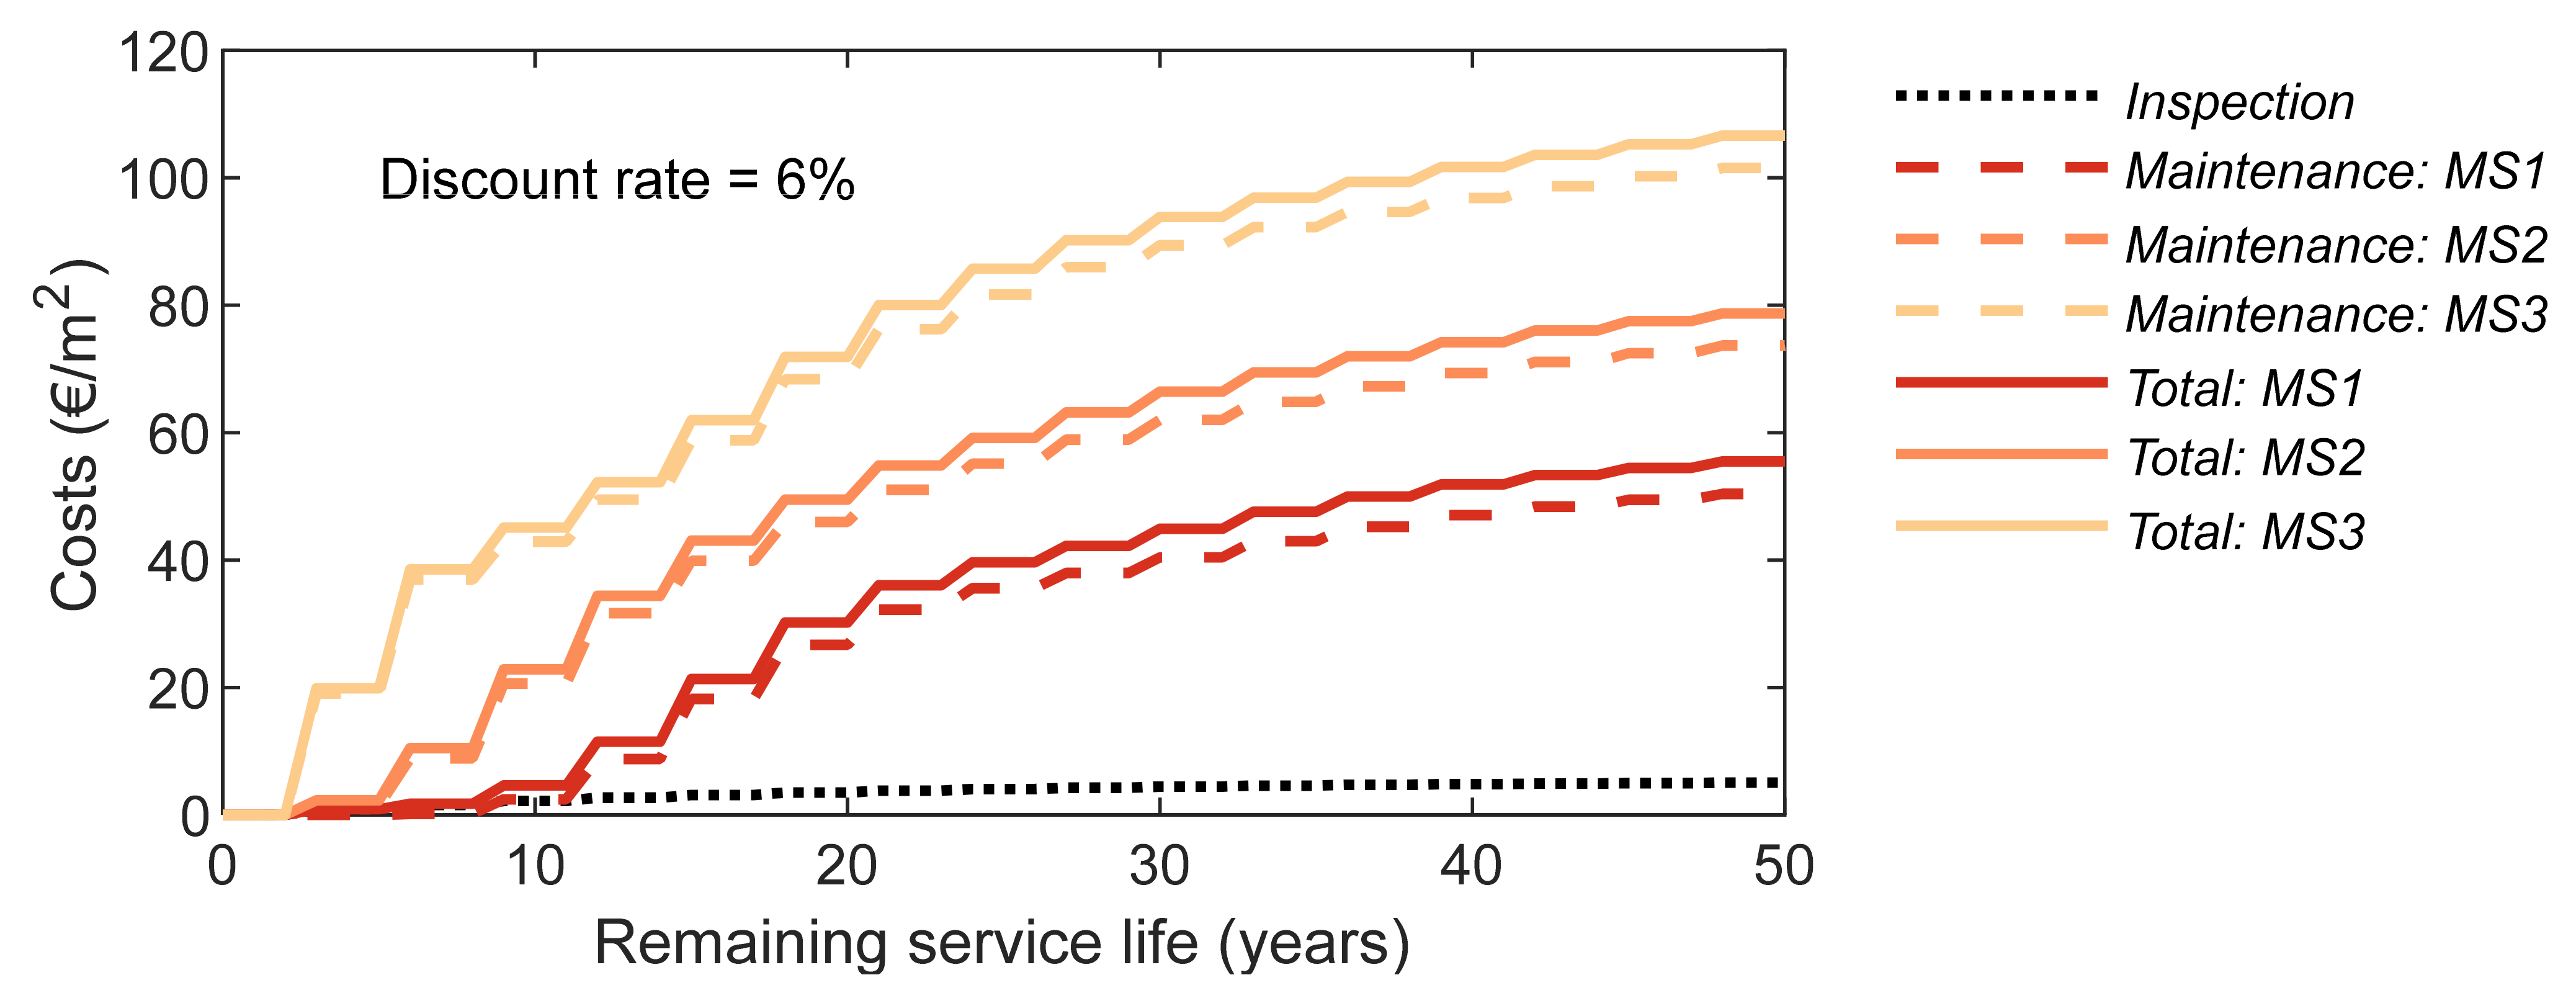
Finally, if the costs of the three maintenance strategies studied are compared (Figure 3), the results reveal, as expected, that, as the maintenance strategies become more complex, their expected cost over the time horizon increases. In this study, MS3 is the solution that has the highest maintenance costs (101.54 €/m2, at year 50) and MS1 the solution with the lowest maintenance costs (50.40 €/m2, at year 50). For the three maintenance strategies, the inspection costs are equal (5.06 €/m2, at year 50) since an inspection period of 3 years is adopted in all analyses. Furthermore, the results show that the maintenance costs are very significant when compared with the initial costs of application of the ETICS. A cost of 78.38 €/m2 is assumed as an initial cost of application of the ETICS. The total cost of MS1 corresponds, approximately, to 71% of the initial cost; MS2 corresponds to 100%; and MS3 corresponds to 136% (corresponds to the cost of a new ETICS plus the cost of demolition of the old cladding and transport, deposition and treatment of constructive waste generated by the intervention).
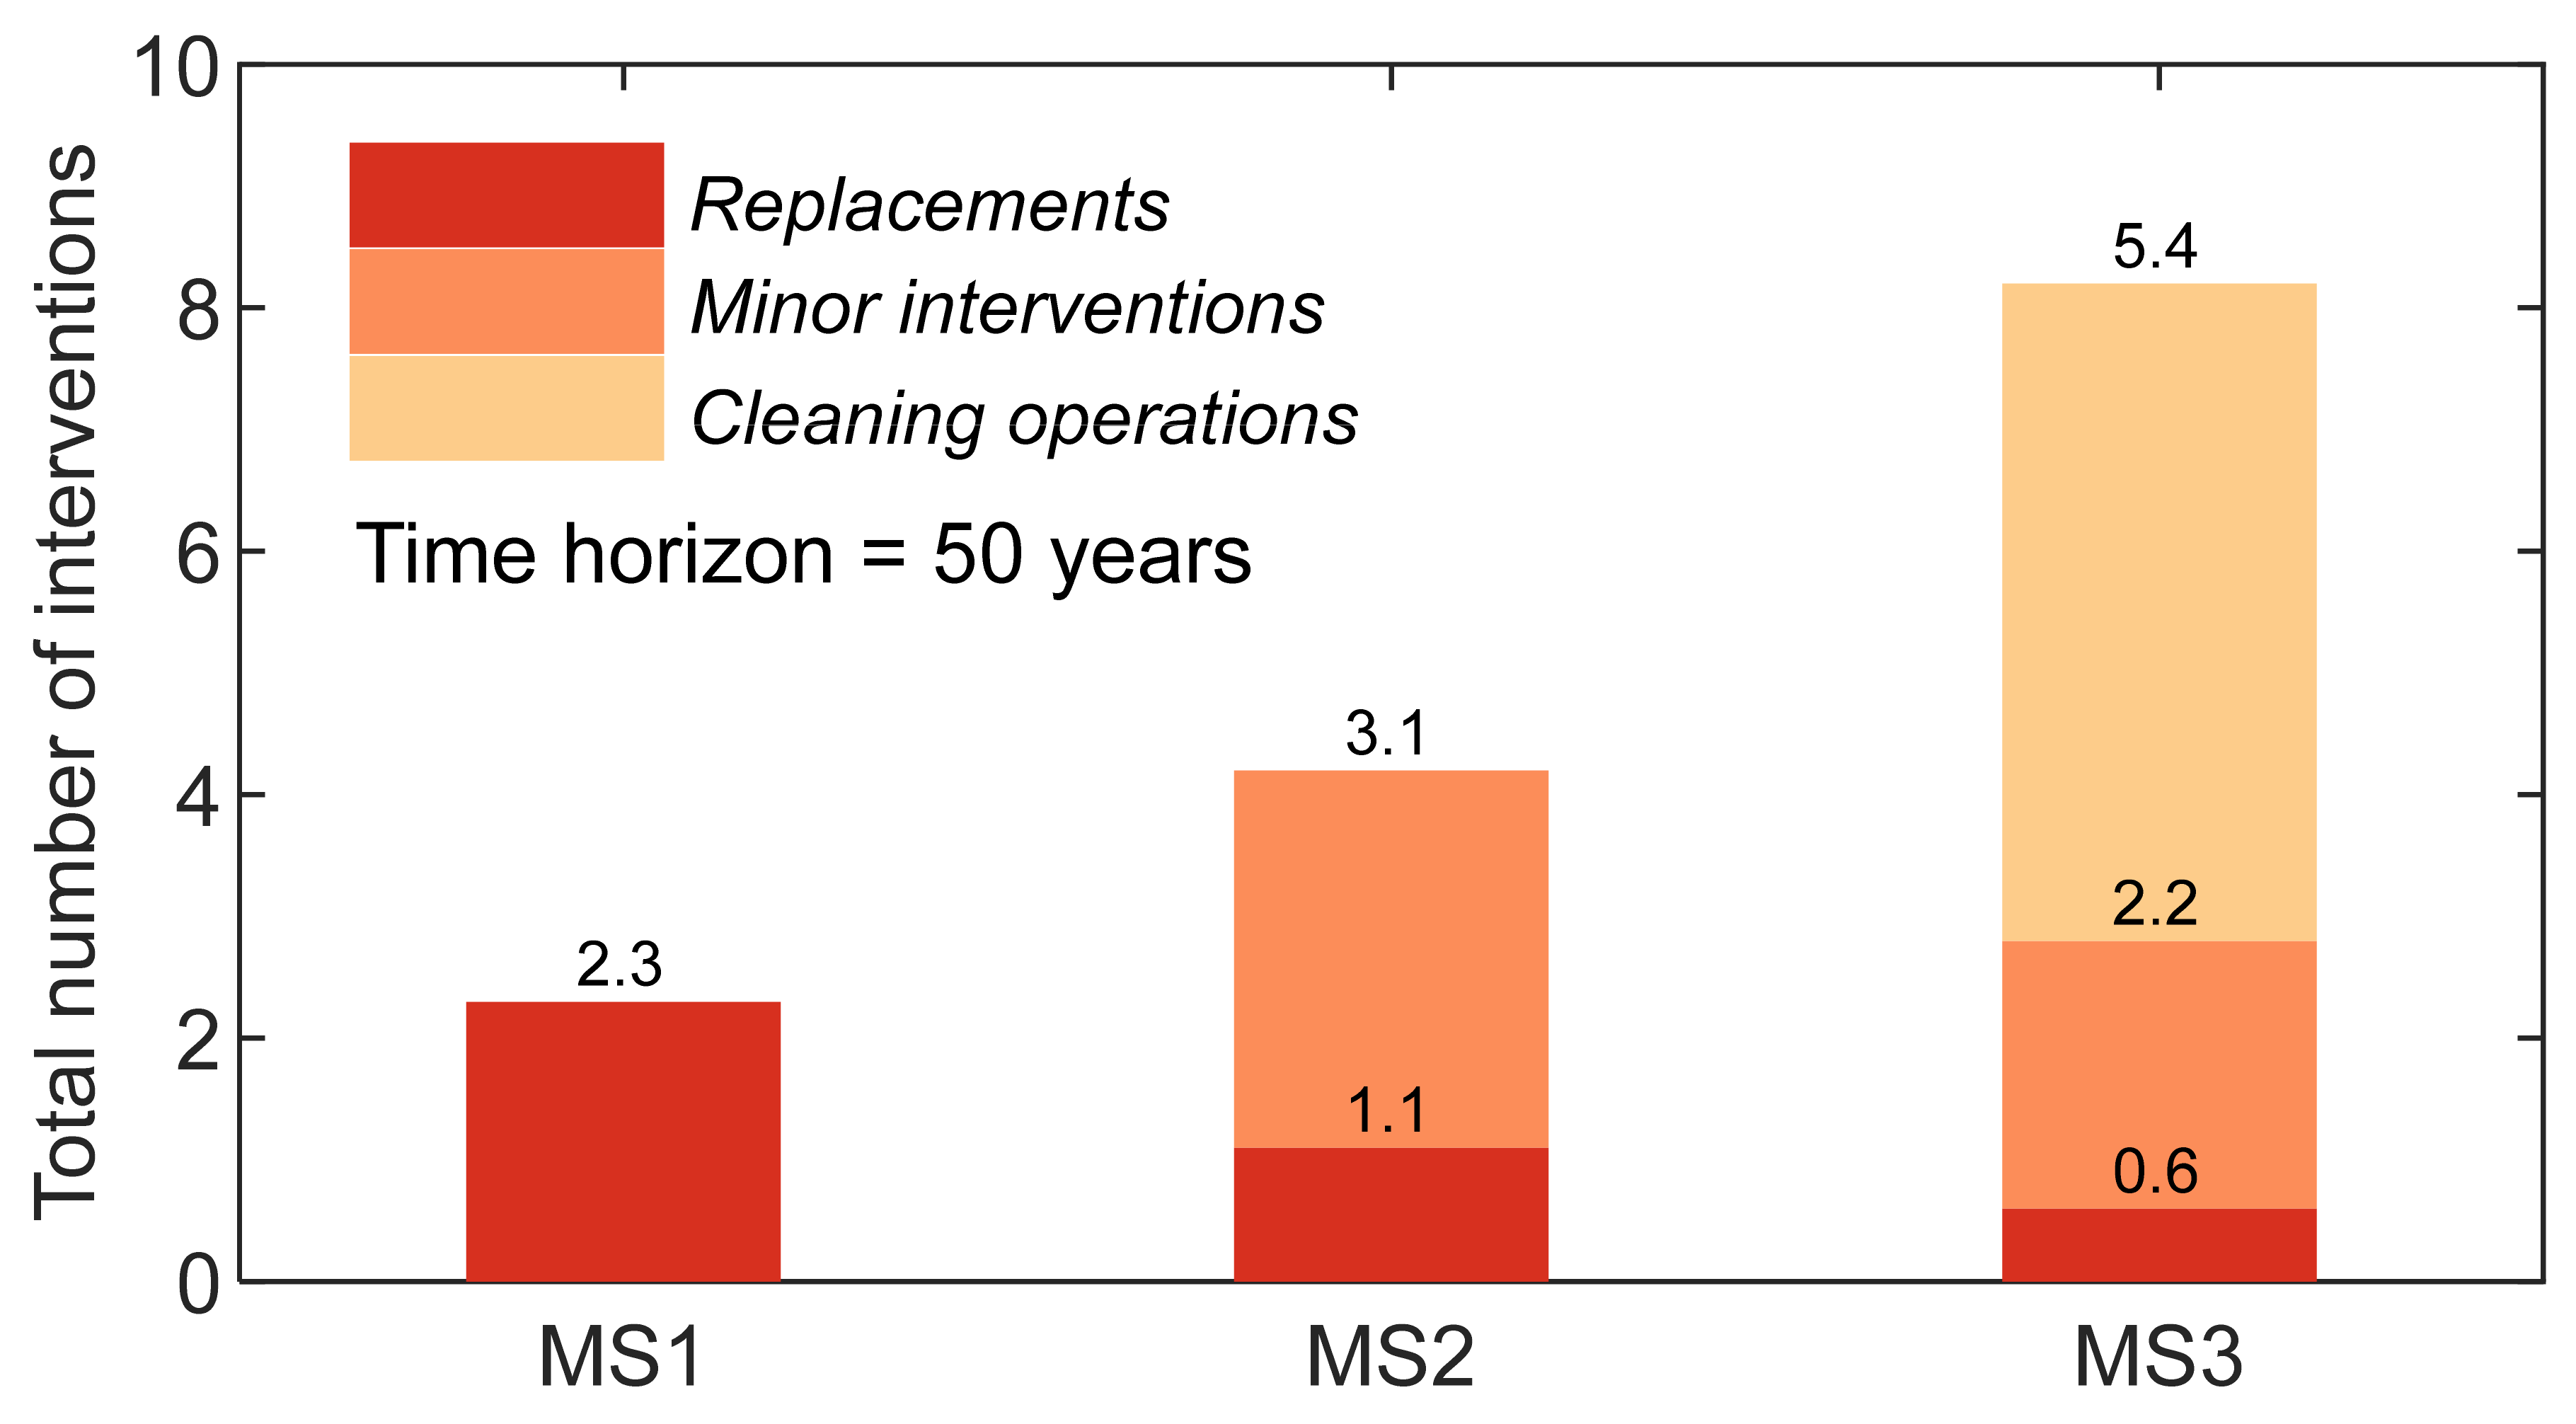
Furthermore, the maintenance strategy costs are directly related with the number of interventions. Figure 4 compares the average number of interventions by maintenance strategy. As the maintenance strategies become more complex, the global number of interventions increases, which implies the increase of their associated costs. On the other hand, Figure 4 reveals that the number of total replacements decreases as the complexity of the maintenance strategies increases, confirming that more complex maintenance strategies are best options when it is important to reduce the users’ annoyance and discomfort during the time horizon.

3.2. Multi-Criteria Decision Analysis

In this study, a multi-criteria decision analysis is used to globally rank the different maintenance strategies. For that purpose, three parameters are analysed: C1—Efficiency index; C2—Maintenance costs (including the inspection costs); and C3—Total number of replacements. Figure 5, Figure 6 and Figure 7 present the results obtained by the MCDA (in Appendix A are presented the initial decision-making matrix—Table A1; the normalized decision-making matrix—Table A2; and the ranking results for the three case—Table A3, Table A4 and 
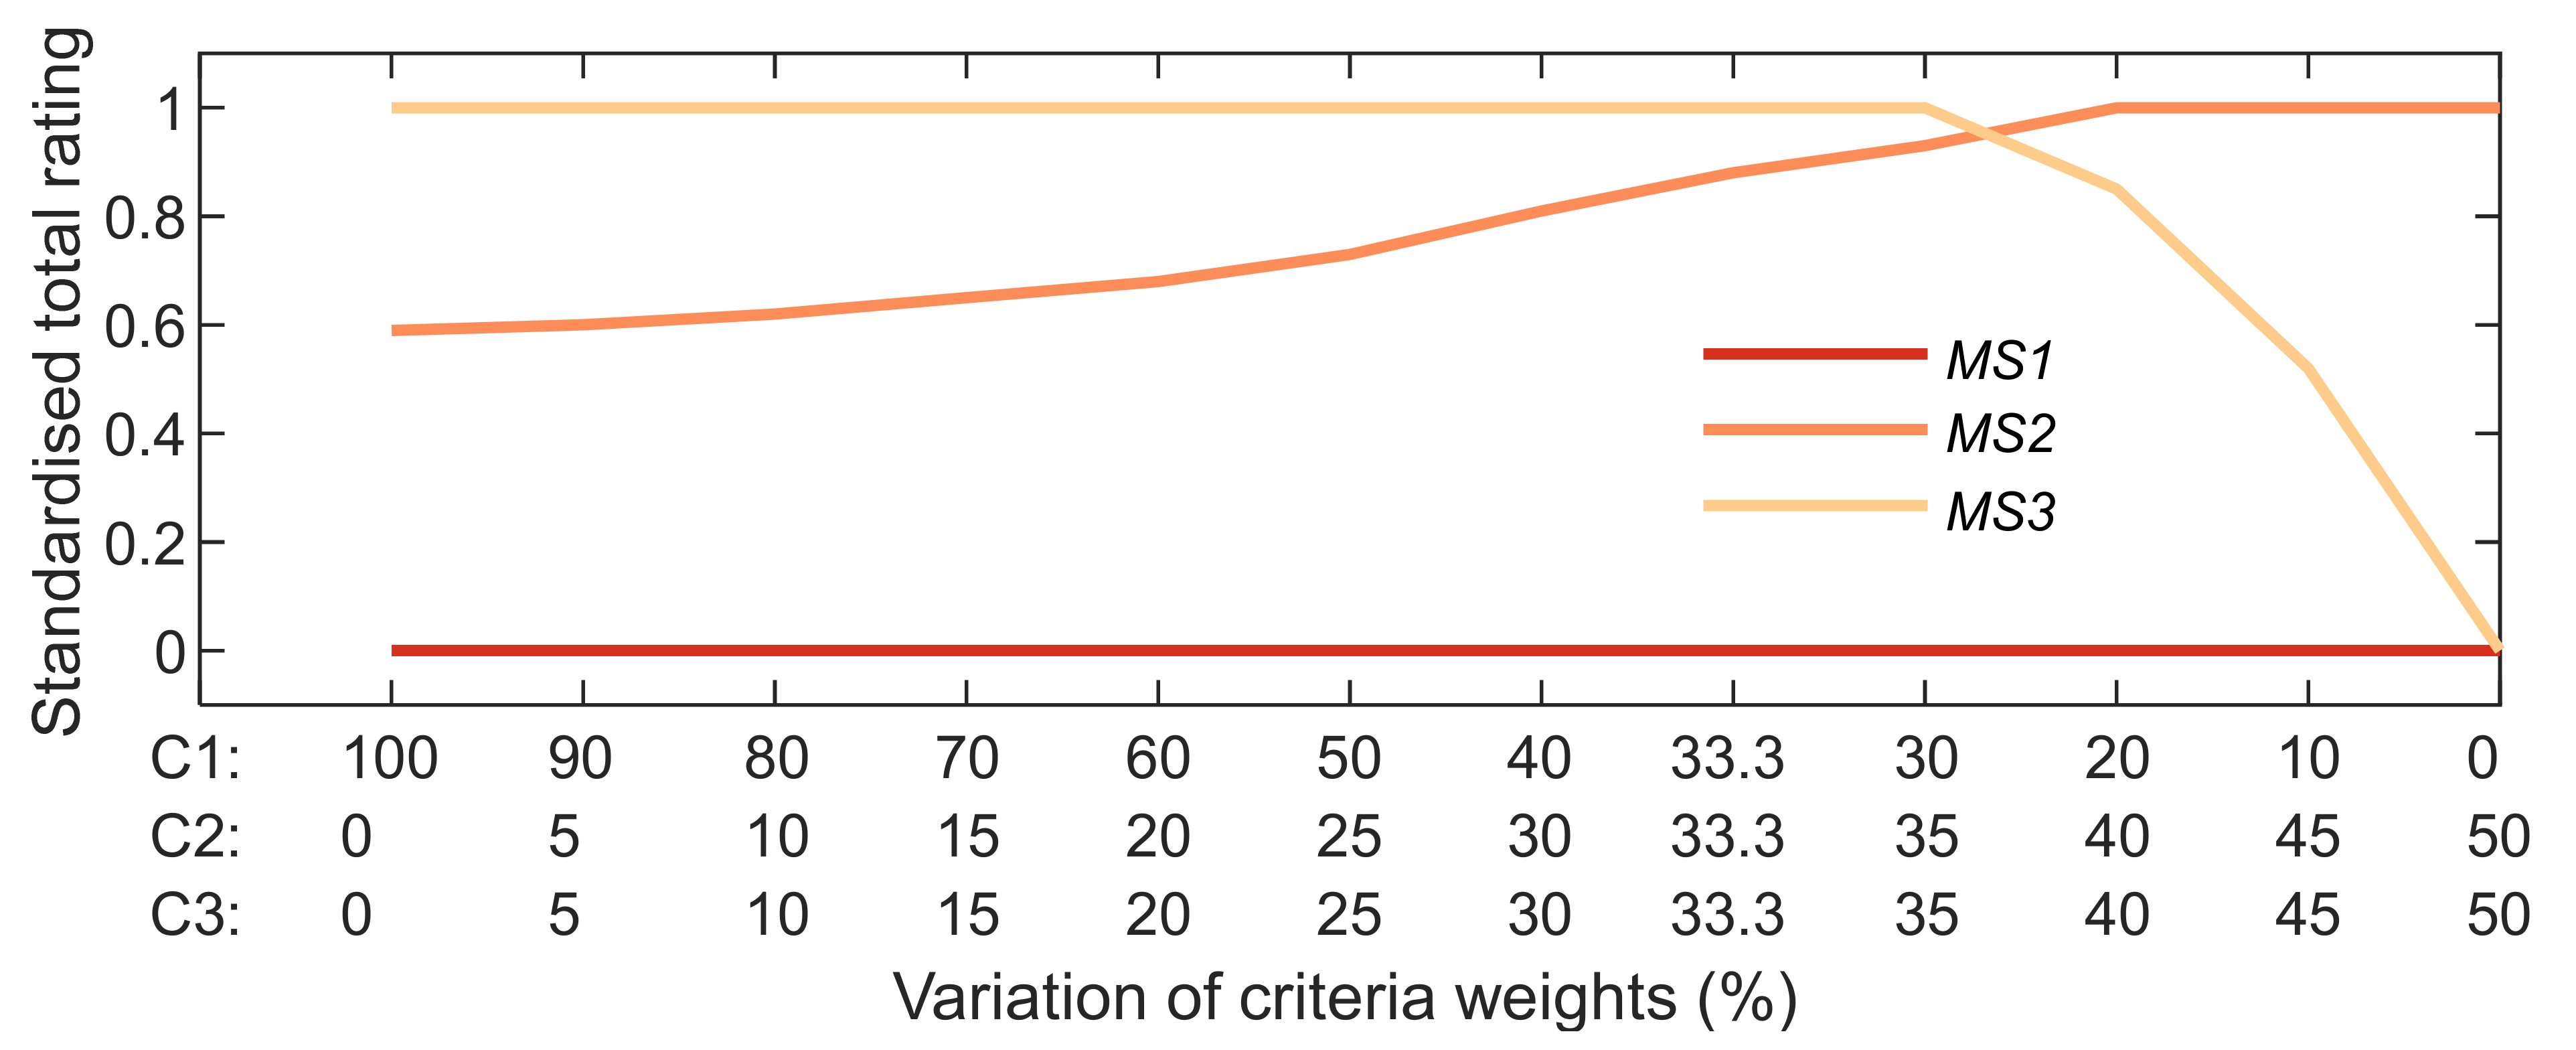
Table A5). These figures show how the global ranking of the different maintenance strategies varies according to the criteria adopted. The variation of the efficiency index weights is presented in 
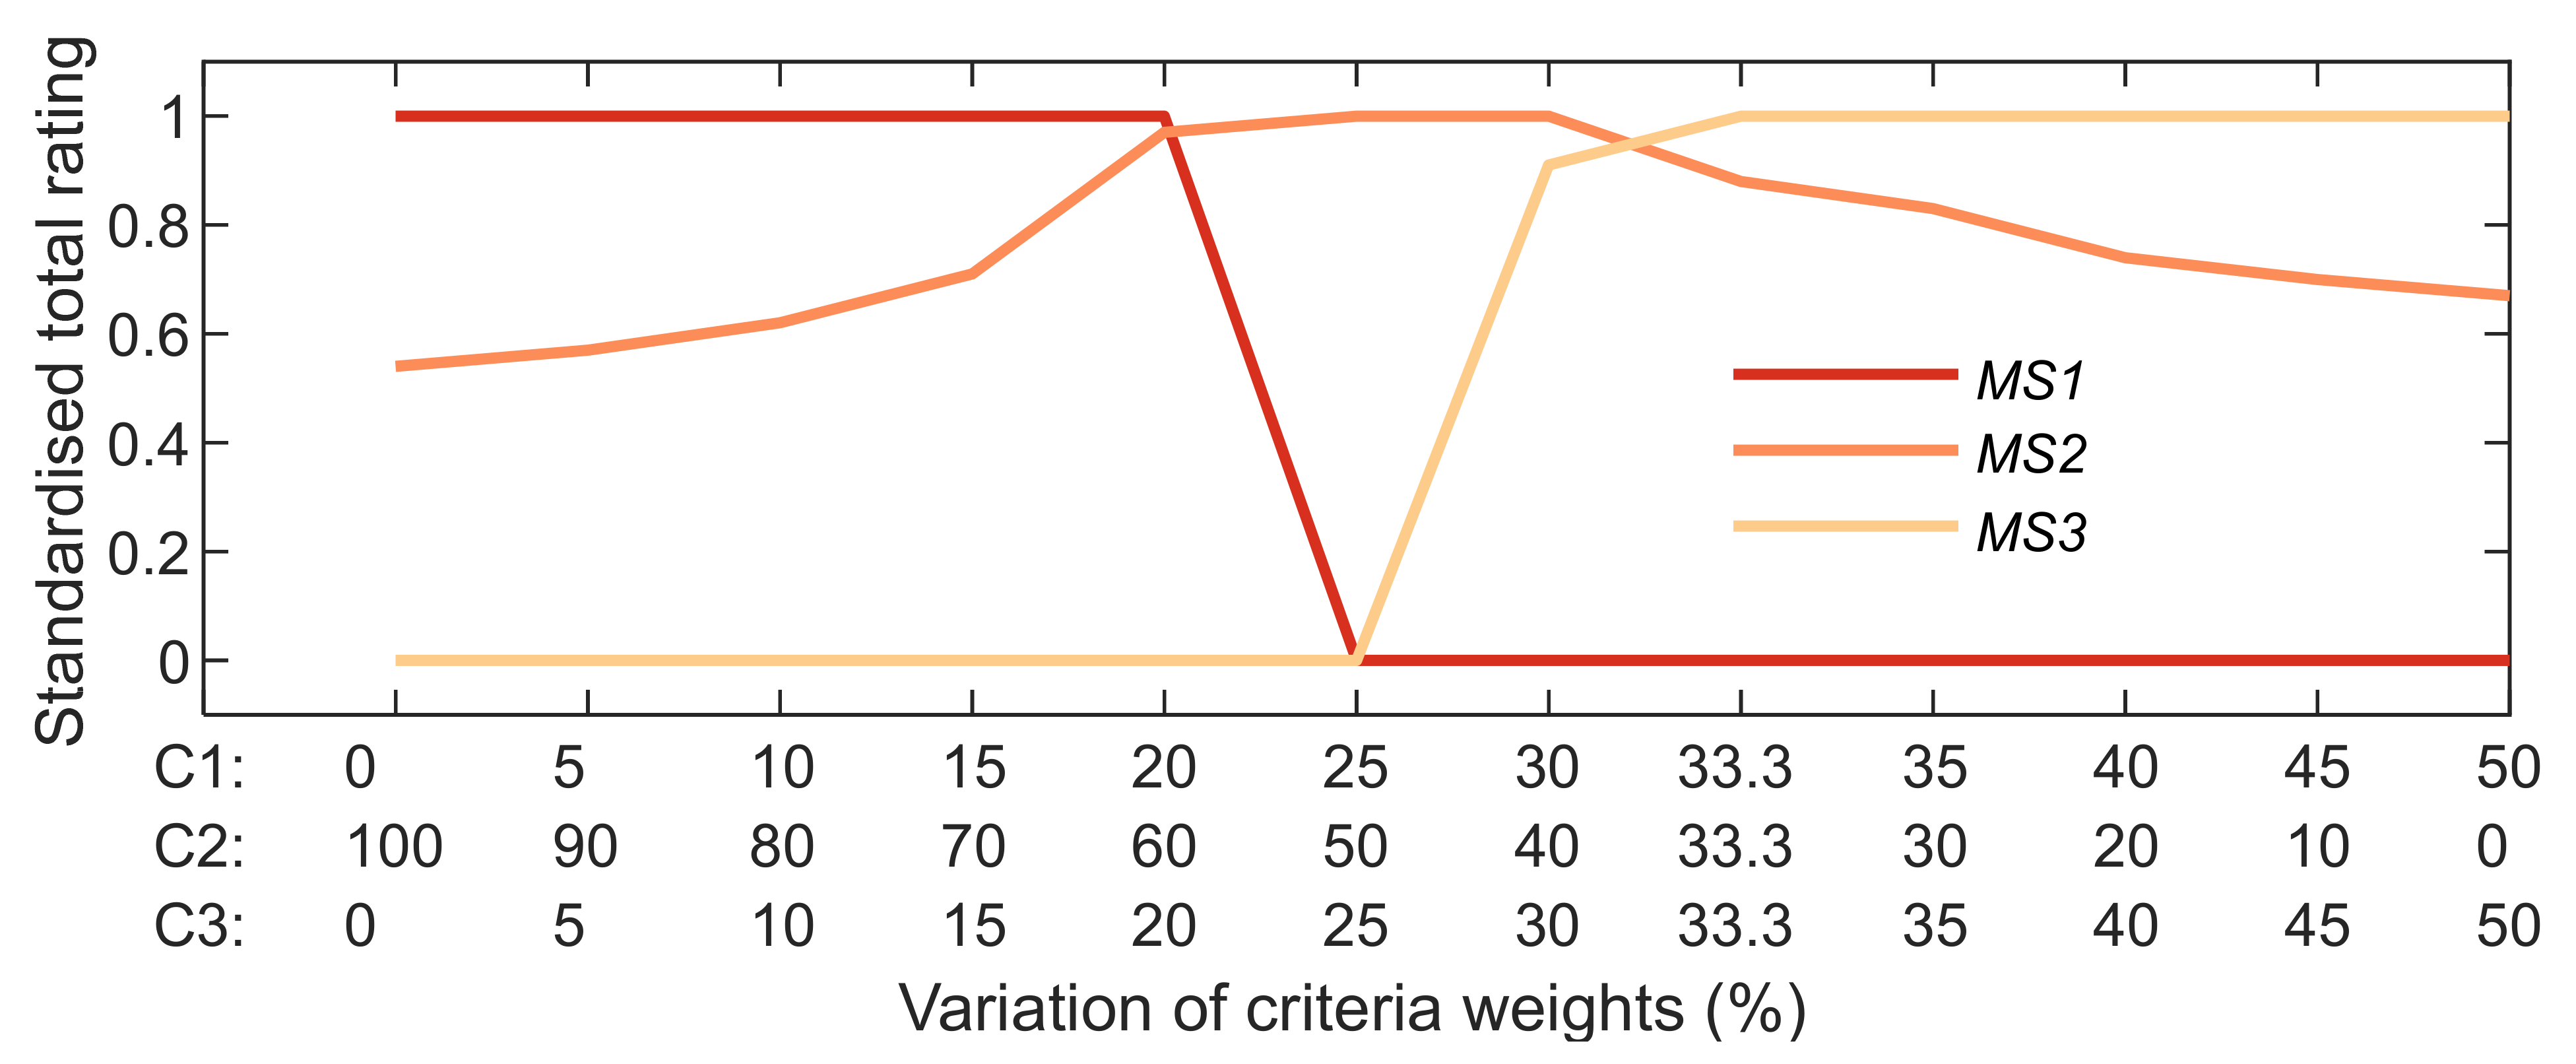
Figure 5, the maintenance costs in 
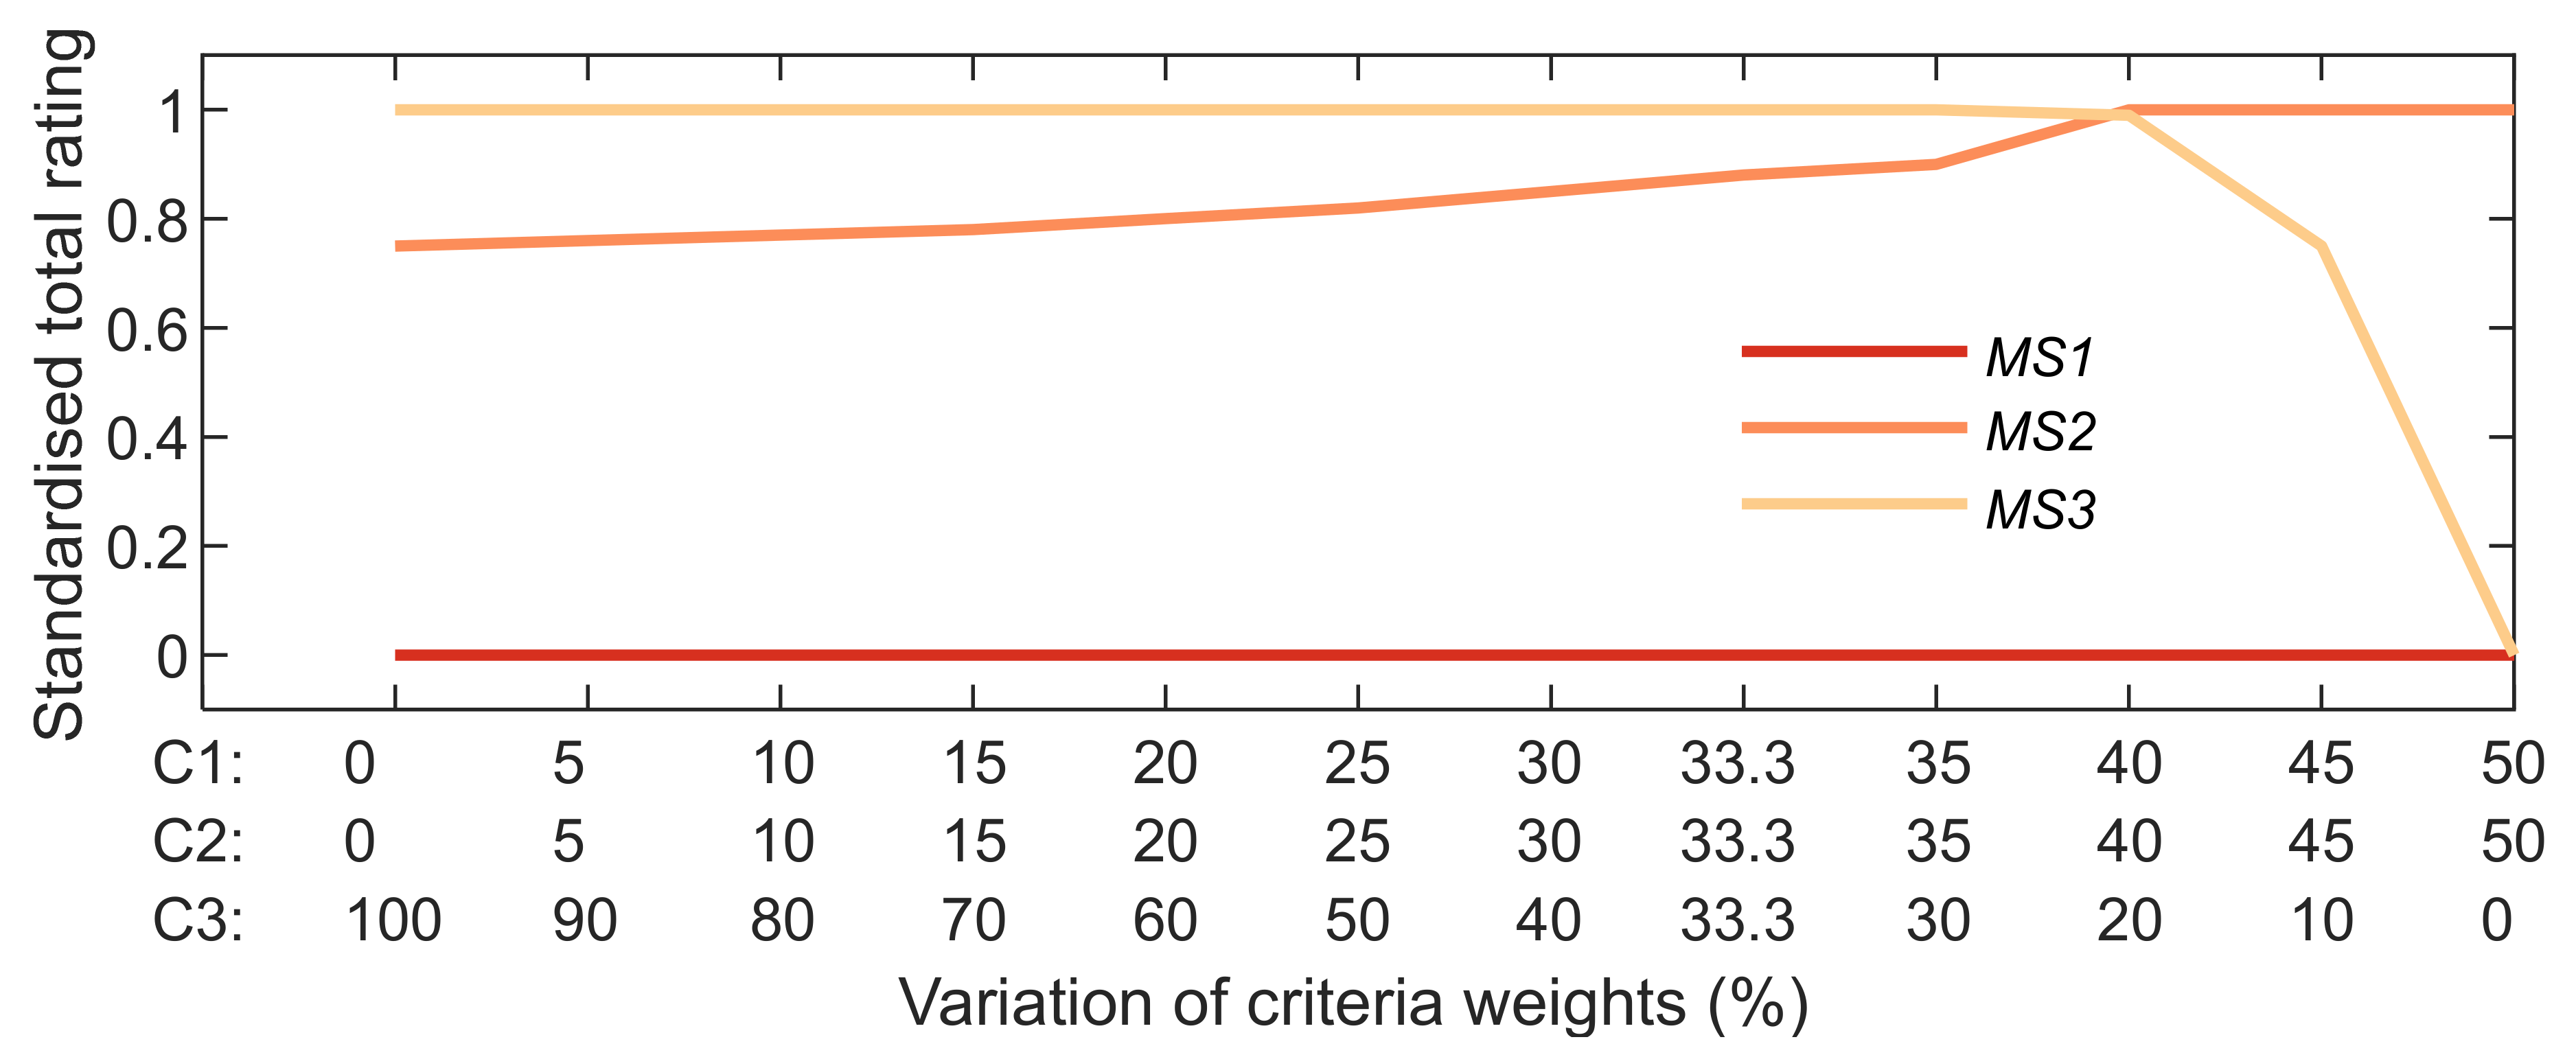
Figure 6, and the total number of replacements in Figure 7.
When the MCDA is implemented, MS1 is considered the most favourable alternative only in situations where high importance is given to the maintenance costs in detriment of the other two criteria (Figure 6). For weights below 60%, MS1 is no longer the most favourable alternative. In addition, when the weight of the other two criteria changes, MS1 always represents the least beneficial option (Figure 5 and Figure 7). On the other hand, in general, MS3 is the most favourable alternative for a greater number of combinations between the weights of the criteria. For example, for the variation of the efficiency index (Figure 5), MS3 only ceases to be the most favourable alternative for weights below 30%; for the number total of replacements (Figure 7), for weights below 20%; and, for the maintenance costs (Figure 6), for weights above 33.3%. Finally, MS2 is an intermediate solution, being the best alternative when the weights of the efficiency index (Figure 5) or the number total of replacements (Figure 7) are low, or when the weight of the maintenance cost (Figure 6) varies between 33.3% and 60%.

3.3. Discussion

As a direct consequence of the new directives on building energy efficiency [13,15,58], ETICS application has increased in the last years thanks to its thermal performance. In comparison with conventional solutions, ETICS are considered a recent cladding material [59] and, consequently, studies are needed to understand the ETICS performance over time. These studies are crucial for the development of maintenance models to manage the maintenance interventions, in order to increase the ETICS’ durability and ensure their functionality during their service life.
The results from this study reveal that maintenance plays an important role to increase the durability of ETICS, and therefore their sustainability. They also show that the performance of regular maintenance activities allows increasing the service life and improving the degradation condition of the ETICS over time (the claddings remain longer in more favourable conditions, with less defects and less interventions), thus corroborating, the observations of several previous studies [5,6,8,9,10].
From the individual analysis of the parameters (Section 3.1), by comparing with the situation without maintenance, all maintenance strategies studied improve the performance of ETICS, in terms of the severity of degradation over time and, consequently, in terms of the efficiency index, but lead to higher maintenance costs, i.e., more complex maintenance plans (MS3) are related with:
  • Better efficiency indexes (Table 4). MS3 is more efficient (higher efficiency index) than MS1 and MS2. ETICS under MS3 spends 9% more time in the best degradation conditions (A and B) than MS2, and more 21% than MS1;
  • Higher service lives (Figure 1). ETICS under MS3 presents a higher service life by comparing with the other two maintenance strategies (15 years more than MS2 and 27 years more than MS1);
  • Higher maintenance costs (Figure 3). From the three maintenance strategies, MS3 is the most expensive maintenance strategy while MS1 is the most economical. The cost, by square meter, of MS1 is, approximately, 50% that of the cost of MS3; and,
  • Lower number of total replacements (Figure 4). As the complexity of the maintenance plans increases, the number of deep interventions (replacements) is considerably reduced. The number of total replacements of MS3 is, approximately, 25% that of MS1.
However, the definition of the more beneficial maintenance strategy from the individual analysis of the parameters is a challenging task. Since the parameters are interdependent, when one parameter is optimised, the others deviate from the optimal value (since the parameters are dependent, as one parameter improves in the MCDA, the others naturally tend to present worse results). Furthermore, this type of decision process is rather subjective [59], since the weight of the different criteria can change according to the personal perceptions and requirements of the decision-makers, local constraints, social and economic contexts, among other criteria.
For example, if maintenance cost is the only parameter considered to choose a maintenance strategy (a common situation in the maintenance sector), MS1 becomes the best alternative since it is the solution with the lowest maintenance costs (Figure 3), while MS3 corresponds to the worst option. Because of this choice, the durability and performance of the ETICS will be considerably reduced. For the same time horizon, the service life can be reduced by 27 years, the time in the best degradation conditions can be reduced by 21% and, consequently, the distress in the normal use of the building can increase four times.
On the other hand, when all parameters are analysed jointly (Section 3.2), different outcomes can result. Its only advantage is the reduced maintenance costs. These results demonstrate that, if some emphasis is given on the ETICS’s durability, aesthetical appearance or users comfort, the implementation of regular monitoring and maintenance activities in the maintenance strategy are clearly the best approach. In addition, a lower number of total replacements also has an impact on the sustainability of this cladding system. Consequently, from the analysis of Figure 5, Figure 6 and Figure 7, for different combinations of weights in the criterion, MS3 is globally ranked as the most advantageous maintenance strategy.
Although this methodology can be generalized to different constructive solutions, these observations are only validated for this constructive solution. If an analysis of a different constructive solution of ETICS is performed, the costs of the interventions for the new constructive solution must be estimated, since the costs will influence the results of the analysis. On the other hand, if the aim is to perform an analysis for a different type of cladding, for example natural stone, ceramics or rendering, in addition to costs, new parameters for the degradation process and new impacts of the maintenance activities must be assessed.

4. Conclusions

In this study, a stochastic maintenance model was defined to assess the impact of different maintenance strategies on the durability of ETICS. The performance of the different maintenance strategies was assessed through a MCDA method, which allows ranking the different options according to different criteria. This analysis considers four criteria: the efficiency index; the remaining service life of ETICS; the maintenance costs; and the number of replacements over the building’s life cycle. In this study, a sensitivity analysis is performed, encompassing scenarios and/or weights that better illustrate the more common decision-makers’ points of view and requirements. This study is a general framework to analyse the impact of maintenance decisions; nevertheless, the method proposed in this study can be updated and different criteria can be analysed in the future, in order to contemplate the preferences of another decision maker in another context.
In this study, three maintenance strategies were analysed: the total replacement of the cladding (MS1); a moderate intervention (MS2); and a more careful intervention (MS3). The results show that, although slightly more expensive, an adequate implementation of maintenance activities has a great influence on the durability, functionality, and sustainability of ETICS. By periodically controlling the impact of the degradation agents, maintenance activities can: (i) promote the extension of the ETICS’s service life between 88% and 159% (between 15 to 27 years); (ii) improve the global degradation condition of the ETICS; and (iii) reduce the impact on users by reducing the number of deeper interventions.

Recommendations for Future Research

Finally, this methodology is a guideline to select the more adequate maintenance strategy without disregarding the decision-maker’s preferences. The aim of this methodology, more than supporting the decision-making process of choice of the most adequate maintenance strategy, is to raise awareness in the stakeholders for the main outcomes that may arise with the different decisions. As future research, it is important to understand how maintenance strategies can be optimized. Specifically, to assess how the time interval between inspections can influence the best maintenance strategies and whether there is an optimal interval; how the stakeholders’ requirements criteria affect the optimal maintenance strategy; how the environmental context can influence the best alternative to implement. Moreover, this methodology can be applied to other constructive solutions or even to the building as a whole.

Author Contributions

Conceptualization, C.F., A.S. and J.d.B.; methodology, C.F.; software, C.F.; validation, C.F.; investigation, C.F., A.S., J.d.B., I.S.D. and I.F.-C.; writing—original draft preparation, C.F.; writing—review and editing, A.S., J.d.B., I.S.D. and I.F.-C. All authors have read and agreed to the published version of the manuscript.

Funding

This research was funded by the FCT (Portuguese Foundation for Science and Technology) through the projects BestMaintenance-LowerRisks (PTDC/ECI-CON/29286/2017) and WGB_Shield (PTDC/ECI-EGC/30681/2017).

Institutional Review Board Statement

Not applicable.

Informed Consent Statement

Not applicable.

Data Availability Statement

The data presented in this study are available on request from the corresponding author. The data are not publicly available because it is part of a research project under development.

Conflicts of Interest

The authors declare no conflict of interest.

Appendix A

Data of the multi-criteria decision analysis.
Table A1. Initial decision-making matrix.
Criterion 1: Efficiency Index [–]Criterion 2: Maintenance Costs [€/m2]Criterion 3: Total Replacements [Unit.]
MS10.88655.462.3
MS20.91078.731.1
MS30.927106.600.6
Table A2. Normalized decision-making matrix.
Criterion 1: Efficiency Index Criterion 2: Maintenance CostsCriterion 3: Total Replacements
MS10.0001.0000.000
MS20.5850.5450.752
MS31.0000.0001.000
Table A3. Ranking results: variation of criteria weights of the efficiency index (criterion 1).
Weight, wi [%]MS1MS2MS3
Criterion 1Criterion 2Criterion 3
100000.000.591.00
90550.000.601.00
8010100.000.621.00
7015150.000.651.00
6020200.000.681.00
5025250.000.731.00
4030300.000.811.00
33.333.333.30.000.881.00
3035350.000.931.00
2040400.001.000.85
1045450.001.000.52
050500.001.000.00
Table A4. Ranking results: variation of criteria weights of the maintenance costs (criterion 2).
Weight, wi [%]MS1MS2MS3
Criterion 1Criterion 2Criterion 3
010001.000.540.00
59051.000.570.00
1080101.000.620.00
1570151.000.710.00
2060201.000.970.00
2550250.001.000.00
3040300.001.000.91
33.333.333.30.000.881.00
3530350.000.831.00
4020400.000.741.00
4510450.000.701.00
500500.000.671.00
Table A5. Ranking results: variation of criteria weights of the total replacement (criterion 3).
Weight, wi [%]MS1MS2MS3
Criterion 1Criterion 2Criterion 3
001000.000.751.00
55900.000.761.00
1010800.000.771.00
1515700.000.781.00
2020600.000.801.00
2525500.000.821.00
3030400.000.851.00
33.333.333.30.000.881.00
3535300.000.901.00
4040200.001.000.99
4545100.001.000.75
505000.001.000.00

References

  1. European Commission. Available online: https://eur-lex.europa.eu/legal-content/EN/TXT/PDF/?uri=CELEX:02010L0031-20181224&from=EN (accessed on 21 April 2021).
  2. European Association for External Thermal Insulation Composite Systems. Available online: https://www.ea-etics.eu/files/dokumente-eae/5_Publications/Brochures/etics-are-amazing.pdf (accessed on 16 April 2021).
  3. Kvande, T.; Bakken, N.; Bergheim, E.; Thue, J.V. Durability of ETICS with rendering in Norway—Experimental and field investigations. Buildings 2018, 8, 93. [Google Scholar] [CrossRef] [Green Version]
  4. Ilomets, S.; Kalamees, T.; Lahdensivu, J. Impact of ETICS on corrosion propagation of concrete facade. Energy Proc. 2016, 96, 67–76. [Google Scholar] [CrossRef] [Green Version]
  5. Antošová, N. Rules for the effective maintenance of buildings and maintenance of ETICS system with biocorrosion. OTMC Int. J. 2013, 5, 645–662. [Google Scholar] [CrossRef] [Green Version]
  6. Antošová, N. Impact of biocorrosion on the durability of ETICS and empirical findings about the periodicity of maintenance. Slovak J. Civ. Eng. 2013, 2, 21–28. [Google Scholar] [CrossRef] [Green Version]
  7. Amora, B.; Saraiva, D.; de Brito, J.; Flores-Colen, I. Inspection and diagnosis system of ETICS on walls. Constr. Build. Mater. 2013, 47, 1257–1267. [Google Scholar] [CrossRef]
  8. Daniotti, B.; Cecconi, F.R.; Paolini, R.; Galliano, R.; Ferrer, J.; Battaglia, L. Durability evaluation of ETICS: Analysis of failures case studies and heat and moisture transfer simulations to assess the frequency of critical events. In Proceedings of the 4th Portuguese Conference on Mortars and ETICS, Coimbra, Portugal, 29–30 March 2012. [Google Scholar]
  9. Edis, E.; Türkeri, N. Durability of external thermal insulation composite systems ins Istanbul Turkey. A|Z ITU J. Fac. Architect. 2012, 9, 134–148. [Google Scholar]
  10. Krause, P.; Nowoświat, A. Experimental studies involving the impact of solar radiation on the properties of expanded graphite polystyrene. Energies 2020, 13, 75. [Google Scholar] [CrossRef] [Green Version]
  11. Nowoświat, A.; Krause, P.; Miros, A. Properties of expanded graphite polystyrene damaged by the impact of solar radiation. J. Build. Eng. 2021, 34. [Google Scholar] [CrossRef]
  12. Liisma, E.; Sepri, R.; Raado, L.M.; Lill, I.; David, E.; Will, Q.; Sulakatko, V.; Põldaru, M. Defect analysis of renovated facade walls with ETICS solutions in cold climate conditions. In Proceedings of the Central Europe towards Sustainable Building, Prague, Czech Republic, 22–24 June 2016. [Google Scholar]
  13. Parracha, J.L.; Borsoi, G.; Flores-Colen, I.; Veiga, R.; Nunes, L.; Dionísio, A.; Glória Gomes, M.; Faria, P. Performance parameters of ETICS: Correlating water resistance, bio-susceptibility and surface properties. Constr. Build. Mater. 2021, 272. [Google Scholar] [CrossRef]
  14. ETAG 004. Guideline for European Technical Approval of External Thermal Insulation Composite Systems (ETICS) with Rendering; European Organization for Technical Approvals (EOTA): Brussels, Belgium, 2013. [Google Scholar]
  15. Minarovičová, K.; Antošová, N. Sustainability of ETICS maintenance technologies. Appl. Mech. Mater. 2016, 820, 194–199. [Google Scholar] [CrossRef]
  16. Shohet, I.M.; Paciuk, M. Service life prediction of exterior cladding components under standard conditions. Constr. Manag. Econ. 2004, 22, 1081–1090. [Google Scholar] [CrossRef]
  17. Alqahtani, A.Y.; Gupta, S.M.; Nakashima, K. Warranty and maintenance analysis of sensor embedded products using internet of things in industry 4.0. Int. J. Prod. Econ. 2019, 208, 483–499. [Google Scholar] [CrossRef]
  18. Yoon, J.T.; Youn, B.D.; Yoo, M.; Kim, Y.; Kim, S. Life-cycle maintenance cost analysis framework considering time-dependent false and missed alarms for fault diagnosis. Reliab. Eng. Syst. Saf. 2019, 184, 181–192. [Google Scholar] [CrossRef]
  19. Saassouh, B.; Lounis, Z. Probabilistic modeling of chloride-induced corrosion in concrete structures using first-and second-order reliability methods. Cement Concr. Compos. 2012, 34, 1082–1093. [Google Scholar] [CrossRef]
  20. García-Segura, T.; Yepes, V.; Frangopol, D.M.; Yang, D.Y. Lifetime reliability-based optimization of post-tensioned box-girder bridges. Eng. Struct. 2017, 145, 381–391. [Google Scholar] [CrossRef]
  21. Yang, D.Y.; Frangopol, D.M. Probabilistic optimization framework for inspection/ repair planning of fatigue-critical details using dynamic Bayesian networks. Comput. Struct. 2018, 198, 40–50. [Google Scholar] [CrossRef]
  22. Kim, S.; Frangopol, D. Multi-objective probabilistic optimum monitoring planning considering fatigue damage detection, maintenance, reliability, service life and cost. Struct. Multidiscip. Optim. 2018, 57, 39–54. [Google Scholar] [CrossRef]
  23. Shohet, I.M.; Nobili, L. Enterprise resource planning system for performance-based-maintenance of clinics. Autom. Constr. 2016, 65, 33–41. [Google Scholar] [CrossRef]
  24. Shohet, I.M.; Nobili, L. Performance-based maintenance of public facilities: Principles and implementation in courthouses. J. Perform. Constr. Facil. 2016, 30. [Google Scholar] [CrossRef] [Green Version]
  25. Shohet, I.M.; Nobili, L. Application of key performance indicators for maintenance management of clinics facilities. Int. J. Strat. Property Manag. 2017, 21, 58–71. [Google Scholar] [CrossRef]
  26. Morgado, J.; Flores-Colen, I.; de Brito, J.; Silva, A. Maintenance planning of pitched roofs in current buildings. J. Constr. Eng. Manag. 2017, 143. [Google Scholar] [CrossRef]
  27. Sharif, S.A.; Hammad, A. Developing surrogate ANN for selecting near-optimal building energy renovation methods considering energy consumption, LCC and LCA. J. Build. Eng. 2019, 25. [Google Scholar] [CrossRef]
  28. Kwon, N.; Song, K.; Ahn, Y.; Park, M.; Jang, Y. Maintenance cost prediction for aging residential buildings based on case-based reasoning and genetic algorithm. J. Build. Eng. 2020, 28. [Google Scholar] [CrossRef]
  29. Shohet, I.M.; Laufer, A. Exterior cladding methods: A technoeconomic analysis. J. Constr. Eng. Manag. 1996, 122, 242–247. [Google Scholar] [CrossRef]
  30. Ximenes, S.; de Brito, J.; Gaspar, P.L.; Silva, A. Modelling the degradation and service life of ETICS in external walls. Mater. Struct. 2015, 48, 2235–2249. [Google Scholar] [CrossRef]
  31. Macedo, M.; de Brito, J.; Silva, A.; Oliveira Cruz, C. Design of an insurance policy model applied to natural stone facade claddings. Buildings 2019, 9, 111. [Google Scholar] [CrossRef] [Green Version]
  32. Marques, C.; de Brito, J.; Silva, A. Application of the factor method to the service life prediction of ETICS. Int. J. Strat. Property Manag. 2018, 22, 204–222. [Google Scholar] [CrossRef] [Green Version]
  33. Silva, A.; Gaspar, P.L.; de Brito, J.; Neves, L.C. Probabilistic analysis of degradation of façade claddings using Markov chain models. Mater. Struct. 2016, 49, 2871–2892. [Google Scholar] [CrossRef]
  34. Tavares, J.; Silva, A.; de Brito, J. Computational models applied to the service life prediction of External Thermal Insulation Composite Systems (ETICS). J. Build. Eng. 2020, 27. [Google Scholar] [CrossRef]
  35. Mousavi, S.H.; Silva, A.; de Brito, J.; Ekhlassi, A.; Hosseini, S.B. Service life prediction of natural stone claddings with an indirect fastening system. J. Perform. Constr. Facil. 2017, 31. [Google Scholar] [CrossRef]
  36. Esteves, C.; Ahmed, H.; Flores-Colen, I.; Veiga, R. The influence of hydrophobic protection on building exterior claddings. J. Coating Technol. Res. 2019, 16, 1379–1388. [Google Scholar] [CrossRef]
  37. Silva, A.; de Brito, J. Do we need a buildings’ inspection, diagnosis and service life prediction software? J. Build. Eng. 2019, 22, 335–348. [Google Scholar] [CrossRef]
  38. Thai-Ker, L.; Chung-Wan, W. Challenges of external wall tiling in Singapore. In Proceedings of the Qualicer 2006: IX World Congress on Ceramic Tile Quality, Castellón, Spain, 12–15 February 2006. [Google Scholar]
  39. Forster, A.M.; Kayan, B. Maintenance for historic buildings: A current perspective. Struct. Surv. 2009, 27, 210–229. [Google Scholar] [CrossRef]
  40. Raposo, S.; de Brito, J.; Fonseca, M. Planned preventive maintenance activities: Analysis of guidance documents. In Durability of Buildings Materials and Components; de Freitas, V.P., Delgado, J.M.P.Q., Eds.; Springer: Berlin/Heidelberg, Germany, 2013; pp. 35–60. [Google Scholar]
  41. Ferreira, C.; Neves, L.C.; Silva, A.; de Brito, J. Stochastic maintenance models for ceramic claddings. Struct. Infrastruct. Eng. 2020, 16, 247–265. [Google Scholar] [CrossRef]
  42. Ferreira, C.; Silva, A.; de Brito, J.; Dias, I.S.; Flores-Colen, I. Definition of a condition-based model for natural stone claddings. J. Build. Eng. 2021, 33. [Google Scholar] [CrossRef]
  43. Ferreira, C.; Silva, A.; de Brito, J.; Dias, I.S.; Flores-Colen, I. Maintenance modelling of ceramic claddings in pitched roofs based on the evaluation of their in situ degradation condition. Infrastructures 2020, 5, 77. [Google Scholar] [CrossRef]
  44. Madureira, S.; Flores-Colen, I.; de Brito, J.; Pereira, C. Maintenance planning of facades in current buildings. Constr. Build. Mater. 2017, 147, 790–802. [Google Scholar] [CrossRef]
  45. Flores-Colen, I.; de Brito, J. Discussion of proactive maintenance strategies in façades’ coatings of social housing. J. Build. Apprais. 2010, 5, 223–240. [Google Scholar] [CrossRef]
  46. Silva, A.; de Brito, J.; Gaspar, P.L. Methodologies for Service Life Prediction of Buildings: With a Focus on Façade Claddings; Springer International Publishing: Zurich, Switzerland, 2016. [Google Scholar]
  47. Sánchez-Silva, M.; Klutke, G.-A. Reliability and Life-Cycle Analysis of Deteriorating Systems; Springer International Publishing: Zurich, Switzerland, 2016. [Google Scholar]
  48. ISO 15686-5. Buildings and Constructed Assets—Service Life Planning—Part 5: Whole Life Costing; International Organization for Standardization (ISO): Geneva, Switzerland, 2012. [Google Scholar]
  49. Frangopol, D.M.; Kallen, M.J.; van Noortwijk, J.M. Probabilistic models for lifecycle performance of deteriorating structures: Review and future directions. Prog. Struct. Eng. Mater. 2004, 6, 197–212. [Google Scholar] [CrossRef]
  50. Langdon, D. Life Cycle Costing (LCC) as a Contribution to Sustainable Construction. Guidance on the Use of the LCC Methodology and Its Application in Public Procurement; Davis Langdon Management Consulting: London, UK, 2007. [Google Scholar]
  51. Dodgson, J.S.; Spackman, M.; Pearman, A.; Phillips, L.D. Multi-Criteria Analysis: A Manual; Department for Communities and Local Government: London, UK, 2009. [Google Scholar]
  52. Yang, X.S. Nature-Inspired Optimization Algorithms; Elsevier: London, UK, 2014. [Google Scholar]
  53. Mejía, G.; Pereira, J. Multiobjective scheduling algorithm for flexible manufacturing systems with Petri nets. J. Manuf. Syst. 2020, 54, 272–284. [Google Scholar] [CrossRef]
  54. Burkov, A. The Hundred-Page Machine Learning Book; Andriy Burkov: Quebec City, QC, Canada, 2019. [Google Scholar]
  55. Ferreira, C.; Silva, A.; de Brito, J. Deterioration model of ETICS, based on stochastic Petri nets. In Proceeding of the 7th International Symposium on Life-Cycle Civil Engineering (IALCCE), Shanghai, China, 27–30 October 2020. [Google Scholar]
  56. CYPE Price Generator. Available online: http://www.geradordeprecos.info/ (accessed on 12 February 2020).
  57. Ferreira, C.; Silva, A.; de Brito, J.; Dias, I.; Flores-Colen, I. The impact of imperfect maintenance actions on the degradation of buildings’ envelope components. J. Build. Eng. 2021, 33. [Google Scholar] [CrossRef]
  58. Künzel, H.; Künzel, H.M.; Sedlbauer, K. Long-term performance of external thermal insulation systems (ETICS). Acta Architect. 2006, 5, 11–24. [Google Scholar]
  59. Kanniyapan, G.; Nesan, L.J.; Mohammad, I.S.; Keat, T.S.; Ponniah, V. Selection criteria of building material for optimising maintainability. Constr. Build. Mater. 2019, 221, 651–660. [Google Scholar] [CrossRef]
Figure 1. Comparison of the cumulative distribution functions of condition D of the three maintenance strategies studied (MS1—total replacement of the cladding; MS2—includes minor interventions and total replacement; MS3—combines cleaning operations, minor interventions, and total replacement) and the option of no maintenance.
Sustainability 13 06677 g001
Figure 2. Comparison of the average degradation curves of the three maintenance strategies studied (MS1—total replacement of the cladding; MS2—includes minor interventions and total replacement; MS3—combines cleaning operations, minor interventions, and total replacement) and the situation without maintenance.
Sustainability 13 06677 g002
Figure 3. Comparison of the cumulative costs (inspection, maintenance, and total) of the three maintenance strategies studied (MS1—total replacement of the cladding; MS2—includes minor interventions and total replacement; MS3—combines cleaning operations, minor interventions, and total replacement).
Sustainability 13 06677 g003
Figure 4. Comparison of the number of interventions in each maintenance strategy (MS1—total replacement of the cladding; MS2—includes minor interventions and total replacement; MS3—combines cleaning operations, minor interventions, and total replacement).
Sustainability 13 06677 g004
Figure 5. Variation of criteria weights of the efficiency index (criterion 1) with the maintenance strategy (MS1—total replacement of the cladding; MS2—includes minor interventions and total replacement; MS3—combines cleaning operations, minor interventions, and total replacement; C1—Efficiency index; C2—Maintenance costs (including the inspection costs); and C3—Total number of replacements).
Sustainability 13 06677 g005
Figure 6. Variation of criteria weights of the maintenance costs (criterion 2) with the maintenance strategy (MS1—total replacement of the cladding; MS2—includes minor interventions and total replacement; MS3—combines cleaning operations, minor interventions, and total replacement; C1—Efficiency index; C2—Maintenance costs (including the inspection costs); and C3—Total number of replacements).
Sustainability 13 06677 g006
Figure 7. Variation of criteria weights of the number of total replacements (criterion 3) with the maintenance strategy (MS1—total replacement of the cladding; MS2—includes minor interventions and total replacement; MS3—combines cleaning operations, minor interventions, and total replacement; C1—Efficiency index; C2—Maintenance costs (including the inspection costs); and C3—Total number of replacements).
Sustainability 13 06677 g007
Table 1. Classification system (data adapted from [30]).
Degradation ConditionDefectsSeverity of Degradation (%)
A (kn = 0)No visible degradationSw ≤ 1
B (kn = 1)Continuity/integrityCracks width ≤ 0.2 mm—small or very small quantity1 < Sw ≤ 10
Deterioration of the reinforcement corner profiles caps (cracks)
Stains/colour changes or textureSurface dirt; drainage marks; oxidation stains; fungi/moisture stains—slight or few perceptible changes
JointVisible joints between panels due to dirt- or/and fungal-related colour change—slight or few perceptible changes
C (kn = 2)Continuity/integrityCracks width ≤ 0.2 mm—moderate quantity10 < Sw ≤ 30
Cracks width > 0.2 mm—small or very small quantity
Deterioration of the reinforcement corner profiles caps (cracks)
Stains/colour changes or textureDrainage marks; oxidation stains; fungi/moisture stains—moderate or quite perceptible
Efflorescence; lichen and algae; parasitic vegetation—slight or few perceptible changes
Loss of adherenceBlistering largest size < 15 cm—small quantity
JointJoint cracking ≤ 0.2 mm
Visible joints between panels due to fungal-related colour change—moderate or quite perceptible
D (kn = 3)Continuity/integrityCracks width ≤ 0.2 mm—very high quantity30 < Sw ≤ 50
Cracks width > 0.2 mm—moderate quantity
Stains/colour changes or textureDrainage marks; fungi/moisture stains—high or strongly marked changes
Efflorescence; lichen and algae; parasitic vegetation—moderate or quite perceptible
Loss of adherenceBlistering largest size < 15 cm—moderate quantity
Blistering largest size > 15 cm—small quantity
Peeling largest size < 15 cm—small quantity
JointJoint cracking > 0.2 mm and ≤ 1 mm
Visible joints between panels due to fungal-related colour change—high or strongly marked changes
E (kn = 4)Continuity/integrityCracks width > 0.2 mm—very high quantitySw > 50
Stains/colour changes or textureDrainage marks; fungi/moisture stains—very high or quite strongly marked changes
Efflorescence; lichen and algae; parasitic vegetation—high or strongly marked changes
Loss of adherenceBlistering largest size > 15 cm—moderate quantity
Blistering (any dimension)—dense pattern
Peeling largest size > 15 cm—small quantity
Peeling (any dimension)—dense pattern
JointJoint cracking > 1 mm
Table 2. Optimal parameters of the degradation process.
ParametersCondition ACondition BCondition CCondition D
Mean—Ti (years)1.88.16.57.2
Standard deviation—SDi (years)2.43.62.03.0
Ti—Mean sojourn time in condition i, with i = {A, B, C, D}; SDi—Standard deviation of the sojourn time in condition i, with i = {A, B, C, D}.
Table 3. Costs, application zones, and impacts of the different maintenance activities.
ParametersCost (€/m2)Application Zone ConditionImpact of the Maintenance Activities (%)
PAPBPC
Inspection1.03All---
Cleaning operations26.88B34.965.1-
Minor interventions58.13C37.330.532.2
Total replacement95.98D, E100.0--
PA,B,C—Probability of transition to condition A, B, or C.
Table 4. Comparison of the efficiency indexes of the three maintenance strategies studied and the situation without maintenance.
No MaintenanceMS1MS2MS3
tpA (years)1.46.76.59.2
tpB (years)8.023.930.432.0
tpC (years)6.517.012.08.1
tpD (years)7.22.51.10.7
tpE (years)26.90.00.00.0
EI (-)0.370.890.910.93
tpi—Mean time of permanence in condition i, with i = {A, B, C, D, E}; EI—Efficiency index (Equation (4)); MS1—total replacement of the cladding; MS2—includes minor interventions and total replacement; MS3—combines cleaning operations, minor interventions, and total replacement.
Publisher’s Note: MDPI stays neutral with regard to jurisdictional claims in published maps and institutional affiliations.

