Article

Capital Return Rate and Carbon Storage on Forest Estates of Three Boreal Tree Species

by
Petri P. Kärenlampi
Lehtoi Research, FIN-81235 Lehtoi, Finland
Sustainability 2021, 13(12), 6675; https://doi.org/10.3390/su13126675
Submission received: 13 May 2021 / Revised: 1 June 2021 / Accepted: 7 June 2021 / Published: 11 June 2021
(This article belongs to the Section Air, Climate Change and Sustainability)

Abstract

:
In this study, the capital return rate and carbon storage on forest estates with three boreal tree species are discussed. A growth model is applied, along with verified yield models of sawlogs and veneer logs. Using the normal forest principle, thinning schedules and rotation ages maximizing the estate-level capital return rate are clarified. Regeneration expenses are amortized at the end of any rotation. Capitalizations are greater and rotations longer than in recent studies. The capital return rate is a weak function of initial stem count and rotation age but differs by tree species. The initial stem count strongly contributes to biomass stored in trees. Omission of thinnings increases carbon storage very effectively but requires financial compensation. The most promising way of increasing the capital return rate is the reduction of regeneration expenses. Thinnings are triggered by stand volumes of at least 200 m3/ha. The average commercial trunk volume of trees removed in thinnings always exceeds 200 L. Risk aversion theory proposes short rotations and low stem count in seedling planting unless carbon storage compensation exists. Even a small carbon storage compensation justifies increased seedling counts and extended rotations.

1. Introduction

Boreal forests constitute a significant carbon sink and a significant source of income for local populations, directly and indirectly [1,2]. Forests do have conservation values and play a role in maintaining biological diversity in ecosystems. Not all incentives necessarily unify. Increased harvesting is at least partially contradictory to carbon sink but may substitute fossil materials [1,2,3,4,5]. A high production rate, along with high capitalization, may be favorable for society economics, whereas lower capitalization may favor private equity capital return rate [6,7,8,9].
As the preferences of the society do not necessarily unify with the preferences of a private forest owner, compensations systems for complying with societal goals have been proposed [10,11]. The necessary level of compensation has been recently discussed [9,12,13,14]. It has been concluded that 2019–2020 carbon emission prices were not adequate to compensate for increased carbon storage in terms of carbon rent [9,12,13,14].
From the viewpoint of generic instructions, or policy actions, it might be beneficial to reduce the variety of estate states by adopting some kind of unifying boundary condition. A tempting candidate is the normal forest principle [15]. This principle simply refers to postulating that stand ages are evenly distributed and stand characteristics are uniquely determined by stand age. Such a postulation, even if often departing from reality, simplifies many treatments, producing idealized systems that are stationary in time. Application of the normal forest principle allows for the determination of an optimal rotation age, as well as financially suitable expected values of estate characteristics.
Recent treatments, based on the normal forest principle, have been based on observations collected from never-thinned spruce-dominated forests 30–45 years in age [9,13,14]. A few of these stands have been used as normal stands, describing a few normal forests. Stand development until observation has been approximated in terms of empirical models, and further development of any normal stand in terms of a growth model [7,8,16]. In other words, observations collected from wooded forest stands were used as a starting point. Stand development was approximated for the past using empirical curve-fitting, and for the future using a growth model, based on a large Norwegian dataset [16]. All expenses occurring before the time of observation were included in a computation of internal rate of return, terminating as stand capitalization at the time of observation. All events expected in the future were considered in the growth model computation.
The regime of this study is fertile boreal forest on mineral soil. The growth model applied has been calibrated in Norway, and previously applied as such in Eastern Finland [7,8,16]. When necessary, prices and expenses are taken from sources relevant to the southern half of Finland, applicable at the time of writing (2021). Correspondingly, the results are intended to be applicable within the Boreal region, with reservation to regional prices and expenses.
This paper intends to clarify a few issues related to the recent investigations. Firstly, since observations of never-thinned stands 30–45 years in age were used as a starting point, it was not possible to determine whether the stands should have been thinned earlier. Secondly, only spruce (Picea abies) forest was considered. Scots pine (Pinus sylvestris) and birch species (Betula pendula, Betula pubescens) are also important in the area.
To clarify the feasible timing of thinnings, we apply the growth model, not for stands 30 to 45 years in age, but as early as it is applicable. In other words, the growth model is applied to young stands where breast-height diameters are 6–11 cm, which is achieved in 15–20 years, depending on tree species [17,18,19,20,21]. Such an approach, however, requires the investigation of a variety of alternative stem counts retained in young stand tending.
A third significant difference compared with the recent investigations [9,13,14] is the amortization of regeneration expenses. As the earlier treatments were based on observations at 30–45 years, regeneration was assumed to result as the wooded stand observed. In other words, regeneration expenses were offset by the stand growth until the time of observation. Here, on the contrary, we capitalize the regeneration expenses at the time of regeneration and deduct the expenses first at the end of any rotation. It appears intuitively appealing to assign all previous expenses to the establishment of observed harvestable stands 30–45 years in age. In reality, stand regeneration contributes to stand yield until final cutting.
To summarize the general framework of this study, the microeconomic financial sustainability of forestry business from the forest owner perspective is discussed. Then, the microeconomics of mitigation of global climate change through carbon sequestration in Boreal forestry is investigated. Solutions for the interplay of the two are presented.
First, the applied growth and assortment yield models are presented. Financial and computational methods are presented. Then, results are reported, for three different tree species, as well as for three different initial stand stem counts. Sensitivity analysis is conducted, regarding the effect of a reparametrization of the birch growth model, omission of thinnings, as well as a reduction of regeneration expenses. The third subsection of results presents carbon storage financials and the fourth operative outcome in the absence of carbon storage compensation. Finally, the results are discussed, and conclusions regarding their robustness are given.

2. Materials and Methods

2.1. Growth Model

For prognostication of the development of any normal stand, some kind of a growth model is needed. The growth model of Bollandsås et al. [7,8,16] is adopted, discussing not only growth but also mortality and recruitment. The original growth model [7,8,16] discussed 50 mm breast-height diameter classes within a temporal resolution of five years. Any diameter class was represented by its central tree, and the process of growth was described in terms of the probability of any tree to transfer to the next diameter class [7,8,16]. The underlying idea of the description of growth is that any tree either remains in the same diameter class or transfers to the next diameter class within the five-year time interval. This underlying idea naturally greatly simplifies computation.
Recent investigations have demonstrated a need for a narrower than 50 mm resolution in the tree size description [13,14]. It is not excessively complicated to modify the growth model from the size resolution of 50 mm to 25 mm. To retain the underlying principle of the growth model, this requires a corresponding change in the temporal resolution, from 5-year time steps to 30 months. The simultaneous change in the time and size resolutions retains the probability of any tree to transfer to the next diameter class. Recruitment and mortality are affected by time resolution only. Correspondingly, the recruitment and mortality values become scaled along with the time step by a factor of ½. For a base case, a site fertility index of 17 is used in this study. The index number corresponds to the dominant height in meters at the breast-height age of 40 years [16].

2.2. Assortment Yield Model

For any 25-mm diameter class of trees, two assortments, pulpwood and sawlogs (or plywood logs), are prospectively produced. A model for the yield of such assortments has recently been empirically verified [22]. The yield model based on inventory data [23] is, however, of wider applicability than any single empirical dataset. Consequently, the yield of assortments is approximated as follows.
First, the trunk taper curves of Laasasenaho [24] are applied. The taper curves need to be calibrated for the trunk aspect ratio. For any breast-height diameter, the empirical dataset reported in [22] is used to determine an applicable aspect ratio. Then, any taper curve is used to determine a geometric estimate for the volumes of sawlogs/plywood logs on the one hand, and pulpwood on the other. Such volumes, however, are not realistic, due to quality variations [13,14,22,23]. The sawlog/plywood log volume is corrected using the correction factors by Mehtätalo [23]. The correction factors require trunk age, in addition to trunk diameter. A typical age for any diameter is introduced as a nonproportional linear model for any tree species, established based on literature data [17,18,19,20,21].
The stumpage value of any assortment is determined in terms of roadside price, deducted by harvesting expense. We use the roadside prices recently applied by Parkatti et al. [25,26], with one exception. The price premium of spruce pulpwood, in comparison with pine and birch pulpwood, has recently deteriorated due to industry restructuring and is not applied here. Further, the sawlog and plywood log roadside prices given by Parkatti et al. as such are used only in thinnings. In the case of clearcutting, a 15% premium is applied for the roadside price of sawlogs and plywood logs, following regional tradition.
We further use the same harvest-expense function as Parkatti et al. [26], based on a productivity study of Nurminen et al. [27]. Clearcutting expenses are lower than thinning harvesting costs, and expenses vary by tree species. A fixed entry expense of 200 Eur/ha is applied at the instant of harvesting. The justification is an eventual need for pre-harvest cleaning.

2.3. Financial Treatment

To determine a momentary capital return rate, we need to discuss the financial resources occupied [7,9,12,28]. This is done in terms of a financial potential function, defined in terms of capitalization per unit area K. The momentary capital return rate becomes
r ( t ) = d κ K ( t ) d t
where κ in the numerator considers value growth, operative expenses, interests, and amortizations, but omits investments and withdrawals. In other words, it is the change of capitalization on an economic profit/loss basis. K in the denominator provides capitalization on a balance sheet basis, being directly affected by any investment or withdrawal. It is worth noting that timber sales do not enter the numerator of Equation (1): selling trees at market price levels does not change the amount of wealth; it only converts wealth from trees into the form of cash. However, harvesting typically reduces capitalization appearing in the denominator of Equation (1). Harvesting also likely changes the change rate of capitalization occurring after the harvest. In principle, the change rate of capitalization may either increase or diminish.
Equation (1) provides a momentary capital return rate, not necessarily sufficient for management considerations. By definition, the expected value of capitalization per unit area is
K = p ( K ) K d K
where p ( K ) is the probability density function of capitalization K. By change of variables we acquire
K = 0 τ p ( K ) K d K d a d a = 0 τ p ( a ) K ( a ) d a
where a is the stand age (or time elapsed since the latest regeneration harvesting), and τ is the rotation age. The expected value of the change rate of capitalization is
d κ d t = 0 τ p ( a ) d κ ( a ) d t d a
Correspondingly, the expected momentary rate of relative capital return is
r ( t ) = d κ d t K = 0 τ p ( a ) d κ ( a , t ) d t d a 0 τ p ( a ) K ( a , t ) d a = 0 τ p ( a ) K ( a , t ) r ( a , t ) d a 0 τ p ( a ) K ( a , t ) d a
We find from Equation (5) that the expected value of capital return rate within an estate generally evolves in time as the probability density of stand ages evolves. However, Equation (5) can be simplified to be independent of time by adopting the normal forest principle, where stand age probability density is constant [15]. Besides, the constancy of the expected value of capital return rate in time requires that prices and expenses do not evolve in real terms. Then, the expected value of the capital return rate becomes
r = 0 τ d κ ( a ) d t d a 0 τ K ( a ) d a = 0 τ K ( a ) r ( a ) d a 0 τ K ( a ) d a
It has been recently shown that Equation (6) corresponds to the ratio of the partition functions of the change rate of capitalization and capitalization itself [28]. It also has been recently shown that the maximization of the net present value of future revenues may result in financially devastating consequences [29]. Momentary capital return rate, as given in Equation (1), was introduced in 1860 [30]; an expected value was mentioned in 1967 [31,32], however applications have been introduced only recently [7,8,9,13,14,28,29]. It is worth noting that earlier applications used a geometrical sawlog content approximation [7,8,9,28,29], whereas empirical corrections have been included lately [13,14].

2.4. Computational Procedures

As mentioned in the introduction, the boundary conditions applied in this study differ significantly from a few recent studies [9,13,14]. The growth model herein is applied as early as it is applicable. This reflects greater reliance on the growth model, based on large experimental datasets, in relation to approximations of historical development resulting in presently measurable observables. The growth model is applied to young stands where breast-height diameters are 6–11 cm, which was achieved at 15–20 years of age, depending on tree species [17,18,19,20,21]. Such an approach, however, requires the investigation of a variety of alternative stem counts retained in young stand tending. We choose to investigate stem counts 1200, 1800, and 2400/ha.
As the growth model is not applicable to young seedlings, the stand development until breast-height diameters 6–11 cm must be approximated some other way. For this period, an exponential volume growth, as well as an exponential value increment is assumed. Further on, volumetric growth is produced using the growth model [7,8,16], and value growth also using the assortment yield model [13,14,22,23,24].
The two smallest 25 mm breast-height diameter classes used are centered at 75 and 100 mm. The applied growth model yields a volumetric growth rate for any trunk in any of these two diameter classes, and correspondingly a volumetric growth rate per hectare. The same applies to value growth and capital return rate. On the other hand, an expected value of growth rate and capital return rate for the period beginning from regeneration are produced as exponential approximations. It is required that the growth and return computed using the growth model for the first 30-month period where the model is applicable is greater than the expected value for the history since then. This restricted large stem counts mainly to the smaller class of breast-height diameter.
As mentioned in the introduction, regeneration expenses are capitalized at the time of regeneration and deducted at the end of any rotation. The same applies to young stand tending expenses. Bare land value is always capitalized and never deducted. All expenses are discussed in terms of current prices (2021) valid in eastern Finland, without considering any time-evolution of expenses. Correspondingly, all financial expressions are in a real, instead of nominal basis. Regeneration expenses are taken as 1250, 1450, and 1650 Euros per hectare for the stem counts 1200, 1800, and 2400/ha, respectively. These expenses include some excavator resources for partial stand drainage and minor road improvement. The regeneration expenses are not proportional to stem count since most unit operations must cover the entire stand area, and correspondingly the time consumption is not proportional to stem count. Expenses of materials and unit operations differ by tree species, but the total expense is herein taken as species-independent. Young stand tending expense is always taken as 650 Eur/ha, and assumed to occur 10 years after regeneration.
After the establishment of any young stand with known stem count, the development of the stand is computed using the growth model, with 30-month time steps. Simultaneously, capital return rate according to Equation (1) and accumulated expected value of capital return rate according to Equation (6) are computed. The possibility for clearcutting is investigated at five-year intervals, using clearcutting prices and expenses. The maximum value of Equation (6) indicated the economically optimal rotation age in the absence of any commercial thinning.
Then, eventual thinnings are introduced. Proportional thinnings are attempted, as well as thinnings from above. In the latter, the cutting diameter limit yielding the maximum of Equation (6) was found. In the case of the first thinning, 20% of trees are removed regardless of size, due to the establishment of striproads. A suitable timing for the first thinning is found by maximizing Equation (6).
If the introduction of one thinning increases the maximum value of Equation (6), another thinning is attempted. The timing of the first thinning may have to change, to maximize Equation (6), as well as the intensity of the first thinning. If an iterative search of the parameters of the two thinnings increased the maximal value of Equation (6), in comparison with one thinning only, a third thinning is attempted.

3. Results

3.1. Original Boundary Conditions

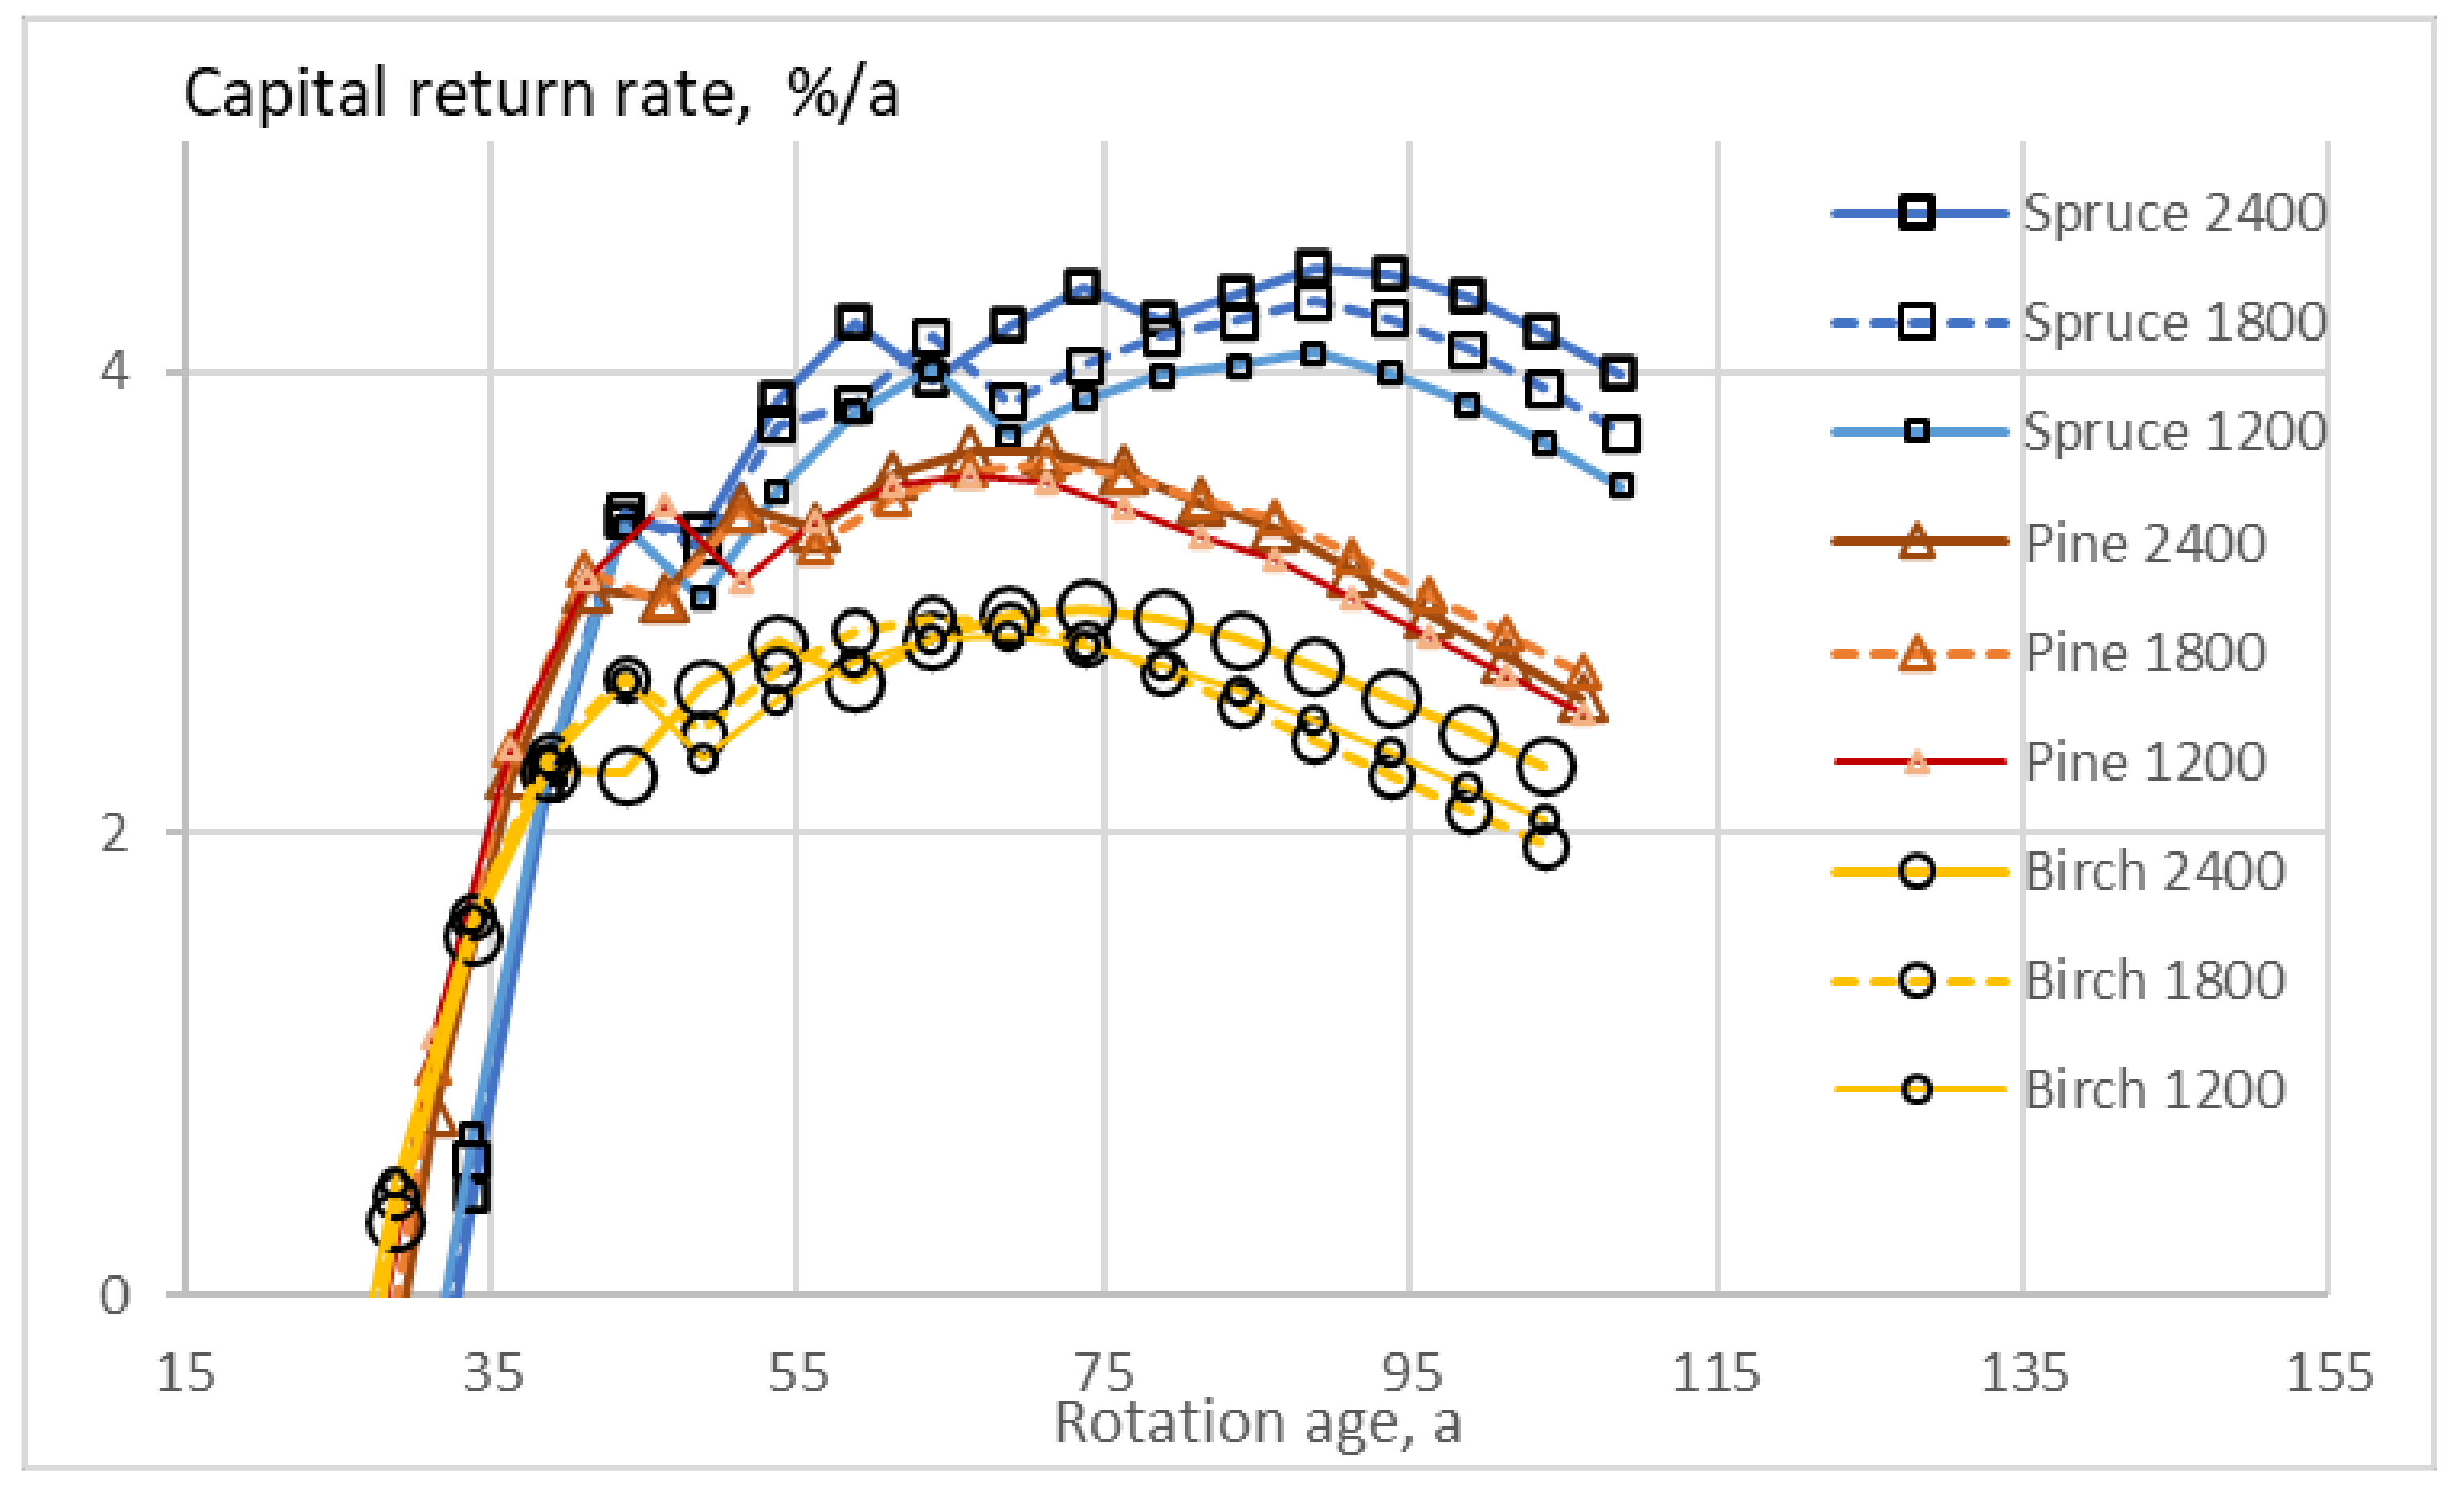
Figure 1 shows the accumulated expected value of capital return rate for three tree species and three initial stem counts, as a function of rotation age. The achievable capital return rate is not sensitive to the initial stem count. There may be one, two, or three thinnings, depending on tree species and initial stem count. Proportional thinning is not feasible. Only thinning from above is better than no thinning. All thinnings from above are heavy thinnings wherein trees larger than 188 mm in diameter are removed, and in some cases all trees larger than 163 mm, or 213 mm.
The optimal rotation ages for pine stands are 66, 71, and 66 years for initial stem counts 1200, 1800, and 2400/ha, respectively. The corresponding expected annualized capital return rates are 3.55%, 3.60%, and 3.65%. The thinnings happen at age 46, (41 and 51), and (41 and 51) years.
There are two thinnings for spruce stands of lowest initial density, and three for the two higher. The optimal rotation age is 89 years for all initial for stem counts, and the corresponding maximal capital return rates are 4.08%/a, 4.30%/a, and 4.45%/a, for stem counts 1200, 1800, and 2400/ha, respectively. However, the capital return rates would be only slightly lower if clearcutting would happen after the first thinning, at ages 64, 64, and 59 years. The capital return rates would then be 4.01%/a, 4.26%/a, and 4.21%/a, respectively. In the case of the initial stem count 1800/ha, this would require omitting the second thinning. The first thinning happens at 44 years in all cases, and the second at 64, 54, and 59 years. For the two highest initial stem counts, the third thinning is designed for the ages of 64 and 74 years. If there would be clearcutting instead of the last thinning, the expected values of capital return rate would become 4.15%/a and 4.36%/a.
Birch stands require only one thinning. The optimal rotation age is 99 years for the lowest initial stem count of 1200/ha and 94 years for 1800/ha and 2400/ha. The capital return rates are 1.99%/a, 1.98%/a, and 2.00%/a. The only thinning happens at 59 years.
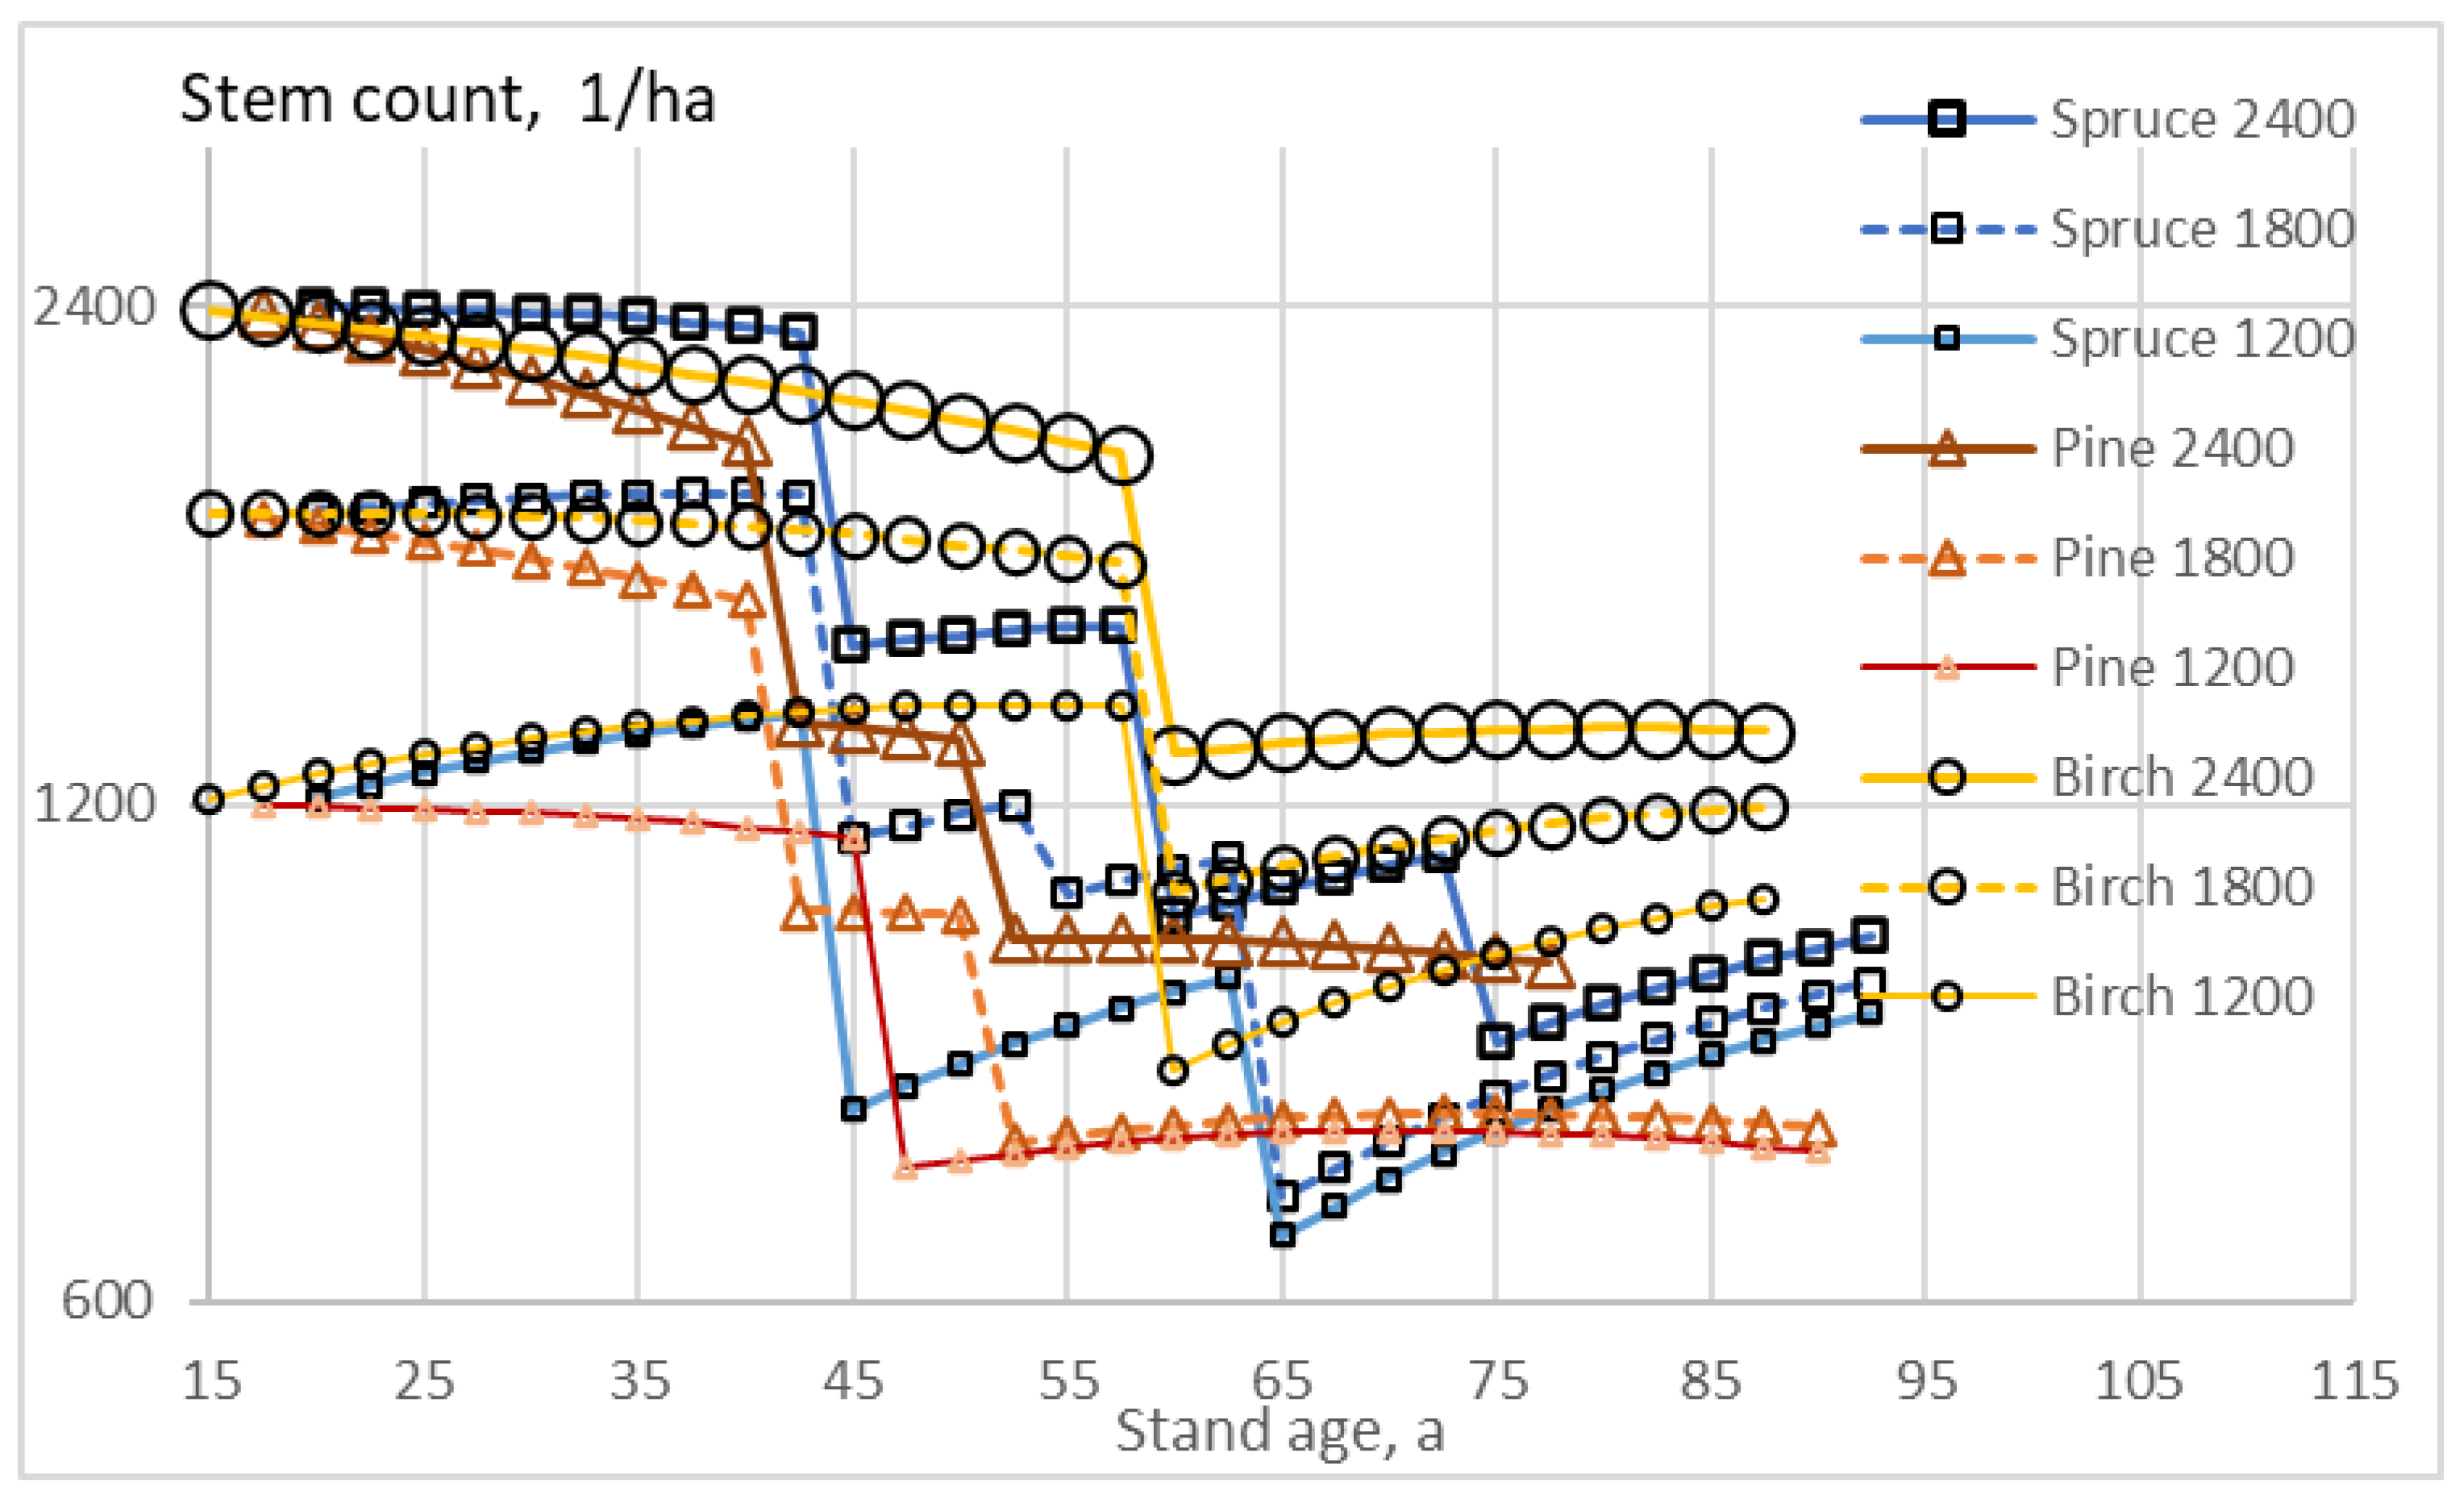
Figure 2 shows that the stem counts change not only by thinning but also evolve due to mortality and recruitment. The stem count of pine stands is monotonically reduced as mortality exceeds recruitment, except at stem counts below 1000/ha. The stem counts of spruce and birch tend to increase as recruitment exceeds mortality, except at stem counts above 1600/ha.
Development of total commercial volume per hectare, as well as the volume of sawlogs or plywood logs on for three initial stem counts, as a function of stand age for the three tree species and three initial stem counts is shown in Figure 3. It is found that thinnings always remove almost all spruce sawlogs and birch plywood logs (Figure 3). Series of two thinnings yielded only slightly inferior results for birch. In such a case, the amount of plywood logs harvested in the first thinning (Figure 3) was small. Despite this, it was essential to thin from above to the size of 188 mm. This obviously is not only due to the recovery of sawlogs and plywood logs, but also due to the lower harvesting expense of large trees.
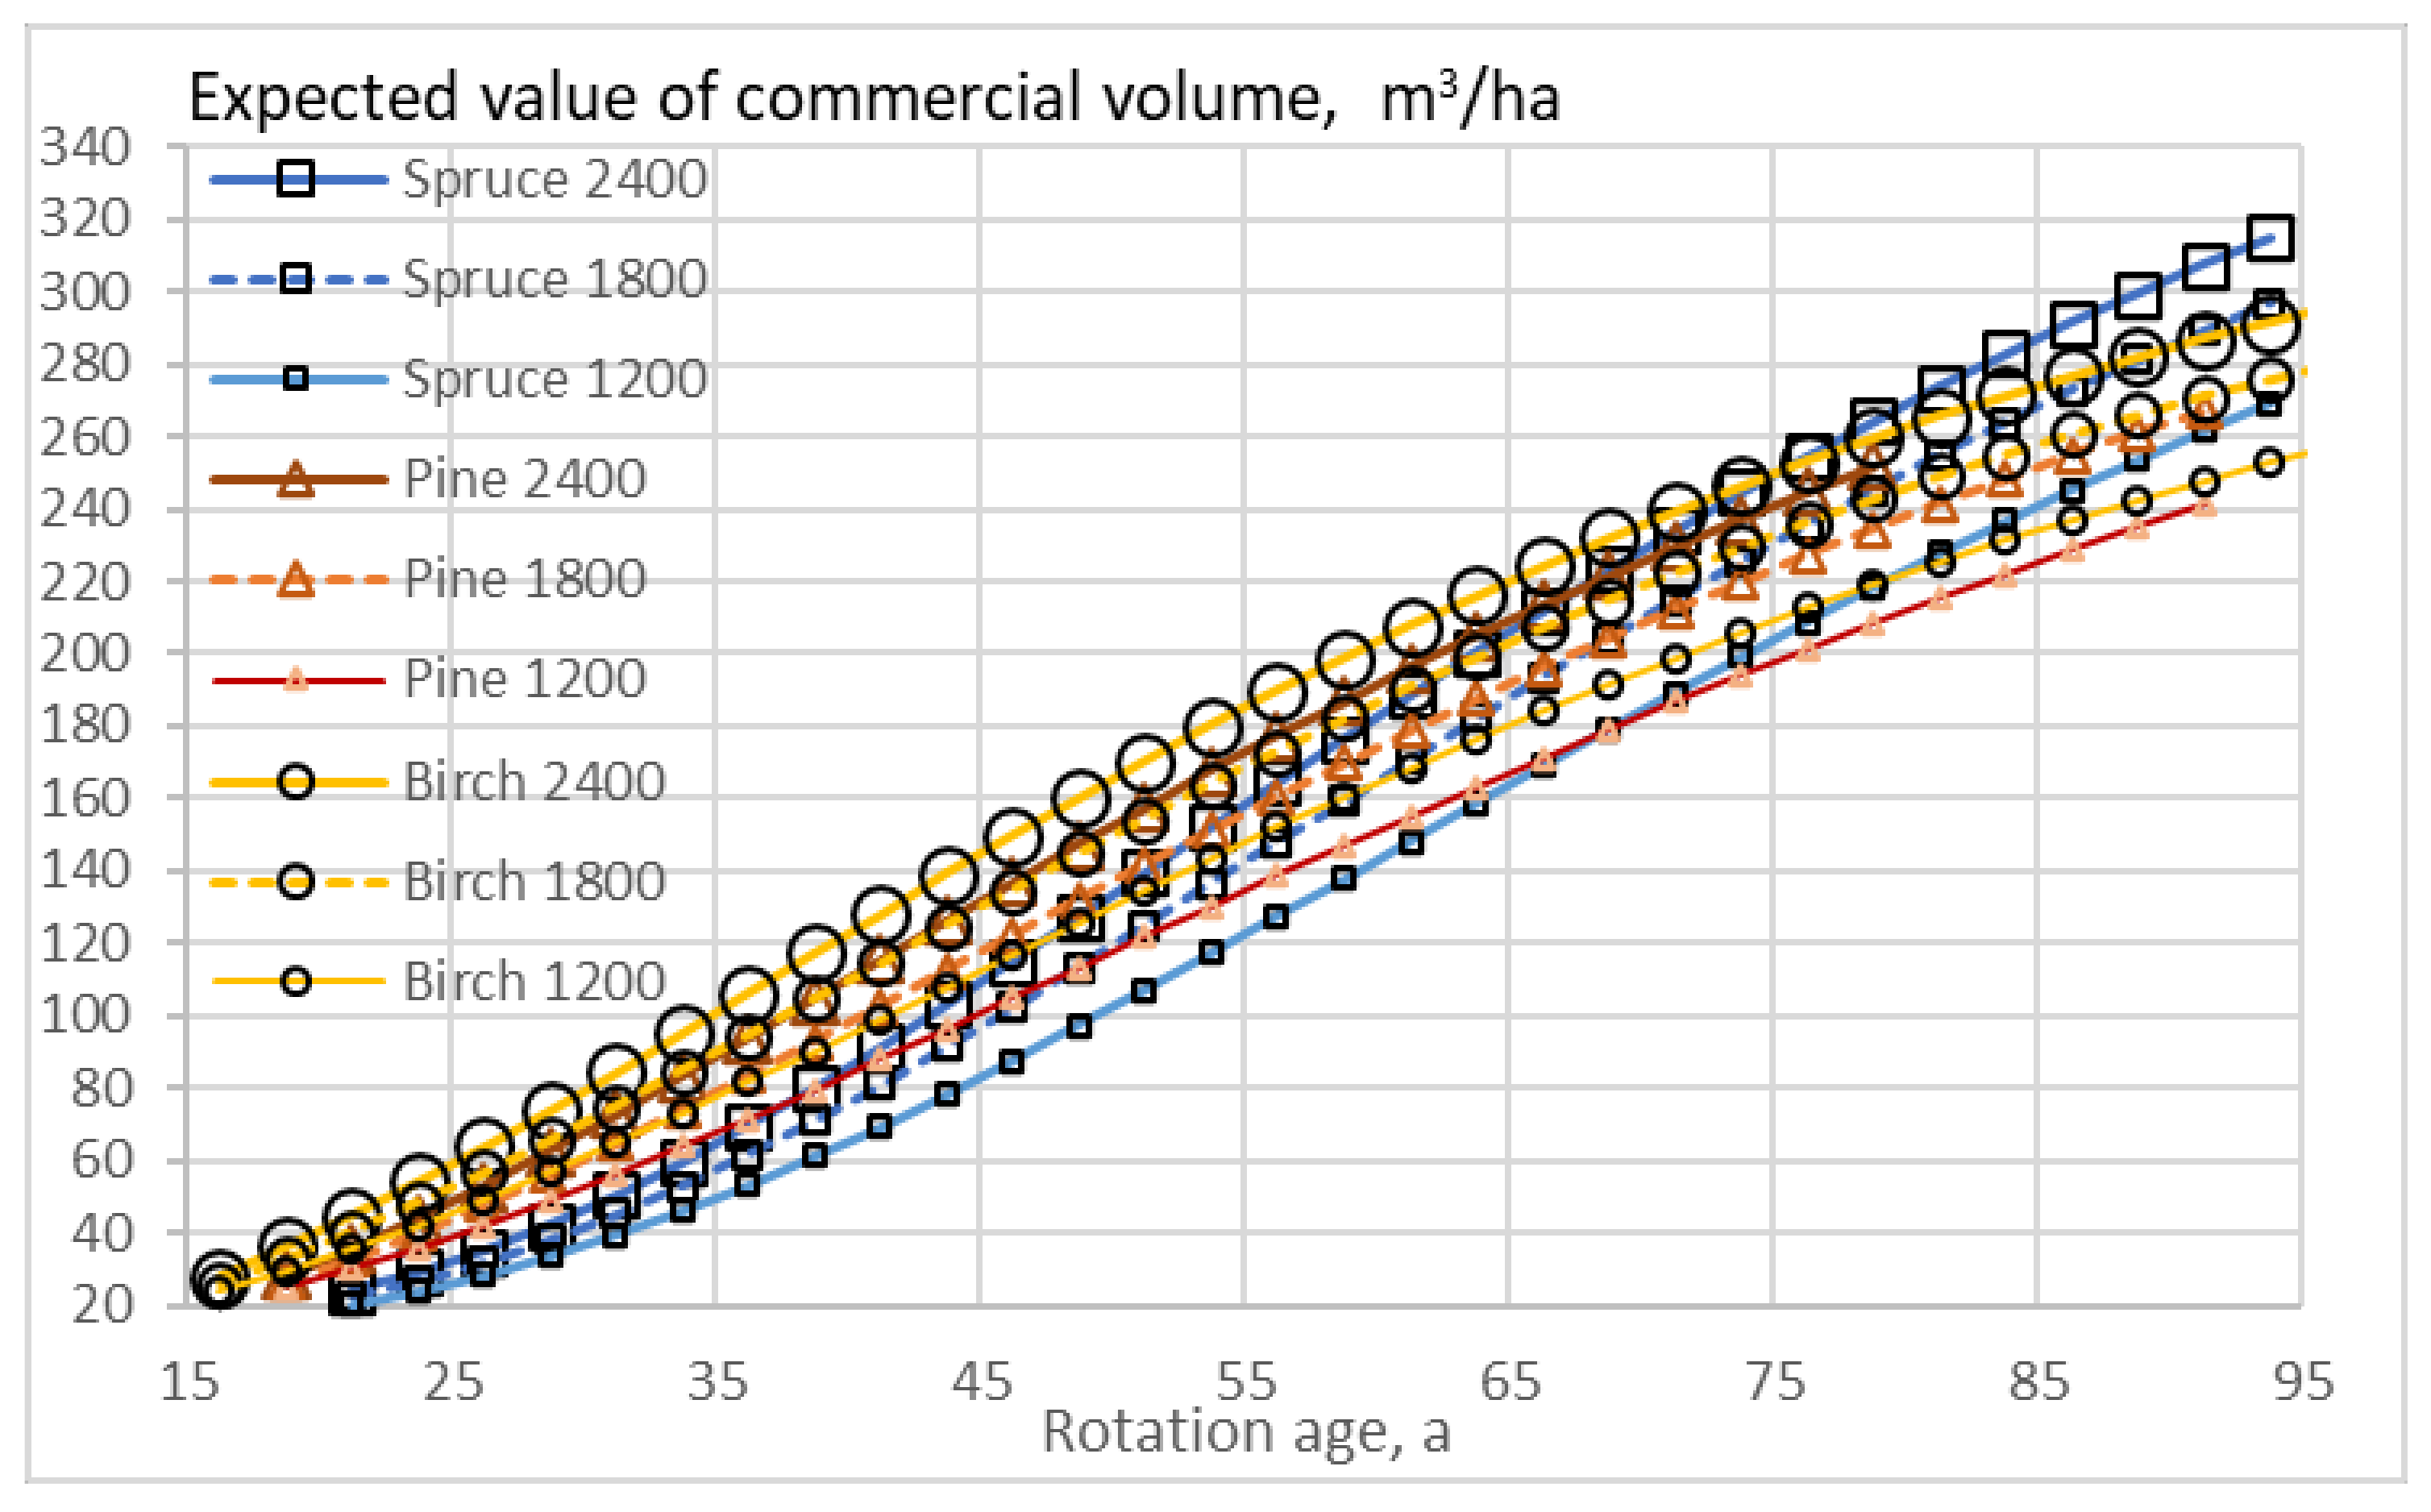
Figure 4 shows the expected (average) value of commercial stand volume as a function of rotation age for three different tree species and three initial stem counts. It is found that the timber stock was a strong function of the initial stem count. In the case of pine stands, the expected values of stand volume corresponding to the maximum capital return rate are 117, 124, and 139 m3/ha. The corresponding numbers for spruce stands are 112, 118, and 136 m3/ha. If the last thinning would be replaced by clearcutting, the expected values of volume would be 96, 109, and 130 m3/ha. For birch stands, the expected values of volumes are 133, 149, and 167 m3/ha.

3.2. Sensitivity Analysis

Of the results abovementioned, perhaps the most remarkable observations are the peculiar features of birch stands. The optimal rotation times are longer, and timber stockings higher, in comparison with conifers. It also is worth noting that the achievable capital return rate ares much lower, i.e., less than half of that achievable for Norway spruce.
There are four obvious reasons for the bad performance of birch stands. First, after the initial development, the growth rate given by the growth model [16] was the lowest (Figure 3). Secondly, the proportion of plywood logs in trunks was less than the corresponding proportions of coniferous sawlogs [23]. Thirdly, the roadside value of plywood logs was smaller than coniferous sawlogs [25,26]. Fourthly, harvesting expenses were greater than those of conifers [26,27].
How do the four differences render a greater timber stocking, as well as a longer rotation time? As the capitalization due to bare land value and regeneration expenses does not differ, but the value of the standing timber per cubic meter is lower, value growth and capital return rate can be increased by increasing commercial stand volume. It is worth noting that stand capitalizations are not higher on birch stands.
The applied growth model does not contain any synergy between tree species [16]. In reality, some synergy exists, as broad-leaved litter improves soil [33,34]. It is also likely that a mixed-species stand is less vulnerable to physical and biological threats [35,36,37]. Another particular feature of the growth model is that it retains single-species stands as such. In the case of mixed-species stands, the species distribution evolvs along with time [16].
The growth model [16] yields somewhat conservative growth estimates for conifers in relation to inventory data regarding the Southern half of Finland [38]. However, in the case of birch, the growth estimates appeared to be remarkably conservative [16,20,21,38]. A possible reason is an eventual discrepancy in tree species. Silver birch (Betula pendula) is a rather productive tree species, unlike white birch (Betula pubescens) [20,21]. It is suspected that the calibration of the growth model has mostly contained the latter.
To clarify the eventual birch species discrepancy, we attempt to describe the growth of silver birch. We apply the growth model parameters of Pinus sylvestris to Betula pendula while retaining all other parameters, including recruitment, mortality, plywood log content, assortment pricing, and harvesting expenses. The justification is the observed similarity in growth characteristics [17,18,19,20,21].
The result is shown in Figure 5. The birch stand rotations now are the shortest, except the highest initial stem count. The corresponding capital return rates are still lower than in the case of conifers, but clearly greater than in Figure 1. Capital return rates 2.86%/a, 2.94%/a, and 2.97%/a are achieved at rotation ages 69, 64, and 74 years for the three initial stem counts 1200, 1800, and 2400/a, respectively. The first thinning happens at ages 44, 44, and 39 years. In the case of the highest initial stem count, there is another thinning at 54 years. The expected values of stand volumes corresponding to maximum capital return rate are 118, 144, and 158 m3/ha—considerably lower than in Figure 4.
Above, thinnings from above were applied. Also, proportional thinnings were attempted, but never applied because of their impairing financial effect. In all cases examined, it was better not to thin at all, in comparison with proportional thinning. On the other hand, thinnings from above may result in the most vigorous trees removed.
Here, forest growth and yield without any thinning are investigated as an alternative to thinning from above. The result, comparable to Figure 5, is shown in Figure 6. Optimal rotations are much shorter: 52 years for pine, 54 years for spruce, and 49 years for birch. The capital return rates become 3.50%/a, 3.52%/a, and 3.44%/a for pine, 3.99%/a, 4.04%/a, and 3.99%/a for spruce, and 2.77%/a, 2.77%/a, and 2.69%/a for birch. It is worth noting that in the absence of commercial thinning, the greatest initial stem count yields the lowest capital return rate for any of the tree species.
The expected value of commercial volume in the absence of any thinning is shown in Figure 7. The expected volume values corresponding to the financially optimal rotation age are 122, 142, and 158 m3/ha for pine, 117, 136, and 152 m3/ha for spruce, and 126, 145, and 160 m3/ha for birch. These values are larger than those achieved by optimizing capital return rate with thinnings, especially in the case of conifers, even if the greatest difference in the average stand volume is due to the applied initial stem count.
As an investment, boreal forestry does not appear very attractive according to Figure 1, Figure 5 and Figure 6. One possible way to increase the capital return rate might be to reduce the regeneration expense. The regeneration expenses above were based on excavator mounding, along with some drainage and minor road improvements, as well as the planting of nursery-grown seedlings. It is possible to use a continuously operating mounding device instead of an excavator. It also is possible to reduce the number of planted seedlings and partially rely on natural regeneration. One option is to combine planting and seeding. A third possibility is the application of a combined mounding-planting device. With such measures, the regeneration expense can be reduced by 500 Eur/ha, according to the present expense level in the reference area.
If the regeneration expense is reduced, a question arises of how the further development of any stand will be affected. This may vary widely. However, it is far from self-evident that “good practices” often recommended in the reference area would give the best value growth in the future. At the time of young stand tending, the stem count often is in the order of 10,000/ha, of which 10–20% are cultivated seedlings. Cost-saving regeneration practices may increase tree species diversity, which in turn may increase growth rate as well as resiliency [33,34,35,36,37].
The effect of reduced regeneration expense on capital return rate is shown in Figure 8. In all cases, the achievable capital return rate is more than 10% greater than in Figure 5. In most cases, the optimal rotation is shorter and, in a few cases, the number of thinnings is reduced. In the case of pine stands of initial stem count 1200 and 1800/ha, the rotations become ten years shorter, and the capital return rate increases by 16%. In the case of initial stem count 2400, the rotation age is the same, and the capital return rate increases by 13%.
In the case of spruce stands of initial stem count 1200, 1800, and 2400/ha, the rotations become 25, 20, and 15 years shorter, and the capital return rate increases by 14%, 13%, and 10%. In the case of birch stands of initial stem count 1200, 1800, and 2400/ha, the rotations beoame 10, 5, and 5 years shorter, and the capital return rate increases by 18%, 16%, and 14%.
Again, proportional thinnings are not applicable. A feasible alternative to thinnings from above is to apply no commercial thinning. The capital return rate without commercial thinning, comparable to Figure 6 but with reduced regeneration expense, is shown in Figure 9.
For all three pine stands, the rotations are five years shorter in Figure 9 than in Figure 6. The capital return rates are 17%, 16%, and 16% greater. The rotation age was the same for spruce stands of 1200 and 1800/ha initial stem count, and five years shorter for 2400/ha. The capital return rates are 15%, 14%, and 13% greater in Figure 9. For all three cases of birch stands, the rotation ages are the same in Figure 6 and Figure 9. The capital return rates were 20%, 18%, and 18% greater.

3.3. Carbon Storage Finances

In Figure 1, Figure 5, Figure 6, Figure 8 and Figure 9 above, which display capital return rate, it is possible to see what capital return rate is achievable. On the other hand, any applied silvicultural practices may result in carbon storage differing from that corresponding to the maximum capital return rate [%/a]. One can relate these two quantities in terms of capital return rate deficiency per excess commercial volume unit [Eur/(m3*a)]. This practically happens by multiplying the expected value of capital return rate deficiency [%/a] by the expected value of capitalization per hectare [Eur/ha] and then dividing by the expected value of excess commercial volume per hectare [m3/ha] [9,13,14]. The excess commercial volume per hectare refers to volume exceeding the volume corresponding to the maximum capital return rate. An excess commercial volume is achievable by extending rotations without further thinnings.
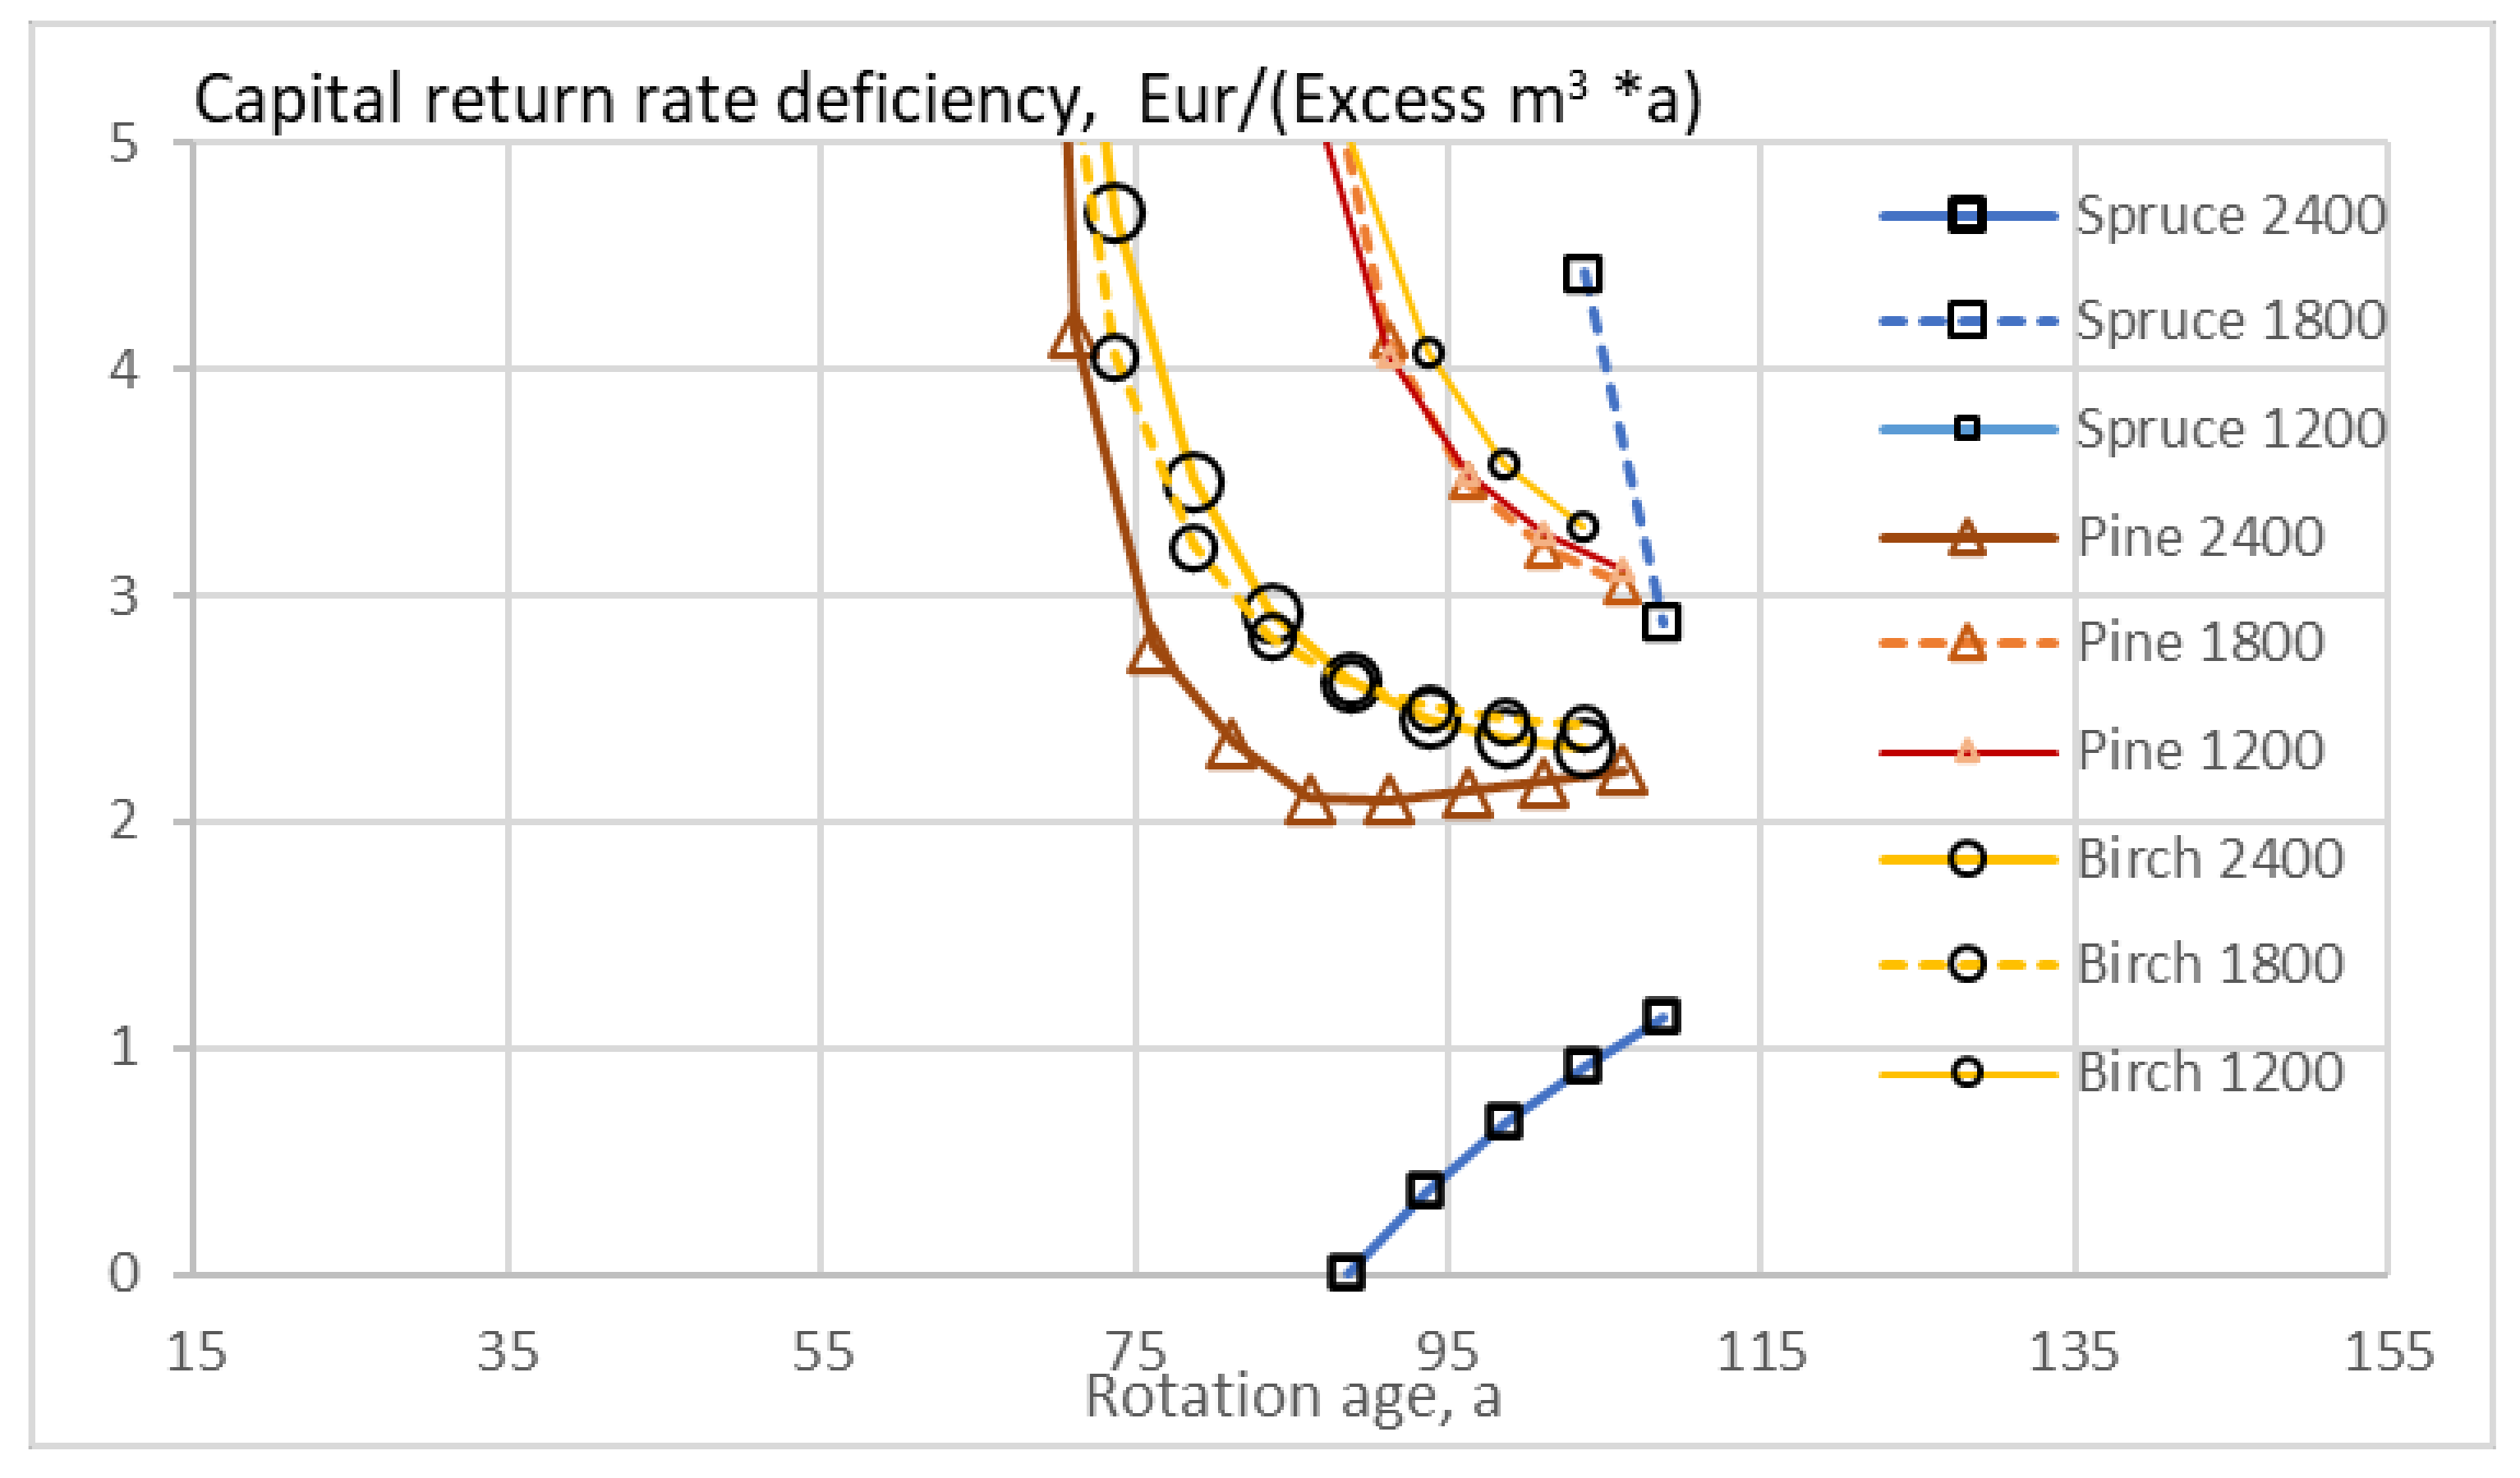
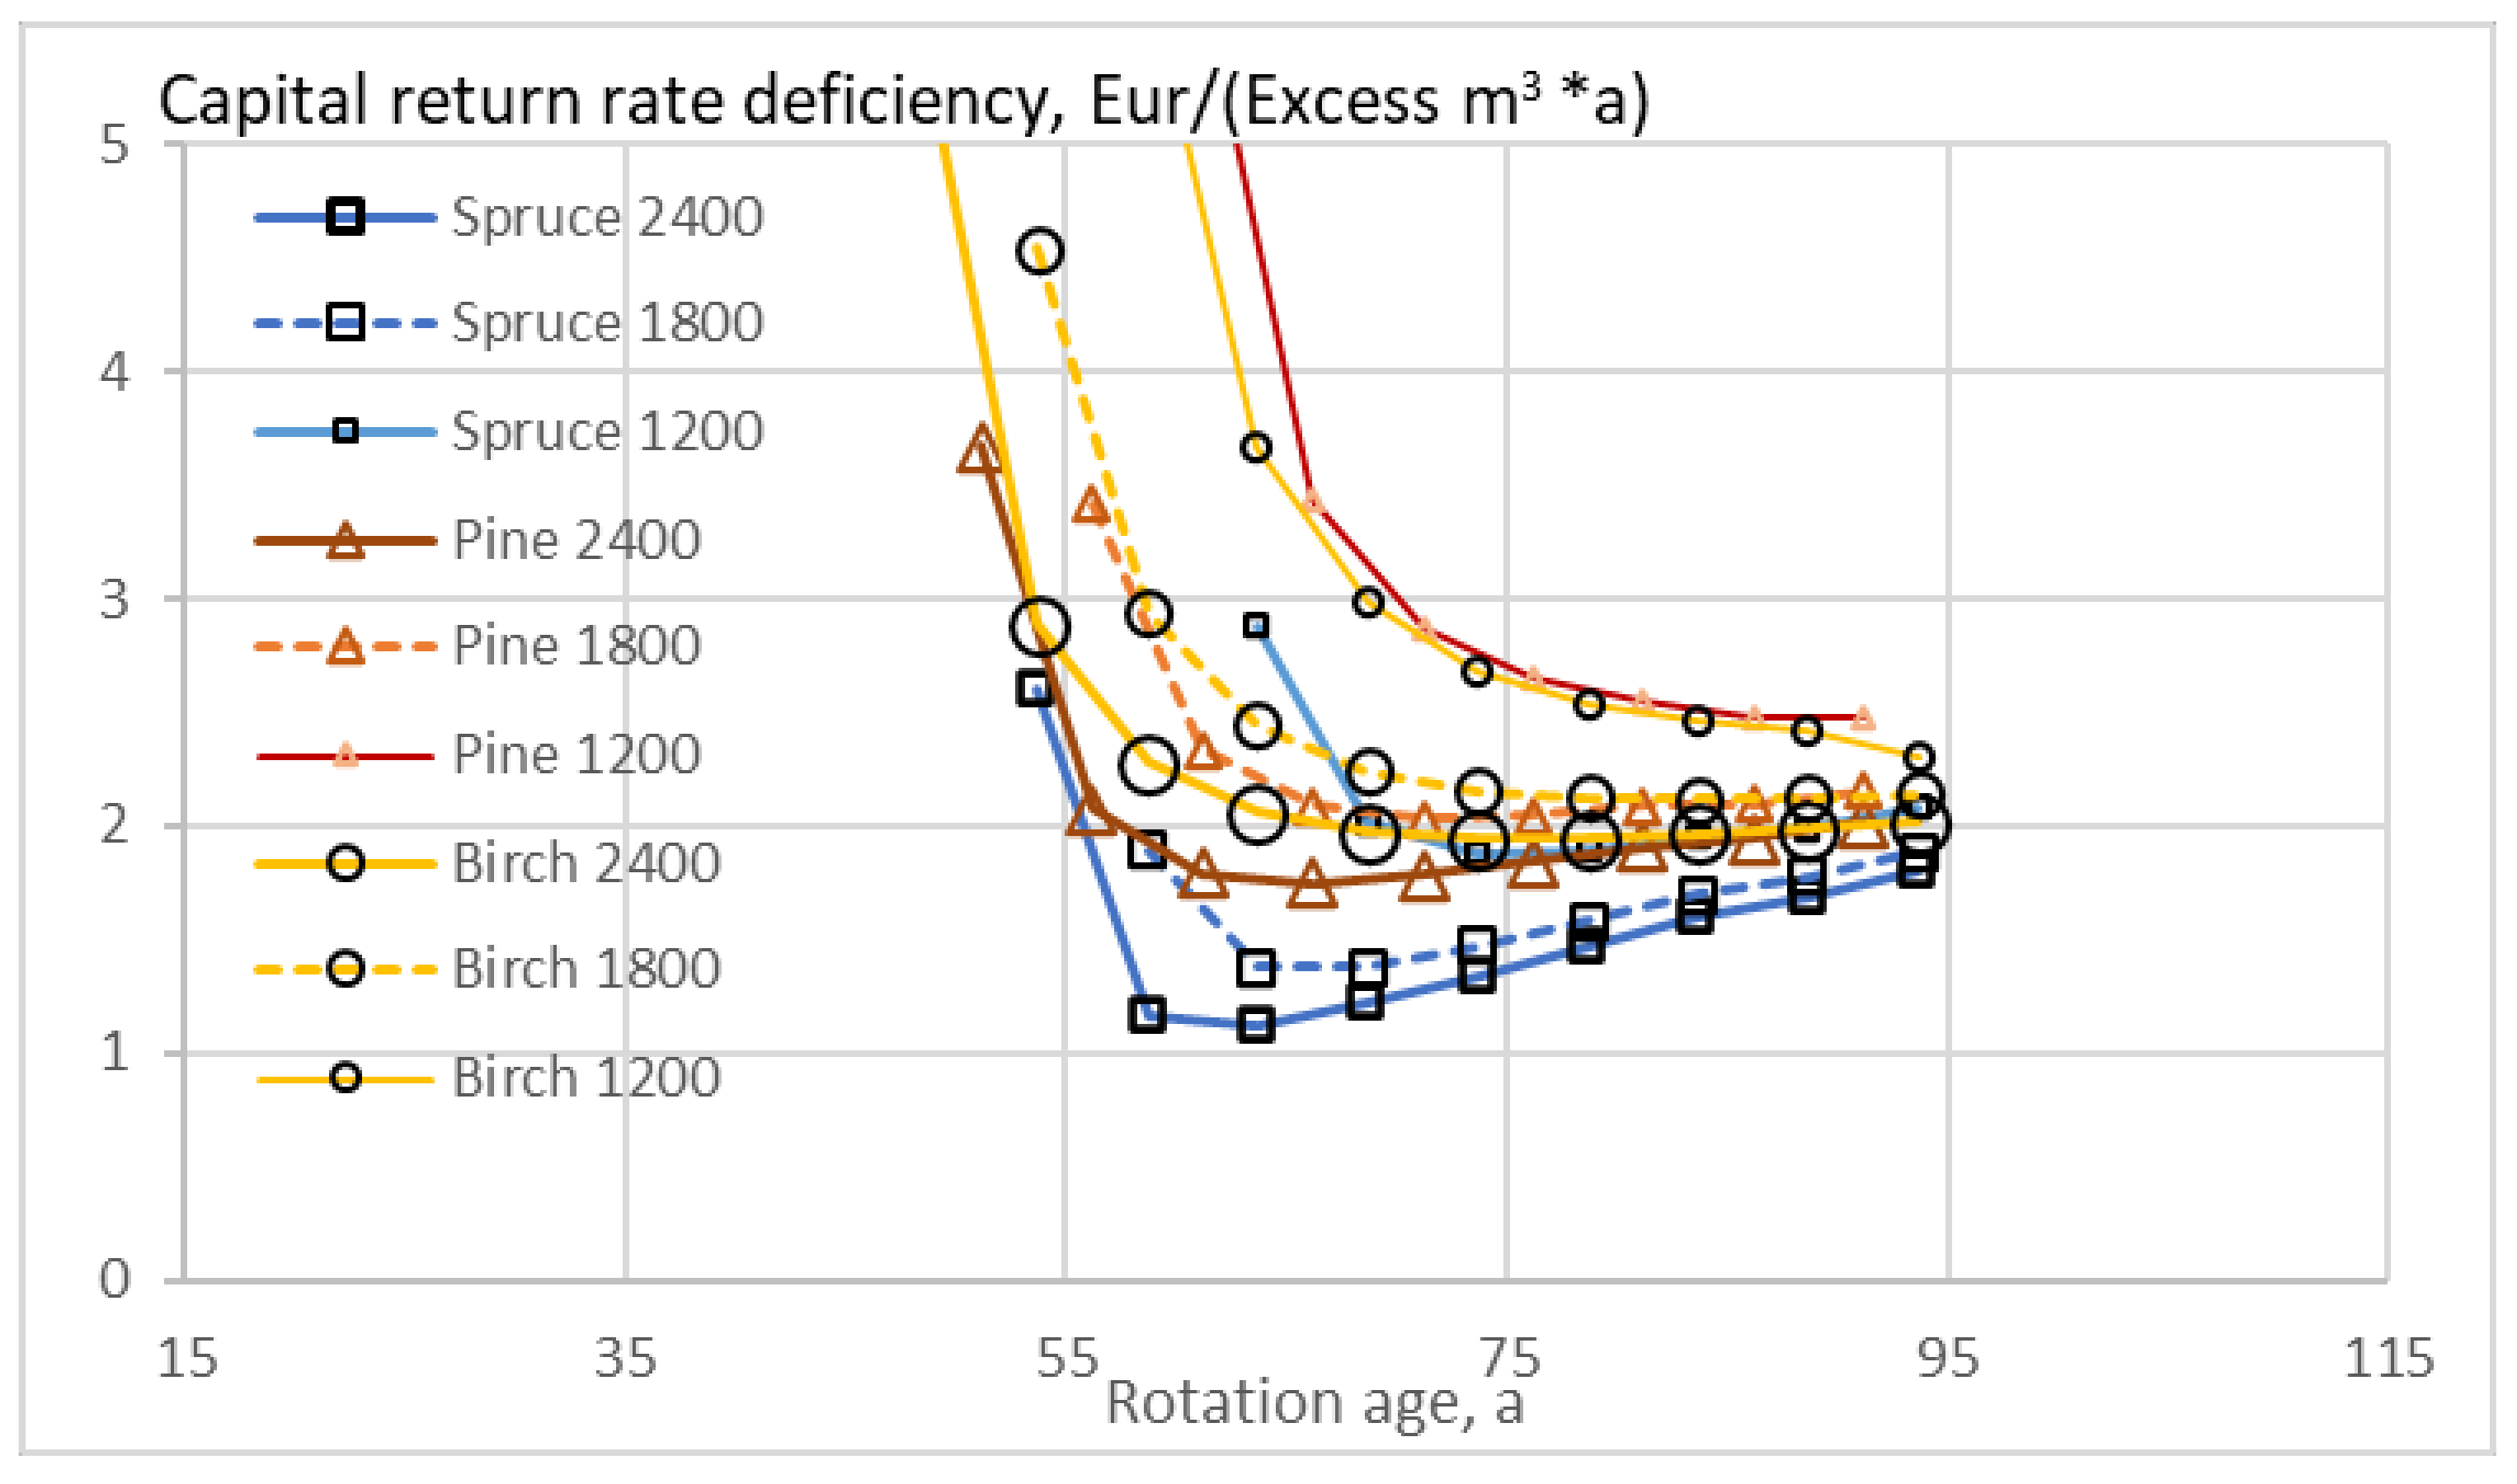
Figure 10 shows the capital return rate deficiency per excess volume in treatments corresponding to Figure 5. The Figure only shows observations with positive excess volumes, and the axis are scaled to exclude observations where the denominator in the observable would approach zero. The possibilities of increasing carbon storage from the financially optimal solution are limited. Carbon rent derived from the 2021 emission price, up to 50 Eur/ton CO2, would mostly enable an extension of rotations of the spruce stands with high initial seedling density [10,13]. This reflects the high level of carbon storage and lengthy rotation time associated with the financially optimal solution in Figure 1, Figure 4 and Figure 5, in comparison with earlier findings [6,7,8,9].
Figure 11 shows the capital return rate deficiency per excess volume in treatments corresponding to Figure 6. However, as the maximum capital return rate appearing in Figure 5 is greater, the reference of capital return rate, as well as that of commercial stand volume, is taken from Figure 5. Omitting thinnings, along with increased rotation age, results in excess volumes with relatively small capital return rate deficiency. An annual carbon rent of less than two euros per excess commercial cubic meter could increase the expected value of excess commercial volume up to 170 m3/ha (Figure 7). An excess volume of 100 m3/ha is achievable with a deficiency of 1.34 Eur per excess m3 (Figure 7 and Figure 11).

3.4. Operative Outcome in the Absence of Carbon Storage Compensation

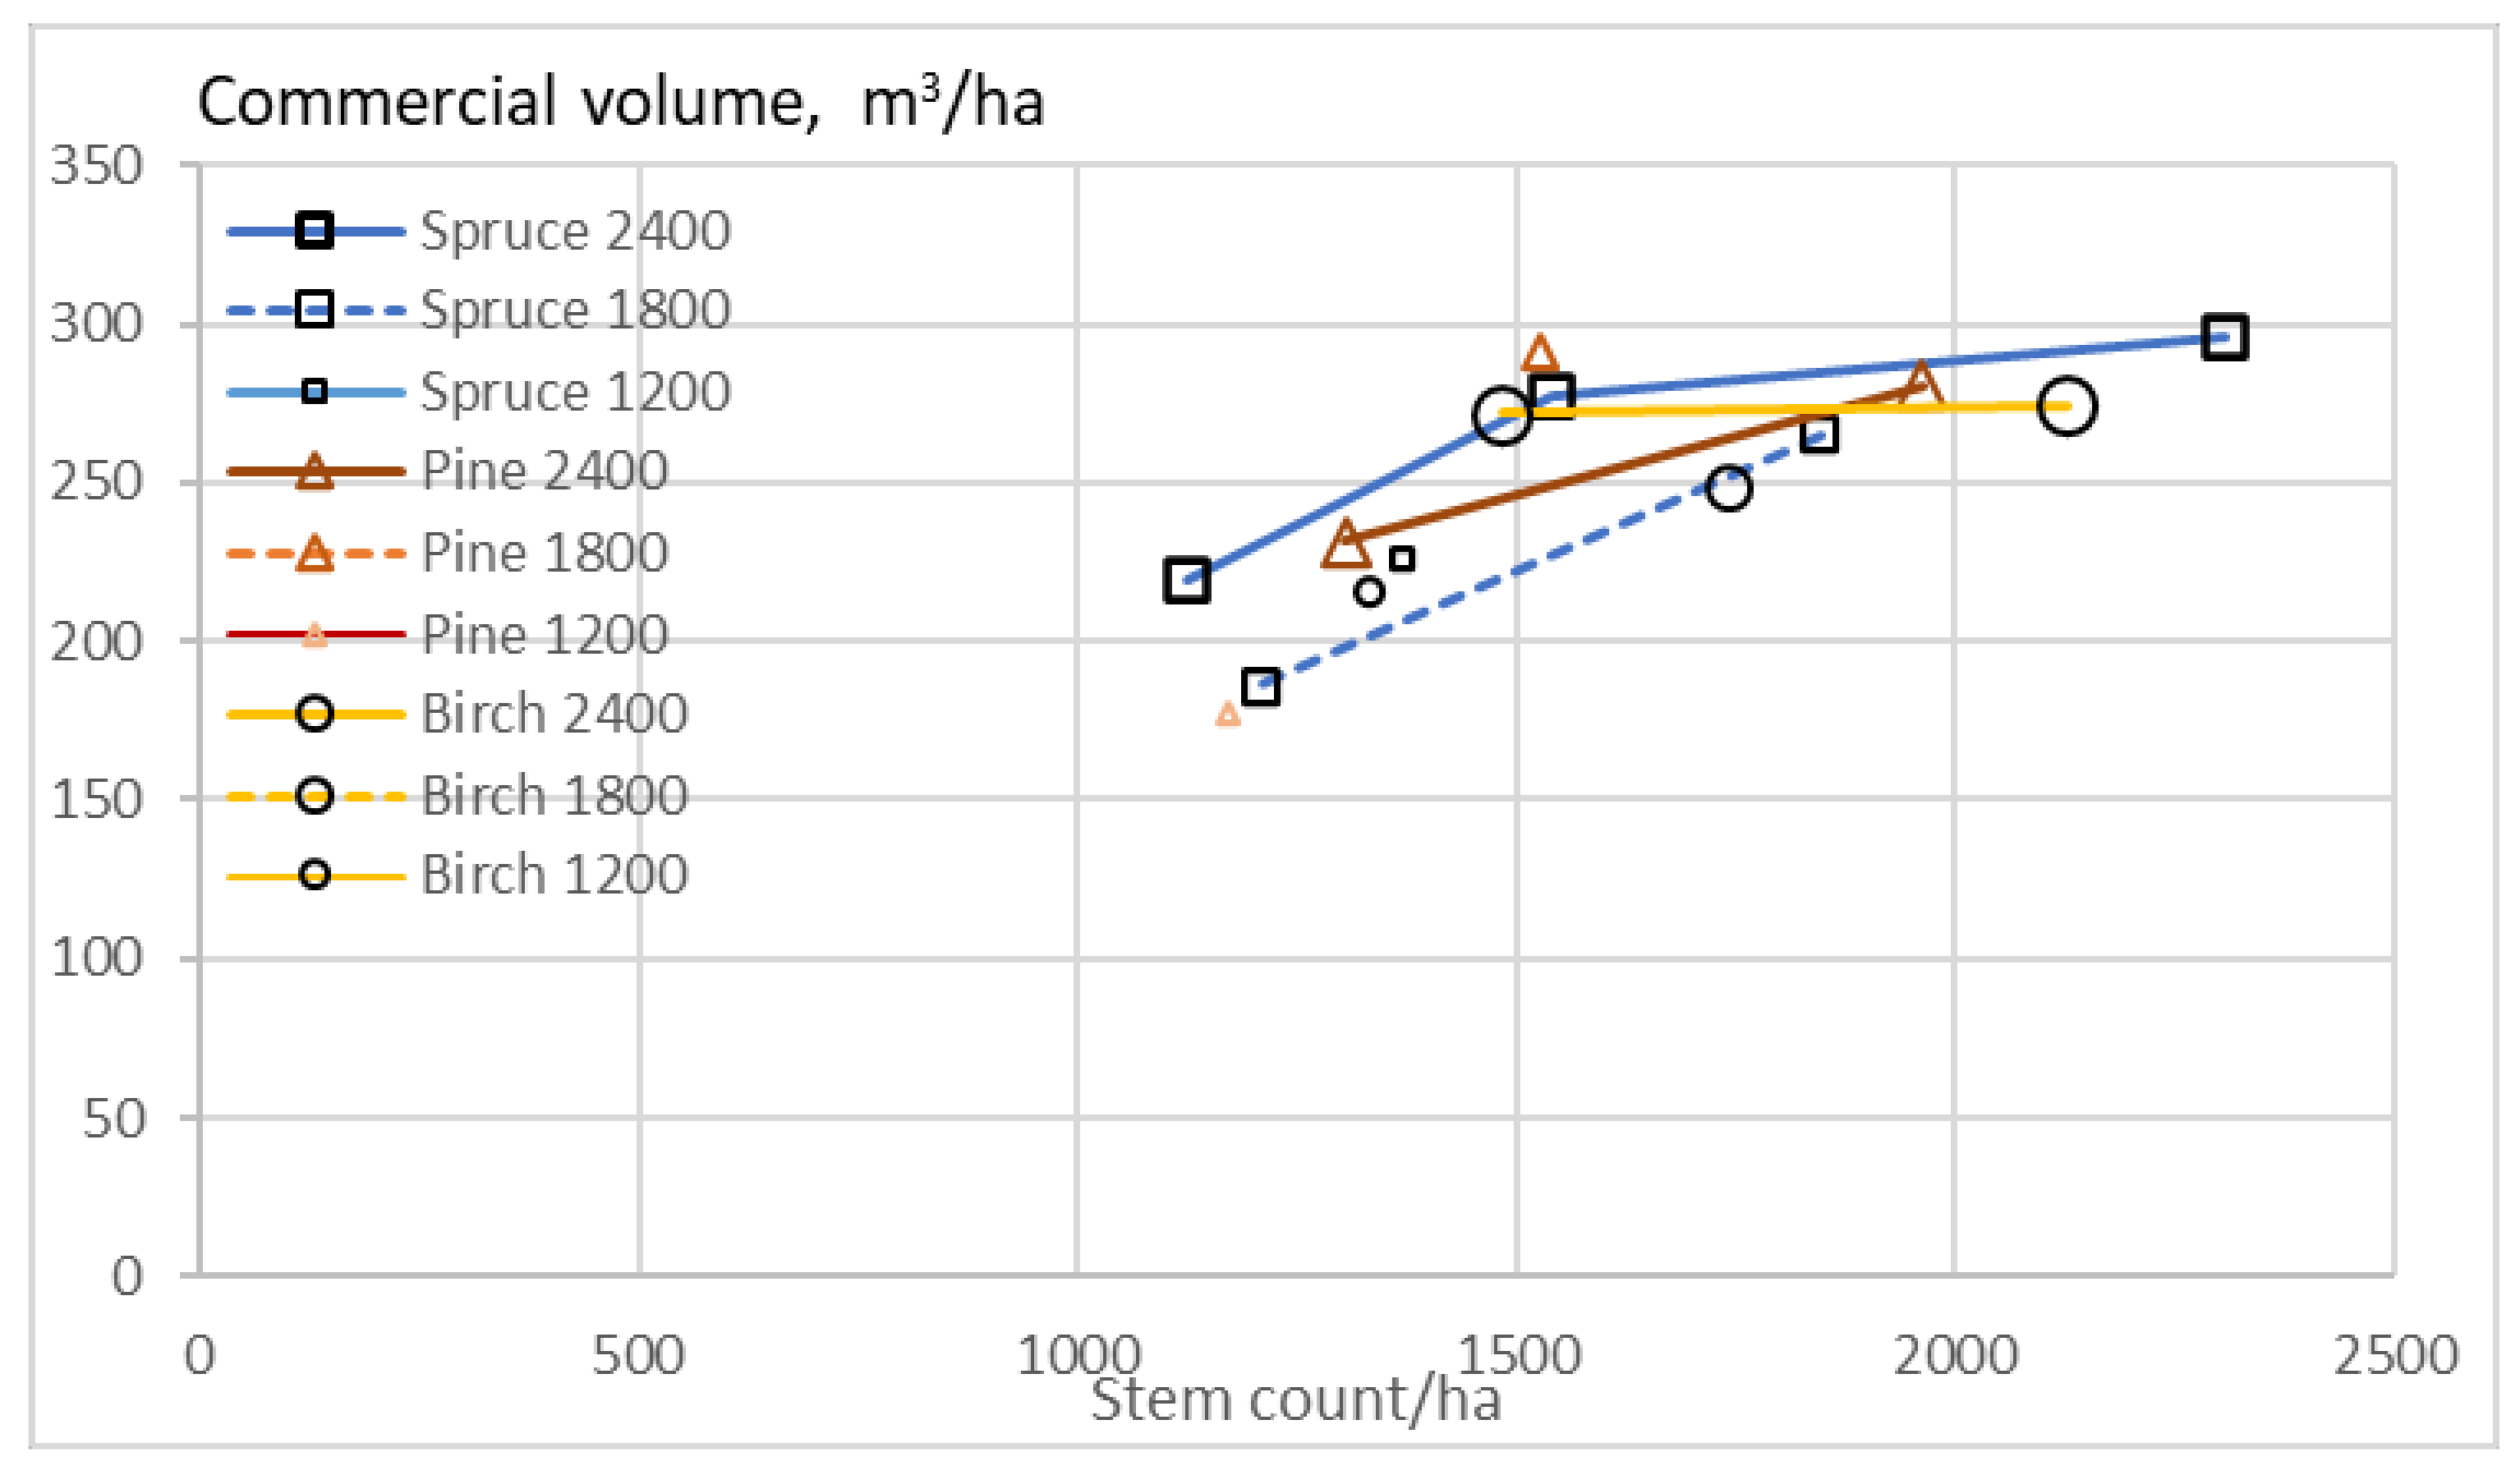
No restrictions were applied in the design of thinning procedures. Consequently, the applied thinnings reflected those suitable from the viewpoint of maximizing the capital return rate. Figure 12 shows the combination of stem count and commercial volume where thinnings, appearing in Figure 8, are triggered. It was found that, except for the pine stand with the lowest initial stem count, first thinnings are triggered at stand volumes above 200 m3/ha. Further thinnings are triggered at lower stem counts and generally also lower stand volumes than the first thinning.
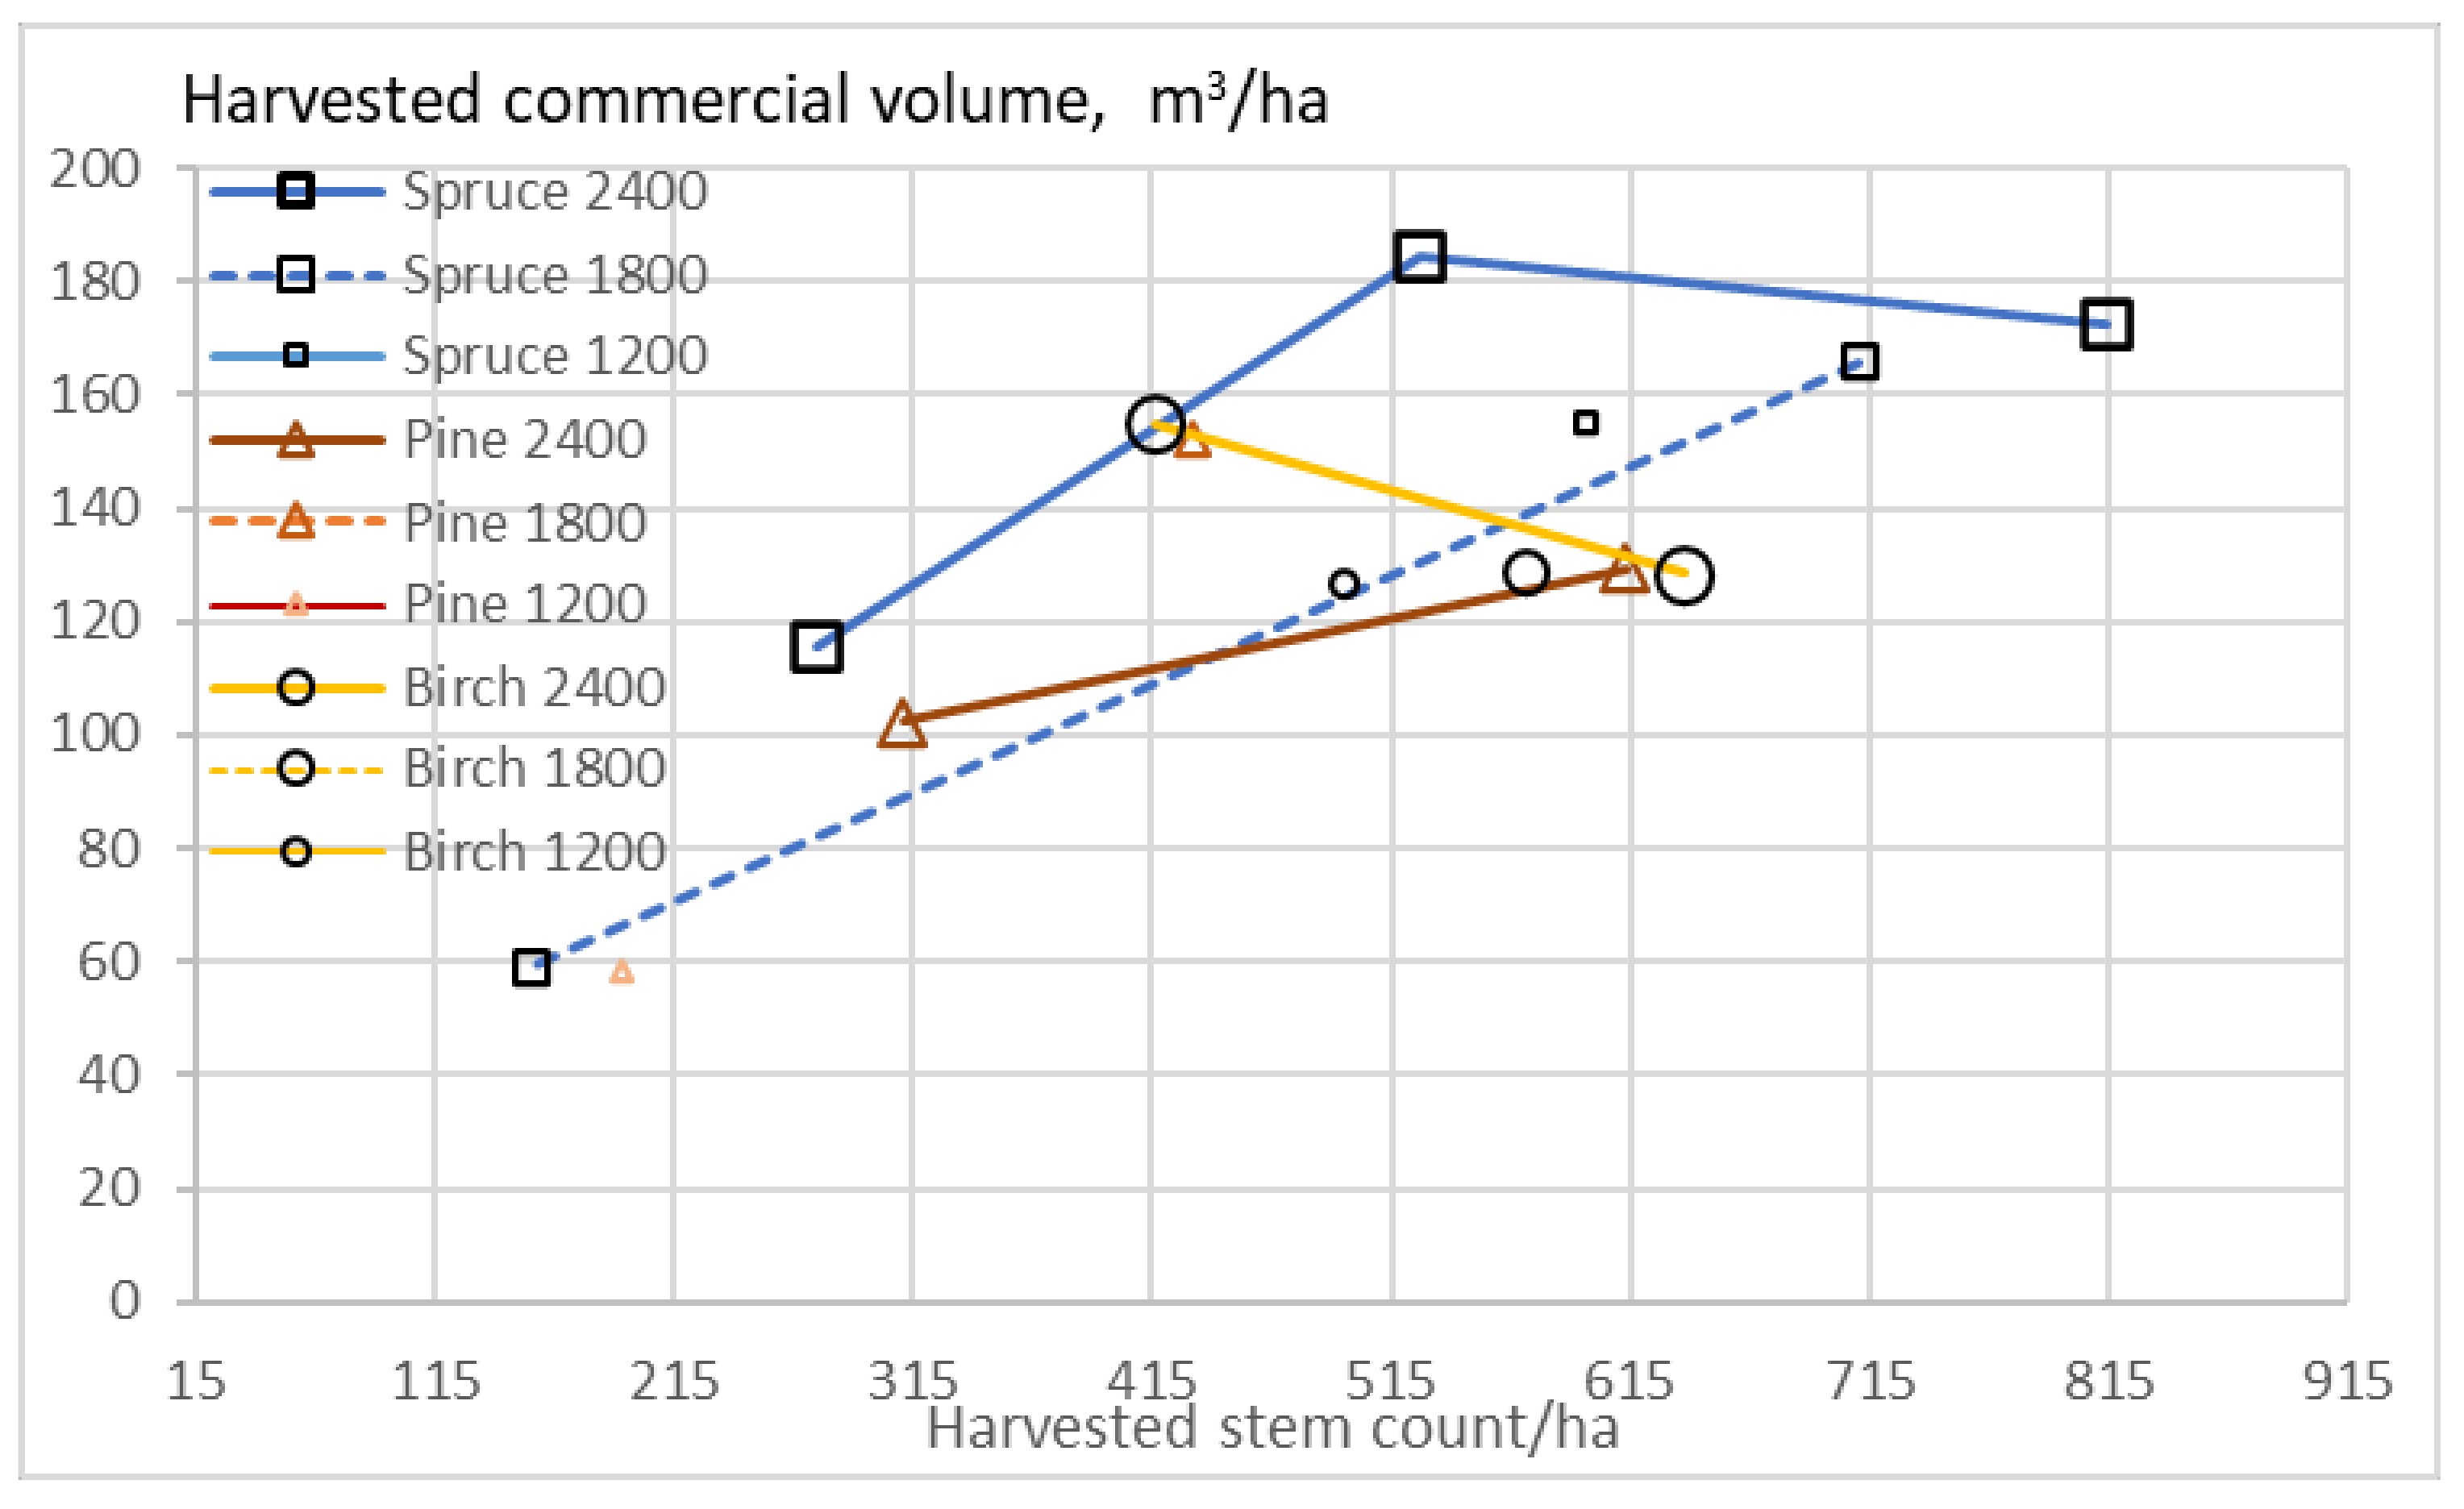
Figure 13 shows the relationship of removed stem count and removed commercial volume in thinning, corresponding to procedures appearing in Figure 8. The arithmetic average commercial volume of harvested trees is never less than 200 L. In the case of multiple thinnings, the first thinning always harvests the greatest stem count. All thinnings extract more than 100 cubic meters of commercial timber, except the second thinning in spruce stands of initial stem count 1800/ha, and the only thinning of pine stands of initial stem count 1200/ha.
After thinnings, what remains for clearcutting is shown in Figure 14. In all cases, the commercial volume harvested in clearcutting is between 200 m3/ha and 300 m3/ha. The sawlog content of pine stands is the greatest with the smallest initial stem count, 46%. The sawlog contents with the larger initial stem counts are 39% and 41%. The sawlog contents of spruce stands are 48%, 47%, and 48%. The plywood log contents of the birch stands are 28%, 27%, and 23%.
Figure 15 shows the volumetric yield of sawlogs/plywood logs as a function of the yield of commercial volume in clearcutting without any commercial thinning. In comparison with Figure 14, the volumetric yield is greater than with thinnings, but the proportion of sawlogs is smaller. The commercial volume harvested is between 250 and 370 m3/ha. The proportions of sawlogs are 38%, 33%, and 29% for pine and 48%, 43%, and 33% for spruce. The proportions of birch plywood logs are 28%, 27%, and 23%.

4. Discussion

The general theory of risk proposes long-term commitments contain more uncertainty than short-term commitments [39,40]. Within forestry, “duration risk” not only refers to interest rate risk, but to a variety of uncertain or unknown changes that occur over time. Correspondingly, small differences in the expected value of capital return rate, shown in Figure 1, Figure 5 and Figure 8, propose that short rotation times should possibly be used. This differs significantly from the results of recent investigations: capital return rate appeared to be a strong function of rotation age [9,13,14], in which case the duration risk argument would vanish. The absence of thinnings, shown in Figure 6 and Figure 8, would further reduce commitment times. However, omitting thinnings also removes thinning revenues.
The size scale of the operation of any business agent is finite. Large investments involve greater concentration risk than smaller, distributed investments [39,40]. The difference in the expected value of capital return rate between different kinds of regeneration procedures within any set (Figure 1, Figure 5, Figure 6, Figure 8 and Figure 9) being small, inexpensive regeneration practices should possibly be favored, including low planted stem counts per hectare. The situation would change if a significant carbon storage compensation existed [10,13], Figure 4.
There indeed is one factor contradicting the application of short rotation times and low stem counts. Figure 4 indicates that extending rotation time tends to increase the expected value of trunk volume per hectare, as does increased stem count. This naturally contributes to the storage of carbon in forestry. The effect of stem count on the storage appears greater than that of the rotation age (Figure 4). If a reasonable carbon rent is applied [10,13], it justifies higher stem counts and longer rotation times. Omitting thinnings may very strongly increase carbon storage (Figure 4, Figure 7 and Figure 11).
The main difference in the present results, in comparison with earlier findings [9,12,13,14], is the weak dependence of capital return rate on rotation age and seedling density. This outcome opens avenues for increased carbon sequestration in terms of a moderate monetary compensation. The origin of the new findings can be attributed to the novel boundary conditions applied. Either the application of the growth model at a younger age or the amortization of regeneration expenses at the end of the rotation may contribute. Clarification of the relative roles of the two phenomena would require further investigation.
In comparison with common practices applied in the reference area, a major difference is the size of trees harvested in thinnings. The origin of the average volume of harvested trees always exceeding 200 L is obviously in the harvesting expense function [26,27]. Thinnings can be naturally applied to smaller trees if the expenses are made reasonable. However, agreements with low harvesting prices on small trees may not be sustainable provided that the harvesting productivity function is unbiased.
It is worth noting that individual trees were characterized above by two parameters: tree species and size. In real life, the characteristics of any tree may depend on its age and position within the population, along with a variety of other factors. The other contributors form a complex field—we are not able to present any comprehensive description of them in this study.
In this study, fertile and semi-fertile boreal forests on mineral soil were discussed. That type of forest dominates forest production in the reference area with an area proportion of 59% [38]. Any of the investigated three tree species are applicable in the investigated type of forest. Any significant deviation from such forest type would change things. Significantly lower fertility would exclude the tree species of Norway spruce and Silver birch. Planting of seedlings would be replaced by seeding of Scots pine. On the other hand, peatlands, except the most fertile, might fall into the regime of natural regeneration, or possibly continuous-cover forestry. Such circumstances are out of the scope of this study.
In coarse terms, the results of this study can be compared with national statistics of the reference area [38]. The growth rates given by the growth model [16], calibrated in Norway, appear somewhat conservative in the Southern half of Finland [38]. One consequence is that the capital return rates reported in this paper are not higher than typical values indicated by national statistics, even if they were optimized in this paper. Another complication is that the average profitability of forestry is available from one center of statistics [38], whereas the market value of forest estates must be indirectly deduced from another source [41].

5. Conclusions

Regeneration expenses were amortized first at the end of any rotation. Consequently, capitalizations became greater and rotations longer than in recent studies. The capital return rate was a weak function of initial stem count and rotation age but differed by tree species. The initial stem count strongly contributed to biomass stored in trees. Omission of thinnings increased carbon storage very effectively but requires financial compensation. The most promising way of increasing the capital return rate was the reduction of regeneration expenses. Thinnings were triggered by stand volumes of at least 200 m3/ha. The average commercial trunk volume of trees removed in thinnings always exceeded 200 L. Risk aversion theory proposes short rotations and low stem count in seedling planting unless carbon storage compensation exists. Even a moderate carbon storage compensation justifies increased seedling counts and extended rotations.

Funding

This work was partially funded by Niemi Foundation.

Institutional Review Board Statement

Not applicable.

Informed Consent Statement

Not applicable.

Data Availability Statement

Not applicable.

Conflicts of Interest

The author declares no conflict of interest.

References

  1. Gustavsson, L.; Haus, S.; Lundblad, M.; Lundström, A.; Ortiz, C.A.; Sathre, R.; Truong, N.; Wikberg, P.-E. Climate change effects of forestry and substitution of carbon-intensive materials and fossil fuels. Renew. Sustain. Energy Rev. 2017, 67, 612–624. [Google Scholar] [CrossRef]
  2. Van Kooten, G.C.; Johnston, C.M.T. The economics of forest carbon offsets. Annu. Rev. Resour. Econ. 2016, 8, 227–246. [Google Scholar] [CrossRef]
  3. Van Kooten, G.C.; Bogle, T.N.; De Vries, F.P. Forest carbon offsets revisited: Shedding light on darkwoods. For. Sci. 2015, 61, 370–380. [Google Scholar] [CrossRef]
  4. Pukkala, T. Carbon forestry is surprising. For. Ecosyst. 2018, 5, 5. [Google Scholar] [CrossRef] [Green Version]
  5. Seppälä, J.; Heinonen, T.; Pukkala, T.; Kilpeläinen, A.; Mattila, T.; Myllyviita, T.; Asikainen, A.; Peltola, H. Effect of increased wood harvesting and utilization on required greenhouse gas displacement factors of wood-based products and fuels. J. Environ. Manag. 2019, 247, 580–587. [Google Scholar] [CrossRef]
  6. Kilkki, P.; Väisänen, U. Determination of the optimum cutting policy for the forest stand by means of dynamic programming. Acta For. Fenn. 1969, 102, 1–23. [Google Scholar] [CrossRef]
  7. Kärenlampi, P.P. Harvesting design by capital return. Forests 2019, 10, 283. [Google Scholar] [CrossRef] [Green Version]
  8. Kärenlampi, P.P. The effect of capitalization on financial return in periodic growth. Heliyon 2019, 5, e02728. [Google Scholar] [CrossRef]
  9. Kärenlampi, P.P. Estate-Level economics of carbon storage and sequestration. Forests 2020, 11, 643. [Google Scholar] [CrossRef]
  10. Lintunen, J.; Laturi, J.; Uusivuori, J. How should a forest carbon rent policy be implemented? For. Policy Econ. 2016, 69, 31–39. [Google Scholar] [CrossRef]
  11. Pukkala, T. At what carbon price forest cutting should stop. J. For. Res. 2020, 31, 713–727. [Google Scholar] [CrossRef] [Green Version]
  12. Kärenlampi, P.P. Stationary forestry with human interference. Sustainability 2018, 10, 3662. [Google Scholar] [CrossRef] [Green Version]
  13. Kärenlampi, P.P. The effect of empirical log yield observations on carbon storage economics. Forests 2020, 11, 1312. [Google Scholar] [CrossRef]
  14. Kärenlampi, P.P. Diversity of carbon storage economics in fertile boreal spruce (Picea Abies) estates. Sustainability 2021, 13, 560. [Google Scholar] [CrossRef]
  15. Leslie, A.J. A review of the concept of the normal forest. Aust. For. 1966, 30, 139–147. [Google Scholar] [CrossRef]
  16. Bollandsås, O.M.; Buongiorno, J.; Gobakken, T. Predicting the growth of stands of trees of mixed species and size: A matrix model for Norway. Scand. J. For. Res. 2008, 23, 167–178. [Google Scholar] [CrossRef]
  17. Vuokila, Y. Männyn kasvusta ja sen vaihteluista harventaen käsitellyissä ja luonnontilaisissa metsiköissä. 38 s., kuv. On growth and its variations in thinned and unthinned Scots pine stands. Comm. Inst. For. Fenn. 1960, 52, 7. [Google Scholar]
  18. Vuokila, Y.; Väliaho, H. Viljeltyjen havumetsiköiden kasvatusmallit. Growth and yield models for conifer cultures in Finland. Comm. Inst. For. Fenn. 1980, 99, 2. [Google Scholar]
  19. Vuokila, Y. Etelä-Suomen hoidettujen kuusikoiden kehityksestä. Viljeltyjen havumetsiköiden kasvatusmallit. On the development of managed spruce stands in Southern Finland. Comm. Inst. For. Fenn. 1956, 48, 1. [Google Scholar]
  20. Raulo, J. Development of dominant trees in Betula pendula Roth and Betula pubescens Ehrh. planta-tions. Seloste: Viljeltyjen raudus- ja hieskoivikoidenvaltapuiden kehitys. Commun. Inst. For. Fenn. 1977, 90, 4. [Google Scholar]
  21. Oikarinen, M. Etelä-Suomen viljeltyjen raudus-koivikoiden kasvatusmallit. Suumary: Growth andyield models for silver birch (Betula pendula) plantations in southern Finland. Commun. Inst. Fenn. 1983, 113, 75. [Google Scholar]
  22. Kärenlampi, P.P. Empirical observations of the yield of logs from trees of the boreal region. Balt. For. 2021. submitted 4 February. [Google Scholar]
  23. Mehtätalo, L. Valtakunnalliset puukohtaiset tukkivähennysmallit männylle, kuuselle, koivuille ja haavalle. Metsätieteen Aikakausk. 2002, 4, 575–591. [Google Scholar] [CrossRef] [Green Version]
  24. Laasasenaho, J. Taper curve and volume functions for pine, spruce and birch. Comm. Inst. For. Fenn. 1982, 108, 74. [Google Scholar]
  25. Parkatti, V.-P.; Assmuth, A.; Rämö, J.; Tahvonen, O. Economics of boreal conifer species in continuous cover and rotation forestry. For. Policy Econ. 2019, 100, 55–67. [Google Scholar] [CrossRef]
  26. Parkatti, V.-P.; Tahvonen, O. Optimizing continuous cover and rotation forestry in mixed-species boreal forests. Can. J. For. Res. 2020, 50, 1138–1151. [Google Scholar] [CrossRef]
  27. Nurminen, T.; Korpunen, H.; Uusitalo, J. Time consuming analysis of the mechanized cut-to-length harvesting system. Silva Fenn. 2006, 40, 335–363. [Google Scholar] [CrossRef] [Green Version]
  28. Kärenlampi, P.P. State-space approach to capital return in nonlinear growth processes. Agric. Financ. Rev. 2019, 79, 508–518. [Google Scholar] [CrossRef] [Green Version]
  29. Kärenlampi, P.P. Wealth accumulation in rotation forestry–Failure of the net present value optimization? PLoS ONE 2019, 14, e0222918. [Google Scholar] [CrossRef]
  30. Pressler, M.R. Aus der Holzzuwachlehre (zweiter Artikel). Allgemeine Forst und Jagd Zeitung, 1860, 36, 173. Translated by Löwenstein, W. and Wirkner, J.R. as “For the comprehension of net revenue silviculture and the management objectives derived thereof”. J. For. Econ. 1995, 1, 45–87. [Google Scholar]
  31. Speidel, G. Forstliche Betreibswirtschaftslehre, 2nd ed.; Paul Parey: Hamburg, Germany, 1967; 226p. (In German) [Google Scholar]
  32. Speidel, G. Planung in Forstbetrieb, 2nd ed.; Paul Parey: Hamburg, Germany, 1972; 270p. (In German) [Google Scholar]
  33. Woś, B.; Pietrzykowski, M. Simulation of birch and pine litter influence on early stage of reclaimed soil formation process under controlled conditions. J. Environ. Qual. 2015, 44, 1091–1098. [Google Scholar] [CrossRef]
  34. Augusto, L.; De Schrijver, A.; Vesterdal, L.; Smolander, A.; Prescott, C.; Ranger, J. Influences of evergreen gymnosperm and deciduous angiosperm tree species on the functioning of temperate and boreal forests. Biol. Rev. Camb. Philos. Soc. 2015, 90, 444–466. [Google Scholar] [CrossRef]
  35. Kohnle, U. Spruce and Climate Change—What Is to Be Done? 2015. Available online: www.waldwissen.net (accessed on 9 June 2021).
  36. Seidl, R.; Thom, D.; Kautz, M.; Martin-Benito, D.; Peltoniemi, M.; Vacchiano, G.; Wild, J.; Ascoli, D.; Petr, M.; Honkaniemi, J.; et al. Forest disturbances under climate change. Nat. Clim. Chang. 2017, 7, 395–402. [Google Scholar] [CrossRef] [PubMed] [Green Version]
  37. Felton, A.; Petersson, L.; Nilsson, O.; Witzell, J.; Cleary, M.; Felton, M.; Björkman, C.; Sang, Å.O.; Jonsell, M.; Holmström, E.; et al. The tree species matters: Biodiversity and ecosystem service implications of replacing Scots pine production stands with Norway spruce. Ambio 2020, 49, 1035–1049. [Google Scholar] [CrossRef] [Green Version]
  38. Tilastopalvelu. Available online: https://www.luke.fi/avoin-tieto/tilastopalvelu/ (accessed on 9 June 2021).
  39. Bouchaud, J.-P.; Potters, M. Théorie des Risques Financiers; Commissariat à l’Energie Atomique: Paris, France, 1997. [Google Scholar]
  40. Theory of Financial Risk: From Data Analysis to Risk Management. Available online: http://web.math.ku.dk/~rolf/Klaus/bouchaud-book.ps.pdf (accessed on 9 June 2021).
  41. Brealey, R.A.; Myers, S.C.; Allen, F. Principles of Corporate Finance, 10th ed.; McGraw-Hill Irwin: New York, NY, USA, 2011. [Google Scholar]
Figure 1. Accumulated expected value of capital return rate for three tree species and three initial stem counts, as a function of rotation age. The capital return rate becomes temporarily reduced after any thinning because of a reduction of timber gain in hypothetical clearcut.
Sustainability 13 06675 g001
Figure 2. Evolving stem counts for three tree species and three initial stem counts, as a function of stand age.
Sustainability 13 06675 g002
Figure 3. Total commercial volume, as well as the volume of sawlogs on spruce and pine stands and plywood logs for birch stands for three initial stem counts, as a function of stand age.
Sustainability 13 06675 g003aSustainability 13 06675 g003b
Figure 4. Accumulated expected value of commercial volume for three tree species and three initial stem counts, as a function of rotation age.
Sustainability 13 06675 g004
Figure 5. Accumulated expected value of capital return rate for three tree species and three initial stem counts, as a function of rotation age. However, Pinus sylvestris growth parameters have been applied for the birch species.
Sustainability 13 06675 g005
Figure 6. Accumulated expected value of capital return rate for three tree species and three initial stem counts, as a function of rotation age, without any commercial thinning. Pinus sylvestris growth parameters have been applied for the birch species.
Sustainability 13 06675 g006
Figure 7. Accumulated expected value of commercial volume for three tree species and three initial stem counts, as a function of rotation age, without any commercial thinning. Pinus sylvestris growth parameters have been applied for the birch species.
Sustainability 13 06675 g007
Figure 8. Accumulated expected value of capital return rate for three tree species and three initial stem counts, as a function of rotation age. Regeneration expense has been reduced by 500 Eur/ha, in comparison with Figure 1. Pinus sylvestris growth parameters have been applied for the birch species.
Sustainability 13 06675 g008
Figure 9. Accumulated expected value of capital return rate for three tree species and three initial stem counts, without any commercial thinning. Regeneration expense has been reduced by 500 Eur/ha in comparison with Figure 6. Pinus sylvestris growth parameters have been applied for the birch species.
Sustainability 13 06675 g009
Figure 10. Capital return rate deficiency per excess commercial volume unit for three tree species and three initial stem counts, as a function of rotation age. Pinus sylvestris growth parameters have been applied for the birch species.
Sustainability 13 06675 g010
Figure 11. Capital return rate deficiency per excess commercial volume unit for three tree species and three initial stem counts, as a function of rotation age, without any commercial thinning. Pinus sylvestris growth parameters have been applied for the birch species.
Sustainability 13 06675 g011
Figure 12. Commercial volume and stem count where thinnings are triggered. Observations are in accordance with Figure 8. Thinnings implemented on the same stand are connected. The first thinning is always implemented at the highest stem count.
Sustainability 13 06675 g012
Figure 13. Harvested commercial volume as a function of harvested stem count in thinnings. Observations are in accordance with Figure 8. Thinnings implemented on the same stand are connected. The first thinning always harvests the greatest stem count.
Sustainability 13 06675 g013
Figure 14. Harvested sawlog or plywood log content as a function of harvested commercial volume in clearcutting. Observations are in accordance with Figure 8.
Sustainability 13 06675 g014
Figure 15. Harvested sawlog or plywood log content as a function of harvested commercial volume in clearcutting in the absence of any commercial thinning. Observations are in accordance with Figure 9.
Sustainability 13 06675 g015
Publisher’s Note: MDPI stays neutral with regard to jurisdictional claims in published maps and institutional affiliations.