Review

An Australian Perspective on Local Government Investment in Electric Vehicle Charging Infrastructure

1
Institute for Sustainable Futures, University of Technology Sydney, P.O. Box 123, Broadway, NSW 2007, Australia
2
Lake Macquarie City Council, Hunter Regional Mail Centre, P.O. Box 1906, Warabrook, NSW 2310, Australia
*
Author to whom correspondence should be addressed.
Sustainability 2021, 13(12), 6590; https://doi.org/10.3390/su13126590
Submission received: 13 April 2021 / Revised: 1 June 2021 / Accepted: 3 June 2021 / Published: 9 June 2021

Abstract

:
Electric vehicle (EV) adoption is growing worldwide with increasing market pull from consumers and market push from manufacturers of vehicles and charging equipment, as well as others in the supply chain. Governments have begun developing policies to support EV uptake and local governments, in particular, are examining what role they should play. In Australia, a large country with low population density, EV uptake has been slower in comparison to other similar economies. This paper discusses the status of EV charging infrastructure deployment in Australia with regards to local governments, by considering the extent to which they are relied upon for the deployment of such technology and what motivates them to act. It also covers the work undertaken by the authors with one local government in developing an EV charging infrastructure business model that will help the local community adopt and benefit from EVs. An applied use of the business canvas methodology adapted to suit local government interests is presented to assess the risks and benefits that different business models offer. The paper offers insights into the strategic and pragmatic responsibilities local governments balance in seeking to expand the EV charging infrastructure in their jurisdiction.

1. Introduction

1.1. Global EV Context

The transport sector is a major source of global greenhouse gas (GHG) emissions. It was responsible for 25% of global carbon emissions in 2018 with steady increases in recent decades [1]. Transport plays an important role in society, facilitating work, education, leisure pursuits, the transportation of goods, and the provision of services. However, carbon dioxide emissions arising from human activities and the accompanying adverse impact on the environment has led to the realisation that all elements of the economy must be rapidly decarbonised.
Transport is now undergoing a global paradigm shift as the global automotive industry moves towards an electric, decarbonised future. Passenger vehicles are at the forefront of this change as governments, automotive manufacturers, energy utilities, and technology providers look to understand what roles they will need to play.

1.2. The Australian Context

Transport is Australia’s third-largest source of GHG emissions (18.9% of total), and these have been increasing more quickly than any other sector over the last three decades [2]. Over half of this is contributed by cars, of which Australia has a particularly high dependency [3]. Australia’s average emissions intensity for passenger vehicles is also higher than that of other similar advanced economies (48% higher than Japan, 41% higher than Europe, and 16% higher than the United States), due to various factors such as consumer preferences and weaker policy drivers for low emission vehicles [4]. Therefore, electrifying the Australian passenger vehicle fleet is critical for reducing the country’s carbon emissions from transport and overall. It could also help Australia capitalise on other associated benefits, including improved local air quality, less reliance on imported fuels, support a greater share of renewables on the grid, and lower fuel costs for consumers. However, the electrification of transport in Australia faces both generic and specific challenges posed by the country’s geography, population, demographics, and structure of its political system.
Australia is a large country with a relatively small population. At 7.7 million km2, it is the sixth-largest country in the world [5,6]. However, with only 23.5 million citizens (compared to 1.4 billion in China or 333 million in the United States), population density is low compared to other large countries. A large majority of Australia’s population also reside in urban areas (86.1%), mostly in cities or towns along the East coast [7].

1.3. Australia and Electric Vehicles

In a 2019 consumer survey, over half a million Australians said that they intended to buy an electric vehicle EV within the next four years [8]. Despite such positive consumer attitudes, fewer than 7000 plug-in EVs were sold in 2019 [9] out of 1.15 million new car sales [10]. This equates to only 0.6% of new car sales in 2019 being electric. This represents a low uptake of EVs when compared with other countries with whom it typically compares in terms of population, economy, or standard of living (as summarised in Table 1).
Australia also lags on several other metrics in terms of the provision of infrastructure for EV charging. Figure 1 shows there are 11,039 people per public charger in Australia compared with 397 people per public charger in Norway, a global leader in the electrification of its passenger vehicle fleet. Canada—which has a similar land mass and population density to Australia—has 3056 people per public charger.
As shown in Figure 2, Australia has seven EVs per public charge point, the same as Canada, which has a similar landmass to Australia. Although they have a similar ratio of EVs to EV chargers, Canada has substantially more plug-in electric vehicles in its fleet than Australia (82,756 compared to 16,275), more public chargers (12,333 compared to 2307), and a higher percentage of its fleet are electric plug-in (0.23% compared with 0.08%).
In terms of landmass, Australia is the world’s sixth-largest country, Canada is the fourth largest, while the USA and China are the third- and second-largest, respectively. The number of square kilometres per public charge point (Figure 3) in Australia is 3356 km2, compared with Canada at 810 km2 and the USA at 143 km2.
While Canadian EV drivers must share the same number of public EV chargers as their Australian counterparts, they will have substantially less distance to travel to find one.
These metrics reflect the very real geographic and population challenges that Australia must overcome to decarbonise its transport. In addition, it must address the other well-documented barriers that exist for EV adoption, such as those relating to the techno-economic (e.g., range and price) and non-technical (e.g., consumer-related, regulation, and policy) categories [28,29,30]. Of all the countries featured in the analysis, Canada appears to be most similar to Australia (notwithstanding political context) and so could be a useful point of reference for Australian policymakers to study.

1.4. The Role of Local Government in Australia

Australia is divided into 537 local government areas (LGAs), known as “local councils”. Local councils represent the third tier of government and vary widely in geographical size and population, and therefore resources. They have key responsibilities related to the local road infrastructure, local environmental amenity, and ensuring local communities thrive, including being responsible for the planning, development, and maintenance of local transport infrastructure such as roads and car parking [31]. While some are currently trialling and testing approaches to deploying EV charging infrastructure and electric fleets, most are yet to publish their strategies. With such a critical role in road transport infrastructure, the support of local councils is needed to make EVs a viable choice for consumers.

1.5. The Challenge

While both consumer awareness and choice of EVs is expanding, EV penetration will be dependent upon the necessary charging infrastructure keeping pace. Local governments have a key role to play in this.
This paper applies the morphological box approach for designing EV business models developed by Kley et al. [32], to a local government context, illustrated by a case study of Lake Macquarie City Council. It begins by providing a brief literature review, followed by a description of the methodology and resultant business models. Finally, in the analysis, how this approach can help other local councils to develop their EV strategies and business models is outlined, while practical insights to policymakers, particularly related to the regulatory constraints and opportunities posed to local governments seeking to deploy EV infrastructure, are also provided.

2. Literature Review

2.1. The Australian Case

Despite the challenges discussed in the previous section, widespread EV adoption in Australia is feasible based on commuting patterns and EV charging requirements and capabilities [33]. However, there is a lack of consistent and coherent incentives or policy support for consumers or businesses in Australia at the federal or state level, for either electric vehicles or charging infrastructure. This is despite significant GHG emission reductions for road transport being found to be possible through electrification of this sector [34,35,36]. We identified five types of support mechanisms present that can support the adoption of EVs in Australia (see Table 2). At the state and territory level, the Australian Capital Territory, Queensland, and Victoria have dedicated mechanisms for EVs with stamp duty waivers available in all three states. Victoria has also recently introduced a limited subsidy for new purchases of EVs, although the state has also announced a new road tax specifically aimed at EVs ($0.025 per km for fully electric vehicles and $0.020 for plug-in hybrids). New South Wales (NSW) and Victoria both have reduced motor vehicle tax/registration rates for lower emission vehicles, under which EVs qualify. Two schemes were found to exist at the local government level, both in state capitals: the City of Sydney (NSW) offers discounted parking permits for lower emission vehicles (which EVs qualify for), while the City of Adelaide (South Australia) offers a rebate for EV charge points. This latter scheme is unique in that it is targeted at the charging equipment and scaled towards larger subsidies for more sophisticated technology (i.e., that capable of bi-directional charging or demand management functionality).

2.2. The Role of Government

All levels of government have acknowledged the important role EVs have to play and have published (or they have publicly announced that they plan to publish) EV strategies. The Federal Government has published a single page factsheet relating to what it says is its EV strategy while more recently announcing a discussion paper on its Future Fuels Strategy. Six states/territories out of a total of eight have now published a dedicated EV/e-mobility strategy. For local government, broader transport or mobility strategies are common and some do refer to EVs or low emission vehicles and actions to support them. Table 2 presents a summary of the relevant EV strategies and support mechanisms for different levels of government in Australia.

2.3. Business Models

Business models are essential for councils to consider for the successful deployment of EV charging infrastructure. A business model can be defined as a representation of how organisations create value that they share with their customers [44,45,46]. The EV industry is at an early stage of development and is likely to continue to evolve quickly and unexpectedly over the coming years. Other studies have reported on the types of business models relevant for EV charging [30,46,47,48]. While there are many emerging business model options, stakeholders are unsure of what business models are most effective and profitable [32]. Specific business models and approaches for councils do not readily appear in the literature, and, while there are various examples of local governments around the world leading the deployment of EV charging infrastructure (e.g., City of Amsterdam and Adelaide City Council), the business models are not always transparent or obvious.
Multiple risks exist for local government concerning charging networks due to high initial investment costs, revenue uncertainty, electricity tariffs and peak capacity contracts, and the involvement of multiple stakeholders. An agile approach to refining a business model, while future-proofing any choice of technology or platform, will be needed if they are to have a role in the deployment of EV infrastructure in Australia.

2.4. The Case Study

Lake Macquarie is a two-hour drive north of Sydney. The jurisdictional area of the local council covers 648 km2 and the city has a unique geography that strings together communities around nine town centres, circling the lake by which it gets its name. The area is a popular place for retirees and young families, and those looking for a “tree-change” or “sea-change” away from the hustle and bustle of the city. The community of Lake Macquarie is concentrated on the eastern side of the lake and this area is recognised as having high residential amenity and liveability. Two north–south highways (east and west of the lake) are important state road corridors for supporting the local economy.
Lake Macquarie residents travel primarily by private motor vehicle, covering an average distance of 38.2 km per day. The highest proportions of travel per person per day in Lake Macquarie are social/recreational (20% at 7.6 km) and commuting purposes (19% at 7.3 km), followed by shopping and work-related business (16% at 6.1 km each). The proportion of trips conducted by private motor vehicles is high at approximately 90% [49].
Lake Macquarie City Council initiated the development of an EV Charging Infrastructure Strategy with an outline of the basic principles for infrastructure deployment for its region. To support this initiative, it sought support from this paper’s authors to understand technical specifications and business models within a local council context.

3. Methodology

3.1. Overall Methodology

There were four main stages to the approach for developing an EV charging business model with the Council as part of its EV strategy development, as shown in Figure 4. A literature review initially assessed the EV and charging infrastructure market in the local, national, and international contexts. This also examined strategic policy frameworks, planning guidelines and regulations, electricity network constraints, business models, and case studies. The second step was to examine the potential business model characteristics and design possibilities that exist for a council. Thirdly, priority business models were developed using the business model canvas. Finally, a business case was co-developed with the Council to understand whether the prioritised business models could be financially viable. A staged series of stakeholder engagements also occurred throughout the research to define the challenges and risks for local councils, helping them understand what was feasible in their specific region. This included a regional forum that brought together multiple councils from the surrounding regions, a visioning workshop with a multidisciplinary group of stakeholders working within the council, bilateral interviews with industry, and a business model workshop with a core group of stakeholders from within Lake Macquarie City Council.
The following section focuses on the business model component of the research methodology, Steps 2 and 3, which is the focus of this paper.

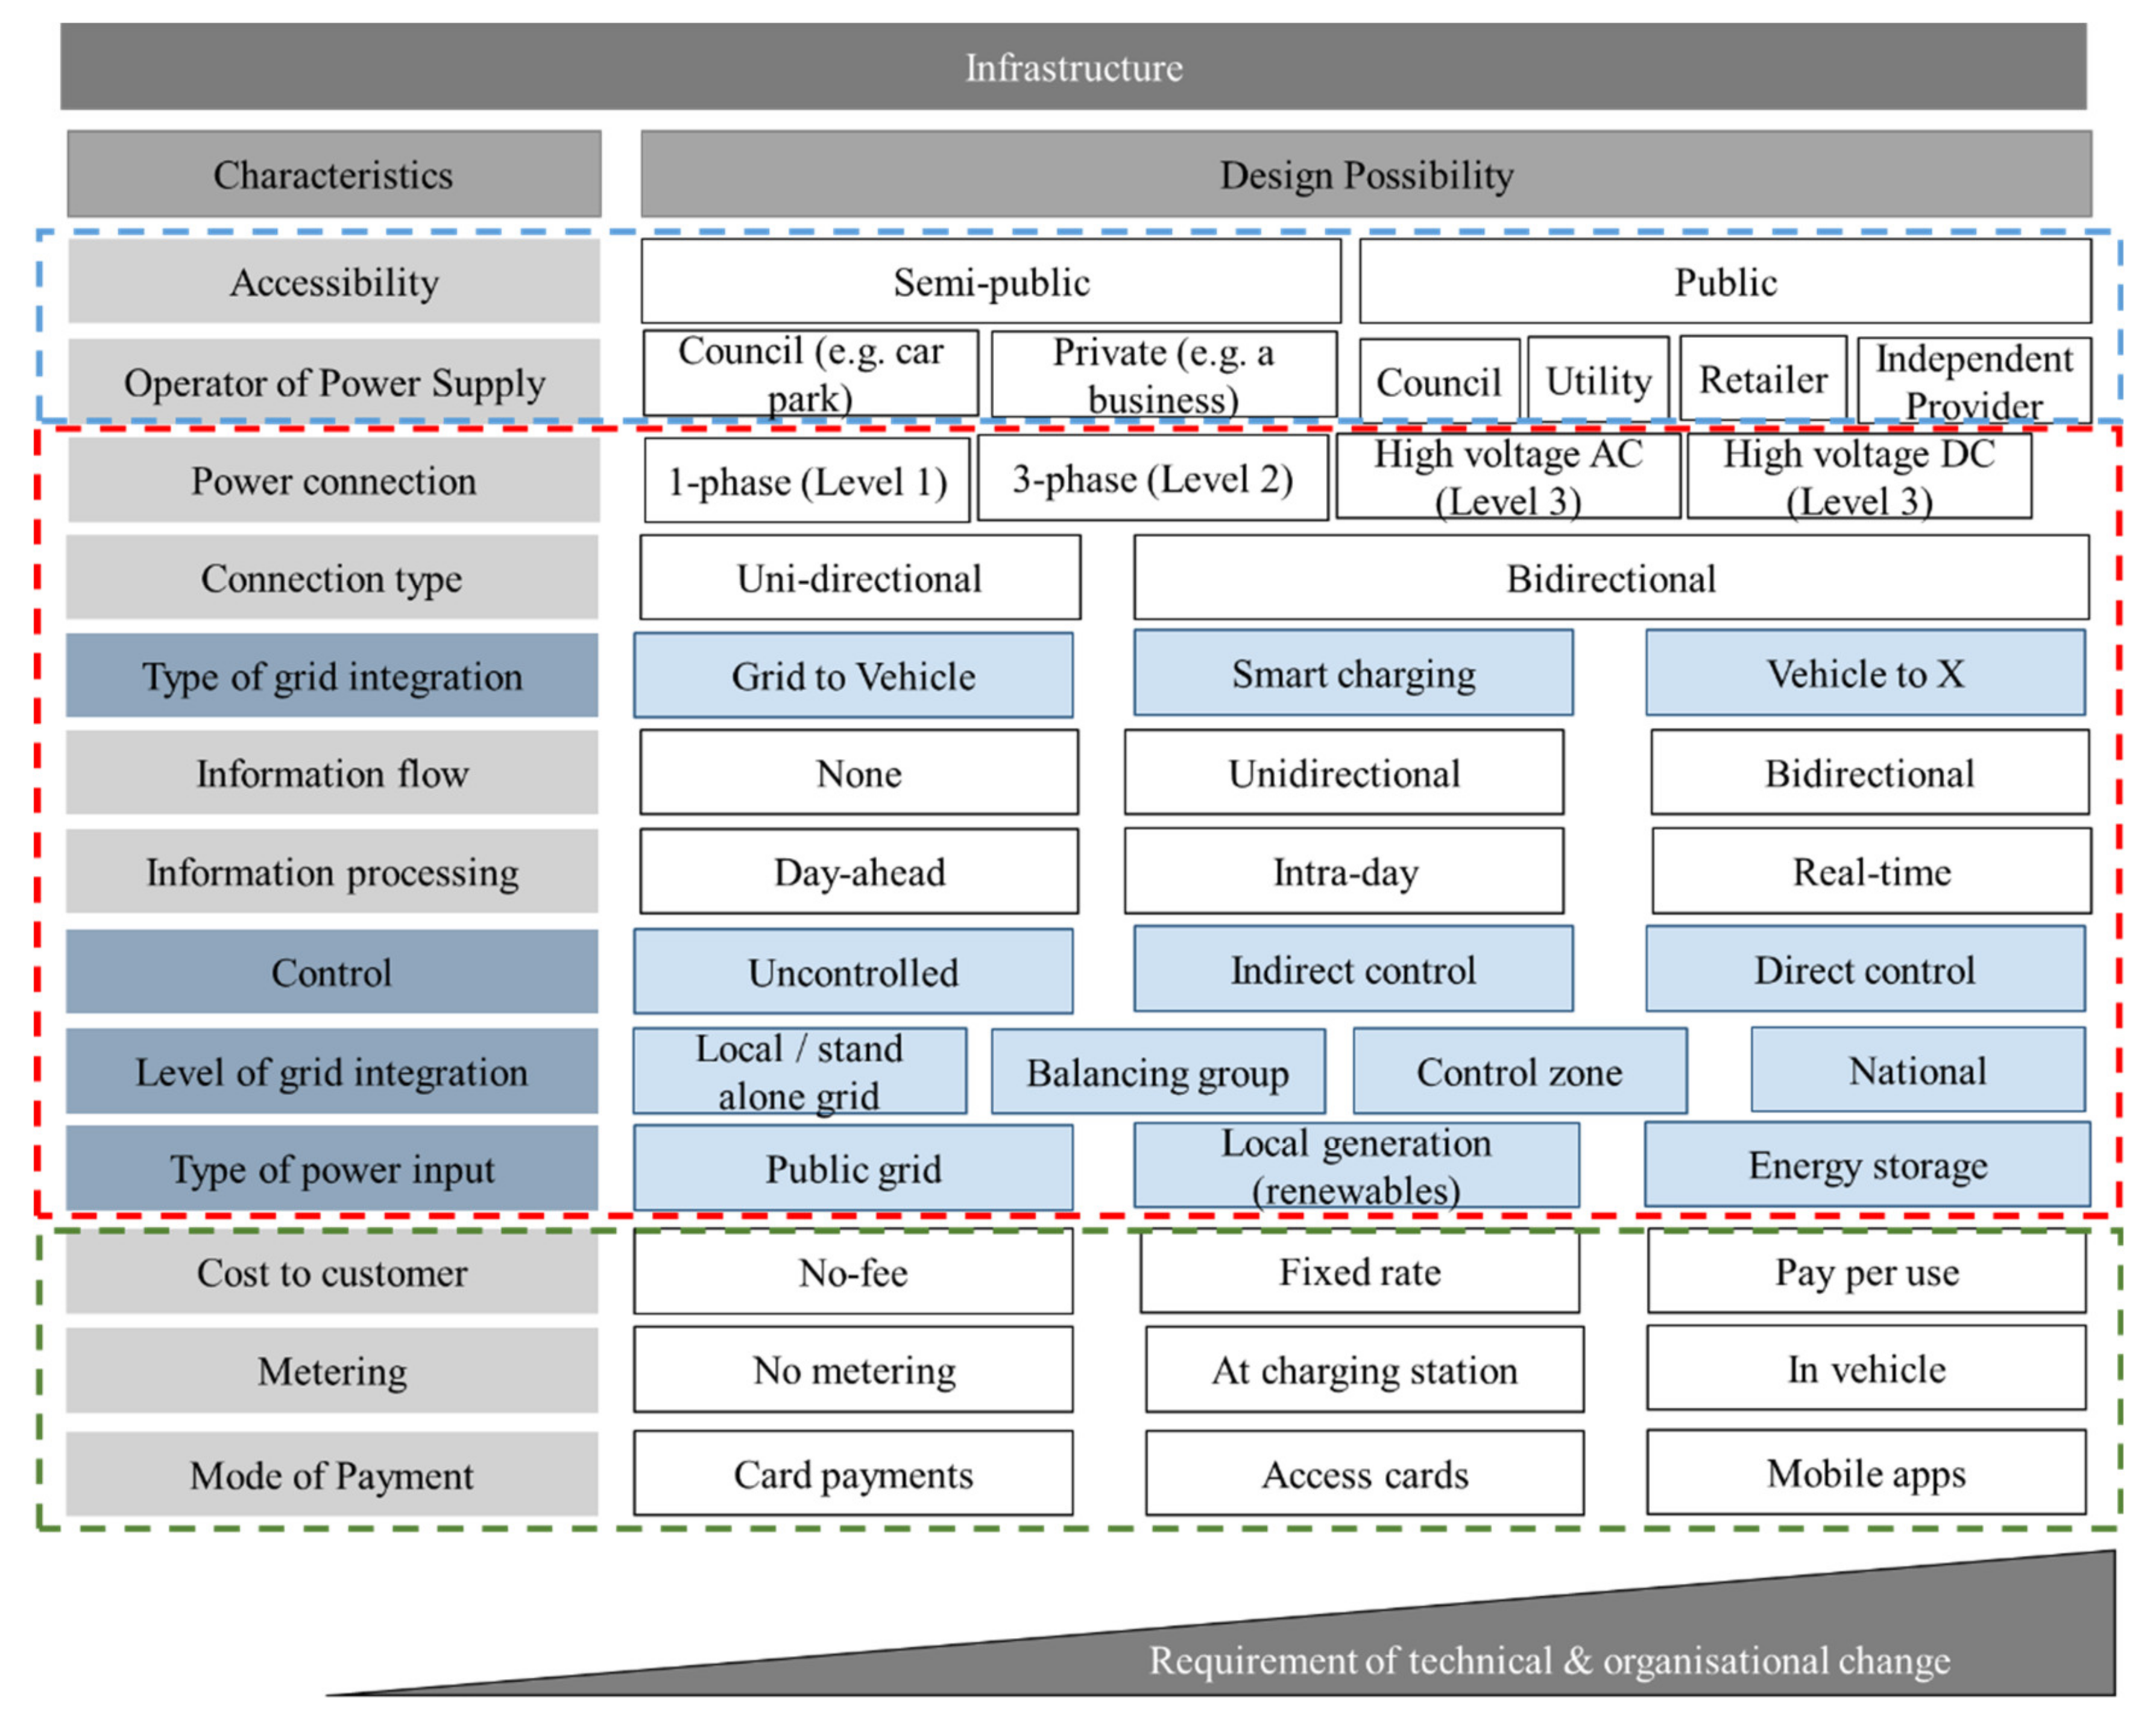
3.2. Business Model Characteristics and Design Possibilities

A methodology based on Kley et al.’s morphology of EV charging business models was developed. To ensure the needs of the local council were met, the morphological box used for systematically describing business models was adapted for EV infrastructure deployment. The design possibilities show what options could theoretically be chosen by a local council in choosing its priority business model. The adapted box is shown in Figure 5.
The key differences between the versions developed by Kley et al. are shown in the lighter blue shaded boxes. These were adapted or added based on discussions with the Council to reflect the business model choices they were in a position to make. The three key adaptions made to the Kley et al. morphological boxes were:
  • Business model decisions from the morphological boxes on infrastructure and system services were combined into a single box.
  • The design possibilities were re-arranged in a different order to structure this around three key questions the Council had regarding their business models.
  • Some design possibilities were added or amended to be more relevant for a local council and the business model design decisions they were contemplating.
The characteristics were divided into three categories of a problem tree to simplify and structure the co-design and engagement process with Lake Macquarie City Council. These were segmented as:
  • Accessibility, ownership, and operation (blue box).
  • Grid interaction, data, and control (red box).
  • Finance and transactions (green box).
These categories are determined by the key decisions a council would have to take on location, technology, and economics, respectively. The following section describes these questions and potential responses based on existing business models with specific relevance for local councils.

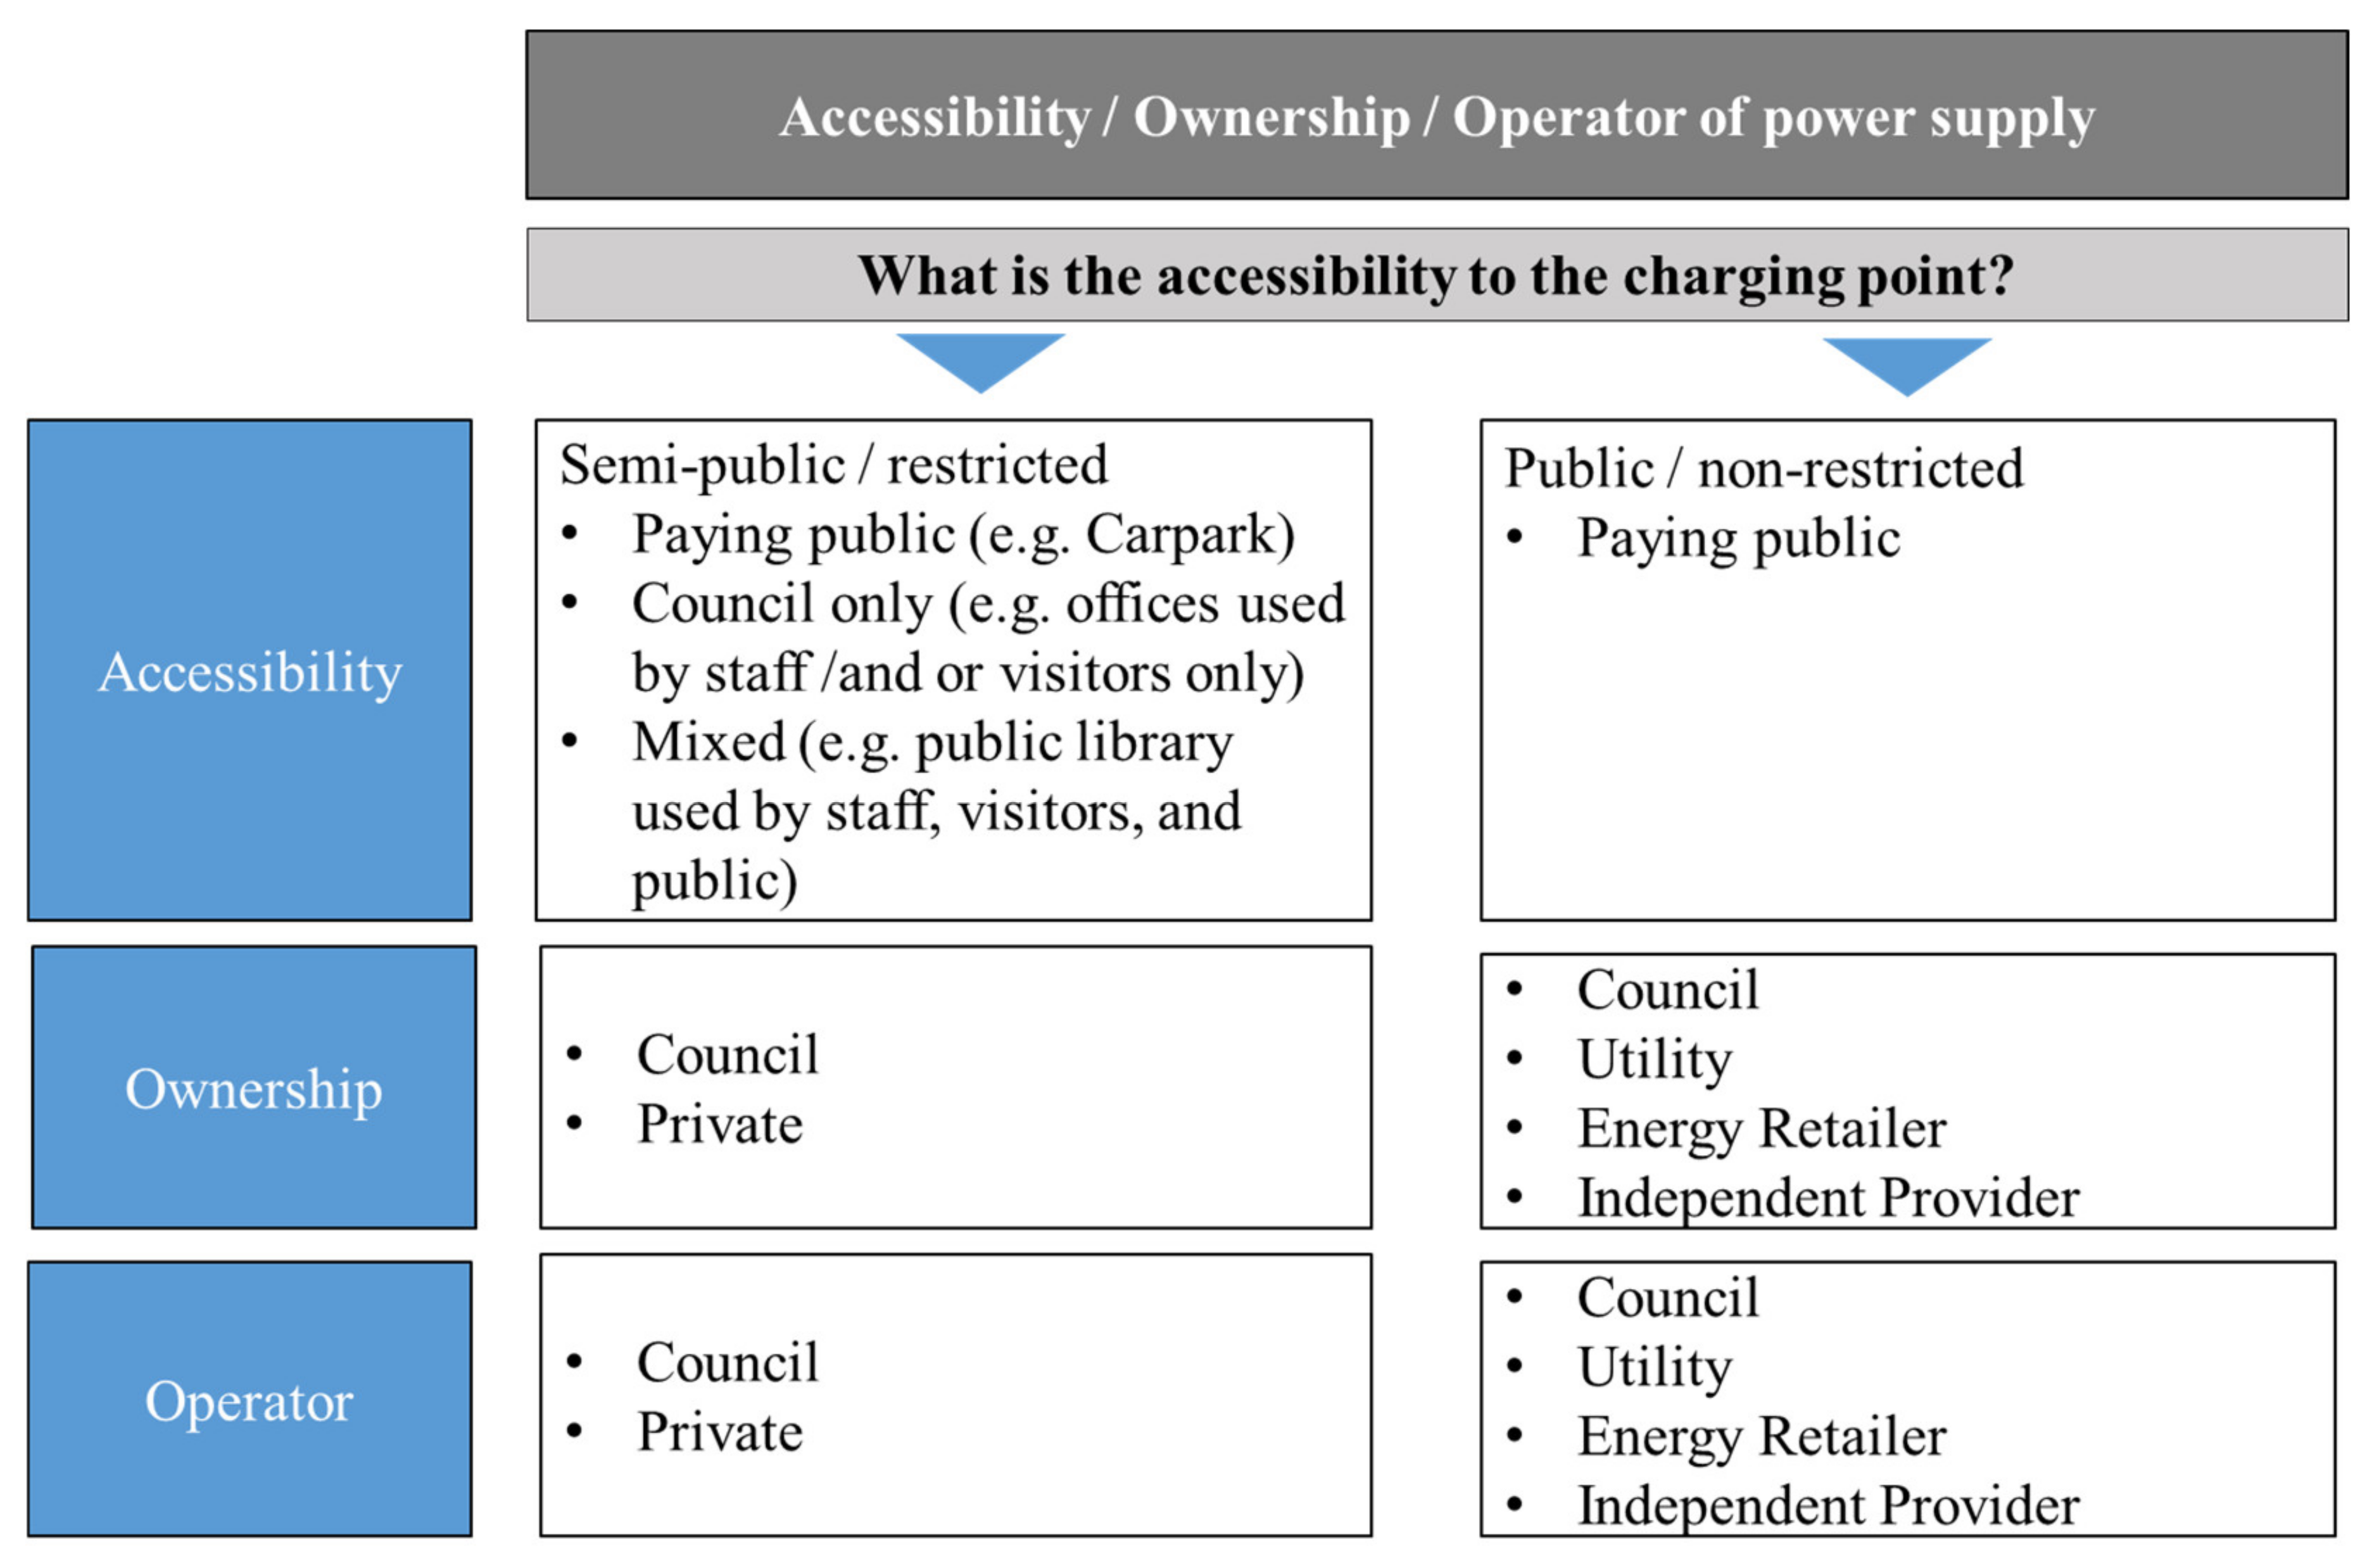
3.2.1. Accessibility, Ownership, and Operation

The type of location, how it should be accessed, and who should own and operate the EV charging infrastructure were among the first decisions that a council is required to make. These design choices are shown in Figure 6 and they relate to the broader question of what accessibility to the charging point is desired. The implications of these decisions are far-ranging on the business model, especially for ownership. For example, changing the EV charging infrastructure ownership from “council-owned” to “owned by a third party” creates an entirely different business model with implications for the other business model choices that can be made. As a result, ownership in part was used as the main defining characteristic between the business models being differentiated as part of this process.
Business models with “semi-public” (e.g., patrons of business premises) or “public” access (e.g., on-street access) were found to be most relevant for the council. “Semi-public” access refers to those charging points placed in locations where access is restricted by purpose or invitation. These would include employer car parks, shopping centre car parks, or hotel parking where only employees, shoppers, or hotel guests would be allowed access. In these cases, the charging facility (whether paid or free to customers) is offered as an added incentive or privilege. This opens up additional possibilities for additional revenue streams and for partnerships with other interested parties who might invest capital for charger deployment.
Where defined as “public”, these chargers offer no restrictions to EV drivers who want to use them. The public accessibility does not limit the financial model, and these chargers could be free to use or be a paid service. This would include chargers in public or council car parks (swimming pools, community centres, etc.), on-street parking, parking at popular tourist destinations, or as independent charging or service stations along key routes. Parties involved in the provision and management of the chargers may include the councils, energy utilities, third-party providers, or independent businesses.
Where charge points are located in private access car parks, for example, those where only utility vehicles (such as council maintenance vans or refuse collection vehicles) have access, it would be classified as “private” access.

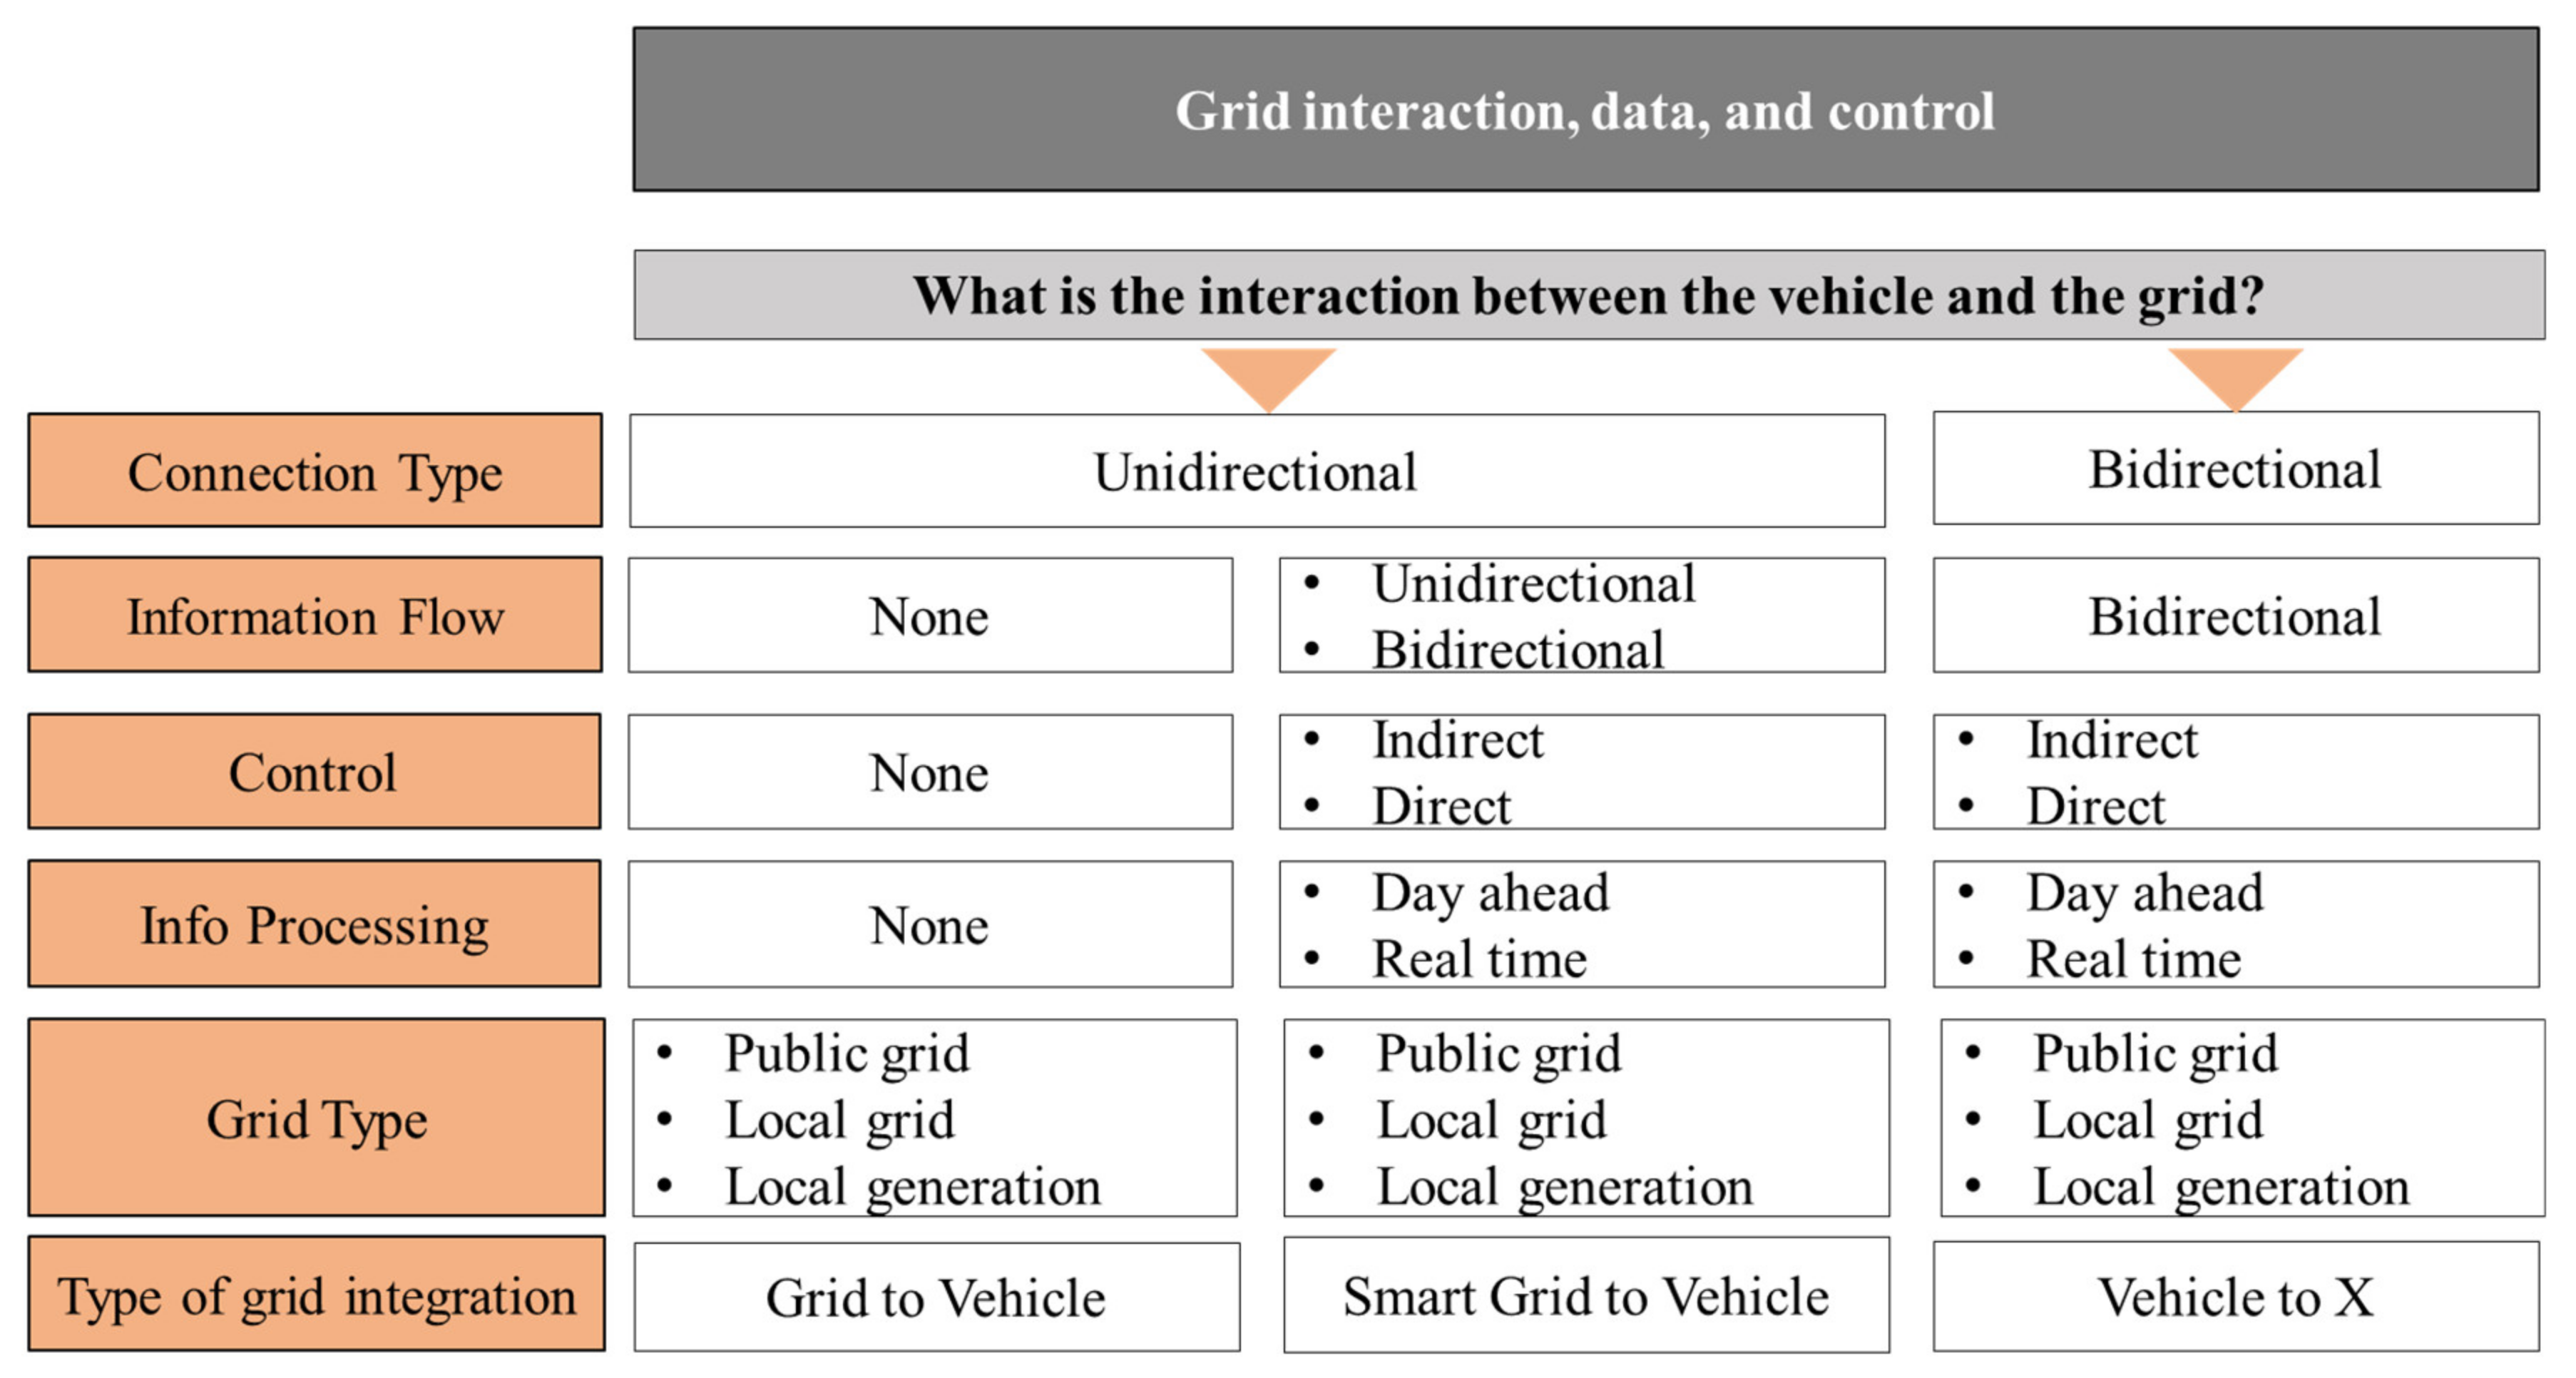
3.2.2. Grid Interaction, Data, and Control

The EV business model characteristic for grid interaction, data, and control are shown in Figure 7. These options are relevant for defining the different services that could be offered to the vehicle and the grid by the charging stations. This includes details on the type of connection and how it is controlled, as well as how data and information are used. Several key points to note are:
  • The type of connection can be “unidirectional” (delivers power in one direction) or “bidirectional” (transmits electricity in both directions), necessary to access services such as load-shifting or back-feeding electricity into the grid.
  • The information and communication could be unidirectional, where control is based on grid or vehicle data, or bidirectional, which allows both grid and vehicle to be integrated into controlling the charging process.
  • Information can be processed in different time intervals from day-ahead planning to a real-time connection, allowing an immediate modification of the charging profile.
  • Indirect control of charging processes can be via a price signal while direct control allows switching signals to be sent to the battery in the vehicle. In practice, a combination of both could be used.
Uncontrolled charging and the lack of communication interfaces corresponds to the case without services.

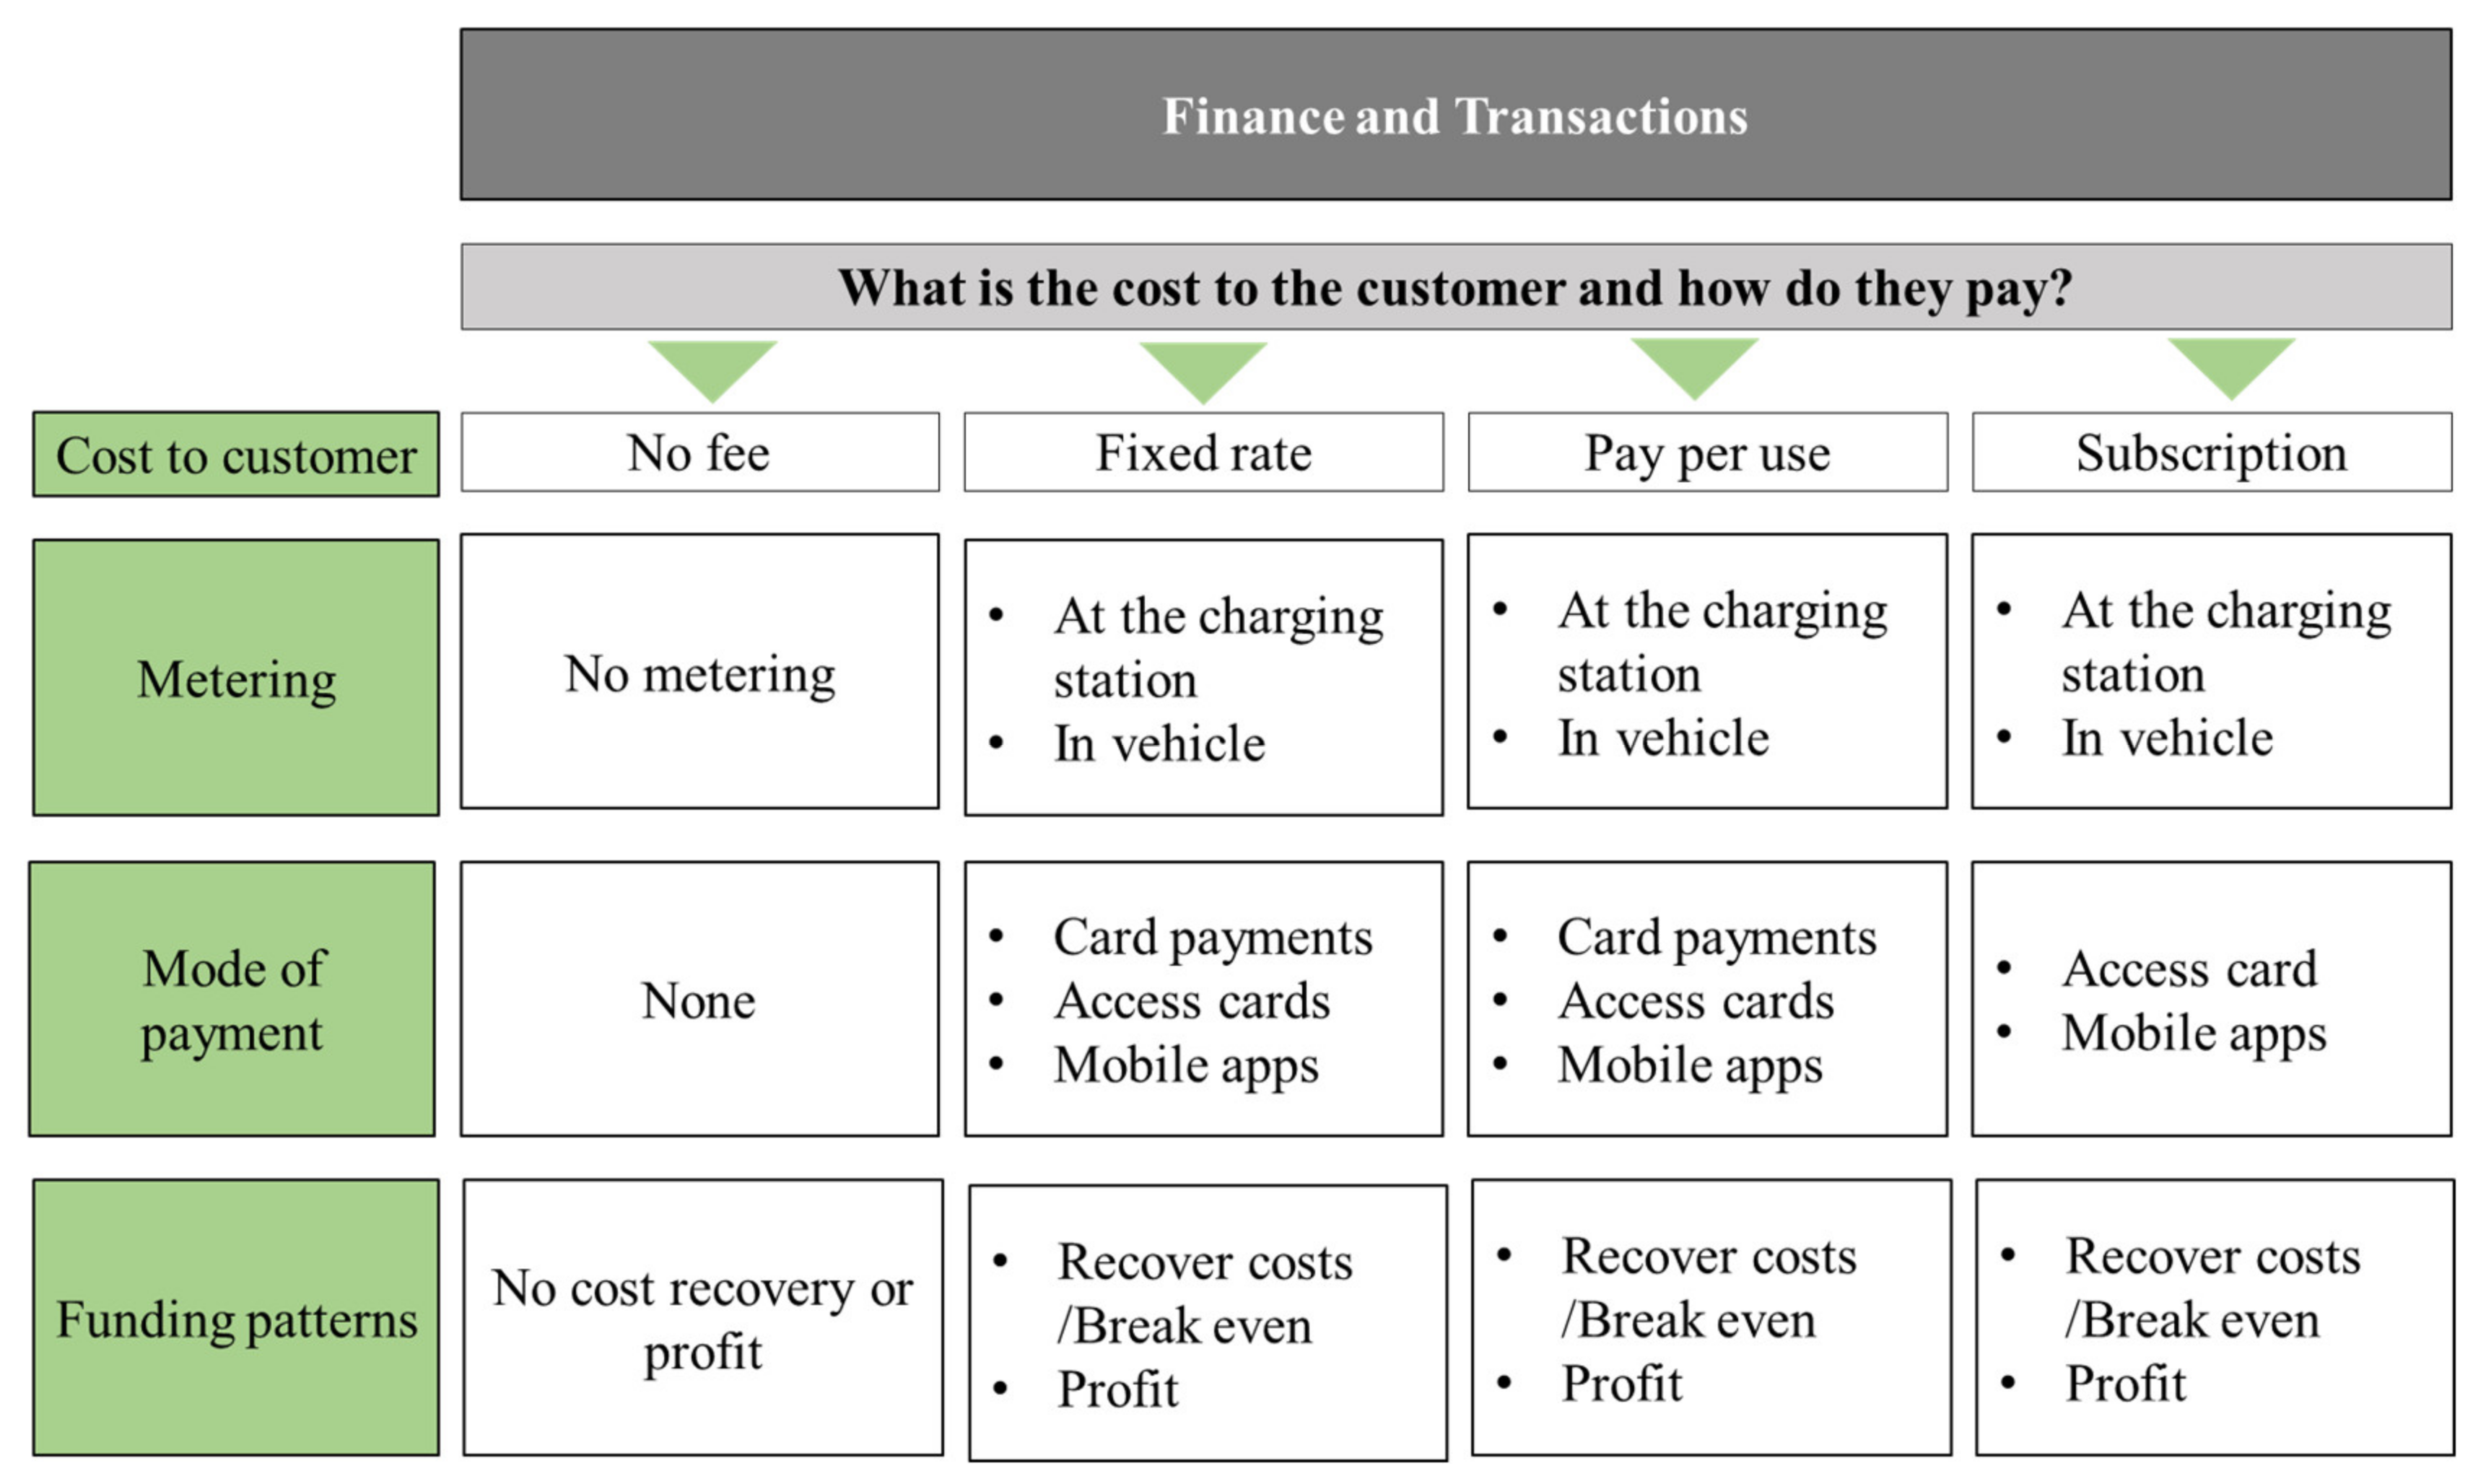
3.2.3. Finance and Transaction

Figure 8 describes the finance and transaction business model characteristic options, which are crucial decisions for councils that wish to build a sustainable business case. It is an important characteristic of the business model as this enables the capture of revenue that is an essential part of the business case for a council that wants to pursue EV charging infrastructure deployment.
Decisions here allocate responsibility for transaction management, define how much the EV owner charging their vehicle pays, how the transaction occurs, and the transactional technology required. Irrespective of how the model is managed, there is a choice to pass on none, some, or all of the cost to the customer. A paid plan could be on a pay per use model, a fixed-rate scheme, or a subscription model. Multiple modes of payment exist, including credit cards, dedicated access cards, existing public transport passes, mobile phone apps, and QR codes. All payment models typically require a metering system to be installed in the vehicle, the charging station, or both. Besides the council, key roles can be played by:
  • Retail operators: This may include shopping centres, hotels, service stations, car manufactures/dealers, etc.
  • Energy utilities: In the Australian context, the energy utility can be either energy retailers or distribution network service providers.
  • Third parties: These may include independent charging station providers, charging infrastructure manufactures, or other interested parties.
Both councils and energy utilities in Europe and the United States have adopted multiple partnership models to share installation and management responsibilities with retail and third-party operators.

3.3. Defining the Business Model Options

3.3.1. Business Model Type Classification

Six types of EV charging infrastructure business model suitable for councils were identified from the research. These were divided into two broad groups based on the accessibility offered to end-users:
  • Public access—where the charging station is available to all to use. These are typically offered to the general public to use by councils, motoring organisations, and energy utilities. The cost to the customer varies from being free, to pay per use, subscription/membership fees, or a combination of them. Subtypes were classified as:
    a.
    Government-owned.
    b.
    Third party-owned.
    c.
    Energy utility-owned.
  • Semi-public access—where the use of the charging station is restricted to a set of users. For example, the service is offered to members of a particular EV charging network, owners of certain brands of vehicles, guests visiting certain hotels, or customers visiting certain businesses. From the end customer perspective, these services may be provided for free or different charge models might be offered. Subtypes were classified as:
    a.
    Membership-based.
    b.
    Guest and visitor servicing.
    c.
    Business self-funded.
Table 3 contains a list of examples for different public access business models and [50,51,52,53,54,55], while Table 4 contains those of semi-public access examples.

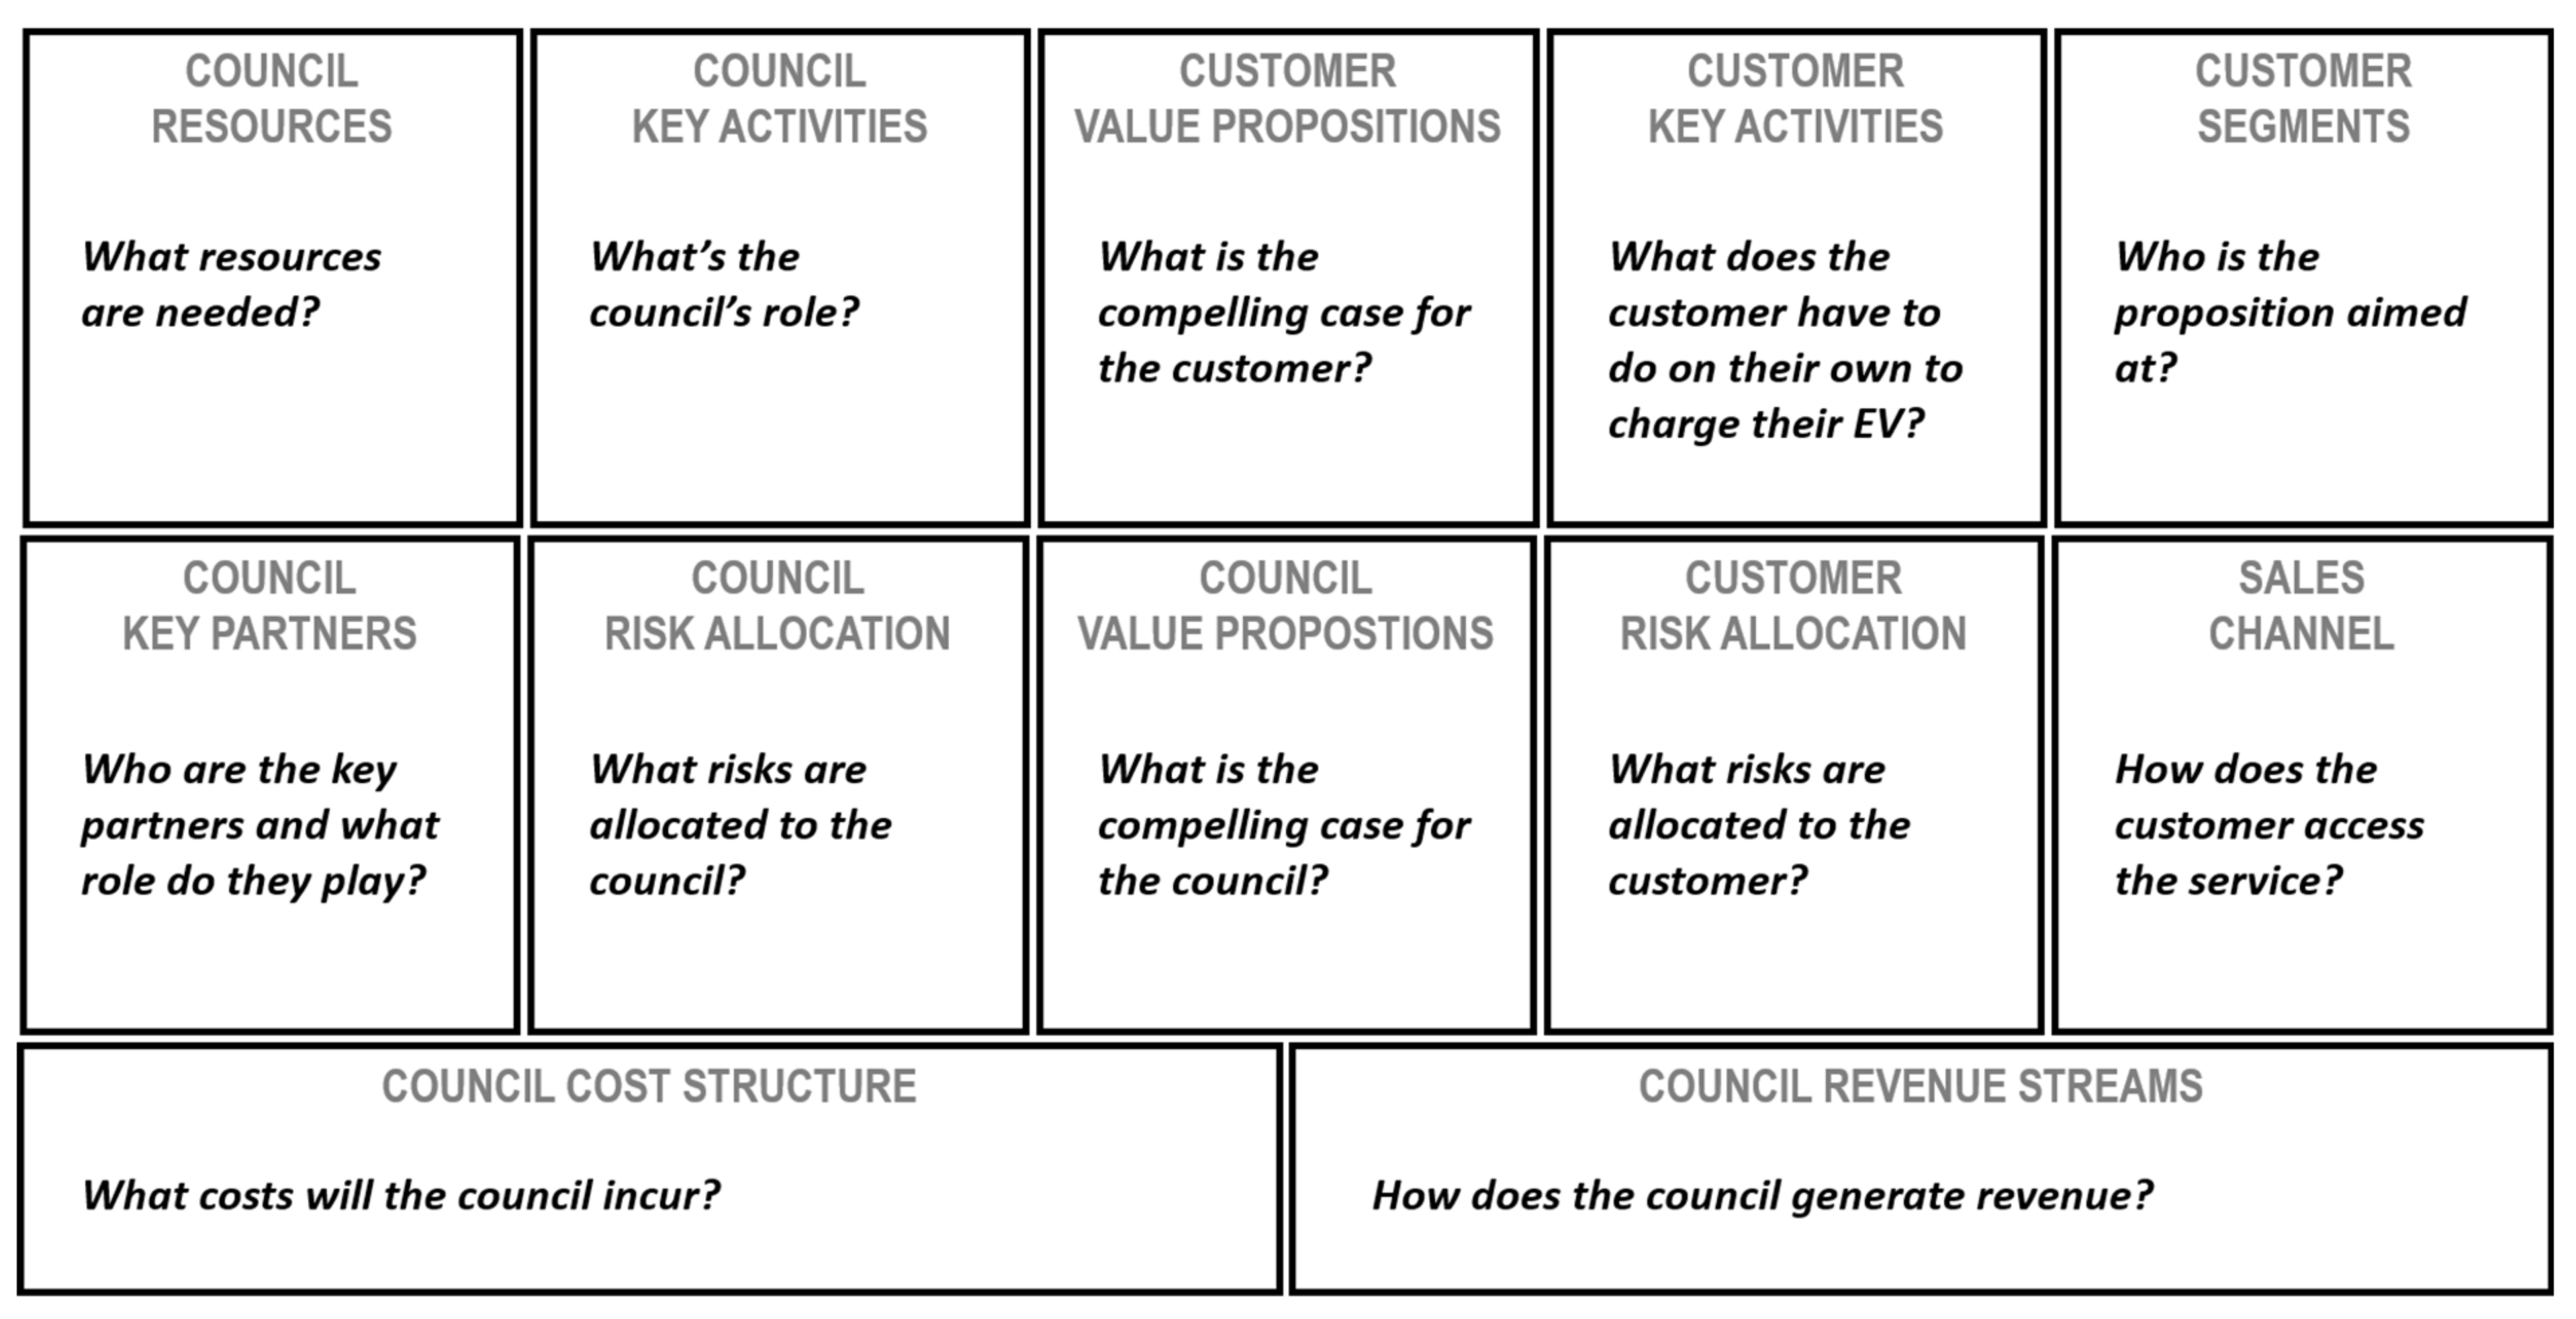
3.3.2. Business Model Options and Prioritisation

Figure 9 shows the business model canvas, which provides a compact overview of all aspects of the business model, including identifying key barriers and risks [44]. It was populated using feedback from Lake Macquarie City Council. While typically the canvas features ten key sections, due to the centrality of the Council’s role in this model, an additional section was added for the council value proposition. In addition, council resources and key partners were separated, recognising the key roles other stakeholders might play in this model.
As seen in Figure 9, the canvas was constructed from the point of view of the “Customer” and the “Council”.
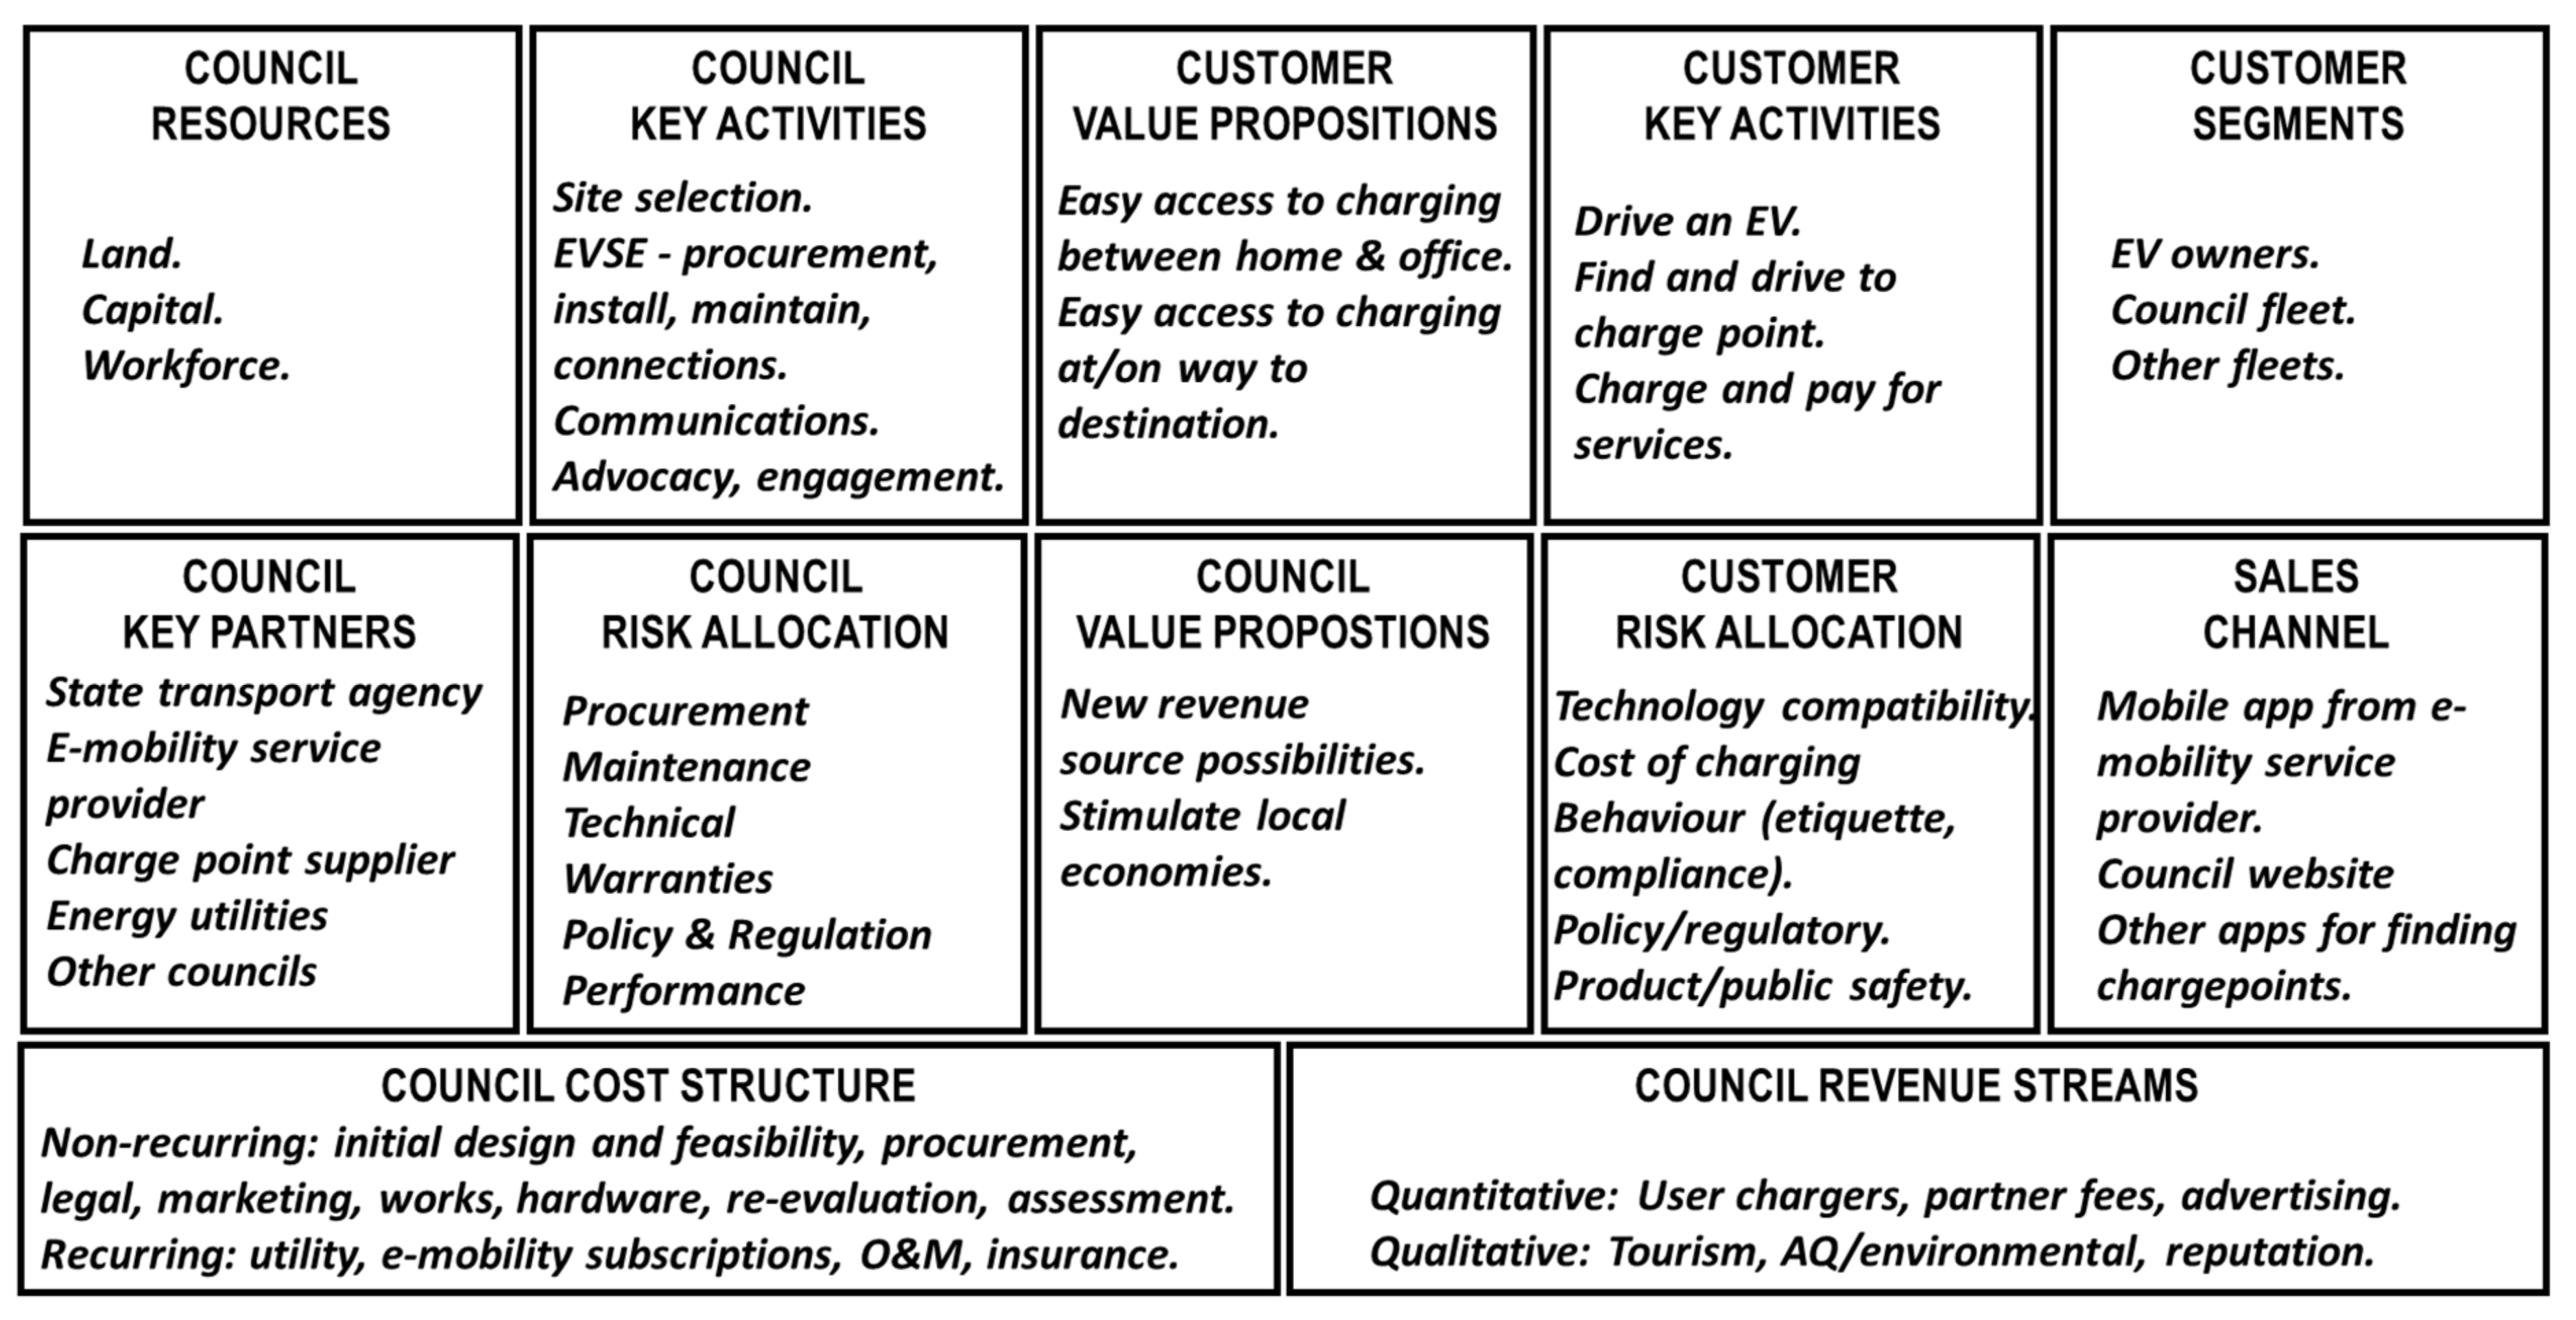
  • For the “Customer”: This is the end customer. In the case of this model, it is the person(s) with the EV who is looking to get it charged.
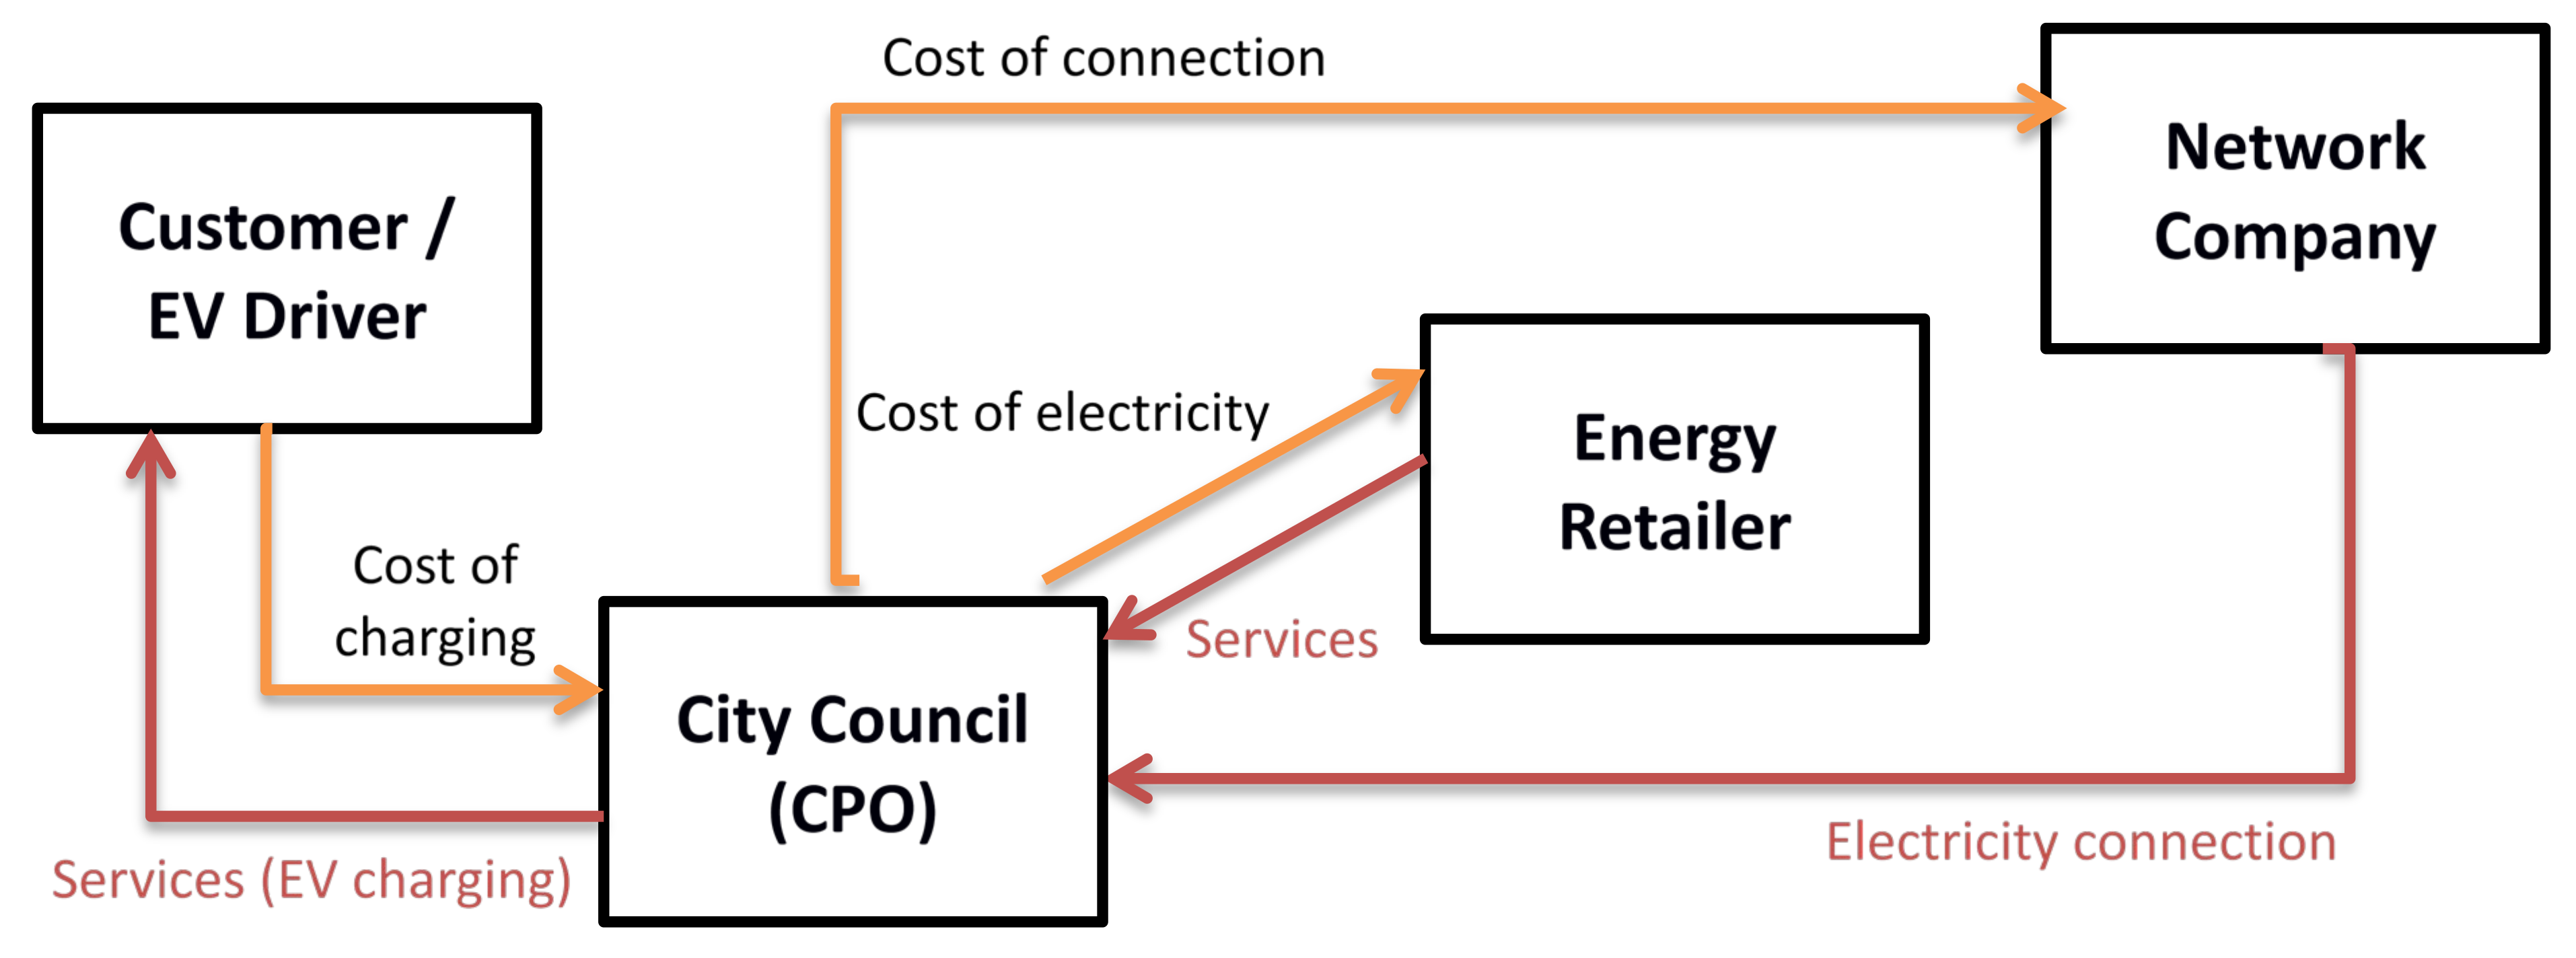
  • For the “Council”: In this case (self-managed model), the Council is the charge point operator.

4. Analysis

Two business model types were ultimately prioritised by Lake Macquarie City Council:
  • The Self-Managed EV Charging Business Model.
  • The Third-Party EV Charging Business Model.
The following section focuses on the self-managed model for the business model canvas, in which Figure 10 shows a snapshot of how the business model works and Figure 11 displays the business model canvas as it was populated for the case of Lake Macquarie City Council.
The council value proposition articulated in this case was in establishing a customer-centric EV charging model that provided it with a first-mover advantage for a new revenue source. Secondary benefits identified were around building social capital, advocating green growth, and pioneering new business models for the latest technology. The use of the business model canvas approach supported Lake Macquarie City Council in identifying and allocating risks between themselves and the different key stakeholders. The relevant risks associated with each business model were defined during the process, and each will need to be allocated among the different potential partners during negotiations on individual contracts.
The business models described in Table 3 and Table 4 [50,51,52,53,54,55] present many different case studies in which EV charging infrastructure is being deployed. This includes council-led examples, as well as other types. While all the case studies offer some kind of “value add” (either to the customer or to the host), those relating to more sophisticated and complex interaction with the grid (whether vehicle-to-building, vehicle-to-community, vehicle-to-home, or vehicle-to-grid) are still primarily in the early trial stages. The nearer-term opportunity is likely around smart charging and using EV charging to smooth peak demand and to utilise excess solar generation capacity. Early council-led deployment of EV charging infrastructure within the region is sought that will achieve the best value for money and the maximum amount of community benefit while avoiding stranded assets or negative impacts on groups or individuals. This is part of a strategic first step in the deployment of infrastructure by Lake Macquarie City Council and its partners at key sites to facilitate a smooth transition into the EV future for the community. Within the council context, the preferred business models for Lake Macquarie City Council will represent the risk profile that it and its partners are willing to assume while maximising the benefits that they want to realise. Councils are not private businesses, and their risk perceptions and risk appetites are different. Partnerships with other parties (as discussed in the business model examples in the previous section) are an effective way of managing the strategic risks identified by the Council. Depending on the final business model, the risks will be shared among the different partners and the consumer. In a contract between parties, some risks would be explicitly allocated in the contract, while others implicitly allocated.
With new technology and business models rapidly developing all the time, the Council should be prepared to adapt and take a flexible approach. Being prepared to offer more than one type of business model—or to switch to a different type—will help councils manage the risk of investing in transport infrastructure in the early stages of the market’s development.
Australia’s energy system has undergone rapid transformation over the last ten years, from one that is predominantly centralised and carbon-intensive to one that is more decentralised and lower carbon [56], as the penetration of distributed energy resources (DERs) grows amid falling costs and the onset of new technology and business models. One in five homes (more than two million households) are now equipped with rooftop solar installations [57].
The electrification of transport poses major new challenges for the electricity system, with serious implications in terms of increasing demand and shifting when that demand occurs. Awareness of such issues has existed for some time, with Naor et al. (2018) pointing to steps taking by Israel in 2007 to encourage smart charging to manage these risks [58]. It is however too early to predict the ultimate impact of EVs on Australia’s National Electricity Market, due to uncertainty over scale and speed of adoption, as well as what effect technological and market developments such as vehicle-to-grid, time-of-use charging, etc. will have. It will be important that the regulatory framework can change and adapt to this, as such changes could both positively and negatively impact EV market development.

5. Conclusions

Australia’s EV charging infrastructure deployment is far behind other countries it typically compares itself with, even those with similar challenges with low population density and large landmass. This means Australians will lose out on capitalising on the benefits EVs can bring. However, local governments in Australia can play a key role in the deployment of public EV chargers in the early stages, given their responsibility for managing road transport infrastructure and especially where some of the benefits and challenges of EVs are viewed as being more local in nature (e.g., air quality). In particular, the main council value proposition for Lake Macquarie City Council was a customer-centric EV charging model that provided it with a first-mover advantage for a new revenue source. Secondary benefits identified were around building social capital, advocating green growth, and pioneering new business models for the latest technology.
While many choices can be made by councils, it is important for them to determine the role they want to play in owning or facilitating the deployment of the charging infrastructure and the risks that they are willing to bear. A morphological approach applied in a local council context can help local governments make considered choices that take into account the various risks and benefits. Although many of the risks can be assigned to other parties by modifying the council’s business model, risks relating to regulation remain and will require effective national standards and policy on charging infrastructure specifications, integration with the electricity grid, planning, building and construction, public safety, and consumer protection. This is challenging for local governments to influence at a state or national level.
Six types of relevant EV charging infrastructure business model were identified for Lake Macquarie City Council, with two of these prioritised for further exploration of the business case. With each council operating within very different local constraints and resources, it is not possible to recommend the “best” business model for all councils. With no “one size fits all”, councils should seek to co-design and tailor their priority business model based on their (and their other stakeholders’) appetite for the risks, benefits, and innovation. Developing their own policy and strategy for EV charging is a good place to start.
Canada has been revealed as a similar country to which Australia can compare itself and which Australian policymakers could seek to learn from to help inform their approach.
To accelerate the rate at which public EV chargers are rolled out across Australia, there is a need for more consistent guidance aimed at local government audiences. Further development of this methodological approach with other local councils would build the evidence-base and fit-for-purpose templates to guide local government in a meaningful way.

Author Contributions

Writing—original draft preparation, conceptualisation, methodology, analysis, literature review, and data collection, S.D.; conceptualisation and editing, C.M.; conceptualisation, analysis, literature review, and data collection, K.N.; methodology, analysis, literature review, and data collection, J.W.; literature review, data collection, L.M.; and review, D.C. All authors have read and agreed to the published version of the manuscript.

Funding

Lake Macquarie City Council funded the original research.

Data Availability Statement

Not applicable.

Acknowledgments

The authors would like to thank Catherine Pepper, Lake Macquarie City Council, and all other stakeholders who participated in the co-design process to arrive at the shortlisted business models and canvas.

Conflicts of Interest

The authors declare no conflict of interest. The funders specified the objectives of the research but did not influence the design of the study; or play a role in the collection, analyses or interpretation of data; in the writing of the manuscript, or in the decision to publish the results.

References

  1. International Energy Agency. World Energy Outlook 2020; Cozzi, L., Gould, T., Bouckart, S., Crow, D., Kim, T.-Y., McGlade, C., Olejarnik, P., Wanner, B., Wetzel, D., Eds.; OECD Publishing: Paris, France, 2020; ISBN 0872625710. [Google Scholar]
  2. Australian Government. Quarterly Update of Australia’s National Greenhouse Gas Inventory: December 2020; Australian Government, Department of Industry, Science, Energy and Resources: Canberra, Australia, 2020.
  3. Australian Government. National Inventory Report 2018; Australian Government: Canberra, Australia, 2020; Volume 1.
  4. National Transport Commission. Carbon Dioxide Emissions Intensity for New Australian Light Vehicles 2016; National Transport Commission: Melbourne, Australia, 2020.
  5. The World Bank. Land Area by Country. Available online: https://data.worldbank.org/indicator/AG.LND.TOTL.K2?most_recent_value_desc=true (accessed on 16 November 2020).
  6. Central Intelligence Agency. The World Factbook. 2020. Available online: https://www.cia.gov/library/publications/resources/the-world-factbook/index.htm (accessed on 28 October 2020).
  7. The World Bank. Urban Population (% of Total Population)—Australia. Available online: https://data.worldbank.org/indicator/SP.URB.TOTL.IN.ZS?locations=AU (accessed on 29 October 2020).
  8. Morgan, R. Rising Numbers of Australians Looking at Electric and Hybrid Vehicles for Their Next Set of Wheels. Available online: https://www.roymorgan.com/findings/8089-electric-and-hybrid-vehicle-intenders-june-2019-201908280629 (accessed on 10 October 2019).
  9. The Electric Vehicle Council. Huge Jump in Aussie EV Sales Underscores Massive Untapped Potential. Available online: https://electricvehiclecouncil.com.au/huge-jump-in-aussie-ev-sales-underscores-massive-untapped-potential/ (accessed on 6 February 2019).
  10. FCAI. Australia’s New Vehicle Market. Available online: https://www.fcai.com.au/sales (accessed on 6 May 2020).
  11. The World Bank. GDP (Current US$). Available online: https://data.worldbank.org/indicator/NY.GDP.MKTP.CD (accessed on 28 October 2020).
  12. ABS. Motor Vehicle Census, Australia. Available online: https://www.abs.gov.au/statistics/industry/tourism-and-transport/motor-vehicle-census-australia/latest-release#:~:text=9309.0-Motor-Vehicle-Census%2C-Australia%2C-31-Jan2020&text=Therewere19.8millionregistered,cent-from-2019-to-2020.&text=Dieselve (accessed on 28 October 2020).
  13. Electric Vehicle Council. State of Electric Vehicles; Electric Vehicle Council: Sydney, Australia, 2020. [Google Scholar]
  14. Canada Energy Regulator. Market Snapshot: EVs in Canada—The Hidden Potential of the Electric Truck Market. Available online: https://www.cer-rec.gc.ca/en/data-analysis/energy-markets/market-snapshots/2019/market-snapshot-evs-in-canada-hidden-potential-electric-truck-market.html (accessed on 28 October 2020).
  15. Statistics Canada. Vehicle Registrations, by Type of Vehicle. Available online: https://www150.statcan.gc.ca/t1/tbl1/en/tv.action?pid=2310006701 (accessed on 28 October 2020).
  16. Government of Canada. Electric Charging and Alternative Fuelling Stations Locator. Available online: https://www.nrcan.gc.ca/energy-efficiency/energy-efficiency-transportation-and-alternative-fuels/electric-charging-alternative-fuelling-stationslocator-map/20487#/analyze?country=CA&fuel=ELEC&show_map=true (accessed on 28 October 2020).
  17. Xinhua. China Has 340 mln Vehicles by Mid-2019. Available online: http://www.xinhuanet.com/english/2019-07/04/c_138196389.htm (accessed on 28 October 2020).
  18. Columbia University. Guide to Chinese Climate Policy. Available online: https://chineseclimatepolicy.energypolicy.columbia.edu/en/electric-vehicles#/_ftn3 (accessed on 28 October 2020).
  19. NZ Transport Agency. National Vehicle Fleet Status. Available online: https://www.nzta.govt.nz/resources/new-zealand-motor-vehicle-register-statistics/national-vehicle-fleet-status/ (accessed on 28 October 2020).
  20. NZ Transport Agency. Electric Vehicle Charging Stations. Available online: https://www.journeys.nzta.govt.nz/ev-chargers-list-view/ (accessed on 28 October 2020).
  21. Norweigen Electric Car Association. Strong Growth in the Number of Lightning Chargers. Available online: https://elbil.no/kraftig-vekst-i-antall-lynladere/#:~:text=Vedårsskiftetvardeti,Lynladere%3A226(%2B804%25) (accessed on 28 October 2020).
  22. Statistics Norway. Registered Vehicles. Available online: https://www.ssb.no/en/bilreg (accessed on 20 October 2020).
  23. UK Government. Vehicle Licensing Statistics: 2017. Available online: https://www.gov.uk/government/statistics/vehicle-licensing-statistics-2017#:~:text=In2017%2Ctherewere%3A,theendoftheyear (accessed on 28 October 2020).
  24. UK Government. Statistical Data Set—Cars (VEH02). Available online: https://www.gov.uk/government/statistical-data-sets/veh02-licensed-cars#registered-for-the-first-time (accessed on 28 October 2020).
  25. Department for Transport. Electric vehicle charging device statistics. Stat. Release 2020, 2, 1–5. [Google Scholar]
  26. Bureau of Transportation Statistics. Number of U.S. Aircraft, Vehicles, Vessels, and Other Conveyances. Available online: https://www.bts.gov/content/number-us-aircraft-vehicles-vessels-and-other-conveyances (accessed on 28 October 2020).
  27. US Department of Energy. Vehicles Technologies Office. Available online: https://www.energy.gov/eere/vehicles/articles/fotw-1089-july-8-2019-there-are-more-68800-electric-vehicle-charging-units#:~:text=FOTW%231089%2CJuly8%2C,UnitedStates%7CDepartmentofEnergy (accessed on 28 October 2020).
  28. Noel, L.; Zarazua, G.; Rubens, D.; Kester, J.; Sovacool, B.K. Understanding the socio-technical nexus of Nordic electric vehicle (EV) barriers: A qualitative discussion of range, price, charging and knowledge. Energy Policy 2020, 138, 111292. [Google Scholar] [CrossRef]
  29. Gong, S.; Ardeshiri, A.; Rashidi, T.H. Impact of government incentives on the market penetration of electric vehicles in Australia. Transp. Res. Part D 2020, 83, 102353. [Google Scholar] [CrossRef]
  30. Naor, M.; Bernardes, E.S.; Druehl, C.T.; Shiftan, Y. Overcoming barriers to adoption of environmentally-friendly innovations through design and strategy: Learning from the failure of an electric vehicle infrastructure firm. Int. J. Oper. Prod. Manag. 2015, 35, 26–59. [Google Scholar] [CrossRef]
  31. Australian Local Government Association. Roads and Transport Agenda; Australian Local Government Association: Canberra, Australia, 2019.
  32. Kley, F.; Lerch, C.; Dallinger, D. New business models for electric cars—A holistic approach. Energy Policy 2011, 39, 3392–3403. [Google Scholar] [CrossRef] [Green Version]
  33. Sohaib, R.; Town, G.E. Potential for electric vehicle adoption in Australia. Int. J. Sustain. Transp. 2018, 13, 245–254. [Google Scholar] [CrossRef]
  34. Stanley, J.; Ellison, R.; Loader, C.; Hensher, D. Reducing Australian motor vehicle greenhouse gas emissions. Transp. Res. Part A Policy Pract. 2018, 109, 76–88. [Google Scholar] [CrossRef]
  35. Brooker, R.P.; Qin, N. Identification of potential locations of electric vehicle supply equipment. J. Power Sources 2015, 299, 76–84. [Google Scholar] [CrossRef]
  36. Ustun, T.S.; Zayegh, A.; Ozansoy, C. Electric vehicle potential in Australia: Its impact on smartgrids. IEEE Ind. Electron. Mag. 2013, 7, 15–25. [Google Scholar] [CrossRef]
  37. Queensland Government. Queensland Electric Vehicle Strategy; Queensland Government: Brisbane, Australia, 2017.
  38. Australian Government. A National Strategy for Electric Vehicles; Australian Government: Canberra, Australia, 2019.
  39. Transport for NSW. NSW Electric and Hybrid Vehicle Plan; Transport for NSW: Sydney, Australia, 2019.
  40. South Australian Government. Targeted Industry Consultation Discussion Paper and Survey; South Australian Government: Adelaide, Australia, 2019.
  41. Government of the Northern Territory. Preparing the Northern Territory for Electric Vehicles: Discussion Paper 2019; Government of the Northern Territory: Darwin, Australia, 2019.
  42. Government of the Australian Capital Territory. The ACT’s Tranmsition to Zero Emissions Vehicles; Government of the Australian Capital Territory: Canberra, Australia, 2018.
  43. Lake Macquarie City Council. Electric Vehicle Charging Strategy 2020–2023; Lake Macquarie City Council: Lake Macquarie, Australia, 2020. [Google Scholar]
  44. Osterwalder, A.; Pigneur, Y. Business Model Generation; Modderman Drukwerk: Amsterdam, The Netherlands, 2009; pp. 1–44. [Google Scholar]
  45. Magretta, J. Why business models matter. Harv. Bus. Rev. 2002, 80, 86–92. [Google Scholar] [PubMed]
  46. Madina, C.; Zamora, I.; Zabala, E. Methodology for assessing electric vehicle charging infrastructure business models. Energy Policy 2016, 89, 284–293. [Google Scholar] [CrossRef] [Green Version]
  47. Zarazua, G.; Rubens, D.; Noel, L.; Kester, J.; Sovacool, B.K. The market case for electric mobility: Investigating electric vehicle business models for mass adoption. Energy 2020, 194, 116841. [Google Scholar] [CrossRef]
  48. Gavrilescu, I. Effective business models for electric vehicles. Proc. Int. Conf. Bus. Excell. 2017, 11, 36–44. [Google Scholar] [CrossRef] [Green Version]
  49. Lake Macquarie City Council. Snapshot of the City. Available online: https://www.lakemac.com.au/city/snapshot (accessed on 6 February 2019).
  50. Myers, A. How States Can Overcome The Looming Electric Vehicle Charging Infrastructure Gap: California. Available online: https://www.forbes.com/sites/energyinnovation/2019/04/03/how-states-can-overcome-the-looming-electric-vehicle-charging-infrastructure-gap/#2ca76c844ded (accessed on 7 June 2019).
  51. City of Amsterdam. Plan Amsterdam. Available online: https://issuu.com/gemeenteamsterdam/docs/plan_amsterdam_the_electric_city (accessed on 9 May 2019).
  52. NRMA. NRMA Electric Vehicle Fast Charging Network. Available online: https://www.mynrma.com.au/community/initiatives/electric-vehicle-fast-charging-network (accessed on 7 June 2019).
  53. Merchant, E.F. California Regulators Approve Landmark Utility EV-Charging Proposals. Greentech Media. Available online: https://www.greentechmedia.com/articles/read/california-cpuc-approves-landmark-ev-charging-proposals#gs.awcfqs (accessed on 10 May 2019).
  54. City of Amsterdam. Charging and Parking Electric Vehicles—City of Amsterdam. Available online: https://www.amsterdam.nl/en/parking/electric-charging/ (accessed on 7 June 2019).
  55. Chargefox. Our Network. Australia’s Largest EV Charging Network. Available online: https://www.chargefox.com/network/ (accessed on 7 June 2019).
  56. AEMO. AEMO Annual Report 2019; AEMO: Sydney, Australia, 2019. [Google Scholar]
  57. Clean Energy Council. Clean Energy Australia Report 2020; Clean Energy Council: Melbourne, Australia, 2020. [Google Scholar]
  58. Naor, M.; Druehl, C.; Bernardes, E.S. Servitized business model innovation for sustainable transportation: Case study of failure to bridge the design-implementation gap. J. Clean. Prod. 2018, 170, 1219–1230. [Google Scholar] [CrossRef]
Figure 1. Number of people per public charger (based on number of public EV charge points).
Sustainability 13 06590 g001
Figure 2. Number of EVs per public charger (based on the number of public EV charge points and the number of plug-in EVs).
Sustainability 13 06590 g002
Figure 3. Number of square kilometres per public charge point (based on the landmass area and number of public charge points).
Sustainability 13 06590 g003
Figure 4. Approach to developing EV charging business models with a local council.
Sustainability 13 06590 g004
Figure 5. Morphological box for the systematic description of local government business models for constructing and supply of EV infrastructure (adapted with permission from [32]). The blue dotted box indicates the business model options for accessibility, ownership, and operation; grid interaction, data, and control options are indicated by the red dotted box; and the green box shows the options that can be categorised as finance and transactions options.
Sustainability 13 06590 g005
Figure 6. Accessibility, ownership, and operation problem tree.
Sustainability 13 06590 g006
Figure 7. Grid interaction, data, and control problem tree.
Sustainability 13 06590 g007
Figure 8. Finance and transaction problem tree.
Sustainability 13 06590 g008
Figure 9. Business model canvas for Local Government (adapted from the Business model canvas by Strategyzer.com [44] and licensed under the Creative Commons Attribution-ShareAlike 3.0 Unported License.).
Sustainability 13 06590 g009
Figure 10. Business model snapshot: Self-managed model (with City Council as the Charge Point Operator).
Sustainability 13 06590 g010
Figure 11. Business Model Canvas: Populated for one of the proposed business models (Self-Managed Model).
Sustainability 13 06590 g011
Table 1. Australia compared with other select countries on EV deployment.
CountryPopulation (Million) aLandmass (sq. km) aPopulation Density (People Per sq. km)GDP (Millions of US Dollars) aVehicle Fleet (Registered Motor Vehicles) (Millions)EV Vehicle Fleet (Plug-in)No. of Public Chargers
Australia b25.47,692,02031,392,68119.816,2752307
Canada e37.69,093,51041,736,42635.782,75612,333
China d1397.79,388,21014914,342,9033403,500,000330,000
New Zealand g4.9263,31019206,9293.55108613
Norway f5.3365,12315403,3365.9260,69213,786
United Kingdom g66.8241,9302762,827,11337.7242,20018,265
USA h328.29,147,4203621,427,700273.61,608,26168,800
a [11], b [12,13], c [14,15,16], d [17,18], e [19,20], f [21,22], g [23,24,25], h [26,27]
Table 2. Summary of relevant EV strategies and support for the different levels of government in Australia.
State/FederalDedicated EV/
e-Mobility Strategy
Type of EV Support MechanismDescription
Federal
Australian GovernmentFactsheet on strategy (2019).
Future Fuels Strategy discussion paper (2021).
NoneConsultation on strategy for enabling private sector deployment of low emission road transport technologies.
State
Australian Capital Territory (ACT)Yes (2018)Stamp duty waiver on new vehicles.
Discounted vehicle registration.
New vehicle purchases pay nothing for stamp duty for the first 2 years followed by an ongoing 20% discount.
They also receive an extra $200 discount on registration.
Queensland (QLD)Yes (2017)Reduced stamp duty for EVs and hybrids.Reduced stamp duty ($2 per $100 up to $100,000 and $4 per $100 thereafter).
New South Wales (NSW)Yes (2019)Reduced motor vehicle tax (all fuel-efficient vehicles).For all vehicles with CO2 emissions <150 g/km.
South Australia (SA)Yes (2020)NoneSupport for smart charging demonstrations.
Northern Territory (NT)In consultation (2019)None-
Western Australia (WA)Yes (2020)None$20 million in support for an EV charging network.
Victoria (VIC)Yes (2021)Discounted vehicle registration.
Reduced stamp duty rate, Subsidy.
$100 annual discount on vehicle registration.
EVs exempt from “luxury vehicle” rate of stamp duty (pay a flat rate of $8.40 per $200 of market value, rather than up to $18 as per non-electric vehicles),
Twenty-thousand subsidies of up to $3000 for new EV purchases under $69,000.
TasmaniaNoNone-
Local Government (a selection)
City of AdelaideNoSustainability incentives for rebates on EV charging stations.Up to 50% (up to a maximum of $10,000 for advanced systems capable of demand management) for EV charging stations.
City of SydneyNo Discounted parking permits.For vehicles with emissions less than 112 CO2 g/km, an annual parking permit costs $41, which increases to $159 for CO2 emissions >260 g/km.
Lake Macquarie City CouncilYes (2020)None-
Source: [29,37,38,39,40,41,42,43].
Table 3. Public access business models (examples).
Business Model SubtypeGovernment-OwnedThird-Party OwnedUtility Owned
ExampleCity of AmsterdamCity of AdelaideNRMACalifornian Energy Utilities
Type of OrganisationLocal councilLocal councilAutomobile associationEnergy utilities (various)
SummaryPublic-owned, public access charging points provided within a locally governed area for a charge (initially free).Public-owned, public access charging points provided within a locally governed area for a charge.Private owned, public access charging points provided for free to all (non-members charged in future) on major highways and popular travel destinations.Private owned, public access charging points provided by an energy retailer for a charge.
Charge Point OperatorCity of Amsterdam, Energy companiesChargefoxNRMAVaries (third-party operators, utility operated)
Value Proposition for Owner/OperatorIncrease visits by EV owner market segment, improve local air quality, provide EV infrastructure to residents.Demonstrate that sustainability is a commercial opportunity for the council, position Adelaide as a hub for EVs, ensure access for visitors, create investment opportunities, support the local economy, and benefit the community.Reduce motoring costs, increase consumer choice, (eventually) increase membership through the offering of free charging.Increase electricity sales, gain new customers, bundle with new service offerings, demonstrate social responsibility.
Locations
  • Public charging points throughout the city (shops, car parks, on-street, etc.).
  • Located across the City of Amsterdam area.
  • Off-street (council car parks).
  • On-street (council parking bays).
  • Public charging points at major roads, highways, and popular travel destinations (e.g., Hunter Valley, Kosciuszko National Park, etc.).
  • Located in the ACT, NSW, and Victoria.
  • Utility operated public charging points for underserved communities.
  • Third-party managed stations installed at various transport and commercial hubs.
  • Located in different areas of California.
AccessOpen access but requires a pass card.Open access but you must also pay for the parking. Pay with a credit card.Open accessOpen access
Cost to Customer
  • Pay per use model (standard parking charges/parking permit requirements apply for on-street chargers).
  • Customers can park at a charging location at any time provided they connect the car.
Pay per use model (standard parking charges still apply for both on-street and off-street parking).Currently, free for all (eventually, non-members will pay per use).Pay per use model (time of use discounts in some cases to encourage off-peak charging).
Revenue Model
  • Council appoints contractors to install charging stations and pays for installation and operation.
  • Council partners with independent third parties to install additional stations.
  • State Government provides a large share of the funding.
  • Automotive companies (Tesla and Mitsubishi) provided either rent for the land or the infrastructure.
  • The council pays for electricity and charges for this and parking.
  • NRMA responsible for (costs of) installation and operation.
  • NRMA partners with local councils and community group to ideally locate chargers.
  • The utility owns and operates stations installed by third-party vendors in underserved communities.
  • Utility supports electrical infrastructure development for third-party operated charging stations.
  • Utility builds underground and private company above-ground infrastructure.
  • Utility builds station on commercial properties and charges a fee.
Charger Type
  • Normal charging.
  • Fast charging.
  • 2 × 15A Wall Plug (no fee).
  • 38 × 22 kW AC (fast chargers) (Type 2).
  • 2 × 50 kW DC (super fast) (1 × CCS Type 1, 1 × CCS Type 2, and 2 x CHAdeMO).
  • Fast charger.
  • Superfast charger.
  • Normal charging.
  • Fast charging.
  • Fast charging for fleets.
Information Platform
  • An online map shows available charging stations with plug type and charging method.
  • Information also available on third-party apps.
  • Information on third-party apps (PlugShare and Chargefox).
  • Information also available on the council website (via PlugShare web plugin).
  • A map on the NRMA website.
  • PlugShare and other third-party apps.
  • US DOE Station Locator.
  • PlugShare and other third-party apps.
Value Add 1
  • Parking permit prioritisation.
  • Privileges for EV taxis.
  • Renewable electricity.
  • Variable charging speeds according to time of use (linked to peak demand).
  • Smart charging—vehicle-to-grid (under trial).
  • First hour free at fast chargers.
  • Variable charging speeds according to time of use (linked to peak demand).
  • Smart electric vehicle parking system.
  • Free service.
  • Renewable electricity (via GreenPower).
  • Serves underserved neighbourhoods.
  • Trial rates to shift residential EV charging.
  • EV specific rates to address demand charges.
Pros
  • Council retains control.
  • Achieves high density of chargers through own and third-party roll out.
  • A revenue stream for the council.
  • The council does not bear the risk of building, operating, maintaining.
  • Council receives a revenue stream from the CPOs and the car parks.
  • Simple offering-free service for all.
  • Promotion of NRMA brand along with EVs.
  • Laying foundations for additional member benefits.
  • Financed using social impact fund/strong partnership approach.
  • Leaves operation and management to CPO.
  • Supports communities who otherwise would not have access to EV charging.
  • A flexible approach where it also works with third parties.
ConsLots of risks reside with the council (finance, own and operation).Relies on initial funding. May find it difficult to scale up to the national level to benefit all members.
  • Cost of providing infrastructure to underserved communities where utilisation may be extremely low due to the current high cost of EVs.
  • The low number of EVs in the market compared to other vehicles.
Sources: [50,51,52,53,54,55]. 1 A “value add” can be combined with different EV charging business models to provide additional revenue to one or more stakeholders and make the overall proposition more attractive.
Table 4. Semi-public access business models (examples).
Business Model SubtypeMembership-Based Charging StationsGuest and Visitor ServicingBusiness Self-Funded
ExampleTeslaeChargeWorkGo-To-U Charging Network
Type of organisationAutomobile manufacturerChargepoint OperatorBusinesses (various)
SummarySelf-funded, privately owned charging points with a mix of semi-public (Destination Charging) and restricted access (Tesla Superchargers for Tesla owners) provided for a charge.Third-party funded, private owned, restricted (semi-public) access charging points provided for a charge to guests, customers, and visitors.Self-funded, private owned, restricted access charging points provided for free to guests, customers, and visitors.
Charge Point OperatorTeslaeChargeWorkBusiness owners
Value proposition for owner/operatorThe world’s fastest charging network and the most access to charging stations of all EV owners.
  • Zero CAPEX, with an ongoing revenue stream.
  • Early access to EV owner customer segment.
Early access to the EV owner customer segment.
Locations
  • Superchargers: On major highways and amenities
  • Destination chargers: At popular travel destinations, hotels, retail, apartment blocks, and workplaces.
  • Retail and hospitality.
  • Located in Germany, Austria, and Switzerland.
  • Restaurants, hotels, clubs, and cinemas.
  • Available in Norway, Austria, Poland, Ukraine, Thailand, Georgia, and Kazakhstan.
Access
  • Superchargers: Access to Tesla owners only.
  • Destination Chargers: At the discretion of business owners but likely to be for guests, customers, visitors. If two charge points, one may be for Tesla EVs only.
  • Access for guests, customers, and visitors.
  • NFC or QR Code authorisation.
Access for guests, customers, and visitors.
Cost to customer
  • Superchargers: Pay per use (~$0.42/kWh).
  • Destination chargers: At the discretion of business (free to paying customers, or charge everyone).
Pay per use (€20 per charging session). Free
Revenue Model
  • Superchargers: Depending on when the Tesla EV was purchased, owners may get all electricity for free or only a certain allotment free (hardware owned by Tesla). They also charge an idle fee for remaining when the car is charged.
  • Tesla provides and installs charging hardware. The business pays for electricity and provides site–no ongoing maintenance or charges for the business.
  • eChargeWork provides and installs charging infrastructure for free to hotels and retail
  • In return, they receive 7 years of exclusivity rights to the site.
  • Hotel/retailer receives 10% of turnover from charging.
  • Business/site owner procures the charging stations.
  • Guests and customers can charge vehicles for free.
  • Used as a way of capturing the EV driver market.
  • App platform charges the business for featuring their chargers.
Charger Type
  • Supercharger network: DC up to 120 kW.
  • Destination charging: AC Level 2.
  • Three-phase from 11 to 22 kW 400 V.
  • KEBA chargers: 22 kW.
Information Platform
  • Destination Chargers and Superchargers are visible on the Tesla website charging maps and in-vehicle navigation.
  • App to locate, book, and pay for charging.
  • Access to hotel deals.
  • Mobile App for navigation, location, availability, booking.
Value Add
  • Exclusive use of some Destination Chargers and all Superchargers.
  • Integration between car and information platform.
  • Zero CAPEX for businesses with no ongoing costs (except for electricity cost in case of Destination Charging).
  • Access to hotel deals via app.
  • Ease of payment via Cryptocurrency (ECHG tokens) wallet linked to the app.
  • Will be 100% green energy in the future.
  • Undertaking trial for providing “Carbitrage” (i.e., vehicle-to-grid) to unlock additional electricity values and links to microgrids.
  • Marketing and PR for businesses through the app.
  • Customers can receive messages on offers, collect bonuses, and exchange them for gifts from the app.
Pros
  • First mover advantage.
  • Clear benefits for its customers.
  • Offers a win-win solution to the businesses.
  • Additional revenue with no CAPEX.
  • Host business captures all the benefit.
  • The platform gives the host business a platform for finding EV-owner customers.
ConsTakes on a lot of the risks but slowly transferring these back to hosts and customers. Revenue for the business may not be enough to compensate if paid parking.Competing with Tesla’s Destination Charging proposition.Much of the risk resides with the business for own, install, operate.
Host business must pay for the additional service for customers and tricky to balance cost vs. reward (increased patronage).
Publisher’s Note: MDPI stays neutral with regard to jurisdictional claims in published maps and institutional affiliations.

