Article

Machine Learning for the Improvement of Deep Renovation Building Projects Using As-Built BIM Models

by
Sofía Mulero-Palencia
*,
Sonia Álvarez-Díaz
and
Manuel Andrés-Chicote
CARTIF Technology Centre, Parque Tecnológico de Boecillo, 47151 Boecillo, Spain
*
Author to whom correspondence should be addressed.
Sustainability 2021, 13(12), 6576; https://doi.org/10.3390/su13126576
Submission received: 31 March 2021 / Revised: 28 May 2021 / Accepted: 31 May 2021 / Published: 9 June 2021

Abstract

:
In recent years, new technologies, such as Artificial Intelligence, are emerging to improve decision making based on learning. Their use applied to the Architectural, Engineering and Construction (AEC) sector, together with the increased use of Building Information Modeling (BIM) methodology in all phases of a building’s life cycle, is opening up a wide range of opportunities in the sector. At the same time, the need to reduce CO 2 emissions in cities is focusing on the energy renovation of existing buildings, thus tackling one of the main causes of these emissions. This paper shows the potentials, constraints and viable solutions of the use of Machine Learning/Artificial Intelligence approaches at the design stage of deep renovation building projects using As-Built BIM models as input to improve the decision-making process towards the uptake of energy efficiency measures. First, existing databases on buildings pathologies have been studied. Second, a Machine Learning based algorithm has been designed as a prototype diagnosis tool. It determines the critical areas to be solved through deep renovation projects by analysing BIM data according to the Industry Foundation Classes (IFC4) standard and proposing the most convenient renovation alternative (based on a catalogue of Energy Conservation Measures). Finally, the proposed diagnosis tool has been applied to a reference test building for different locations. The comparison shows how significant differences appear in the results depending on the situation of the building and the regulatory requirements to which it must be subjected.

1. Introduction

1.1. Background

The European Union is committed to reducing its Greenhouse Gas (GHG) emissions by at least 40% by 2030 [1]. To meet this objective, buildings, which are responsible for almost 40% of the current global GHG emissions [2], constitute a key sector to be tackled. In this sense, the most recent amendment to the Energy Performance of Buildings Directive (EPBD) and the Energy Efficiency Directive (EED) establishes a target reduction of 80–95% for 2050 compared to the corresponding levels in 1990, to reach a low- and zero-emission building stock considering the cost-effective refurbishment [3] (art. 2a). A deep renovation of the existing building stock into NZEBs (Nearly Zero-Energy Buildings) is therefore necessary. Improving the design of a decision-making process in deep renovation projects becomes important to consider to increase the energy efficiency of buildings. Although the implementation of Building Information Modelling (BIM) methodology in the Architectural, Engineering and Construction (AEC) sector has enabled its modernisation, the full potential of BIM data has not yet been exploited. The amount of metadata that we can obtain from a BIM model allows new possibilities of analysis in all phases of the building life cycle. The analysis of such building data with Artificial Intelligence (AI) techniques provides new options for decision making based on the continuous learning of the system. In this sense, the use of new technologies, such as AI and BIM, can be combined to enhance the impact of deep renovation projects.
The research presented in this paper focuses on the diagnosis and design optimisation within such projects using As-Built BIM models as input for the application of machine learning (ML)/AI/data-driven approaches, thus leading to improved and more efficient workflows at the design stage of deep renovation building projects.
In particular, enabling the convergence between the use of ML techniques and the ability to identify existing defects that need to be solved through deep renovation interventions in previous constructions, is one of the key addressed contributions. In order to automate its application, the main data source considered for the diagnosis is the Industry Foundation Classes (IFC) [4] since it is one of the most widely used open standards for BIM data exchange.
This draws a specific context for innovative process development since there are only few examples of work that have been carried out on this specific multidisciplinary field before, as it is discussed next.

1.2. Overview of AI Applications for the Built Environment

John McCarthy used the term AI for the first time at a conference in Dartmouth in 1956. Several fields have exploited its potential since then, as it is the case of the construction sector, mainly focused on the identification of elements and materials through image recognition [5,6], or for modelling and decision making. Shirowzhan et al. [7], for instance, used Building Change Detection techniques based on ML and LIDAR data for monitoring building changes and deformations, construction progress or structural deflection tracking. Moreover, in [8], images extracted from the BIM software are used and categorized into three different classes (apartment building, industrial building and other types); then a classification algorithm is developed, obtaining good accuracy results using convolutional neural networks. Another end-to-end ML-based classification system is developed in [9] with the objective of automating several steps for the classification of BIM models, which have to deal with multiple types of data. Some examples of research carried out in the domain of structural building diagnosis have been supported by AI techniques. Many of them are oriented to solve very specific problems, as the work done by Van Balen [10] who developed an expert system, which assists the user in defining types and causes of damage in ancient masonry structures, related to air pollution and traffic. This Knowledge Based System (KBS) is a form of artificial intelligence that aims to capture the knowledge of human experts to support decision-making and solve complex problems. Moodi and Knapton [11] designed an effective supporting tool for experts to offer repairing solutions for damages in concrete elements. It contains 13 decision tables, one of them for diagnosis, which constitute a dynamic resource that evolves with the help of different contributors (REPCON system). Bernat and Gil [12] presented an Expert System for diagnosis, finding pathologies of structural elements in buildings, which deals with uncertainty in a useful way, aiding during the initial inspection. This system encodes knowledge using production rules and decision tables together. In [13], a research team in Lisboa developed a series of knowledge- and experience-based inspection, diagnosis and repair systems for individual non-structural building elements. The expert inspection, diagnosis and repair systems classify and define the typical defects, probable causes, diagnosis methods and repair techniques for the considered building element [14].
In the context of IFC files, the literature offers examples of the use of ML techniques for detecting internal problems and inconsistencies, because of the importance of IFC integrity checking. Lee et al. [15] proposed an inspection methodology using BIM and linked data technologies for sharing defects. This approach offers a flow of information from the detection of a pathology to those responsible for its occurrence, with the aim of avoiding future problems, and promoting dissemination actions on this matter. Koo et al. [16,17] explored the use of two ML techniques for detecting anomalies, called outlier and novelty detection. Both approaches are tested on three BIM models to evaluate their accuracy in identifying wrong classification. However, they show certain limitations due to the lack of use of semantic relationships between elements in the BIM model. Krijnen and Tamke [18] explored the potential of using supervised and unsupervised ML techniques to detect errors in BIM models. Lee et al. [19] proposed a set of metrics for the comparison between different IFC files, a procedure that is generally performed by visual check (similarity rate, match rate, preservation rate of the global unique identifier, missing rate and rate of addition). It uses a recursive comparison algorithm to flatten distances. Lilis et al. [20] focused their attention on solving inaccuracies related to geometry in IFC files: Crash error, where two building solids intersect, space definition errors, where the volume of a building space is not correctly defined (gaps between volumes) and surface orientation errors, where the normal vector of some boundary surfaces is misoriented. The developed recursive orientation algorithm is tested in two IFC files. Wu and Zhang [21] proposed a new iterative data-driven method to develop an algorithm capable of classifying each object in an IFC model into predefined categories. Eftekharirad et al. [22] extended the IFC data model for the real-time management of fire emergency, integrating sensors and occupant sensors, by adding this information to the IfcSensor and IfcOccupant entities, respectively. After that, relationships between sensors, occupants, occupancy patterns, time series and building components are defined in the context of building evacuation. The article does not explore any ML techniques, but the resulting contribution is of interest to evaluate the possibility of extending the IFC file to include real-time information.
The field of building regulations has also been explored in order to verify compliance with IFC models. Regulation based BIM model verification is widely used in many disciplines, to support the detection of potential requirements or defects. Given a building regulation, first, it is formally described by logical formulas, then an Web Ontology Language (OWL) model is extracted from the IFC and SPARQL Protocol and RDF Query Language (SPARQL) queries are generated to determine the integrity of the information. SPARQL is used to improve time response in large-scale applications. The IFC model is verified using ontologies and a prototype called BIMRuleChecker is developed for the domain experts to write rules and apply them to the process, based on the integrity verification generation algorithm [23].
Research in [24] also considers health and safety issues. This multi-domain framework is based on parametric rules and BIM-based model verification concepts (such as clash detection). The construction normative text is used, first, for rule interpretation and parametrization and, then, for rule-based code verification, to semi-automatically verify a construction site safety plan.
The theory behind the most successful techniques in ML applied to deep renovation is discussed in more detail in Section 2.1.

1.3. Contributions and Work Structure

Within this context, the current research develops a specific methodology that will be tested with the development of a prototype diagnosis tool to prove how the aforementioned technologies can support diagnosis and optimisation processes in deep renovation projects. Even though ML techniques have been used for this purpose for a long time with the aim of providing powerful mechanisms to deal with problems in specific building components, either it is not easy to collect the required input information for these tools, or this must be manually provided by experts. That is why this work focuses on leveraging the use of information on building elements that is included in the IFC data model, as well as on demonstrating the advantages of automatic data extraction and processing to support the decision making processes during the design of such deep renovation projects. Examples found in the literature that follow similar trends in the use of ML with IFC files do not target the field of thermal pathologies in buildings, where the present research is actually focused. Indeed, in this research, ML will be particularly dedicated to diagnostics and enrichment of the design rules, substantially impacting the detection process for design and specification deficiencies by both enabling the systematic use of a reliable data source (constituted by the As-Built IFC file of the target building), as well as putting enriched selection guidance and automatic assessment of building solutions at the service of the end-user.
Section 1.2 gives an overview of the state-of-the-art of the use of ML in deep renovation building projects. Section 2 focuses on identifying data sources that collect information on building thermal pathologies, and provides an overview of ML classification methods in deep renovation projects. Section 3 focuses on the proposed methodology. It describes the diagnosis and optimisation process carried out following a ML approach at the design stage of deep renovation projects, considering the regulations available for 4 different countries: Spain, France, Germany and Poland. Section 4 presents those results derived from a proof of concept of the proposed approach based on its application to several buildings located in the selected countries. Results are analysed and discussed within Section 5. Finally, some of the promising future uses of the combination of ML and BIM methodology are summarized within a set of conclusions in Section 5.

2. Key Elements for the Proposed ML-Based Diagnosis-Support Solutions

Diagnostic support can be provided in the form of equipment, devices and test procedures, in order to gather useful information about the entire building and its systems. Alternative diagnosis tools for the built environment can range from a diagnostic chart or table with a list of anomalies, a set of undesirable values and their possible explanation, to a system that automatically performs this verification, and provides a final report.
In this context, the proposed approach includes the definition and development of a decision tree that supports the determination of the most convenient solution for thermal renovation of buildings. Pathology has been defined as the scenario in which a building does not comply with a given current national regulation on thermal transmittance values for building components. For the definition of pathologies, the IFC schema has been used as a primary data source. It is selected as the most commonly-used format for open data exchange related to the building information required for the analysis, while it enables to create useful, automatic mechanisms that can be easily integrated with other more sophisticated tools. However, much of the information required to detect many of the listed problems is not usually provided by the IFC schema. Then, other data sources available on the Internet have been identified and verified. On the other hand, it has also been necessary to define the set of Energy Conservation Measures (ECMs) that the algorithm can select to determine the most convenient solution. These have been designed taking into account the information given by Tabula WebTool [25] for each country, as well as the real market possibilities.

2.1. Classification Methods Overview of ML in Deep Renovation Projects

The classification procedure requires the development of models or classifiers to describe classes of data. Those data classes are assumed to be related with other random variables called features, on which the classification models are trained. Among typical techniques, rule-based classification, expert systems or decision trees can be mentioned. This section includes a brief review of their main characteristics, with special interest in the latter, which represents the method selected for the design of the pathology diagnosis algorithm.

2.1.1. Rule-Based Classification

In rule-based classifiers, the learned model is represented in form of IF-THEN rules. An IF-THEN rule is an expression on the form: IF condition THEN conclusion. As example, rule R1 can be defined as follows (1):
R 1 : IF I s I s o l a t e d = f a l s e A N D t h i c k n e s s > 0 THEN i s o l a t i o n _ p o s s i b i l i t y = t r u e R 1 : ( I s I s o l a t e d = f a l s e ) ( t h i c k n e s s > 0 ) ( i s o l a t i o n _ p o s s i b i l i t y = t r u e ) ,
the IF part of the rule (left side) is known as the rule antecedent or precondition. If the condition holds true, the antecedent is satisfied and the rule covers the tuple; the THEN part of the rule (right side) is the rule consequent.
The antecedent contains one or more attribute tests, and the consequent contains a class prediction (in this scenario, it decides if an isolation measure can be applied) [26]. One of the most used inference strategies to obtain complex conclusions is the chain of rules procedures. It can be used in case the premises of certain rules coincide with the conclusions of others. When the rules are chained, the original facts can create new facts, and this is repeated successively until no further conclusions can be obtained.

2.1.2. Expert System

The use of expert systems is of special interest in the field of building pathology. It consists of a programmed system that provides adequate answers to questions of the user in the concerned field of knowledge, after analysing a great amount of data concerning the problem [27]. Professor Edward Feigenbaum of Stanford University, one of the pioneers of expert systems technology, defined an Expert System as “an intelligent computer program that uses knowledge and inference procedures to solve problems that are difficult enough to require significant human expertise for their solutions” [28].
Among the advantages of using an expert system, it can be highlighted that it can speed up the process of diagnosis, by providing increased availability, reduced cost, reduced danger, permanence or fast response, and can also be used as an advisory tool for non-experts (knowledge of multiple experts can be made available to work simultaneously and continuously to solve problems, in an increasingly reliability framework). Even more, the expert system can explicitly explain in detail the mechanisms followed to extract a conclusion. Direct benefits are evident, however, its development may involve a long process and, sometimes, the full understanding of its complexity may be difficult for non-experts [27,28]. A reference architecture of an expert system is shown in Figure 1.
In the scenario under study, a diagnosis (or classification) expert system could be developed, with the aim of advising the user. Base knowledge would be the experience, considering information is not as complete as desired to determine the best set of solutions.

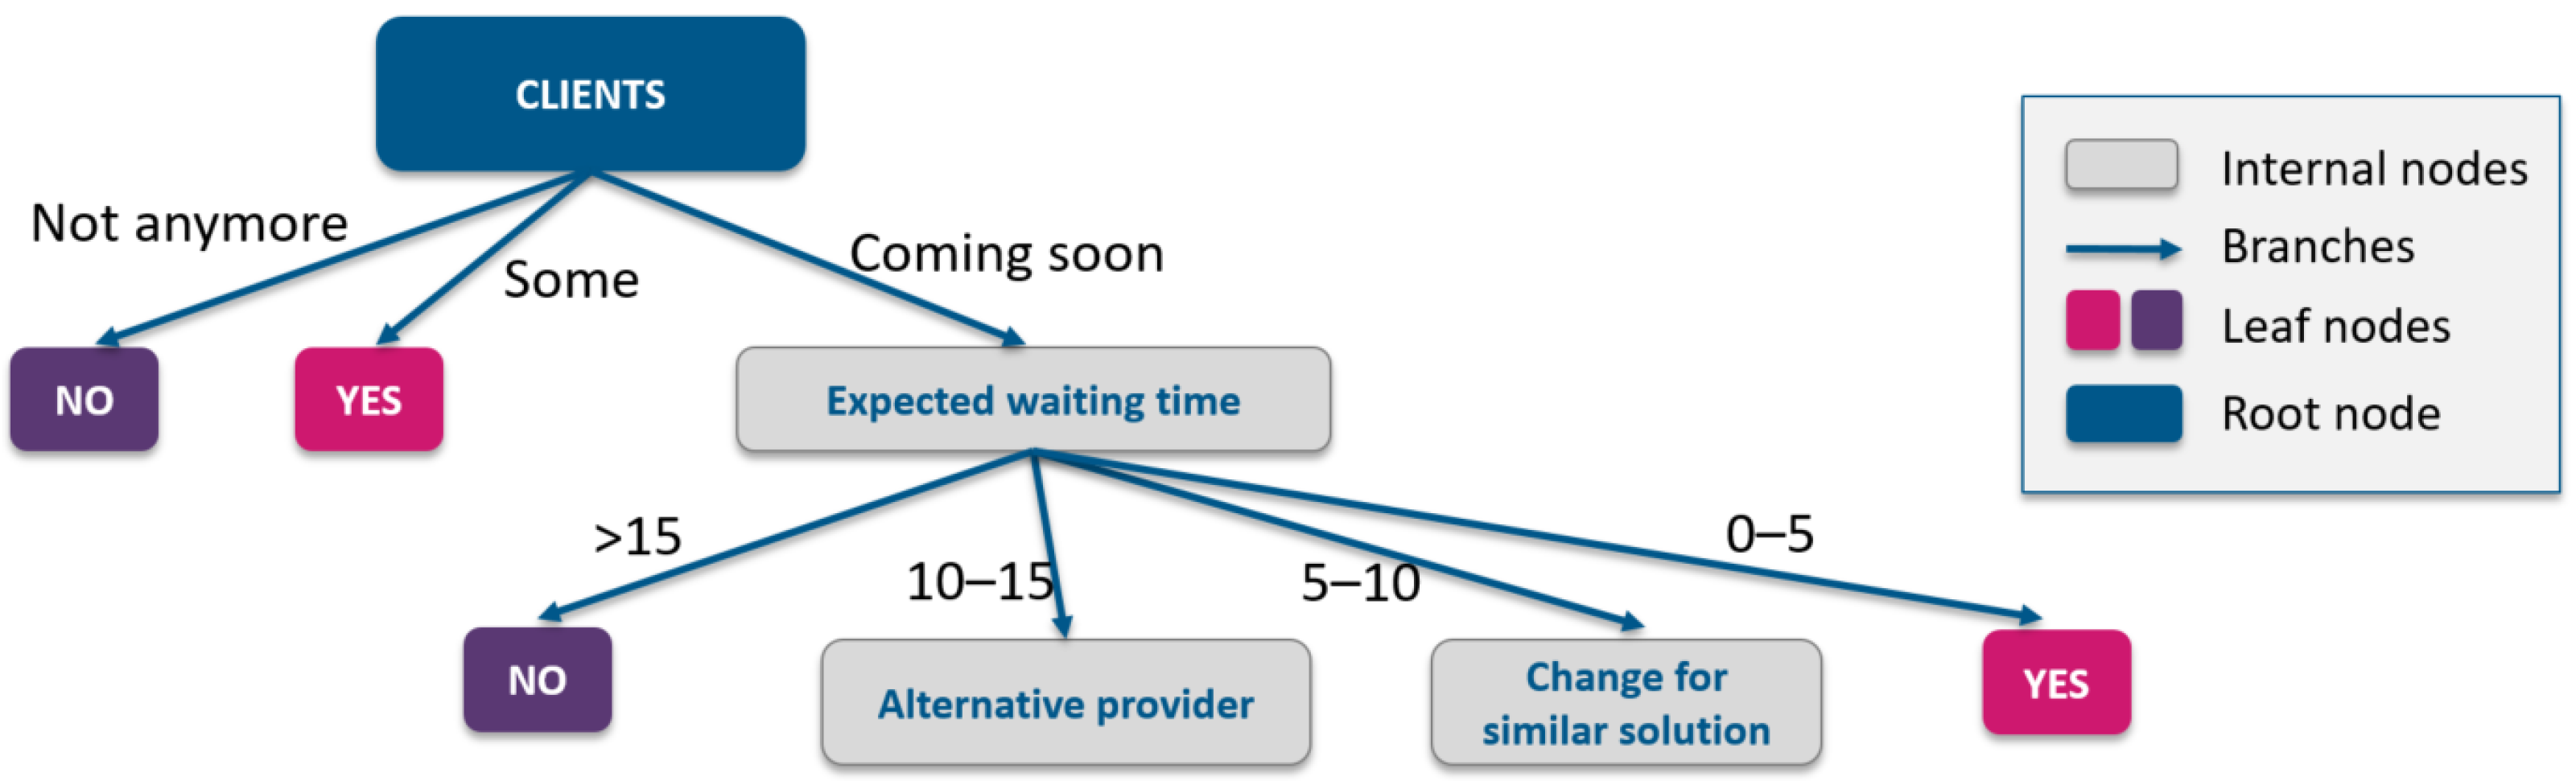
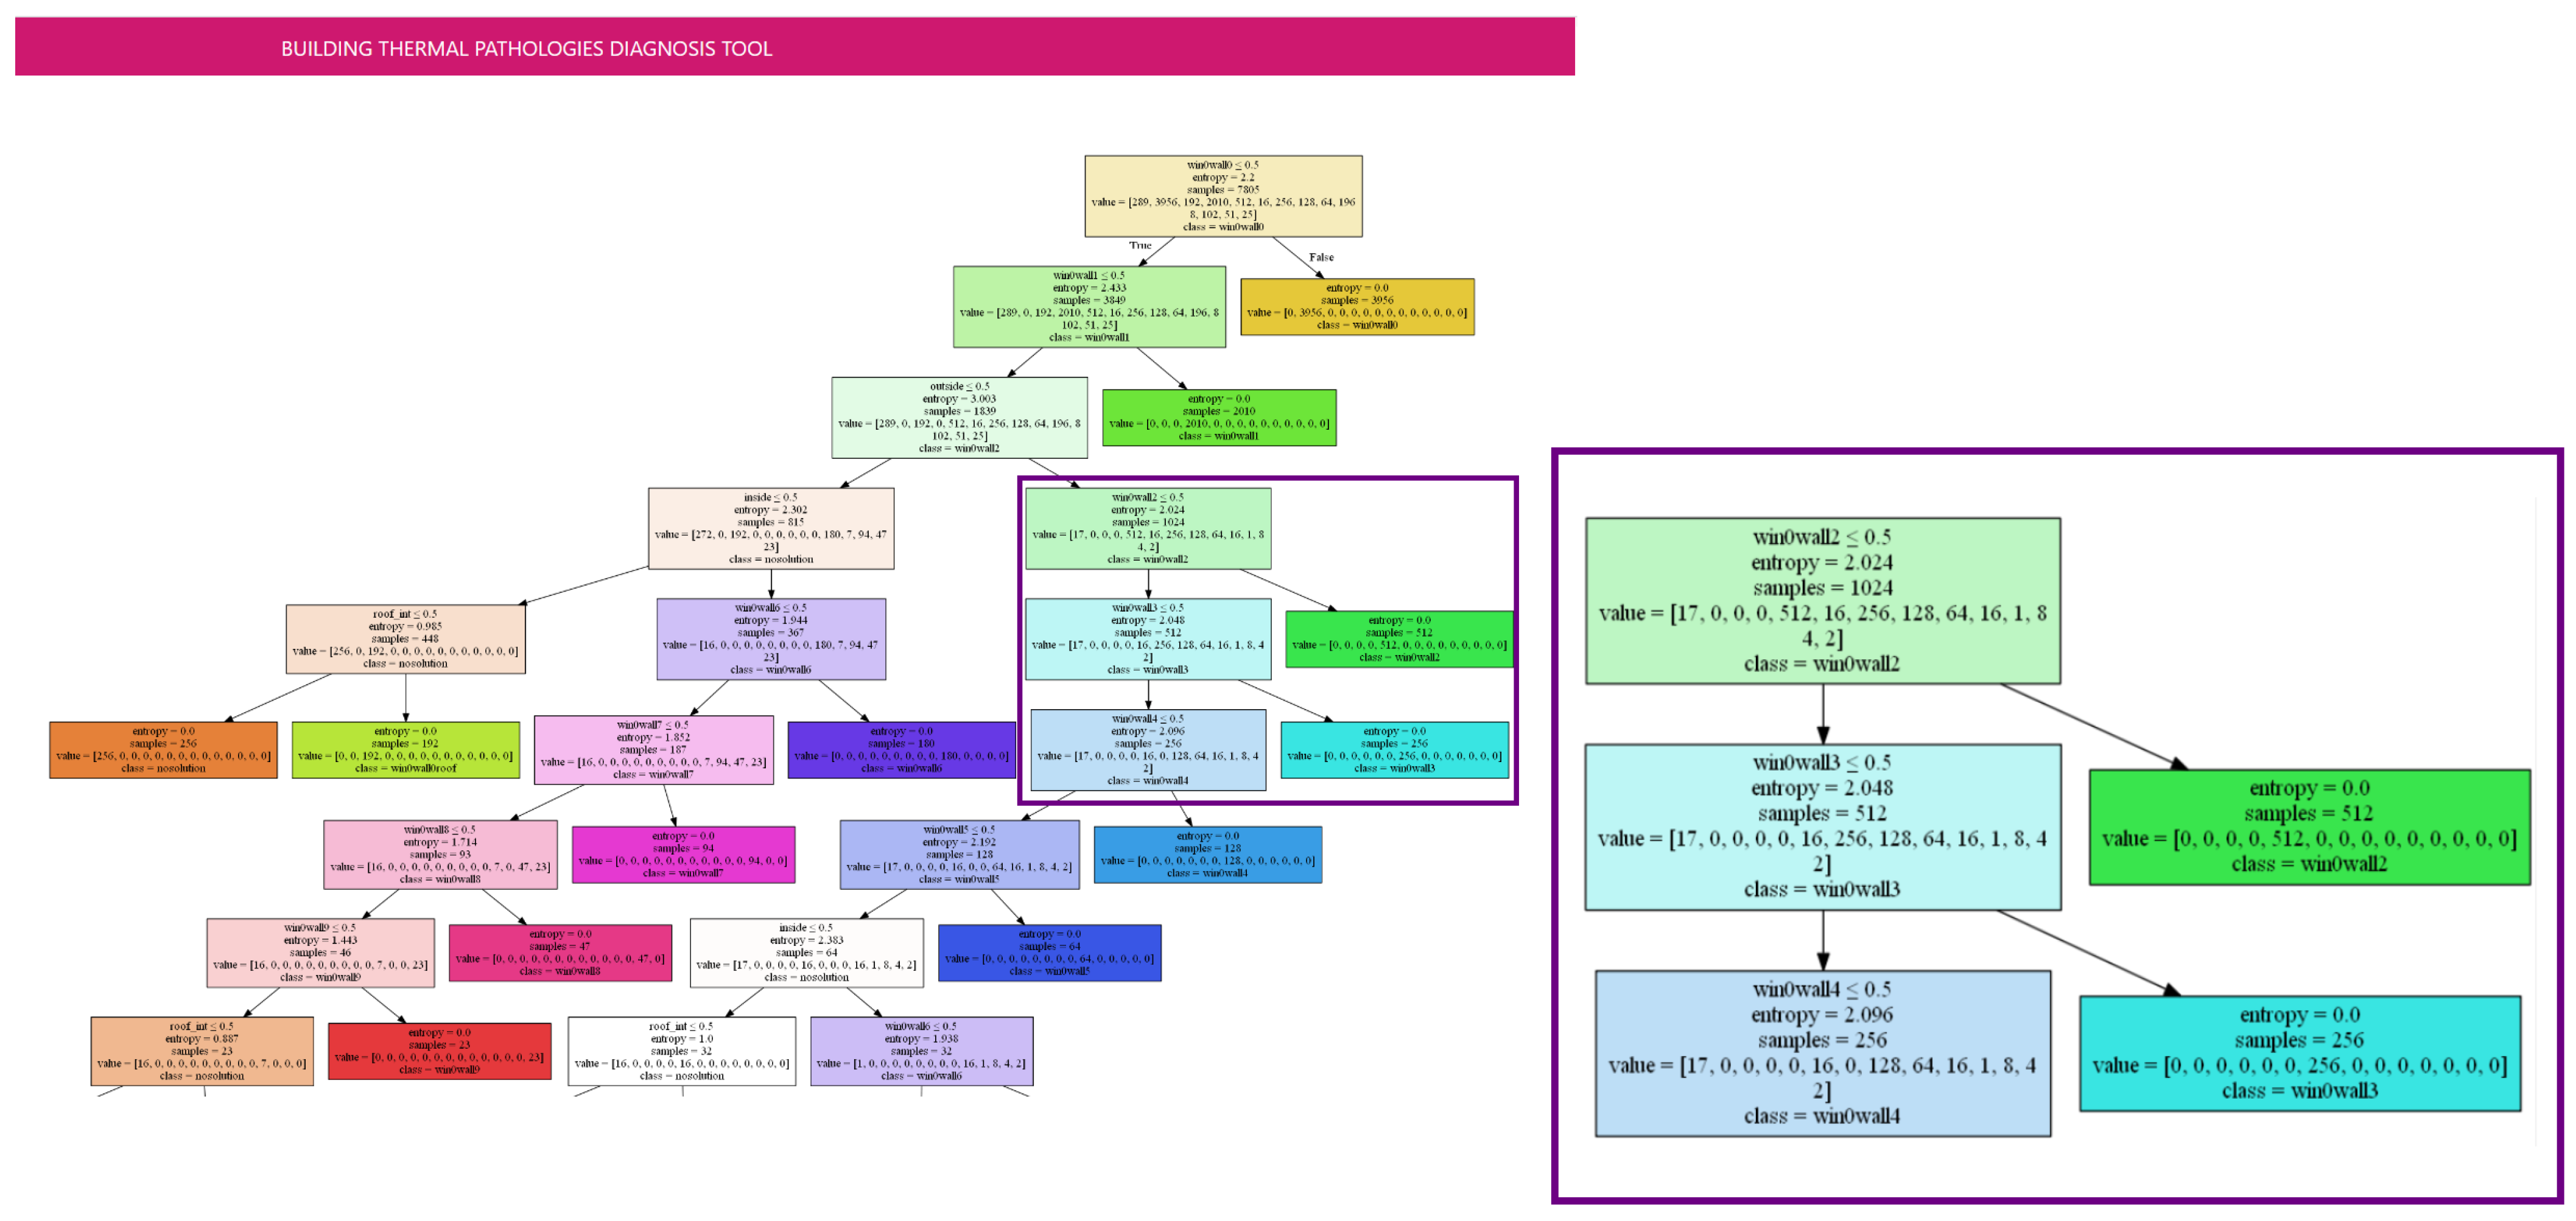
2.1.3. Decision Trees

This approach shows the ability of decision trees to learn from tuples labelled by classes (the classes have to be categorical). It is shown as a structure similar to a flowchart where different elements appear [26]:
  • The internal nodes, which are non-leaf nodes that denote a test on an attribute;
  • The branches, which represent the outcomes of a test;
  • The leaf nodes, which are terminal nodes that hold a class label;
  • The root node, which is the topmost node in the tree.
It works as follows: Given a tuple C, for which the class label is unknown, the attribute values are tested against the decision tree. As a result, a path is drawn from the root to a leaf node, which holds the class prediction for that tuple (see Figure 2).
Among the main advantages of using decision trees, it should be noted that neither domain knowledge nor parameter setting are required. Besides, they can handle multidimensional data, their representation is quite intuitive, they usually have good accuracy and, finally, they are appropriate for exploratory knowledge discovery.

Attribute Selection

This measure makes it possible to separate a given data partition of class-labelled tuples into individual classes. The best splitting criteria is the one that most closely leads to a scenario. The splitting rules are the base that determine how tuples are going to be separated. The attribute selection measure offers a ranking for each attribute describing the training tuples, and the attribute with the best score for the measure is selected as the splitting attribute for the given tuples. The most popular attribute selection measures include the information gain, the gain ratio and the Gini index [26]:
  • Information Gain. It is based on the work of Shannon and Weaver [30] on information theory, which studied the value of “information content” of messages. The highest gain attribute is the splitting gain attribute for the node, and it minimizes the information needed to classify the tuples in the resulting partitions, in order to be the least impure as possible. The information needed to classify a tuple in A (2):
    I n f o ( D ) = i = 1 m p i log 2 ( p i ) ,
    where p i is the nonzero probability that an arbitrary tuple in D belongs to class C i and it is estimated by | C ( i , D ) | / | D | . Info ( D ) is also known as the entropy of D. Info gain is defined as the difference between the original information requirement and the new one. It indicates how much would be gained by branching on A (3).
    G a i n ( A ) = I n f o ( D ) I n f o A ( D ) .
  • Gain ratio. It is defined in the following way (4):
    G a i n R a t i o ( A ) = G a i n ( A ) S p l i t I n f o r m a t i o n A ( D ) ,
    where the splitting attribute selected will be the one with the maximum gain ratio. It must be taken into account that as the divided information approaches 0, the ratio becomes unstable.
  • Gini index. It measures the impurity of D, a data partition or set of training tuples as (5):
    G i n i ( D ) = 1 i = 1 m p i 2 ,
    where p i is the probability that an arbitrary tuple in D belongs to class C i and is estimated by | C ( i , D ) | / | D | . The sum is computed over m classes. Each attribute is split in a binary way. In this situation, a weighted sum of the impurity of each resulted partition is computed, as it can be seen in the following example (6).
    G i n i A ( D ) = | D 1 | | D | G i n i ( D 1 ) + | D 2 | | D | G i n i ( D 2 ) .
    For a discrete-valued attribute, the subset that provides the minimum Gini index for the considered attributed is selected as the splitting subset. In case of continuous-value attributes, it is common to establish the set point in the middle of the interval values.
Each of the described indexes has its own bias: Information gain tends to prefer unbalanced splits in which one partition is much smaller than the others are. On the other hand, Gini index prefers multivalued attributes as well, but also has difficulty when the number of classes is large. Gain ratio reduces the bias exhibited by the information and Gini index measures, but ultimately the best choice will often depend on the data.

2.2. Building Pathologies Databases

In this section, a number of existing databases of pathologies is presented, with the aim of having a reference on the most frequently ones found in buildings, and which information is available. The CIB report (International Council for Research and Innovation in Building and Construction) was analysed. It mentions a real need to recover information from experience and knowledge [27] (p. 8): “[…] the necessity of collecting, recording and evaluating data, to cost/benefit analysis and to providing information to involved bodies like: regulations and code makers, designers, contractors, implementers of quality assurance systems, insurance companies, planners, and so forth. Such output can be quite different for different users of the information. It mainly comprises: number and/or frequency of several specific defects, actual causes, characteristics of the degradation process, losses or costs involved and appropriate remedial and/or preventive measures.”
There are some examples of attempts to create a database or fault catalogue that collect this information. However, not all of them are open, and they are not presented in the same format. CIB Committee W086 (Building Pathology Commission) started this in their 1993 report, defining a possible methodology to follow [27]. Their main objective was to produce information that can assist in the diagnosis and prevention of significant defects and failures in the design, construction and use of buildings, and additionally, consider technical aspects of defects [31].
CIB defines a pathology as the systematic treatment of building defects, their causes, their consequences and their remedies. On the other hand, the ISO15686-1:2011 standard [32] explains that a defect is a fault or deviation from the intended level of performance of a building or its parts, considering the levels of performance in terms of: Mechanical resistance and stability; safety in case of fire; hygiene, health and the environment; safety and accessibility in use; protection against noise; energy economy and heat retention; and sustainable use of material resources [14]. To sum up, the term pathology is the systematic study of diseases with the aim of understanding their causes, symptoms and treatment and, in the context of buildings, it requires a detailed knowledge of how they are designed, constructed, used and changed, and how environmental conditions can affect them [31]. Otherwise, a building defect can be considered as a failing or shortcoming in the function, performance or user requirements of a building, and might manifest itself within the structure, fabric, services or other facilities of the affected building [31].

Existing Pathology Databases

The following databases offer information about pathologies in buildings. Not all are accessible for free, and the most relevant aspects related to each of them are described as follows:
  • Technische ABC-lijst by Woningborg (The Netherlands) [33]. This database mainly contains attention points and recommendations for building designers and building constructors, but not many typical pathologies are described. The searching tool allows to look for information by a set of predefined fields (construction products, regulatory aspects, design features). A license is required to create a user account.
  • Danish Building Defects Fund by Byggeskadefonde (Denmark) [34]. This website belongs to a privately owned institution established in 1986, same year of the law on public housing in that country. The Fund comprises publicly subsidised housing and also publicly subsidised renovations. The database offers information from 1 to 5 year inspections carried out since 1997 (in Danish), and no login is required. Among the aspects included in the inspection, the following building elements can be mentioned: Excavation foundations and basement, structural and stabilizing elements, exterior walls, roof constructions, wet room, floor and building drainage, water, heat and ventilation, concrete in an aggressive environment and other elements. The search engine allows to search by type of building, but not by technical aspect, which impedes the query for our purpose.
  • Schadis—Die Datenbank zu Bauschäden by Fraunhofer Institut IRB (Germany) [35]. This site, offered by Fraunhofer-Informationszentrum Raum und Bau IRB, represents the largest collection in the field of building pathologies in German. It contains information from over 700 books, articles and reports, and can be accessed online under license.
  • The Building Pathology Study Group by PATORREB (Portugal) [36]. This website provides a pathology catalogue compiled by a set of Portuguese universities. Pathologies can be consulted by location (roof, external wall, basement wall, etc.), and for each of them, a set of typical problems are listed and described. An account is required, otherwise, only an example can be accessed.
  • Agence Qualité Construction by REX BBC (France) [37]. This agency has developed a database that comprises several pathology reports called SYCODÈS (SYstème de COllecte des DÉSordres). This website, produced by the AQC and funded by the PRACTE program, the ADEME and the AQC, provides technical resources for trainers and players in high performance construction and renovation. Information is organized in several areas such as opaque walls, glass walls, heating and cooling, Domestic Hot Water (DHW), ventilation, lighting and specific electricity, steering, electricity production, organizational aspects and regulations. Each area contains short articles of good practice examples and links to reports, guides, technical information and reference texts.
The information is also provided in the form of reports, as in [38], where it is possible to find details such as common errors in the construction of precast elements that affect energy efficiency for the design, construction and maintenance phases of the process, to give a few examples. These construction errors, being related to energy efficiency, are the closest to the problem analysed in this research. The CIB report in 1993 [27] already highlighted the need to create databases that collect information on pathologies in buildings from the experience and knowledge of the agents involved. However, nowadays, the data sources in this term have not reached a consensus about the way of displaying the information, and often they are tools for private use or not free of charge. The different accessibility options depending on the database and the variety in the way the information is presented, which is not aimed at finding information on specific characteristics, means it is still necessary to have experts involved in processes such as the one intended to be carried out in this research.
In the case of energy renovation, three main constructive elements of the building are considered: Openings (doors and windows), roofs, and external walls. The work in [39,40] includes technical specifications linked to each of these elements: Actions related to the replacement of doors and windows consist in guaranteeing some values for the heat-transfer coefficient and the air ventilation rate; in the case of thermal insulation of roofs, control on the kind of material, bulk density, heat-transfer coefficient, thermal conductivity of the insulation, tensile/compressive strength and dimensional stability; finally, for the thermal insulation of exterior walls, similar actions to those of roof insulation are required, by checking the kind of material, bulk density, heat-transfer coefficient, thermal conductivity of the insulation, tensile/compressive strength and dimensional stability.
This strategy is in accordance with the building information that may normally be available: the data provided in the IFC file regarding materials, dimensions and characteristics of the three main constructive elements on the buildings (windows, walls and roof) can be used in order to perform a thermal analysis of the building. Moreover, regulation is different depending on the country or even in the area in the country (for example, in Spain 5 different climatic zones are considered). All these aspects allow defining the approach to be followed, which is explained in Section 3.

2.3. TABULA Solutions Catalogue

The overall objective of the TABULA-EPISCOPE project [41,42] was to make the energy renovation processes in the EU housing sector transparent and efficient. As a main outcome, a concerted set of energy performance indicators is provided. It focuses on residential building typologies and contains data on buildings’ energy needs, costs, demand, emissions and so forth per climate zone, construction year classes and buildings’ characteristics. According to the information in the TABULA WebTool [25] on the most common ECMs to be applied to walls and roofs, considering the year of construction of the building and the type (multi-family house or apartment), as well as its location, a summary table was prepared for the countries under study in this research. Table 1 shows the summary of measures extracted from TABULA for Germany. Moreover, the total number of solutions provided by TABULA is greater than the sample shown here. The main objective has been to simplify the set of solutions, and make them as homogeneous as possible, even for different countries, which have elements in common. It should be noted that the solutions for France are not fully described on the website, so the same measures have been considered for France as those used in Spain to check the availability of the approach.

3. Diagnosis and Optimisation Algorithm Using ML

The proposed algorithm exploits the ability of ML techniques to detect already existing building defects that need to be solved through deep renovation and whose information can be identified using an IFC file of the building. The overall concept is shown in Figure 3 and was implemented into a simple tool for demonstration and validation purposes. Depending on the set of measures to be applied, the algorithm will provide the most convenient renovation solution. If the set of constraints is too limiting, additional alternatives should be considered. Details about each solution, which are structured in three pillars (windows, walls and roofs), will be explained later in this section.

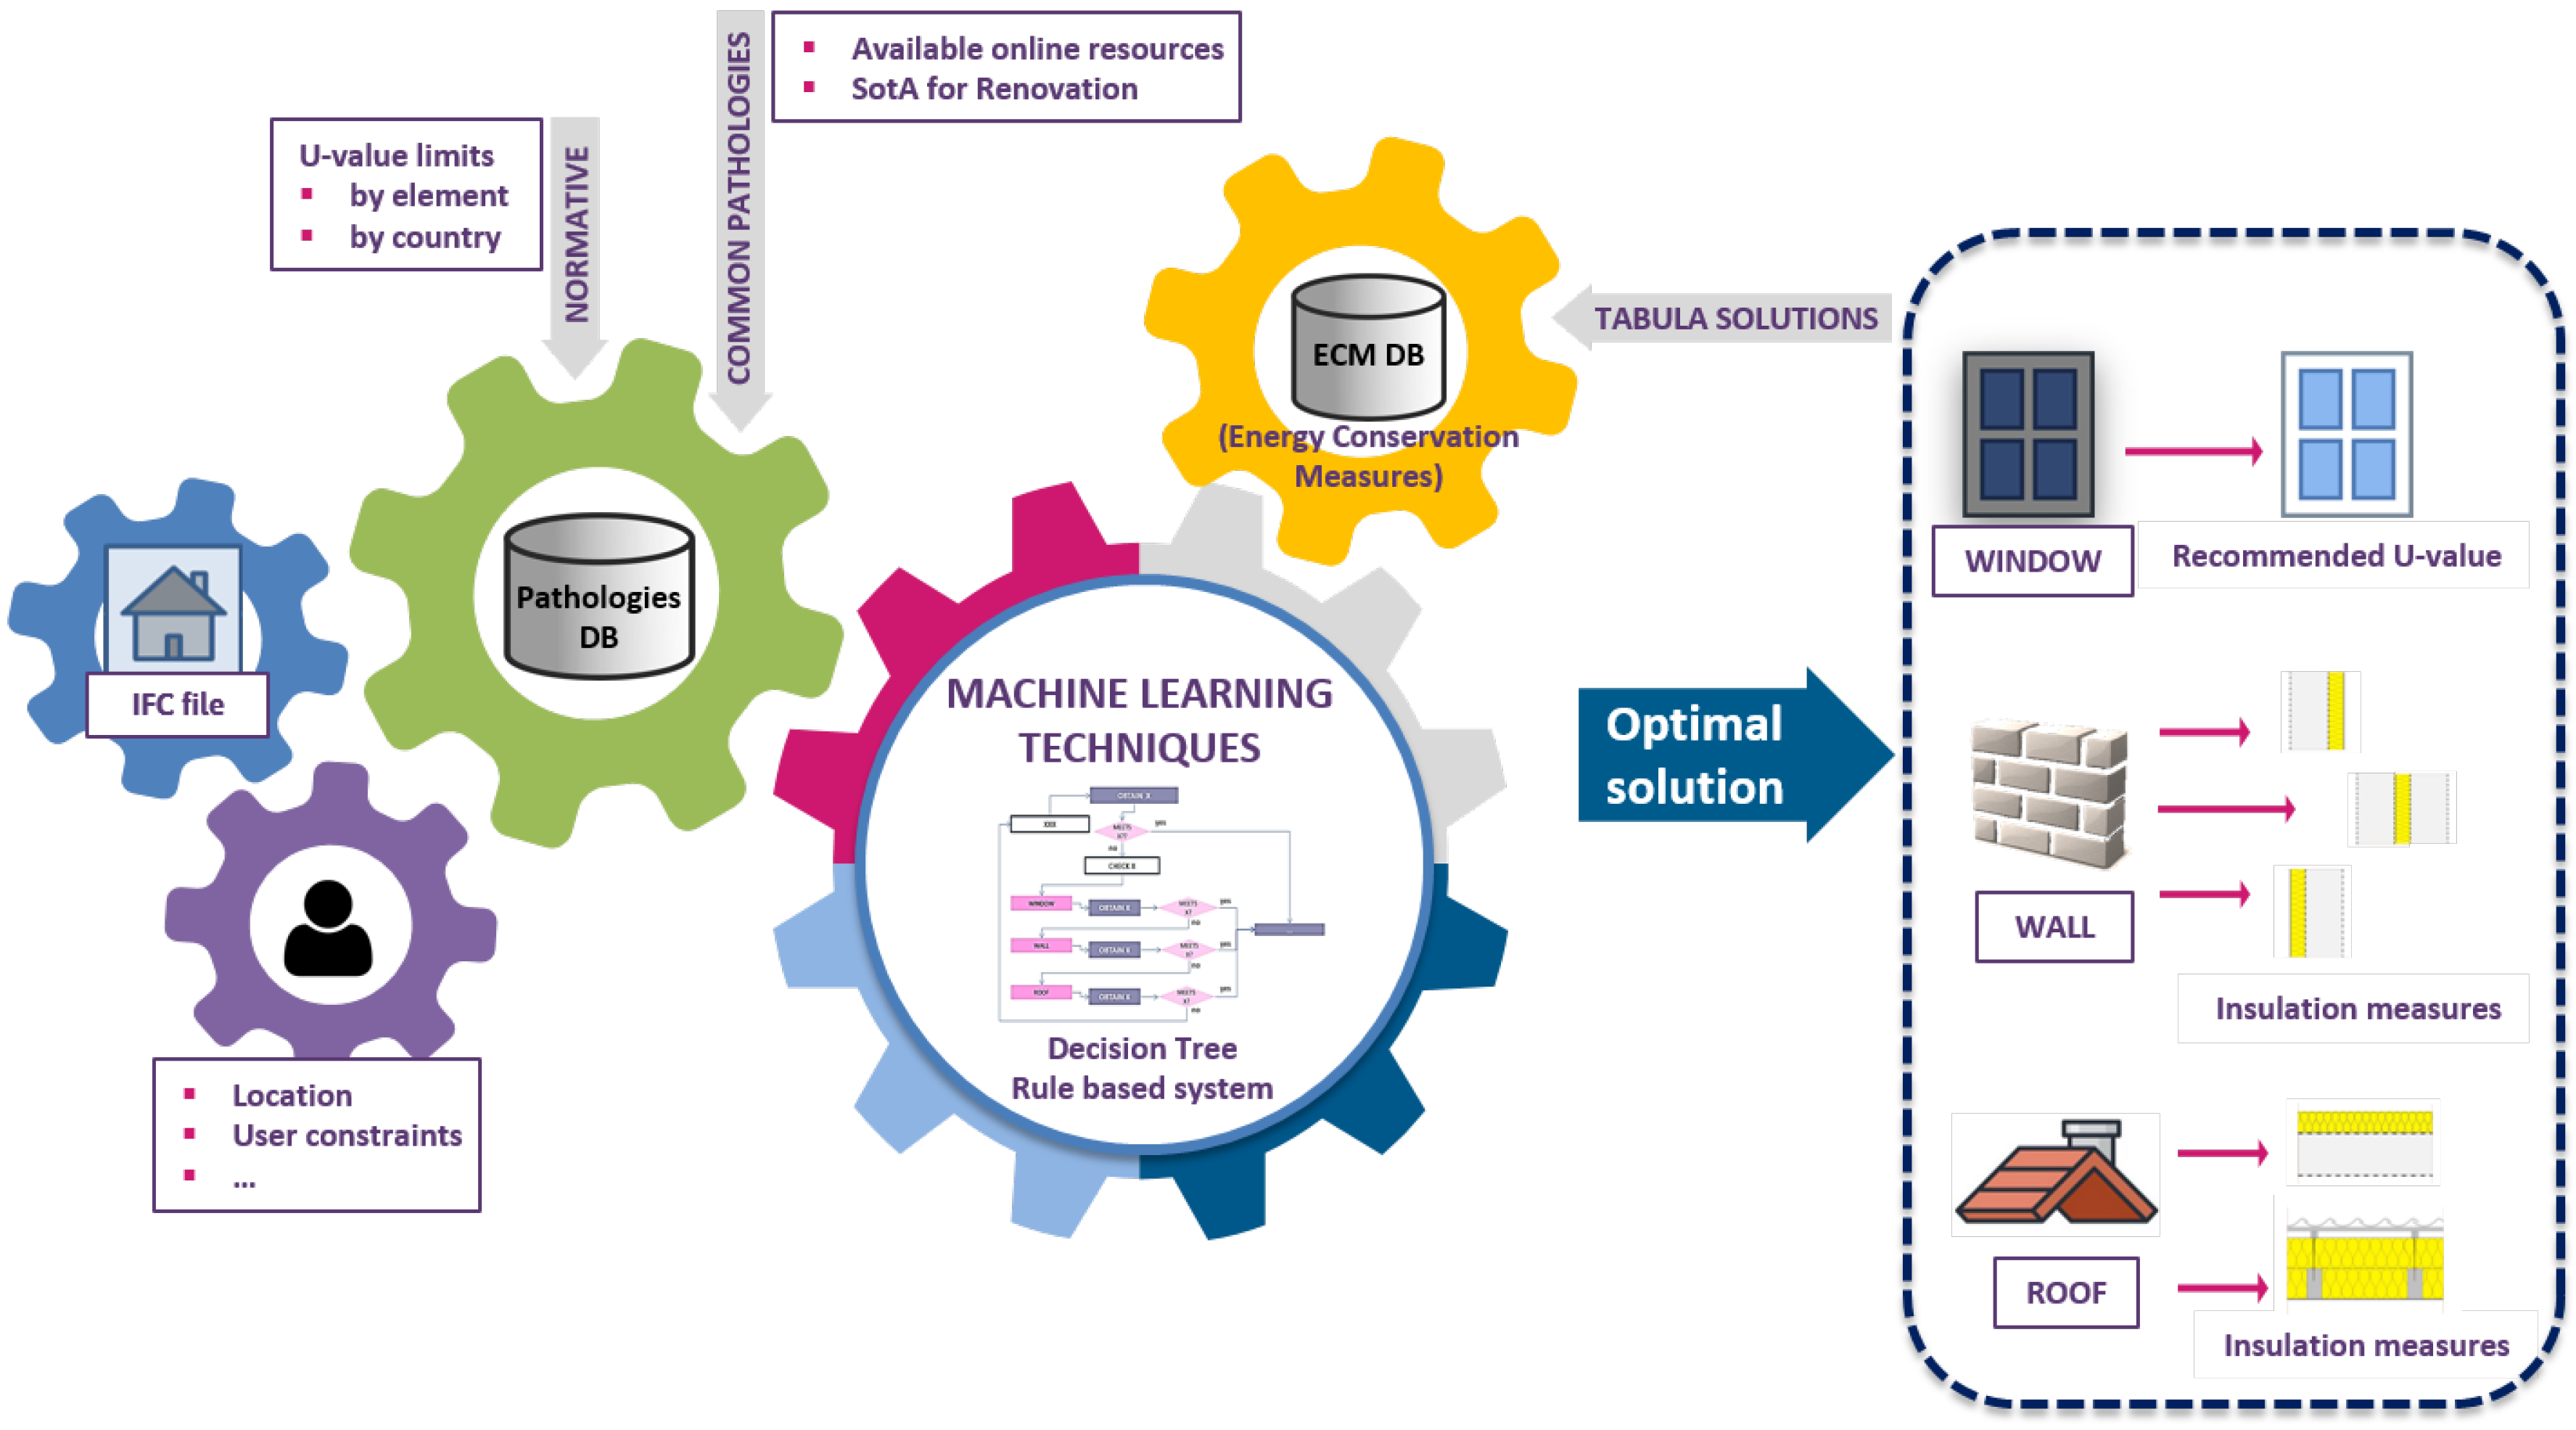
3.1. Data Acquisition

There are two main data sources to define the context of the case into analysis: information about the building contained in the IFC file and other contextual data or restrictions that must be considered. Some of these parameters are asked to be entered by the user providing a simple, user-friendly interface, whereas the rest is automatically read from the IFC file. The IFC represents a data model shared among different actors in a project. It is a standardized, digital description of the built environment, including buildings and civil infrastructure. It is an open, international standard, vendor-neutral, and usable across a wide range of hardware devices, software platforms and interfaces for many different use cases. Its schema comes from the primary technical deliverable of buildingSMART International [43], with the aim of promoting openBIM. It codifies in a logical way: the identity and semantics, the characteristics/attributes and relationships of objects, abstract concepts, processes and people. IFC4 (ADD2-TC1 schema version, ISO 16739-1:2018 [4]) is supported by the diagnosis tool and future versions of IFC will be considered in next versions of the tool.
The way to capture the IFC information is through the IfcOpenShell library [44]. IfcOpenShell is an open source library which helps users to work with the IFC file format. It can be used to edit, add new codes to the .ifc file and to export information. IfcOpenShell also uses Open CASCADE (the Open CASCADE Community Edition) internally to convert the implicit geometry in IFC files into explicit geometry that CAD (Computer-Aided Design) software can understand. IfcOpenShell is used in python language [45].
The relevant parameters read from the IFC file have been carefully selected to perform the thermal analysis, considering them as elements commonly included in the file with the building model, with the aim of extending the use of the approach. Some of them are very basic, such as windows, walls and roof dimensions, materials, and its relationships. The most critical one is the U-value (heat transfer coefficient) related to the element, which is considered as key factor to perform the analysis.
The information that is requested from the user is related to the constraints to take into account before selecting the measures. For example, in case of listed buildings, it is often not permitted to thermally insulate the façade. In another hypothetical case, it may be necessary to restrict wall interventions only to the external side of the building, due to the available space and to avoid overly intrusive activity for end users.
Figure 4 shows the user-interface created to collect the problem constraints of the case under analysis as well as to launch the calculation process.

3.2. Design of the Algorithm

Once the sources of information on building pathologies and their convergence with the possibilities offered by the IFC file have been explored, the next step is to define those building defects to be sought and solved. After that, measures to be taken addressing each situation need to be defined.

3.2.1. Definition of Building Pathologies According to the Algorithm Design

Pathologies have been defined as those situations in which the building cannot comply with regulations in force in the corresponding country regarding buildings’ thermal properties. The algorithm has been designed to be able to check if the values for the transmittance of the thermal envelope are in the desired range. This verification is done at two different levels: For each constructive element separately (window, wall, roof), and for the building as a whole. Range values considered for each country come from national regulations. The thermal envelope of the building should comply with a set of conditions. For example, the thermal transmittance of each element that belongs to the thermal envelope should not exceed a certain value. Table 2 includes which data sources are used to define these limits for each of the selected countries.
The second level validation is related to the global heat transfer coefficient for the entire building thermal envelope (called K or K A V E ), or a part of it. Similarly, the targeted value should not exceed the limit given in regulation. This parameter can be calculated as follows (7):
K A V E = i w i n d o w s A i · U i + j w a l l s A j · U j + k r o o f s A k · U k i w i n d o w s A i + j w a l l s A j + k r o o f s A k .
As an example, the Technical building Code in Spain determines a limit K value for private residential use, that depends on the compactness of the building and the climatic zone where it is located (Table 3).
In the case of France, no unique K value for the entire building is given, as it will depend on the characteristics of the different building elements for which maximum U-values are specified instead. The existing regulation [49] states that the global K value of the building ( U b a ^ t ) cannot exceed a maximum heat loss coefficient ( U b a ^ t m a x ). It is determined according to the building use, the heat loss coefficient for a reference building ( U b a ^ t b a s e ) and a specific coefficient ( C t d ) corresponding to the fraction of external heat transfer walls and openings within the whole building envelope area (including surfaces adjacent to other buildings). U b a ^ t m a x is defined as follows for residential buildings (8):
U b a ^ t m a x = U b a ^ t b a s e · 1.25 · C t d .
According to this regulation, the global K value for the reference building ( U b a ^ t b a s e ) has to be considered as follows, where lowercase coefficients ( a i ) represent predefined heat loss coefficients for a set of building components, and the uppercase variables are associated to such components including surface areas ( A i ) and linear parts ( L i ) of the building:
U b a ^ t b a s e = a 1 A 1 + a 2 A 2 + a 3 A 3 + a 4 A 4 + a 5 A 5 + a 6 A 6 + a 7 A 7 + a 8 L 8 + a 9 L 9 + a 10 L 10 A 1 + A 2 + A 3 1 + A 4 + A 5 + A 6 + A 7 .
The algorithm performs the validation of these parameters following the flow depicted in Figure 5. The sequence of activities has been designed giving priority to the least intrusive measures. That is why it starts with the validation of windows, continuing with walls in case that no solution is found, and finally, considering the renovation of roofs. The same criteria is applied to structure the sequence of measures proposed for the walls, starting with the possibility of inserting insulation in the air cavity, continuing with the insulation on the exterior surface, or finally, installing insulation on the inside of the building. In case of roofs, the criteria are slightly different, since in case of a sloped roof it is preferable to install insulation inside. This intervention has been considered much easier to execute than the one in which the insulation is placed on the outer layer of the roof. The latter is considered for the rest (i.e., the non-sloped) of the roof intervention alternatives.

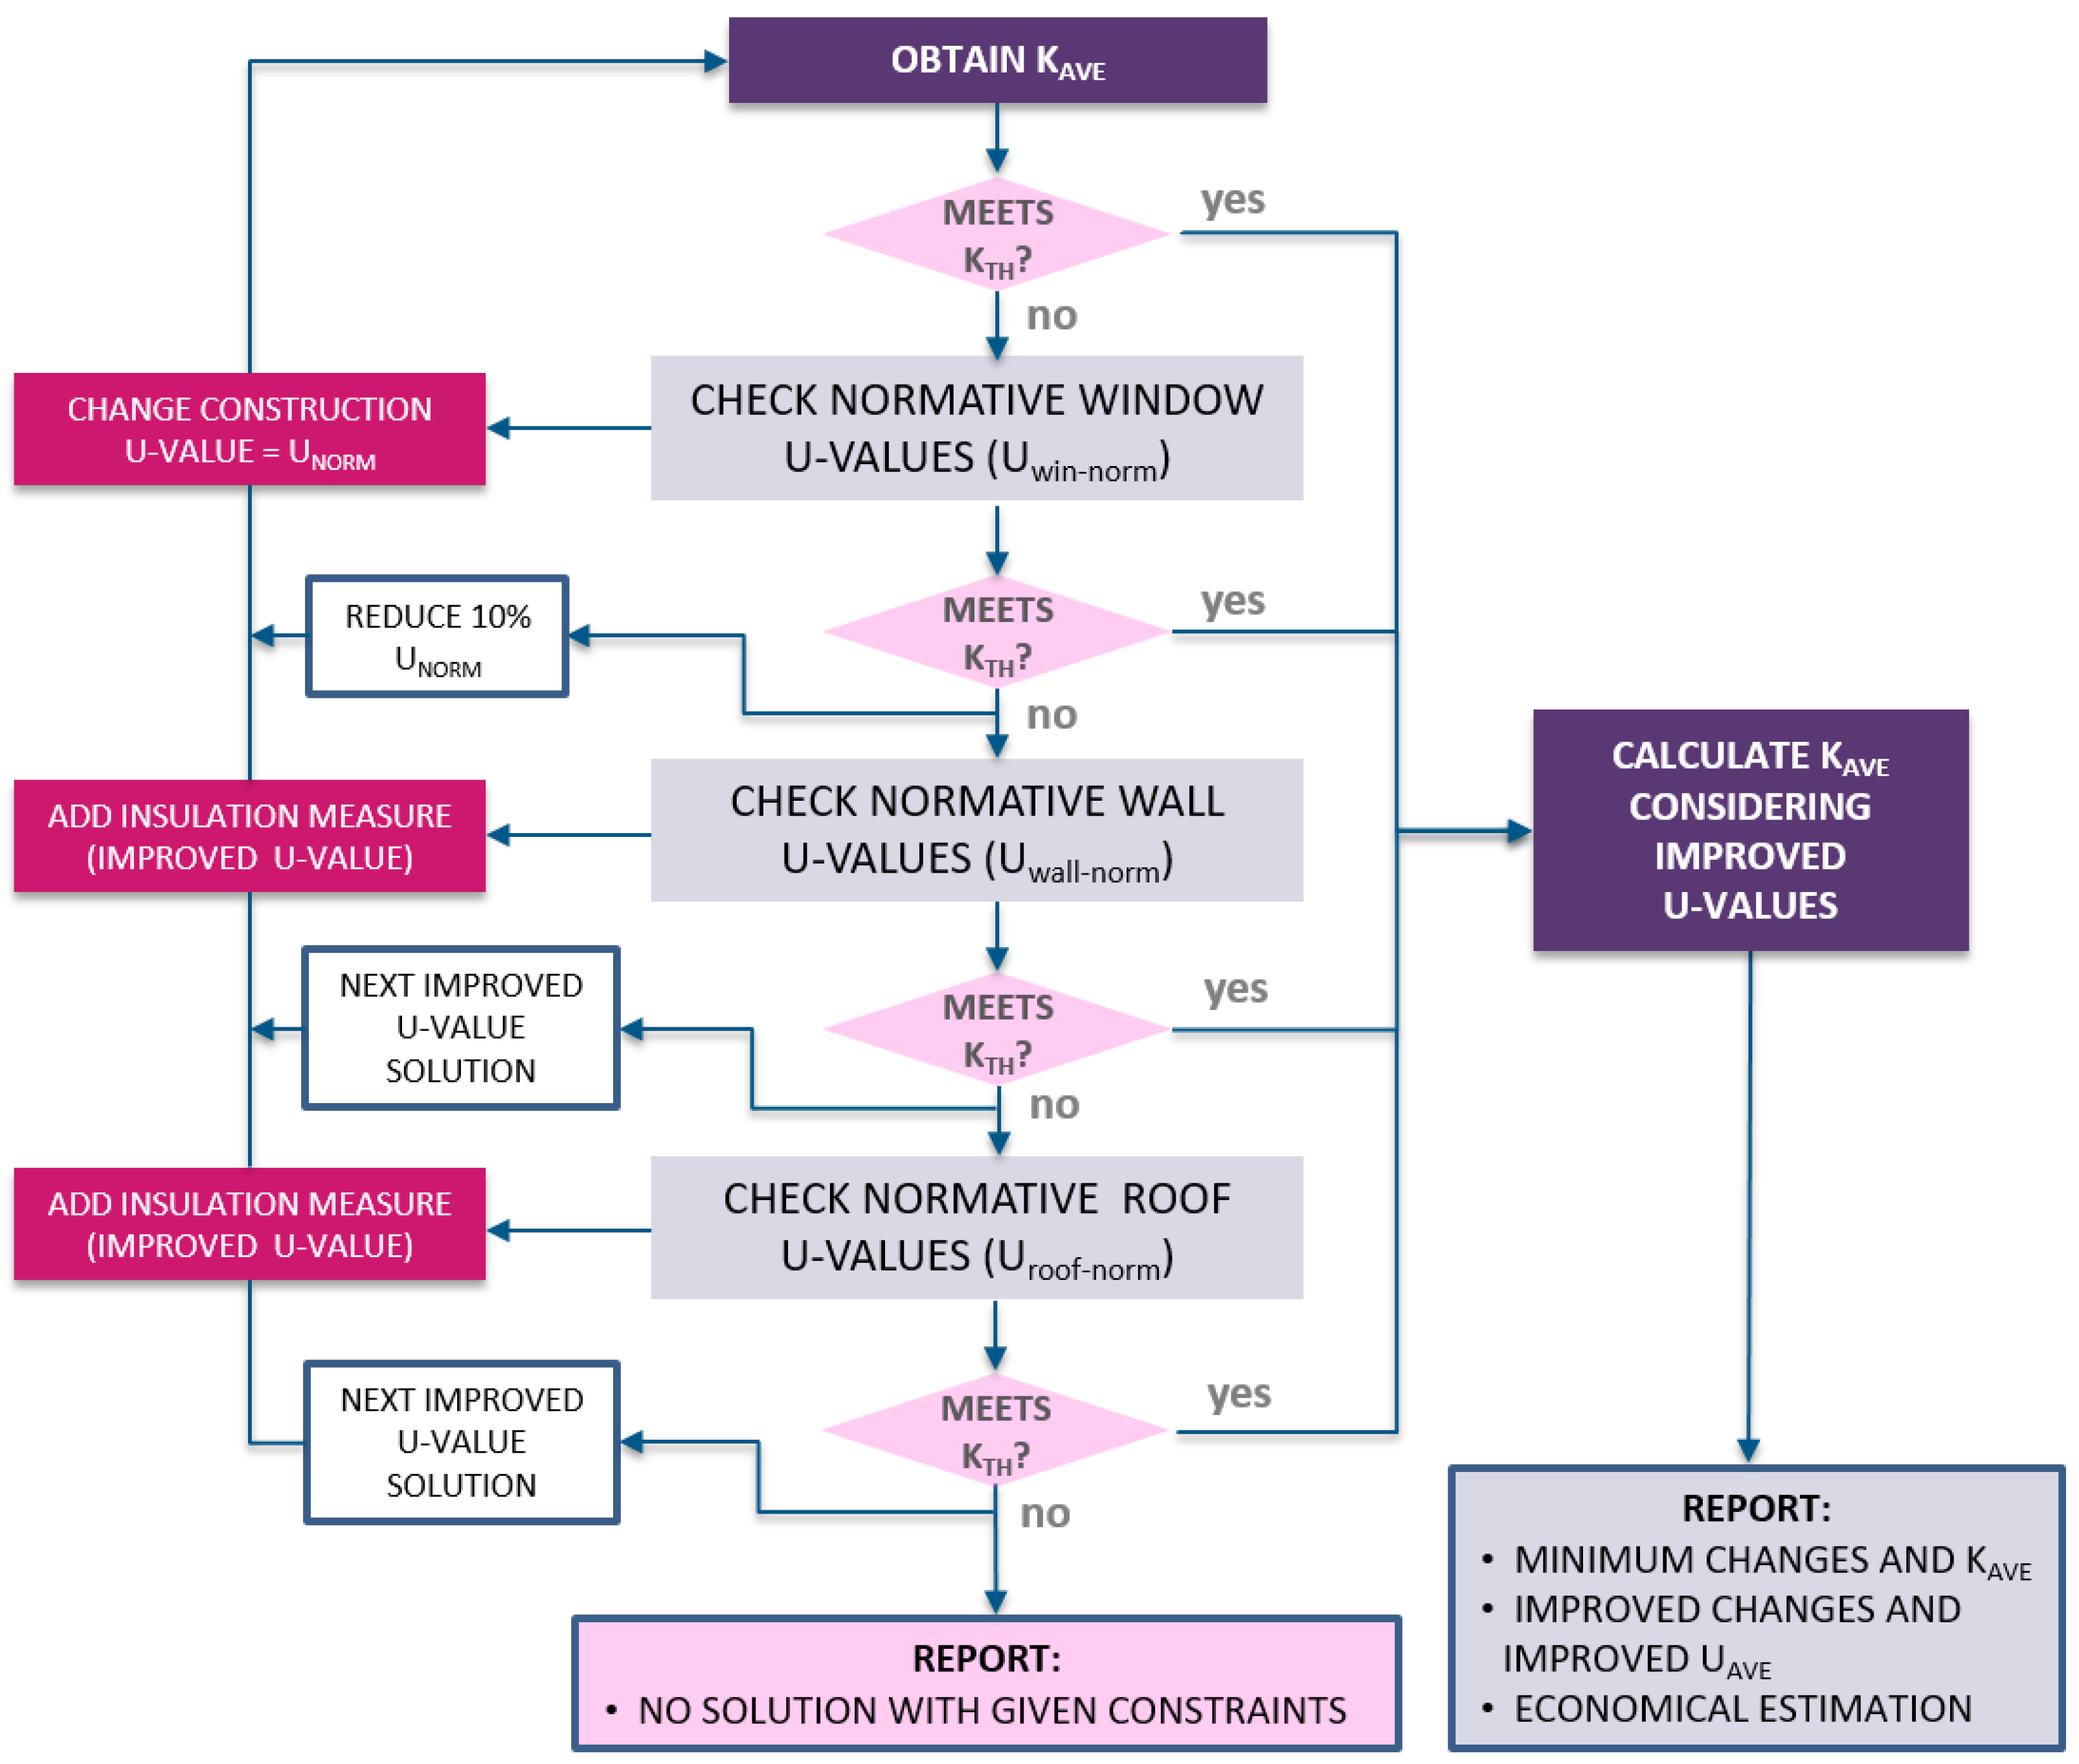
3.2.2. Decision Logic Implemented by the Proposed Algorithm

The sequence of activities implemented by the proposed algorithm is the following:
  • If the global heat transfer coefficient of the whole building envelope exceeds the given limit, the heat transfer coefficient of the windows is checked. The first correction would be to use a new window element, with a heat transmission coefficient according to the respective regulation. If the problem remains unsolved, a new iteration is performed, reducing the U-value of the window by 10%. Again, if the desired limit is still not reached, a second iteration is carried out, now considering a much bigger improvement that will be explained later in the solutions catalogue. This second iteration is conditioned by real market solutions, where it can be verified that there is a significant jump in the value of the heat transmission coefficient of the windows depending on whether they incorporate double or triple glazing.
  • If the window renovation is not sufficient to address the problem and an intervention on the wall is possible, the algorithm continues to check the U-values of the walls. The process at this level is quite similar to the previously mentioned problem existing for windows, but in this case, it is almost impossible to transform the U-values of the walls exactly to the limit value. Therefore, at this stage, two possible measures are given for each kind of intervention. If all the solutions are applicable, the validation sequence would be to insert insulation at the wall cavity, or the outer or internal layer.
  • It is possible to select only one solution of this type, two or the three of them, always maintaining the prioritization sequence. As mentioned above, there may be a number of reasons to avoid considering any of them.
    • Cavity insulation: The algorithm first checks the presence of an air cavity and its thickness (has to be between 40 and 100 mm in order to consider it viable). In case it exists, first iteration would consider filling the entire cavity with a material with certain conductivity characteristics available in the market. A second iteration would be carried out if the desired levels are not achieved, this time considering a second material with a lower thermal conductivity.
    • Insulation on the external layer: the algorithm proposes an intervention with a specific material, with specific thickness and thermal conductivity characteristics according to the market options and the typical thickness values used in the country. If the desired limits are still not reached, a second iteration includes an improved performing solution, changing the used material, this time selecting one with a lower thermal conductivity. Again, if there is still not a solution, the algorithm iterates once again, this time changing the thickness of the material: The same materials considered before are included in the third and fourth iterations.
    • Insulation on the internal layer: The approach is the same as that followed for the insulation on the external layer.
  • If there is still no solution, the algorithm iterates once again, this time changing the thickness of the material: The same materials considered before are included in the third and fourth iterations.
  • If the insulation of the wall is not enough to address the problem, and an intervention on the roof is possible, the algorithm continues to check the U-values of the roof. The process at this level is quite similar to the one for walls. The algorithm first checks if the building has a flat or sloped roof, whereby two different paths are drawn depending on this feature.
    • Pitched roof: In case there is a slope, the first proposed intervention is to place insulation on the internal side of the roof (this requires access under the roof). A second iteration proposes an external measure: As explained above, it can be considered more intrusive although it is performed at the external side of the building.
    • Flat roof: In case the roof is flat, only external measures are proposed, taking into account a specific material, with specific thickness and conductivity characteristics according to market options and the typical thickness used in the country. The second iteration, again offers an improvement in thermal performance.
  • The algorithm has been defined so that it is not possible to continue with roof renovation without renovating the wall before.
If the set of constraints is so broad that it considerably limits the set of applicable measures, the algorithm may not find a solution. In that case, the output will encourage the user to launch the process again, considering some changes in the requirements. The solution obtained will be different depending on the country, since the range of limits in the regulation differs substantially.
This flow of operations is executed through a decision tree that is able to determine the most convenient solution according to predefined constraints and the main features of the building. Then, taking into account the steps outlined above, the tree is configurable (it depends on the constraints related to walls and roofs), and the total number of possible solutions is 25 (including the no solution output). Possible outputs are summarized in Table 4. The data used to train the model has been created synthetically, and considers the reference thermal parameters included in the flow diagram, to follow the sequence of operations established for the decision.

3.2.3. Solutions Catalogue Definition

Information gathered from the TABULA WebTool has been adapted to real solutions, considering commonly-used products on the market, whereby a cost estimate by adapting the prices available at [50]. The following lines provide some clarifications for the most common measures of each country:
  • SPAIN: In this context, the solutions provided for walls include the possibility of adding insulation to the interior surface of the building, on the exterior surface (through External Thermal Insulation Composite System, ETICS), as well as the cavity inside the wall. ETICS is an easy technology in which all the works are made on site and is widely used in the European market [51]. Thanks to its application on the outside of the building is a solution that protects the structure of the building by protecting its exterior walls from atmospheric agents, and provides high indoor thermal comfort both in summer and winter, as has been proven in some studies such as [52]. In this solution different materials can be applied as thermal insulation, EPS (expanded polystyrene) being the most used material in Europe [51]. Generally, EPS has a good performance but the drawback is that it has poor fire performance (E fire class). Due to this poor fire properties, it is recommended to use it on the buildings until 25 m above the ground. Moreover, the solution with ETICS is relatively light and no reinforcing is needed. Considering this information, and the material thicknesses available on the market, the range values for them have been defined as shown in Table 5. Roofing solutions for roofs are also determined by these thickness limits.
  • FRANCE: No detailed information has been found in TABULA due to incomplete fields in the web site. That is why the same approach followed for Spain has been considered.
  • GERMANY: The solutions listed in TABULA include the possibility of adding insulation on the interior or exterior surface of the building. However, cavity wall insulation is also considered since the algorithm checks in advance if there is enough available space. As in the case of Spain, the solution of applying ETICS as external insulation is widely used in Germany since 1960s [53]. The thicknesses of the materials for the insulation on the exterior surface are different from those considered in Spain. They have been adapted to the solutions available in the market (the same for the roof insulation). Table 6 depicts this information.
  • POLAND: According to TABULA solutions, it is not clear if it is typical to apply the three types of measures considered for walls (not indicated). However, the most common renovation technique used in Poland consists of adding insulation on the external walls with ETICS using EPS as thermal insulation and an average thickness of 15–20 cm [51]. Insulating buildings from inside is not very common, it is used mainly on the buildings that are under cultural heritage protection. When it comes to the cavity, the number of buildings where it can be applied is rather low. Therefore, all three have been included, and material thicknesses have been adapted to the range values included here, both for walls and roofs. Detailed values are included in Table 7. Solutions for windows have also been explored. However, they are easier to characterize, since, depending on different configurations, expected U-values can be achieved. They are also accompanied by an economic estimate.

4. Results

In this section, the results of the diagnosis tool are presented. It should be noted that different framework conditions (e.g., those affecting legal, cultural or climatic aspects) are applicable to each country and might influence the proposed renovation solution for each scenario. Particularly, two main country-specific aspects are considered within the proposed algorithm. On one hand, different building legislation with different requirements for constructive elements (e.g., U-values) impose different constraints into the decision tree. On the other hand, different reference building renovation solutions, which are representative of national markets depending on the cultural and/or climatic characteristics of each region, define the set of possible ECMs investigated in each decision-support process. According to this, three building models have been tested in different EU locations. Two of them are based on the same building typology but with different material qualities for walls, windows, and roofs in each one. The third model considers the same material qualities as the second one, but differs on the type of roofing (flat roof in this case).
The locations selected to test these building models have been defined in four different EU countries: Spain, Poland, France and Germany. These countries, together with their corresponding available regulation in the building sector, have been chosen as representative of the main climatic zones in Europe. In the case of Spain, three cities located in three different climatic zones have been also selected. A file in IFC4 (ADD2-TC1 schema version) format has been generated for each type of the above-mentioned cases.

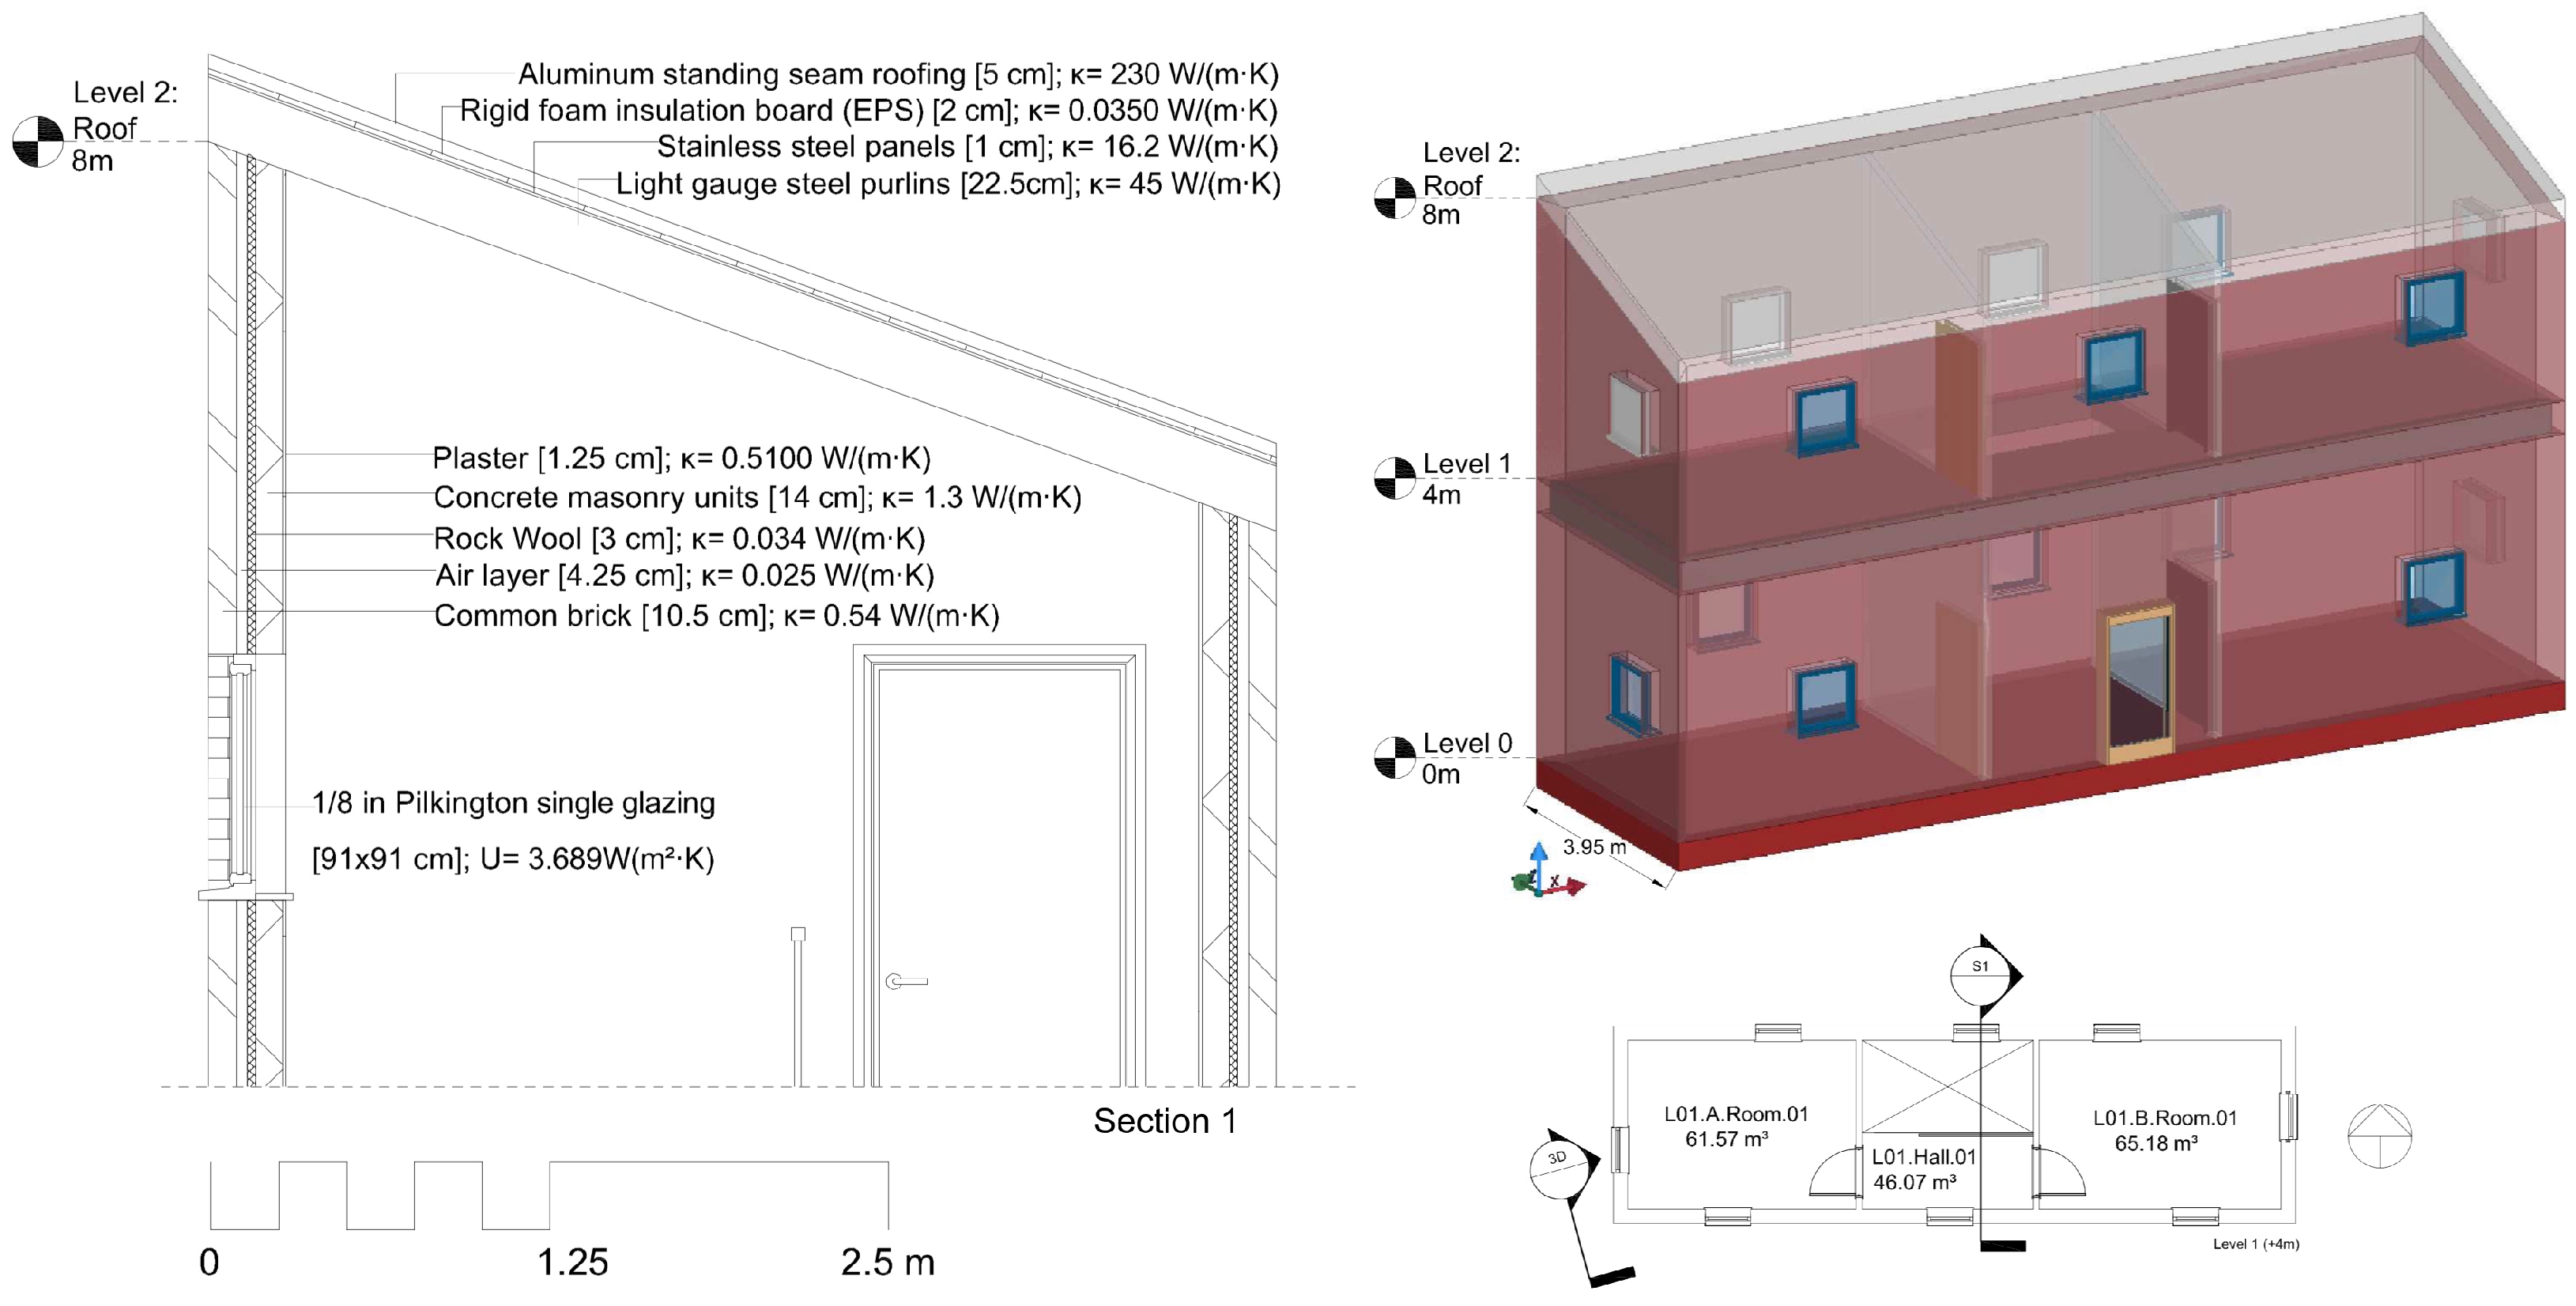
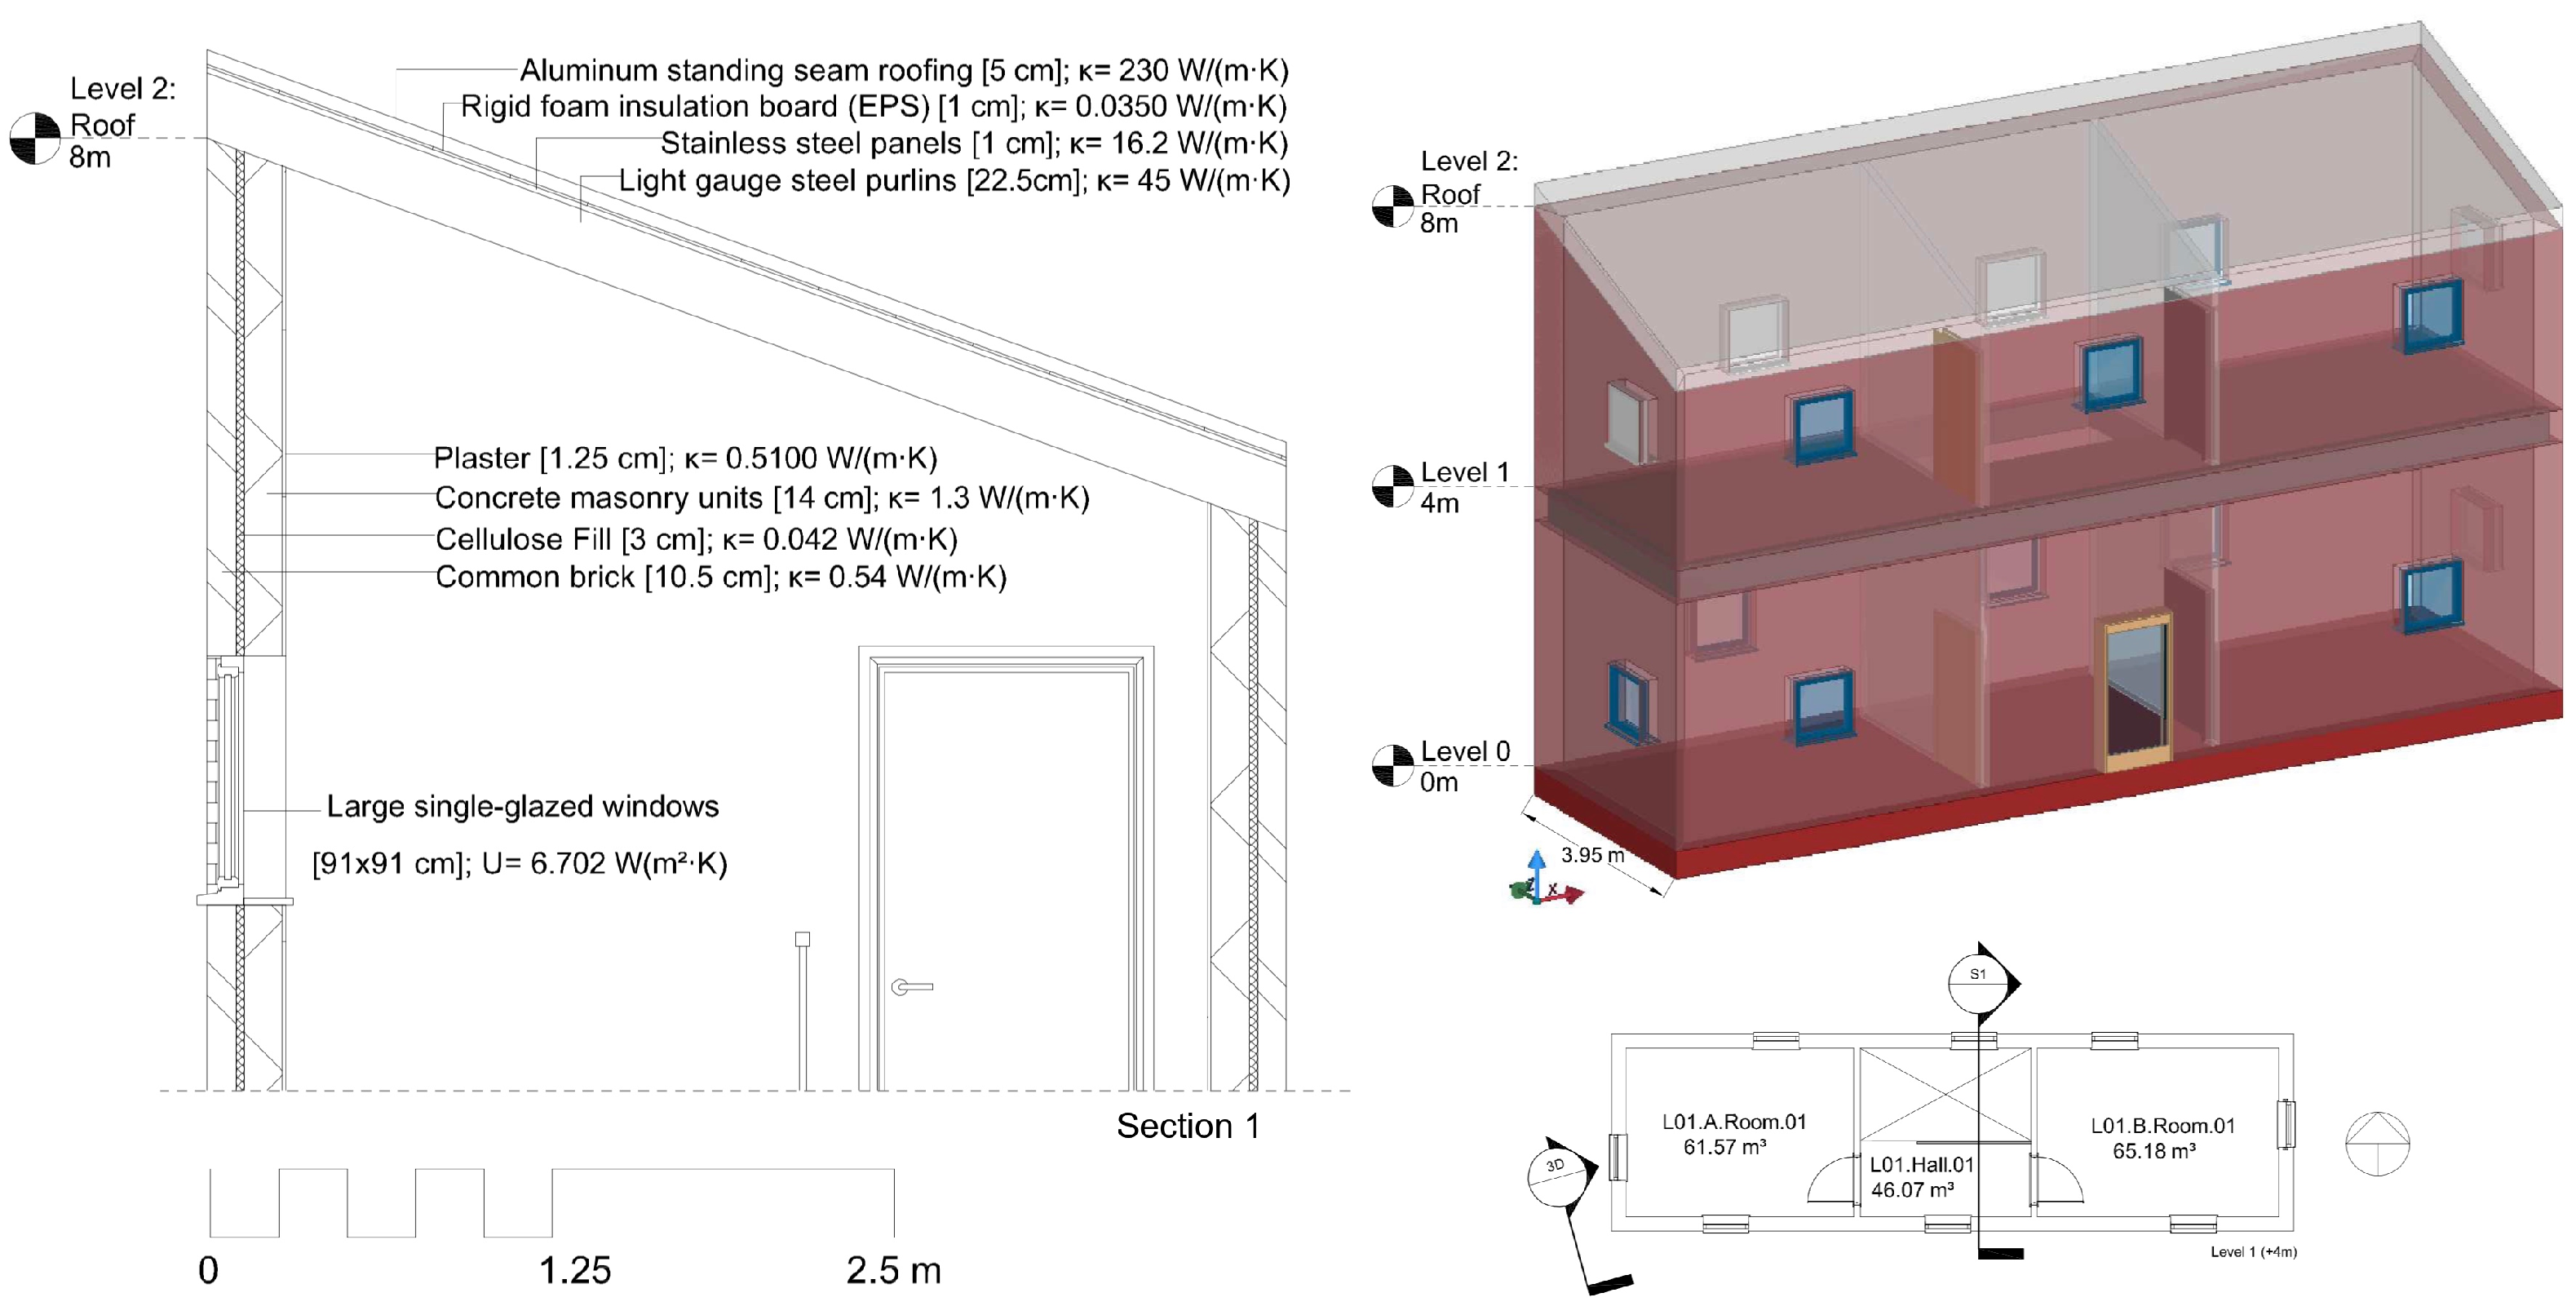
4.1. First Model: Medium Quality Building Prototype

The building tested in this first scenario is presented in Figure 6. The initial model of the building shows the characteristics listed in Table 8. After being evaluated by the diagnostic algorithm, the necessary interventions depending on the location of the building, as well as the final values obtained for the evaluated parameters, are included in Table 9.
As the results show in Table 9 for the medium quality model, the proposed outputs differ from one location to another. In the case of Spain, the measures are similar for cities located in zone A and C (double-glazing window solution). However, zone E, with colder climate conditions, requires a robust measure to reach the limit values according to the regulation, and it is necessary to include a triple-glazing window. In Poland and France it is sufficient to replace the window by one with a better thermal transmittance value, and for Germany, the requirements are higher and it is also necessary to apply insulation from the outside. According to slightly differences among window models, final cost varies. Among those countries whose solution includes a double-glazing window, K A V E final values are better for Poland and France, followed by Bilbao and Málaga (in that order). The variation in price presents a similar trend. The solution that includes a triple-glazing window is more expensive than the previous ones. Finally, the solution obtained for Germany makes it possible to achieve a much lower K A V E value but, on the other hand, the cost of the measures increases considerably, showing a value that is about three times higher than the previous ones.

4.2. Second Model: Low Quality Building Prototype

The building tested in this second scenario is shown in Figure 7. The initial model of the building presents the characteristics listed in Table 10. After being evaluated by the diagnostic algorithm, the necessary interventions depending on the location of the building, as well as the final values obtained for the evaluated parameters, are included in Table 11.
As can be seen in the outputs for the low quality model with a sloping roof shown in Table 11, the proposed solutions also differ depending on the location of the building. In the case of areas considered warmer, such as Málaga (zone A, Spain), the proposed solution includes the replacement of windows with a double-glazing window and insulation outside the walls. The thermal performance of this solution is worse and more expensive in economic terms than the solution chosen for Bilbao (zone C, Spain), León (zone E, Spain) or France. For the latter, the proposed solution includes a double-glazing window, insulation inside the walls, and insulation inside the roof. It is a more intrusive solution, but less expensive in economic terms according to the tool, and offers a significantly better thermal improvement. Finally, it should be noted that in the case of Germany, the set of measures selected are the same as for the previous locations (double glazing window, insulation inside the walls, and insulation inside the roof). However, the thermal transmittance threshold is more restrictive and it is necessary to include materials that guarantee a greater improvement in thermal performance values, which is accompanied by a higher economic cost.

4.3. Third Model: Low Quality Building Prototype with Flat Roof

The building tested in this third scenario is showed in Figure 8. The initial model of the building presents the characteristics listed in Table 12. After being evaluated by the diagnostic algorithm, the necessary interventions depending on the location of the building, as well as the final values obtained for the evaluated parameters, are included in Table 13.
Results obtained for the low quality flat roof model (see Table 12) include three combinations: The first, double-glazing window and insulation outside the walls, double-glazing window together with insulation inside the wall, and, finally, double-glazing window together with insulation inside the wall and insulation outside the roof. The first of the solutions has been selected for Málaga (zone A, Spain) and Poland. In the second case, the cost is higher, and is accompanied by a greater improvement in the global thermal performance. The solution, which includes a double-glazing window and insulation inside the wall, has been selected for Bilbao (zone C, Spain) and France. The cost of this solution, more intrusive than the previous one, is slightly higher in the second of the locations, linked to a greater thermal improvement. Finally, the solution that includes a double-glazing window, insulation inside the wall and outside the roof, has been selected for the coldest location in Spain, which is León (zone E) and Germany, which presents the most severe restrictions according to regulations. Again, in the second case the cost of the measurements is higher, but the overall thermal transmittance value obtained is better.
The decision tree model has been evaluated according to the most used metrics [26]. For this purpose, the data has been divided into a training set and a test set, considering 70% of the data for training and 30% to test performance. Starting with the accuracy, the model reaches a value of 0.86, therefore, the value obtained for the error rate is 0.13. Precision and recall measures have already been calculated, obtaining values of 0.86 for both of them. The same value has been provided for the F-score. The model shows good accuracy and can perform a good classification.
The following figures show an example of output results displayed to the user through the tool. It is also possible to view the decision tree that the algorithm has used in making decisions to select the most convenient solution (Figure 9 and Figure 10).

5. Discussion and Conclusions

This paper has described the potentials, constraints and workable solutions of the use of the machine learning/artificial intelligence approach at the design stage of deep renovation building projects. Machine learning techniques have been used for this purpose for a long time, in order to provide powerful mechanisms for dealing with problems in specific elements of buildings (from decision tables to knowledge-based systems or expert systems). Nevertheless, much of this information is not easy to find, takes a long time to be filled in, or needs to be provided by experts. That is why it is proposed here to use information about building elements included in the IFC data model to automate the process, focusing in this research on information on the thermal properties of building elements.
On the other hand, there are examples in the literature on the use of ML with IFC files. Some of them focus on detecting internal problems and inconsistencies, due to the importance of IFC integrity checking. Others try to find problems in geometry. Research has also been carried out on health and safety issues, as well as verifying compliance with building regulations. No examples have been found in the field of thermal pathologies, and it was identified as a possible problem to be addressed.
Some of the most commonly-used techniques for solving this kind of problem include decision trees, rule-based systems and experts systems, which is why a part of the research focuses on understanding how each of them works and is defined. Finally, due to the nature of the selected problem to be solved and based on the first conceptual developments of the proposed algorithm, the decision tree methodology was chosen.
In relation to the information available on the Internet on building pathologies, there are some databases that provide interesting material. However, some of them are licensed and offer the information with a different structure; sometimes it is even difficult to use their search engines. Once the problem was defined, another data source that was identified as being potentially useful was the TABULA WebTool [25], which provides information on different measures applied to the three main constructive elements in buildings for renovation, classified by country, type of building and year of construction.
The designed tool in the proof of concept aim is to respond to these thermal pathologies following a user-friendly approach, with the idea that it can be integrated with other tools and that an automatic calculation mechanism is provided. Additionally, it could be used by experts or even other kinds of users who do not need to have extensive knowledge on buildings. The results provided by the tool show that there are significant differences regarding the requirements, depending on the respective country (the regulations regarding buildings’ thermal properties are stricter in places like Germany), and even in different climatic zones of the same country (in the case of Spain).
To conclude, further research could be carried out in this field. Provided that other parameters related to building thermal information are included in the IFC model, the thermal performance analysis could be enriched and more specifications could be given on the proposed solutions (for example, including information about a building’s energy systems).

Author Contributions

Conceptualization, validation, resources, writing—original draft preparation and visualization, S.M.-P. and S.Á.-D.; methodology, investigation and writing—review and editing, S.M.-P., S.Á.-D. and M.A.-C.; software, formal analysis and data curation, S.M.-P.; supervision and project administration, S.Á.-D.; funding acquisition, S.Á.-D. and M.A.-C. All authors have read and agreed to the published version of the manuscript.

Funding

This research work has been partially funded under the research project “Harmonised Building Information Speedway for Energy-Efficient Renovation” (BIM-SPEED (accessed on 7 March 2021)). This project has received funding from the European Union’s Horizon 2020 research and innovation programme under grant agreement No. 820553 [54]. This research work reflects only the author’s view and the Commission is not responsible for any use that may be made of the information it contains.

Institutional Review Board Statement

Not applicable.

Informed Consent Statement

Not applicable.

Data Availability Statement

Publicly available datasets were analyzed in this study. These data can be found in [25].

Conflicts of Interest

The authors declare no conflict of interest.

Abbreviations

The following abbreviations are used in this manuscript:
AECArchitectural, Engineering and Construction
AIArtificial Intelligence
As-BuiltDrawings, models and documentation of the building as-constructed, including all deviations that have appeared in the construction phase
BIMBuilding Information Modeling
CADComputer-Aided Design
CIBInternational Council for Research and Innovation in Building and Construction
DHWDomestic Hot Water
DRDeep Renovation
ECMEnergy Conservation Measure
EEDEnergy Efficiency Directive
ETICSExternal Thermal Insulation Composite System
EPSExpanded polystyrene
EPBDEnergy Performance of Buildings Directive
GHGGreenhouses Gases
GUIGraphical User Interface
IFCIndustry Foundation Classes
KBSKnowledge Based System
MDPIMultidisciplinary Digital Publishing Institute
MLMachine Learning
NZEBsNearly Zero-Energy Buildings
OWLWeb Ontology Language
SPARQLSPARQL Protocol and RDF Query Language

References

  1. The European Commission. Commission Recommendation (EU) 2019/786 of 8 May 2019 on Building Renovation; Technical Report; The European Commission: Brussels, Belgium, 2019; Available online: https://eur-lex.europa.eu/legal-content/GA/TXT/?uri=CELEX:32019H0786 (accessed on 7 March 2021).
  2. United Nations Environment Programme. 2020 Global Status Report For Buildings and Construction: Towards a Zero-Emissions, Efficient and Resilient Buildings and Construction Sector; Technical Report; Global Alliance for Buildings and Construction: Nairobi, Kenya, 2020; Available online: http://www.un.org/Depts/ (accessed on 23 March 2021).
  3. The European Commission. Directive (EU) 2018/844 of 30 May 2018; Technical Report; The European Commission: Brussels, Belgium, 2018; Available online: https://eur-lex.europa.eu/legal-content/en/TXT/?uri=CELEX%3A32018L0844 (accessed on 8 March 2021).
  4. International Organization for Standarization (ISO). ISO 16739-1:2018—Industry Foundation Classes (IFC) for Data Sharing in the Construction and Facility Management Industries; ISO: Geneva, Switzerland, 2018; Available online: https://www.iso.org/standard/70303.html (accessed on 14 March 2021).
  5. Dimitrov, A.; Golparvar-Fard, M. Vision-based material recognition for automated monitoring of construction progress and generating building information modeling from unordered site image collections. Adv. Eng. Inform. 2014, 28, 37–49. [Google Scholar] [CrossRef]
  6. Wu, X.; Liu, X. Building crack identification and total quality management method based on deep learning. Pattern Recognit. Lett. 2021, 145, 225–231. [Google Scholar] [CrossRef]
  7. Shirowzhan, S.; Sepasgozar, S.M.; Li, H.; Trinder, J.; Tang, P. Comparative analysis of machine learning and point-based algorithms for detecting 3D changes in buildings over time using bi-temporal lidar data. Autom. Constr. 2019, 105, 102841. [Google Scholar] [CrossRef]
  8. Lamio, F.; Farinha, R.; Laasonen, M.; Huttunen, H. Classification of Building Information Model (BIM) Structures with Deep Learning. In Proceedings of the 2018 7th European Workshop on Visual Information Processing (EUVIP), Tampere, Finland, 26–28 November 2018; Institute of Electrical and Electronics Engineers Inc.: Piscataway, NJ, USA, 2019. [Google Scholar] [CrossRef] [Green Version]
  9. Ryu, M.; Truong, H.L.; Kannala, M. Understanding quality of analytics trade-offs in an end-to-end machine learning-based classification system for building information modeling. J. Big Data 2021, 8, 31. [Google Scholar] [CrossRef]
  10. Van Balen, K. Expert system for evaluation of deterioration of ancient brick masonry structures. Sci. Total Environ. 1996, 189–190, 247–254. [Google Scholar] [CrossRef]
  11. Moodi, F.; Knapton, J. Research into a Management System for Diagnosis, Maintenance, and Repair of Concrete Structures. J. Constr. Eng. Manag. 2003, 129, 555–561. [Google Scholar] [CrossRef]
  12. Bernat, E.; Gil, L. Aided Diagnosis of Structural Pathologies with an Expert System. Adv. Struct. Eng. 2013, 16, 379–393. [Google Scholar] [CrossRef] [Green Version]
  13. de Brito, J.; Pereira, C.; Silvestre, J.D.; Flores-Colen, I. Expert Knowledge-Based Inspection Systems; Springer International Publishing: Cham, Switzerland, 2020. [Google Scholar] [CrossRef]
  14. de Freitas, V.P. A State-of-the-Art Report on Building Pathology; CIB W086—Building Pathology Commission: Porto, Portugal, 2013. [Google Scholar]
  15. Lee, D.Y.; Chi, H.L.; Wang, J.; Wang, X.; Park, C.S. A linked data system framework for sharing construction defect information using ontologies and BIM environments. Autom. Constr. 2016, 68, 102–113. [Google Scholar] [CrossRef]
  16. Koo, B.; Shin, B.; Krijnen, T.F. Employing outlier and novelty detection for checking the integrity of BIM to IFC entity associations. In Proceedings of the 34th International Symposium on Automation and Robotics in Construction (ISARC 2017), Taipei, Taiwan, 28 June–1 July 2017; pp. 14–21. [Google Scholar] [CrossRef]
  17. Koo, B.; Shin, B. Applying novelty detection to identify model element to IFC class misclassifications on architectural and infrastructure Building Information Models. J. Comput. Des. Eng. 2018, 5, 391–400. [Google Scholar] [CrossRef]
  18. Krijnen, T.; Tamke, M. Assessing Implicit Knowledge in BIM Models with Machine Learning. In Modelling Behaviour; Springer International Publishing: Cham, Switzerland, 2015; pp. 397–406. [Google Scholar] [CrossRef]
  19. Lee, G.; Won, J.; Ham, S.; Shin, Y. Metrics for Quantifying the Similarities and Differences between IFC Files. J. Comput. Civ. Eng. 2011, 25, 172–181. [Google Scholar] [CrossRef]
  20. Lilis, G.; Giannakis, G.; Rovas, D. Detection and semi-Automatic correction of geometric inaccuracies in IFC files. In Proceedings of the BS2015: 14th Conference of International Building Performance Simulation Association (IBPSA), Hyderabad, India, 7–9 December 2015; pp. 2182–2189. [Google Scholar]
  21. Wu, J.; Zhang, J. New Automated BIM Object Classification Method to Support BIM Interoperability. J. Comput. Civ. Eng. 2019, 33, 04019033. [Google Scholar] [CrossRef] [Green Version]
  22. Eftekharirad, R.; Nik-Bakht, M.; Hammad, A. Extending IFC for fire emergency real-time management using sensors and occupant information. In Proceedings of the 35th International Symposium on Automation and Robotics in Construction (ISARC 2018), Berlin, Germany, 20–25 July 2018; pp. 985–992. [Google Scholar] [CrossRef] [Green Version]
  23. Gu, J.; Zhang, H.; Gu, M. Automatic Integrity Checking of IFC Models relative to Building Regulations. In Proceedings of the International Conference on Internet Multimedia Computing and Service, Xi’an, China, 19–21 August 2016; Association for Computing Machinery: New York, NY, USA, 2016; pp. 52–56. [Google Scholar] [CrossRef]
  24. Getuli, V.; Ventura, S.M.; Capone, P.; Ciribini, A.L. BIM-based Code Checking for Construction Health and Safety. Procedia Eng. 2017, 196, 454–461. [Google Scholar] [CrossRef]
  25. TABULA and EPISCOPE Projects. TABULA WebTool. Available online: https://webtool.building-typology.eu/ (accessed on 7 March 2021).
  26. Han, J.; Kamber, M.; Pei, J. Data Mining: Concepts and Techniques, 3rd ed.; Morgan Kaufmann, Elsevier: Waltham, MA, USA, 2012. [Google Scholar]
  27. Van den Beukel, A. Building Pathology: A State-of-the-Art Report; CIB W086—Building Pathology Commission: Rotterdam, The Netherlands, 1993. [Google Scholar]
  28. Giaratanno, J.; Riley, G.D. Expert Systems: Principles and Programming, 4th ed.; Course Technology Inc.: Boston, MA, USA, 2004. [Google Scholar]
  29. Tolun, M.R.; Sahin, S.; Oztoprak, K. Expert Systems. In Kirk-Othmer Encyclopedia of Chemical Technology; John Wiley & Sons, Inc.: Hoboken, NJ, USA, 2016; pp. 1–12. [Google Scholar] [CrossRef]
  30. Shannon, C.E.; Weaver, W. The Mathematical Theory of Communication; University of Illinois Press: Urbana, IL, USA, 1949. [Google Scholar]
  31. Watt, D.S. Building Pathology: Principles and Practice, 2nd ed.; Blackwell Publishing: Oxford, UK, 2007. [Google Scholar]
  32. International Organization for Standardization (ISO). ISO 15686-1:2011—Buildings and Constructed Assets—Service Life Planning—Part 1: General Principles and Framework; ISO: Geneva, Switzerland, 2011; Available online: https://www.iso.org/standard/45798.html (accessed on 23 March 2021).
  33. Woningborg-Groep. Technische ABC-Lijst. Available online: http://www.technische-abc.nl/ (accessed on 22 March 2021).
  34. Byggeskadefonden. Søg i Database Med Eftersyn. Available online: https://bsf.dk/eftersyn/sog-i-database-med-eftersyn (accessed on 22 March 2021).
  35. Fraunhofer IRB. SCHADIS—Die Datenbank zu Bauschäden. Available online: https://www.irb.fraunhofer.de/schadis/ (accessed on 22 March 2021).
  36. The Building Pathology Study Group. PATORREB. Available online: https://patorreb.com/ (accessed on 22 March 2021).
  37. Agence Qualité Construction (AQC). REXBP. Available online: https://www.dispositif-rexbp.com/des-ressources-classees-parthematique (accessed on 22 March 2021).
  38. INSITER Consortium. INSITER-D1.1: Best Practices and Existing Shortcomings. Technical Report. 2016. Available online: https://www.insiter-project.eu/en/research-results/d1-1 (accessed on 7 March 2021).
  39. Qi, Y.; Qian, Q.K.; Meijer, F.M.; Visscher, H.J. Identification of Quality Failures in Building Energy Renovation Projects in Northern China. Sustainability 2019, 11, 4203. [Google Scholar] [CrossRef] [Green Version]
  40. Qi, Y.; Qian, Q.; Meijer, F.; Visscher, H. Causes of Quality Failures in Building Energy Renovation Projects of Northern China: A Review and Empirical Study. Energies 2020, 13, 2442. [Google Scholar] [CrossRef]
  41. TABULA Project Partners. IEE Project TABULA. 2012. Available online: https://episcope.eu/iee-project/tabula/ (accessed on 23 March 2021).
  42. EPISCOPE Project Partners. IEE Project EPISCOPE. 2014. Available online: https://episcope.eu/iee-project/episcope/ (accessed on 23 March 2021).
  43. BuildingSMART Internacional. Industry Foundation Classes (IFC)—An Introduction. Technical Report. Available online: https://technical.buildingsmart.org/standards/ifc/ (accessed on 7 March 2021).
  44. Krijnen, T. IfcOpenShell. Available online: http://ifcopenshell.org/ (accessed on 7 March 2021).
  45. Krijnen, T. IfcOpenShell-Python: A Python Module Based on IfcOpenShell. 2020. Available online: http://ifcopenshell.org/python (accessed on 25 March 2021).
  46. Ministerio de Fomento. Documento Básico HE Ahorro de Energía; Technical Report; Ministerio de Fomento: Madrid, Spain, 2019. Available online: https://www.codigotecnico.org/pdf/Documentos/HE/DBHE.pdf (accessed on 22 March 2021).
  47. Bundesministerium für Wirtschaft und Energie. Energieeinsparverordnung vom 24. Juli 2007 (BGBI. I. S. 1519). Verordnung über Energiesparenden Wärmeschutz und Energiesparende Anlagentechnik bei Gebäuden; Technical Report; Bundesministerium für Wirtschaft und Energie: Berlin, Germany, 2016. Available online: https://www.enev-profi.de/wp-content/uploads/EnEV-2014-Lesefassung.pdf (accessed on 22 March 2021).
  48. Bekierski, D.; Gerylo, R.; Kaczorek, D. EPBD Implementation in Poland. Status in December 2016; Technical Report; Techniki Budowlanej; Przemysław Perczyński, Ministerstwo Infrastruktury i Budownictwa: Warszawa, Poland, 2016. Available online: https://www.buildup.eu/sites/default/files/content/ca-epbd-iv-poland-2018.pdf (accessed on 22 March 2021).
  49. Journal Officiel de la Republique Francese (JORF). JORF nº0184 du 8 août 2008. Arrêté du 13 Juin 2008 Relatif à la Performance énergétique des bâtiments Existants de Surface Supérieure à 1000 Mètres Carrés, Lorsqu’ils Font l’Objet de Travaux de Rénovation Importants. NOR: DEVU0813714A; Technical Report; Republique Francese: Paris, France, 2008. Available online: https://www.legifrance.gouv.fr/loda/id/JORFTEXT000019308241/ (accessed on 22 March 2021).
  50. CYPE Ingenieros. Generador de Precios de la Construcción; CYPE Ingenieros: Alicante, Spain, 2018; Available online: http://www.generadordeprecios.info/ (accessed on 30 March 2021).
  51. Pasker, R. The European Etics Market Facts & Figures; Technical Report; European Association for ETICS (EAE): London, UK, 2015; Available online: https://www.ea-etics.eu/files/dokumente-eae/4_ETICS_Forum/04_2015-10-10_ETICS_Forum_2015_European_ETICS_market_Pasker_02.pdf (accessed on 29 March 2021).
  52. Varela Luján, S.; Viñas Arrebola, C.; Rodríguez Sánchez, A.; Aguilera Benito, P.; González Cortina, M. Experimental comparative study of the thermal performance of the façade of a building refurbished using ETICS, and quantification of improvements. Sustain. Cities Soc. 2019, 51, 101713. [Google Scholar] [CrossRef]
  53. Künzel, H.; Künzel, H.M.; Sedlbauer, K. Long-term performance of external thermal insulation systems (ETICS). Acta Sci. Polonorum. Archit. 2006, 5, 11–24. [Google Scholar]
  54. BIM-SPEED Project Partners. Harmonised Building Information Speedway for Energy-Efficient Renovation (BIM-SPEED Project). 2018. Available online: https://cordis.europa.eu/project/id/820553 (accessed on 25 March 2021).
Figure 1. Architecture of an expert system (adapted from [29]).
Sustainability 13 06576 g001
Figure 2. Example of decision tree to determine whether to wait for the supplier to receive the required material. In addition, main components haven been highlighted in colours (own elaboration).
Sustainability 13 06576 g002
Figure 3. ML process for diagnosis and optimisation processes in deep renovation projects (own elaboration).
Sustainability 13 06576 g003
Figure 4. Graphical User Interface (GUI) of the Diagnosis Tool to request information and proceed with the analysis.
Sustainability 13 06576 g004
Figure 5. Flow diagram for the designed machine learning algorithm (own elaboration).
Sustainability 13 06576 g005
Figure 6. First building model under analysis: Medium quality building prototype. (Left) Construction section of the BIM model. (Right) 3D view of the IFC of the building and Floor Plan of level 1 (own elaboration).
Sustainability 13 06576 g006
Figure 7. Second building model under analysis: Low quality building prototype. (Left) Construction section of the BIM model. (Right) 3D view of the IFC of the building and Floor Plan of level 1 (own elaboration).
Sustainability 13 06576 g007
Figure 8. Third building model under analysis: Low quality building prototype with flat roof (Left) Construction section of the BIM model. (Right) 3D view of the IFC of the building and Floor Plan of level 1 (own elaboration).
Sustainability 13 06576 g008
Figure 9. Sample of information provided by the Diagnosis Tool about the decision tree algorithm.
Sustainability 13 06576 g009
Figure 10. Sample evaluation output provided to the user by the Diagnosis Tool.
Sustainability 13 06576 g010
Table 1. Summary of measures for Germany according TABULA database for the tipology Multi-house building/Apartment (Elaborated from data in [25]). Note: OR., original; Us.R., Usual Refurbishment; Ad.R., Advanced Refurbishment; Ins., Insulation; T.Ins.THK, Total Insulation thickness; Ext., External.
Multihouse Building/Apartment
YearStateRoof 1Roof 2Wall
–1918ORTitled roof with cavity between rafters Masonry of natural stones or bricks
Us.R.Insulate cavity between rafters (heighten rafters and clear interspace if necessary), T.Ins.THK 12 cm Add 8 cm of ins. on inner surface (air-tight cladding, water pipes must not be conducted in outer wall)
Ad.R.Insulate cavity between rafters + ins. layer, T.Ins.THK 30 cm Add 24 cm of ins. + plaster (ext. insulated render system), alternative: Curtain wall
1919–1948ORTilted roof with wood fiberboard plankingWooden beam ceilingBrickwork
Us.R.Insulate cavity between rafters (heighten rafters and clear interspace if necessary), T.Ins.THK 12 cmAdd 12 cm ins. above (+flooring if necessary)Add 12 cm of ins. + plaster (ext. insulated render system), alternative: Curtain wall (e.g., cellulose between timbers)
Ad.R.Insulate cavity between rafters + ins. layer, T.Ins.THK 30 cmAdd 30 cm ins. above (+flooring if necessary)Add 24 cm of ins. + plaster (ext. insulated render system), alternative: Curtain wall
1949–2001ORConcrete ceiling Masonry of hollow blocks or honeycomb bricks
Us.R.Add 12 cm ins. above (+flooring if necessary) Add 12 cm of ins. + plaster (ext. insulated render system), alternative: Curtain wall (e.g., cellulose between timbers)
Ad.R.Add 30 cm ins. above (+flooring if necessary) Add 24 cm of ins. + plaster (ext. insulated render system), alternative: Curtain wall
2002–2009ORTilted roof with 18 cm ins. Masonry with 14 cm render ins. system
Us.R.Insulate cavity between rafters (heighten rafters and clear interspace if necessary), T.Ins.THK 12 cm Add 12 cm of ins. + plaster (ext. insulated render system), alternative: Curtain wall (e.g., cellulose between timbers)
Ad.R.Insulate cavity between rafters + ins. layer, T.Ins.THK 30 cm 24 cm of external ins. brickwork + plaster (ext. insulated render system)
2010–2015OR18 cm ins. on ceiling + roofing 12 cm of ext. ins. brickwork + plaster (ext. insulated render system)
Us.R.35 cm ins. on ceiling + roofing 24 cm of ext. ins. brickwork + plaster (ext. insulated render system)
Ad.R.40 cm ins. (WLS 032) on ceiling + roofing 28 cm of ext. ins. brickwork + plaster (ext. insulated render system)
Table 2. Building regulations considered for admissible property ranges in each country. Note: EPBD, Energy Performance of Buildings Directive.
CountryRegulation
SpainBasic document HE (Energy Saving)—Technical Building Code (2019) [46]
GermanyEnergy Saving Ordinance-EnEV (2013) [47]
PolandImplementation of the EPBD in Poland (2016) [48]
FranceOrder related to the energy performance of existing buildings, when they are subject of major renovation work (2008) [49]
Table 3. K limit values [W/m 2 · K] for private residential use in Spain. Source: DB-HE Energy Savings [46] (Table 3.1.1.b-HE1). Note: V/A, Compactness, where V is thermal volume of the building envelope and A is the sum of the heat exchange surfaces with the outside air, or with the ground, of that thermal envelope; the limiting values of the intermediate compactness (1 < V/A < 4) are obtained by interpolation. In the case of extensions, the limit values will be applied only if the built-up area or volume increases by more than 10%.
CompactnessWinter Climate Zone
V / A [m 3 /m 2 ]ABCDE
New buildings and extensionsV/A 1 0.670.600.580.530.480.43
V/A 4 0.860.800.770.720.670.62
Changes of use.V/A 1 1.000.870.830.730.630.54
Renovations in which more than 25% of the total area of the final thermal envelope of the building is renovated.V/A 4 1.070.940.900.810.700.62
Table 4. Decision tree outputs.
CaseNumber of SolutionsDetails about Solutions
Tree ends in WindowUp to 3 + no solution
Tree ends in WallUp to 10 + no solution· 2 for insulation in cavity
· 4 for external insulation
· 4 for internal insulation
Tree ends in RoofUp to 2 + no solutionPitched roof:
· 1 for internal insulation
· 1 for external insulation
Flat roof:
· 2 for external insulation
Table 5. Proposed material solutions and costs for walls and roof (Spain and France). Note: ECM, Energy Conservation Measure; ETICS, External Thermal Insulation Composite Systems; Ext., Exterior; Int., interior; ins., insulation.
ECMs for Spain and FranceInsulation (Ins.)Finishing
Layer (FL)
Total Values
ECM (Ins. + FL)
LevelCategoryTypeThickness Ins. [mm]MaterialU-Value [W/(m2·K)]Thermal Resistance [(m2·K)/W]Conductivity [W/(m·K)]Cost [€/m2]U-Value [W/(m2·K)]Cost [€/m2]Total U-Value [W/(m2·K)]Total Thickness [mm]Total Cost ECM [€/m2]
FaçadeIns. at the Ext.ETICS (50 mm cement/mortar plaster + ins.)60Extruded polystyrene0.5561.8000.03610.241.60020.050.4126530.29
60Mineral Wool0.5711.7500.03419.611.60020.050.4216539.66
100Expanded Polystyrene0.3802.6300.03823.261.60020.050.30710543.31
100Extruded polystyrene0.3572.8000.03614.141.60020.050.29210534.19
Ins. in the
cavity wall
Insufflating thermal ins. inside the existing air chamber60Polyurethane foam0.5921.6900.0367.13--0.592607.13
Injection of thermal ins. inside the existing air chamber60Mineral wool0.5751.7390.03511.14--0.5756011.14
Int. ins.Plasterboard finish (ins. + 15 mm Plasterboard)60Extruded polystyrene0.5711.7500.03413.895.33317.490.5167531.38
60Expanded Polystyrene0.5261.9000.0328.715.33317.490.4797526.20
100Extruded polystyrene0.3572.8000.03622.325.33317.490.33511539.81
100Expanded Polystyrene0.3173.1500.03211.425.33317.490.30011528.91
Pitched roofExt. ins.Ins. of cavity between rafters100Extruded Polystyrene0.3802.6320.03824.66--0.38011524.66
Plasterboard finish (Ins. + 15 mm Plasterboard)100Mineral wool0.3702.7000.03821.945.33317.490.34611539.43
Flat roofExt. ins.60 mm of ins., geotextil filter and 100 mm gravel60Extruded Polyestyrene0.5671.7650.03413.320.87044.770.34316058.09
100 mm of ins., geotextil filter and 100 mm gravel100Extruded Polyestyrene0.3602.7780.03633.30.87044.770.25520078.07
Table 6. Proposed material solutions and costs for walls and roof (Germany). Note: ECM, Energy Conservation Measure; ETICS, External Thermal Insulation Composite Systems; Ext., Exterior; Int., interior; ins., insulation.
ECMs for GermanyInsulation (Ins.)Finishing
Layer (FL)
Total Values
ECM (Ins. + FL)
LevelCategoryTypeThickness Ins. [mm]MaterialU-Value [W/(m2·K)]Thermal Resistance [(m2·K)/W]Conductivity [W/(m·K)]Cost [€/m2]U-Value [W/(m2·K)]Cost [€/m2]Total U-Value [W/(m2·K)]Total Thickness [mm]Total Cost ECM [€/m2]
FaçadeIns. at the Ext.ETICS (50 mm cement/mortar plaster + ins.)120Expanded polystyrene0.3173.1580.03819.611.60020.050.26412539.66
120Extruded polystyrene0.3003.3330.03610.241.60020.050.25312530.29
240Expanded Polystyrene0.1586.3160.03839.221.60020.050.14424559.27
240Extruded polystyrene0.1506.6670.03620.481.60020.050.13724540.53
Ins. in the
cavity wall
Insufflating thermal ins. inside the existing air chamber60Polyurethane foam0.5921.6900.0367.13--0.592607.13
Injection of thermal ins. inside the existing air chamber60Mineral wool0.5751.7390.03511.14--0.5756011.14
Int. ins.Plasterboard finish (ins. + 15 mm Plasterboard)60Extruded polystyrene0.5671.7650.03413.895.33317.490.5127531.38
60Expanded Polystyrene0.5331.8750.0328.715.33317.490.4857526.20
100Extruded polystyrene0.3602.7780.03622.325.33317.490.33711539.81
100Expanded Polystyrene0.3203.1250.03211.425.33317.490.30211528.91
Pitched roofExt. ins.Ins. of cavity between rafters180Mineral wool0.2005.0000.03673.08--0.20018073.08
Int. ins.Plasterboard finish (Ins. + 15 mm Plasterboard)200Mineral wool0.1855.4050.03741.525.33317.490.18521559.01
Flat roofExt. ins.120 mm of ins., geotextil filter and 100 mm gravel120Extruded Polystyrene0.2833.5290.03413.320.87044.770.21422058.09
300 mm of ins., geotextil filter and 100 mm gravel300Extruded Polystyrene0.1208.3330.03633.300.87044.770.10540078.07
Table 7. Proposed material solutions and costs for walls and roof (Poland). Note: ECM, Energy Conservation Measure; ETICS, External Thermal Insulation Composite Systems; Ext., Exterior; Int., interior; ins., insulation.
ECMs for PolandInsulation (Ins.)Finishing
Layer (FL)
Total Values
ECM (Ins. + FL)
LevelCategoryTypeThickness Ins. [mm]MaterialU-Value [W/(m2·K)]Thermal Resistance [(m2·K)/W]Conductivity [W/(m·K)]Cost [€/m2]U-Value [W/(m2·K)]Cost [€/m2]Total U-Value [W/(m2·K)]Total Thickness [mm]Total Cost ECM [€/m2]
FaçadeIns. at the Ext.ETICS (50 mm cement/mortar plaster + ins.)120Expanded polystyrene0.3173.1580.03819.611.60020.050.26412539.66
120Extruded polystyrene0.3003.3330.03610.241.60020.050.25312530.29
240Expanded Polystyrene0.1586.3160.03839.221.60020.050.14424559.27
240Extruded polystyrene0.1506.6670.03620.481.60020.050.13724540.53
Ins. in the
cavity wall
Insufflating thermal ins. inside the existing air chamber60Polyurethane foam0.5921.6900.0367.13--0.592607.13
Injection of thermal ins. inside the existing air chamber60Mineral wool0.5751.7390.03511.14--0.5756011.14
Int. ins.Plasterboard finish (ins. + 15 mm Plasterboard)60Extruded polystyrene0.5671.7650.03413.895.33317.490.5127531.38
60Expanded Polystyrene0.5331.8750.0328.715.33317.490.4847526.20
100Extruded polystyrene0.3602.7780.03622.325.33317.490.33711539.81
100Expanded Polystyrene0.3203.1250.03211.425.33317.490.30211528.91
Pitched roofExt. ins.Ins. of cavity between rafters180Mineral wool0.2005.0000.03673.08--0.20018073.08
Int. ins.Plasterboard finish (Ins. + 15 mm Plasterboard)200Mineral wool0.1855.4050.03741.525.33317.490.18521559.01
Flat roofExt. ins.120 mm of ins., geotextil filter and 100 mm gravel120Extruded Polystyrene0.2833.5290.03413.320.87044.770.21422058.09
300 mm of ins., geotextil filter and 100 mm gravel300Extruded Polystyrene0.1208.3330.03633.300.87044.770.10540078.07
Table 8. Initial values of the Medium quality building prototype.
K AVE [W/(m 2 · K)] U window [W/(m 2 · K)] U wall [W/(m 2 · K)] U roof [W/(m 2 · K)]Roof TypeSpace under Roof
0.7143.6890.3481.732PitchedYes
Table 9. Final values of the Medium quality building prototype. Note: DGW.—Double Glazing Windows; TGW.—Triple Glazing Windows; Ins.—insulation.
Location (City, Country) K AVE
[W/(m 2 · K)]
U window
[W/(m 2 · K)]
U wall
[W/(m 2 · K)]
U roof
[W/(m 2 · K)]
Selected SolutionCost [€]
Málaga (zone A), Spain0.6752.7 DGW. Sustainability 13 06576 i0015713.89
Bilbao (zone C), Spain0.6512.1 DGW. Sustainability 13 06576 i0025900.21
León (zone E), Spain0.5920.6 TGW. Sustainability 13 06576 i0036831.82
Warsaw, Poland0.6321.6 DGW. Sustainability 13 06576 i0046272.86
Massy, France0.6431.9 DGW. Sustainability 13 06576 i0056210.75
Berlin, Germany0.4491.30.109 DGW. + Ins. outside the walls Sustainability 13 06576 i00620,959.30
Table 10. Initial values of the Low quality building prototype.
K AVE [W/(m 2 · K)] U window [W/(m 2 · K)] U wall [W/(m 2 · K)] U roof [W/(m 2 · K)]Roof TypeSpace under Roof
1.5876.7020.9613.423PitchedYes
Table 11. Final values of the Low quality building prototype. Note: DGW., Double Glazing Windows; Ins., insulation.
Location (City, Country) K AVE
[W/(m 2 · K)]
U window
[W/(m 2 · K)]
U wall
[W/(m 2 · K)]
U roof
[W/(m 2 · K)]
Selected SolutionCost [€]
Málaga (zone A), Spain0.9382.70.272 DGW. + Ins. outside the walls Sustainability 13 06576 i00716,400.24
Bilbao (zone C), Spain0.4222.10.3560.342DGW. + Ins. inside the walls + Ins. inside the roof Sustainability 13 06576 i00815,055.57
León (zone E), Spain0.411.80.3560.342DGW. + Ins. inside the walls + Ins. inside the roof Sustainability 13 06576 i00915,366.11
Warsaw, Poland0.8681.60.238 DGW. + Ins. outside the walls Sustainability 13 06576 i01016,058.60
Massy, France0.4141.90.3560.342DGW. + Ins. inside the walls + Ins. inside the roof Sustainability 13 06576 i01115,366.11
Berlin, Germany0.3631.30.3560.189DGW. + Ins. inside the walls + Ins. inside the roof Sustainability 13 06576 i01218,264.02
Table 12. Initial values of the Low quality building prototype with flat roof.
K AVE [W/(m 2 · K)] U window [W/(m 2 · K)] U wall [W/(m 2 · K)] U roof [W/(m 2 · K)]Roof Type
1.5216.7020.9613.423Flat
Table 13. Final values of the Low quality building prototype with flat roof. Note: DGW., Double Glazing Windows; Ins., insulation.
Location (City, Country) K AVE
[W/(m 2 · K)]
U window
[W/(m 2 · K)]
U wall
[W/(m 2 · K)]
U roof
[W/(m 2 · K)]
Selected SolutionCost [€]
Málaga (zone A), Spain0.9332.70.369 DGW. + Ins. outside the walls Sustainability 13 06576 i01313,598.54
Bilbao (zone C), Spain0.8062.10.24 DGW. + Ins. inside the walls Sustainability 13 06576 i01413,425.64
León (zone E), Spain0.4321.80.3560.486DGW. + Ins. inside the walls + Ins. outside the roof Sustainability 13 06576 i01517,294.07
Warsaw, Poland0.7851.60.238 DGW. + Ins. outside the walls Sustainability 13 06576 i01616,596.57
Massy, France0.7981.90.24 DGW. + Ins. inside the walls Sustainability 13 06576 i01713,736.18
Berlin, Germany0.3781.30.3560.262DGW. + Ins. inside the walls + Ins. outside the roof Sustainability 13 06576 i01817,418.29
Publisher’s Note: MDPI stays neutral with regard to jurisdictional claims in published maps and institutional affiliations.

