Abstract
Global challenges such as urbanization, aging societies, climate change, and environmental and water crises are becoming increasingly important in terms of the impact they might have on the quality of life (QoL) in cities. Appraisal instruments for QoL assessment, such as rankings and guides, should therefore include these aspects. The aim of this research was to verify the significance of water and climate-related aspects in assessment tools. A comparative analysis of 24 selected QoL assessment tools shows to what extent these aspects are included in the domains, criteria, and indicators proposed in the instruments. The method of verification is a comparison of the position of winning cities in QoL rankings and city resilience rankings. The results show that water and climate-related aspects are still underestimated in the QoL rankings and guides, and only a few cities with the highest quality of life ranked highly in sustainability and climate resiliency ratings. Our results suggest that the tools for the evaluation and comparison of cities need remodeling, taking into account the most important global risks and Sustainable Development Goals (SDGs), in order to create aging-friendly and climate-neutral cities.
1. Introduction
Cities are becoming the main place of human habitation on Earth and are areas with the greatest concentration of ecological and climate challenges [1]. Therefore, one of the most important indicators of the implementation of the Sustainable Development Goals (SDGs) [2] is the quality of life of citizens. Indicators used to assess the quality of life (QoL), including dynamic processes and growing threats, can support decision makers in developing policies and transforming urban structures, making them more user-friendly and climate neutral [3]. Research units and international bodies, as well as business entities, evaluate the quality of urban life using appraisal instruments based on selected domains and metrics, comparing cities and countries, and selecting the most livable locations. Some tools also take age-friendliness into account [4]. The rapid development of digital techniques and computational models has resulted in an increase in the number of tools and indicators for assessing quality of life in cities, but these tools are often inconsistent and incomparable [4,5]. Furthermore, some have mainly been designed for commercial and marketing purposes.
The global population is aging, which is one of the most important issues of this century. The share of the population aged 65 years or over within the total world population has been increasing. According to the United Nations World Urbanization Prospects, it has been estimated that the urbanization rate for the total population will reach 4.5 billion in 2021 [6]. In many European cities, the share of the population aged 65 and over is constantly increasing [7]. Moreover, the historical centers of European cities are usually inhabited by a large group of seniors [8,9,10]. In most appraisal instruments cities are assessed as homogenous entities, whereas living standards and quality can differ at the neighborhood level [5]. The WHO has defined an age-friendly city as a place that has an “inclusive and accessible urban environment that promotes active aging” [11]. Historic districts are mostly deprived of greenery and are vulnerable to the urban heat island phenomenon, as well as threats of heat waves, droughts, and floods, which are expected to increase with climate change [12,13]. This has a significant impact on the quality of life and health of this social group [14,15,16].
According to the WEF’s Global Risk Report 2021 [17], environmental risks dominate among the top risks for humanity, both in terms of likelihood and impact. The most serious include extreme weather conditions and failure of climate action, human environmental damage, and biodiversity loss, as well as natural resource crises. The risk of infectious diseases related to the COVID-19 pandemic, among other hazardous incidents, is the only societal risk at the top of the list by impact, while coming in fourth place on the list by likelihood. In compliance with this event, during the pandemic, urban water and green structures became even more meaningful for quality of life. All risks mentioned in the Global Risk Report 2021 pose a threat to the quality of life in cities, particularly for the elderly.
Climate change is one of the most urgent and greatest long-term challenges that humanity faces [18,19,20]. The consequences of climate change include increased intensity, frequency, and duration of weather extremes, such as urban temperature variation, drought and water scarcity, coastal flooding, sea level rise related to storm surges, and heavy downpours [16]. The strong link between climate change and urbanization has been confirmed in the literature [21,22,23,24]. The key affected urban sectors are water supply, wastewater and sanitation, energy supply, transportation and telecommunication infrastructure, built environment (e.g., housing), and recreation, as well as natural and cultural heritage sites [13,16,25].
Valuing water [26] and the natural environment is fundamental to achieving the Sustainable Development Goals (SDGs) of the United Nations 2030 Agenda for Sustainable Development [27] and high quality of urban life. Water aspects are mainly considered in terms of resource availability, water supply and sanitation, and potential flood risk [16]. Meanwhile, proximity and access to water are essential for human culture and urban heritage, as well as for health, well-being, and disease prevention [28]. The well-being and safety of residents, as well as community involvement, are highly associated with water [29]. According to the Arcadis Sustainable cities water index, “Cities which carefully and creatively use their water assets for strategic urban advantage will ultimately be more livable, safe and competitive. Cities that are truly distinguished by a thriving relationship with their waterscape can make a huge contribution to the quality of life of their residents [..]” [30]. Moreover, urban developments have a consequential influence on the natural environment and climate. Sustainable urban water management and the protection of water sources can be used to mitigate climate change [29].
The impact of climate change on the quality of life had already been noted in the 1970s [31]. However, climate-related issues are still poorly considered in quality of life assessments [3,32,33]. Newton (2012) [33] compared the EIU’s Quality of Life with the WWF’s 2008 Living Planet Index of Ecological Footprints [34]. The results showed that the “liveability of cities is being achieved at the expense of environmental sustainability” [33]. Jones and Newsome (2015) [35] examined the relationships between livability indicators and environmental factors using the example of Perth, which scored poorly in the Economist Intelligence Unit global livability ranking and report of August 2013, concerning its accessibility to nature. However, the analysis was limited to just three rankings, and only indicators proposed by the Economic Intelligence Unit (EIU) were analyzed in detail, while Mercer’s and Monocle’s were described more generally. The authors of the article indicated the limitations of the EIU evaluation method and proposed environmental factors that should be included as livability indicators (green space, access to protected areas, remnant vegetation, biodiversity, air quality, and unpolluted water) [35]. Another example of analysis of the tools for QoL assessment concerns the verification of the relationship between the quality of life in cities and their environmental sustainability. Estoque et al. (2019) noted that “Climate change and variability affect QoL and human well-being in many ways, rendering it one of the most pressing and significant challenges of the present day” [32]. They reviewed quality of life (QoL) assessments and indicators, and found them to be poorly connected with climate-related issues. The authors proposed a new “QoL-Climate” assessment framework, designed to capture the socio-ecological impacts of climate change and variability [32].
As there is still little research on the connection between the quality of urban life and the environmental sustainability of cities, the authors of the present study conducted a comparative analysis of the instruments that assess urban quality of life and verified the inclusion of climatic, environmental, and water factors.
The recipients of the results from the available guides and rankings are often local government units and decision makers who create sustainable development policies and, thus, have an impact on improving living conditions and creating more sustainable and resilient cities. To develop more precise appraisal instruments to assess the sustainability and quality of life in cities, it is worth verifying the following: (i) Which water and climatic factors are considered to have the greatest impact on quality of life? (ii) Which tools assess water and climate aspects, and to what extent? (iii) Do international and Polish QoL assessment tools differ significantly and in which indicators? (iv) Which indicators are the most useful and reliable and which of them have been marginalized? Finally, which (v) are the cities with the highest QoL that are also sustainable and resilient?
2. Materials and Methods
The main goal of the research was to verify the integration and significance of water and climate-related aspects in the considered appraisal instruments. Analysis of the number and type of indicators, as well as the weight function of water and climate-related aspects, helped us determine which of the instruments most fully capture the impact of water and climate on QoL. Comparing the top ten cities in the QoL rankings with those in the sustainability and resilience rankings allowed us to identify which cities have most effectively combined strategies to improve the quality of life along with adaptation to climate change, as well as environmental and water crises.
The research subjects are the most influential, prestigious, and available international and Polish tools, which concern the features and indicators of livable cities for the assessment of quality of urban life and comparison of various countries, cities, and communities.
The first stage in the analysis of the importance of water and climate-related aspects in the assessment of quality of urban life in aging cities is based on the reports and a scientific literature review on topics relating to global changes (i.e., aging populations, urbanism, climate change, and water crises), as well as the analysis and selection of appraisal instruments (i.e., guides, rankings, reports from surveys) for the evaluation of livability of cities.
In the second stage, twenty-four tools were subjectively selected, including three international guides and one Polish one for age-friendly communities, thirteen international and two Polish rankings, and five other Polish appraisal instruments. The selected instruments were divided into two main groups: (i) Guides including core indicators for senior-friendly cities, and (ii) rankings measuring QoL and comparing the best countries and cities to live in. In both groups, international and Polish tools were selected to compare the indicators used. Additionally, several other Polish tools assessing the quality of life through a set of indicators were taken into account. The tools listed in Table 1 were assigned symbols (e.g., 1.1 for Global Age-friendly Cities—A Guide), which are used instead of their full names in the following figures.

Table 1.
Selected tools of the quality of urban life assessment and institutions that prepared the documents.
A comparative analysis has been elaborated in a previous study by the authors [4]; however, it included eight additional Polish assessment instruments and, thus, the coverage matrix presented in Figure 1 has been extended. The analysis covered the evaluation and synthesis of different domains, criteria, and indicators used in appraisal instruments. Seven common areas (six main domains: Architecture and urbanism, Infrastructure, Nature, Health and well-being, Social environment, and Development, and one domain of Supplementary criteria) and 29 categories were developed, in order to allow for universal classification of the metrics used in the various appraisal instruments. The authors used the WHO report Global Age-friendly Cities—A Guide as the reference tool in view of the methodology for assessing criteria in the aspects of architecture and urban planning. This tool has been assessed as being the most extensive, in terms of metrics related to the spatial structure of the cities. In an additive way, the criteria pool was extended with the new metrics provided by other analyzed instruments. Using a method of expert assessment, the collected criteria were categorized. The matrix presents the structure of the adopted criteria and domains (Figure 1). Indicators from all the evaluated tools were interpreted and assigned to domains and categories recommended by the authors.
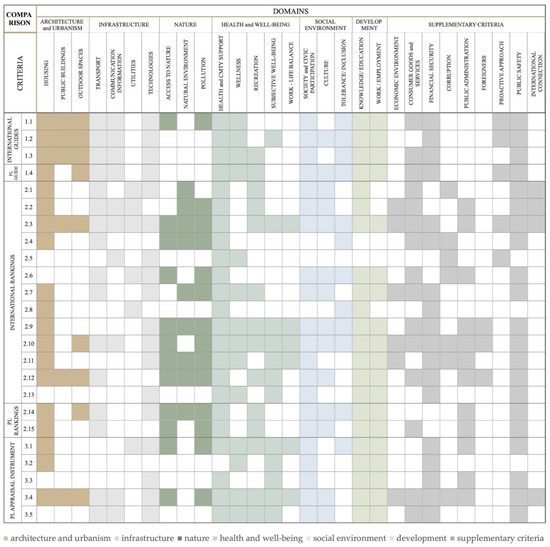
Figure 1.
Share of respective criteria in the assessment of selected tools—coverage matrix.
The third step was to check the indicators and to determine the weight function of the water and climate aspects in all tools for the urban quality of life evaluation. First, the importance of domain-related (e.g., nature) indicators in particular tools (e.g., 2.12 presented in Table 2) was measured. Second, the average weight function for a domain (e.g., nature) in the set of 13 rankings was calculated. Third, analyses of the importance of water and climate aspects in all compared appraisal instruments (consisting of checking all single indicators) were conducted. Metrics assessing water or climate-related aspects were marked and the average weight functions were calculated, according to the following ratio: number of indicators concerning water/climate aspects linked to the proper domain to the number of all indicators in the analyzed tool. Finally, the average weight function of all climate-related indicators in the set of 13 rankings were calculated. To present our findings in figures, the results were subtracted from the average weight function of the domain in a set of indicators. Accordingly, the importance of climate-related aspects was measured in the considered guides. Numbers were rounded to one decimal place, to make rough calculations easier and to present clearer figures. The limitations mainly concerned a lack of availability and transparency in the definition of particular metrics. Therefore, the results were estimated.
Table 2.
Exemplary analysis of one of the ranking’s indicators (Quality of life in cities. Perception survey in 79 European cities), concerning water- and climate-related aspects highlighted in light grey.
The fourth stage of the study concerned the comparison of the QoL assessment tools in terms of their content and type of water and climate-related indicators, considering the subject and scope of the assessment. International and Polish QoL assessment tools were compared. This analysis identified the most comprehensive rankings, taking into account water and climate aspects and the role of blue–green infrastructure.
In the fifth step, the top ten cities included in the most comprehensive international QoL rankings were compared with the results of the sustainability and resilience (S&R) rankings, in order to determine whether the cities with the highest QoL are also sustainable and resilient, or if the QoL improvement came at the expense of sustainability. The list of top cities was taken from the websites on which the results of the rankings selected for comparison were published.
3. Results
3.1. Integrating Water and Climate-Related Aspects in the QoL Assessment Tools
Comparison of the content and type of indicators related to water and climate aspects in selected QoL assessment tools allowed us to notice that, in the vast majority of instruments, these aspects were omitted or treated as a secondary issue. Additionally, the manner of defining the discussed aspects and their meanings differed significantly.
3.1.1. Importance of Water-Related Aspects in the Analyzed Tools
Our analysis revealed that the water topic has been omitted in many international and Polish guides, and most other Polish instruments (Figure 2).
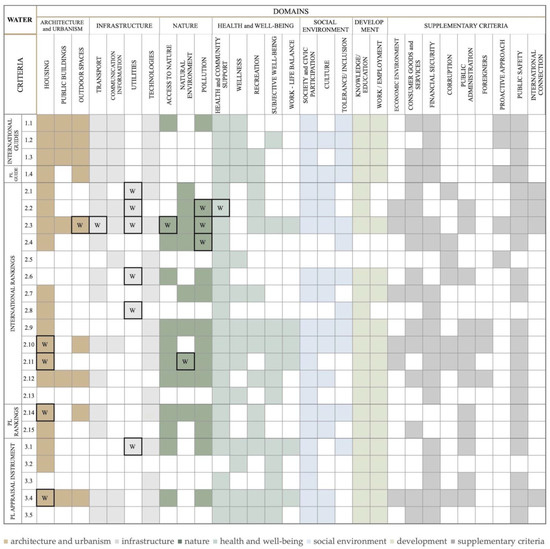
Figure 2.
Coverage matrix of respective criteria in the assessment of selected tools, considering water aspects. The squares outlined with a bold black line indicate criteria where the indicators concern water aspects.
The aspects of water were included in eight of the international rankings: EIU’s Global Liveability Ranking (2.1), Mercer’s Quality of Living Ranking (2.2), Monocle’s Quality of Living Survey (2.3), Deutsche Bank Liveability Survey (2.4), IMD Smart City Index (2.6), Human Development Report (2.8), The European Quality of Life Survey (EQLS) (2.10), and How’s Life? 2020 Measuring Well-being (2.11); two Polish tools (the instruments’ names are marked with symbols proposed in Table 1): Jakość życia w Polsce Edycja 2017 (3.1) and Jakość życia mieszkańców Łodzi i jej przestrzenne zróżnicowanie (3.4); and one Polish ranking: Ranking jakości życia. Wymiary szczęścia (2.14). The water aspects were considered in four domains and eight categories, such as housing, outdoor spaces, transport, utilities, access to nature, natural environment, pollution, health, and community support. The most diverse attitude towards water (up to five different QoL categories) was observed in the Monocle’s Quality of Life Survey (2.3).
The results indicated that water-related metrics have only been proposed in four domains: architecture and urbanism, infrastructure, nature, and health and well-being. However, the topic of water was not considered in the areas of social environment and development, nor in the supplementary criteria (Figure 2 and Figure 3).
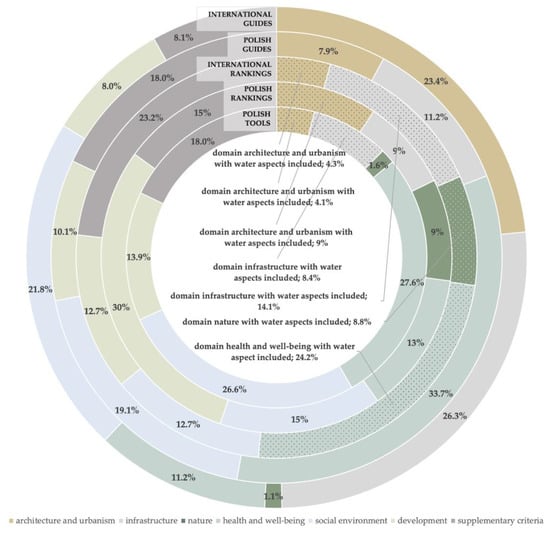
Figure 3.
Share of the domains with water-related indicators used for the assessment of the quality of life (QoL), in reference to other domains, taken into account in the selected tools.
The average weight of the water aspects was very low. Concerning international rankings, for the domain of architecture and urbanism, it was only 0.3%; in the domain of nature it was 0.9% and, for the domain of health and well-being, it was 0.2%. The most significant average weight was for the domain of infrastructure (1.4%). For Polish rankings, the weight of water aspects for the domain of architecture and urbanism was 1%; for Polish tools, the weights of water aspects for the domain of architecture and urbanism and infrastructure were equal to 0.3% (Figure 4).
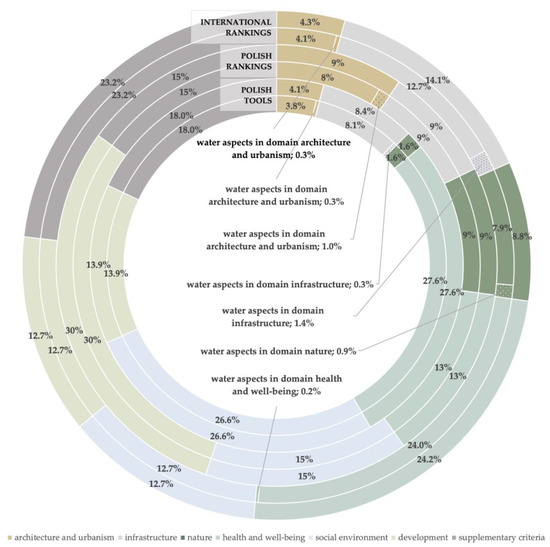
Figure 4.
Share of water aspects in the domains for the quality of life assessment (in reference to other domains) taken into account in the Polish and international rankings, as well as other Polish tools.
3.1.2. Importance of Climate-Related Aspects in the Analyzed Tools
This analysis takes into account weather phenomena, temperature, and air conditions as short-term indicators of climate change. The outcomes are shown in Figure 5. Climate-related aspects were poorly covered in 10 of the international rankings: EIU’s Global Liveability Ranking (2.1), Mercer’s Quality of Living Ranking (2.2), Monocle’s Quality of Living Survey (2.3), Deutsche Bank Liveability Survey (2.4), IMD Smart City Index (2.6), Best Cities for Successful Aging (2.7), Quality of life (well-being of Europeans) (2.9), The European Quality of Life Survey (EQLS) (2.10), How’s Life? 2020 Measuring Well-being (2.11), and Quality of life in cities. Perception survey in 79 European cities (2.12); in two Polish rankings: Ranking jakości życia. Wymiary szczęścia (2.14) and Uciekające metropolie. Ranking 100 polskich miast (2.15); and in two Polish tools: Jakość życia w Polsce Edycja 2017 (3.1) and Jakość życia mieszkańców Łodzi i jej przestrzenne zróżnicowanie (3.4). The climate-related aspects were considered in two domains and four categories, including transport, technologies, natural environment, and pollution (Figure 5 and Figure 6).
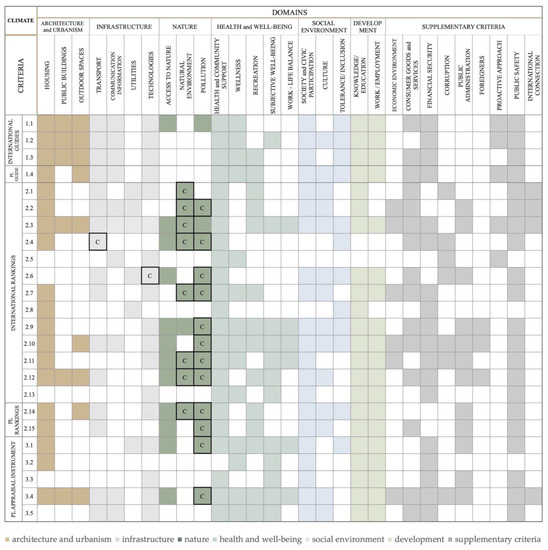
Figure 5.
Coverage matrix of respective criteria in the assessment of selected tools, considering climate aspects. The squares outlined with a bold black line indicate criteria where the indicators concerned climate aspects.
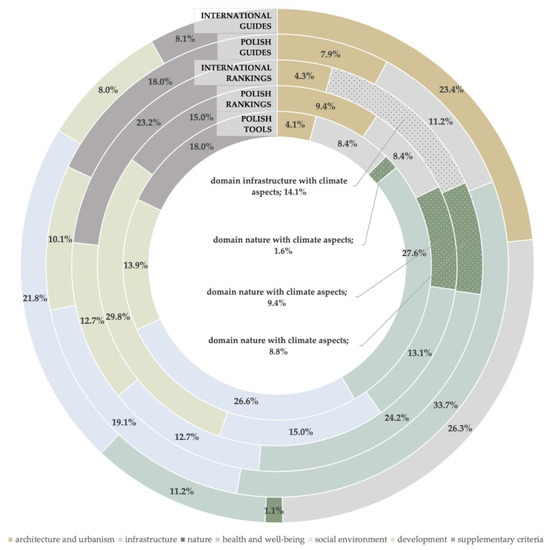
Figure 6.
Share of the domains with climate-related indicators used for the assessment of quality of life (in reference to other domains) taken into account in the selected tools.
The data showed that metrics related to weather and climate aspects were developed in only two areas: Infrastructure and nature (Figure 5 and Figure 6) and they seemed to be of little significance.
In international rankings, climate factors were included in the infrastructure domain, with a weight of 0.4%; whereas for the domain of nature it was 4.1%. In Polish rankings, all indicators in the area of nature included climate-related aspects (5.6%). For Polish tools, the significance of climate factors for the domain of nature was equal to 0.5% (Figure 7).
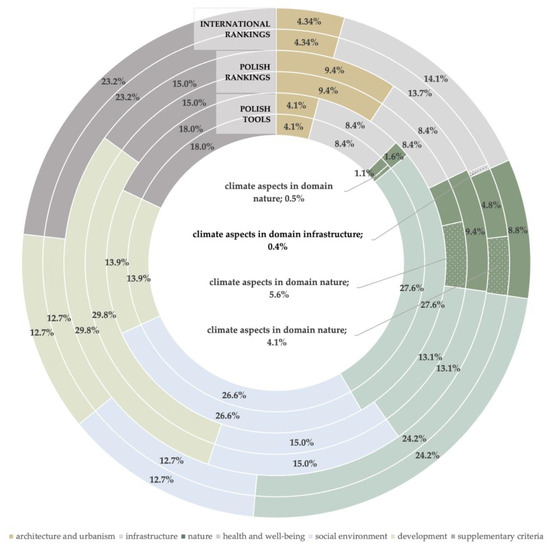
Figure 7.
Share of the climate aspects concerned in the domains for the quality of life assessment (in reference to other domains) taken into account in the Polish and international rankings, as well as other Polish tools.
3.2. Comparison of the Indicators Related to Water and Climate Aspects
3.2.1. Water-Related Indicators in the Analyzed QoL Assessment Tools
Indicators related to water were totally omitted in 13 appraisal instruments: 1.1, 1.2, 1.3, 1.4, 2.5, 2.7, 2.9, 2.12, 2.13, 2.15, 3.2, 3.3, and 3.5. In all 11 other tools, the indicators were concerned with basic, physiological aspects, such as water quality (environment and water supply), availability, and sanitary aspects. Most of the tools assessed only 1–2 indicators. Social and transport aspects of water were proposed in one ranking (2.3), whereas aspects related to safety or a proactive approach were not used at all.
Water quality/pollution was measured only in two tools:
- -
- Water quality (2.3); and
- -
- Water pollution (2.4).
Tap water quality and supply was measured in four tools, all of which used different indicators:
- -
- Quality of water provision (2.1);
- -
- Water potability (2.2);
- -
- Quality of tap water (2.3); and
- -
- Drinking water quality (2.4).
In Quality of life in Poland. 2017 edition (3.1), an indicator concerning polluted water—exposure to pollution or other environmental problems in the neighbourhood (% of households)—was also included.
Water availability was also assessed in only four tools: 2.2, 2.4, 2.8, and 2.11. How’s Life? 2020 Measuring Well-being (2.11) measured it using two (different from the rest) indicators: water stress (total) and water stress (internal).
Sanitary aspects were verified in eight tools, with indicators measuring:
- -
- Sewage (2.2, 2.14);
- -
- Sanitary facilities (2.8, 2.10, 2.11); and
- -
- Sanitary conditions (2.6, 3.1).
In the Polish tool Jakość życia mieszkańców Łodzi i jej przestrzenne zróżnicowanie (3.4), this area was the most extensive, with the following indicators: warm running water, bathroom with bathtub and/or shower, flush toilet, and sewers.
The most varied instrument, containing three indicators from all categories, including water potability, water availability, and sewage, was Mercer’s Quality of Living Ranking (2.2).
The most extensive (with five indicators related to water) was Monocle’s Quality of Living Survey (2.3), which considered social and transport aspects of water, and assessed the following indicators: Access to water, waterfronts, and water as means of transport (Figure 8).
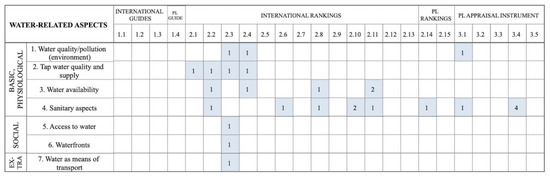
Figure 8.
Water-related aspects including thematically grouped indicators.
3.2.2. Climate-Related Indicators in the Analyzed QoL Assessment Tools
Indicators related to climate were not included in 10 of the analyzed tools: 1.1, 1.2, 1.3, 1.4, 2.5, 2.8, 2.13, 3.2, 3.3, and 3.5. In the other 14 appraisal instruments, the metrics assessed aspects that can be assigned into three categories: weather, climate, and safety/environmental initiatives. Most of the tools assessed only 1–3 indicators, while four instruments considered 4–6 metrics.
All aforementioned 14 tools verified weather aspects such as:
- -
- Air pollution/quality (2.2, 2.4, 2.6, 2.7, 2.9, 2.10, 2.11, 2.12, 2.14, 2.15, 3.1, 3.4);
- -
- Humidity/temperature (2.1, 2.3, 2.4);
- -
- Hours of sunshine (2.3);
- -
- Weather (2.7); which was assessed as a composite score using heating degree days, cooling degree days, humidity, sunshine, and precipitation.
The most extensive range of weather-related indicators, such as dew point, temperature, average high humidex, and air quality, was found in the Deutsche Bank Liveability Survey (2.4).
Climate aspects were underestimated in most of the appraisal instruments. They were varied and assessed in only five rankings. Four of them proposed only one indicator:
- -
- Discomfort of climate to travellers (2.1);
- -
- Carbon neutral (2.3);
- -
- CO2 Emmission Index (2.4); and
- -
- Climate (2.2); which was explained using the example of characteristics of the Four Seasons.
The most extensive tool, How’s Life? 2020 Measuring Well-being (2.11), evaluated three indicators: Greenhouse gas emissions (domestic production), carbon footprint, and material footprint.
Aspects related to safety or/and environmental initiatives were included in six tools. Environmental initiatives, friendliness, and problems were observed in five tools, including:
- -
- Environmental initiatives, walkable, and environmentally friendly in Monocle’s Quality of Living Survey (2.3);
- -
- Perception of pollution, grime, or other environmental problems in Quality of life (well-being of Europeans) (2.9);
- -
- Recycling rate and renewable energy in How’s Life? 2020 Measuring Well-being (2.11);
- -
- City is committed to fight against climate change (2.12);
- -
- City expenditure on air and climate protection (2.14).
Aspects of safety were verified only through a record of natural disasters indicator in Mercer’s Quality of Living Ranking (2.2).
The most differential tools, in terms of number and classification of indicators, were the rankings How’s Life? 2020 Measuring Well-being (2.11), with six indicators assessing all three categories, and Monocle’s Quality of Living Survey (2.3), with five metrics also evaluating all categories of weather and climate aspects (Figure 9).
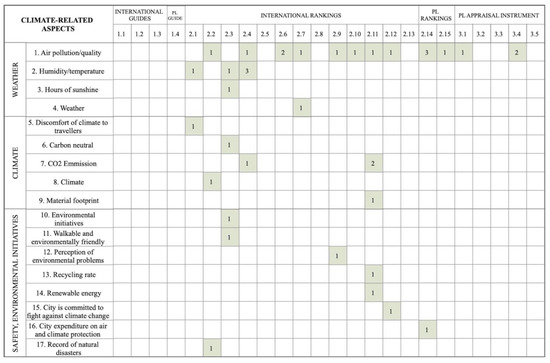
Figure 9.
Climate and weather-related aspects including thematically grouped indicators.
3.2.3. Additional Indicators Related to Green Infrastructure in the Analyzed QoL Assessment Tools
Even if the rankings did not directly assess aspects of climate management, some of them appreciated the ecosystem services of urban greenery.
Six appraisal instruments included metrics related to urban greenery, with indices such as:
- -
- Green spaces which were not specified (2.15), amount/number of green spaces, parks, gardens, and so on (2.3, 2.12, 2.14, 3.4), and natural and semi-natural land cover (2.11);
- -
- Intact forest landscape and protected areas (terrestial and marine) (2.11);
- -
- Red List Index (threatened species) (2.11); and
- -
- Soil nutrient balance (2.11).
In three rankings (2.3, 2.10, 2.11), access to nature was also measured. Moreover, in Quality of life of Lodz inhabitants and city’s spatial diversity (3.4), this aspect was measured through the indicator “feeling a lack of green areas”.
The quality of and satisfaction of citizens with green and recreation areas were assessed in six tools (1.1, 2.4, 2.6, 2.9, 3.1, 3.4). Moreover, in Quality of life ranking. Dimensions of happiness (2.14), there was one extra indicator—expenditure on maintaining green areas in the years—related to involvement of city authorities in designing green areas.
As BGI has a significant impact on climate and water management in cities [60,61,62], it is essential that it is also reflected in the rankings. The ranking How’s life going? 2020 Measuring well-being (2.11) used as many as nine indicators (Figure 10).
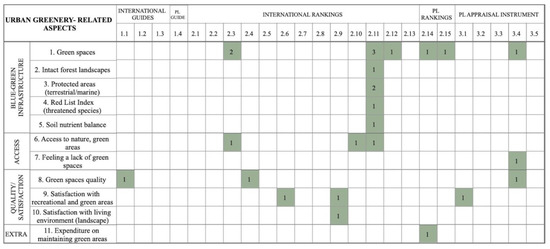
Figure 10.
Urban greenery-related aspects including thematically grouped indicators.
The analysis of the types and scope of indicators in QoL assessment tools proves that they differ significantly (Figure 11); the reason for so many simplifications and imperfections is, inter alia, a shortage of commonly available and comparable data in various countries and cities (including Poland). One limitation in the research was also the lack of availability and transparency in methodology and metric descriptions in some of the tools.
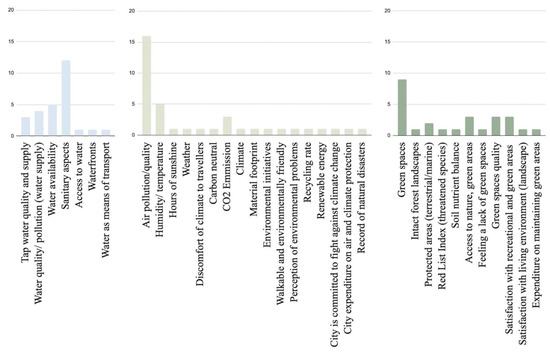
Figure 11.
Number of water-, climate-, and urban greenery-related indicators grouped thematically.
3.3. Comparison of the Top Cities in the Most Comprehensive International QoL Rankings with the Results of the Sustainability and Resilience (S&R) Rankings
In order to determine whether the cities with the highest quality of life are also sustainable and resilient, the top ten cities in the most comprehensive international QoL rankings (Mercer Ranking QoL [41], Monocle’s QoL Survey [42], and Deutsche Bank Liveability Survey [43]) were compared with the top ten cities in S&R rankings (Table 3). The ranking How’s life going? 2020 Measuring well-being (2.11) has been excluded as it compares only countries.
Table 3.
Comparative list of the winning cities (highlighted with color) in the QoL rankings and Sustainable and Resilient Cities rankings. The lists were obtained from the websites of selected rankings.
All three QoL rankings jointly listed certain cities as high-ranking, such as: Zurich, Vienna, and Copenhagen. Moreover, Monocle ranked Tokyo and Munich highly (second and third positions), and Mercer rated Vancouver highly (third position). The cities mentioned were also listed in the S&R rankings, but only Copenhagen ranked highly in two of the four S&R rankings. Some top cities in the S&R rankings (i.e., Rotterdam, London, and Toronto) were not on the QoL ranking lists.
4. Findings and Discussion
4.1. The Relationship between Water and Climate Aspects and Domains of the Quality of Urban Life
Cities’ particular sensitivity to the effects of climate change should be taken into account in developing a vision of sustainable development for urban policy. Therefore, the cities’ development perspective should be changed from the priority of economic development to ensuring a high quality of life for citizens. Nowadays, it is the QoL that states the competitiveness of cities [66].
Water and the climate have direct or indirect effects on all areas of human life, but remained poorly incorporated in the domains and criteria of the considered QoL assessments. Of the seven domains (including 29 categories) used in these studies, the water-related metrics were included in four: Architecture and urbanism (two categories: housing and outdoor spaces), Infrastructure (two categories: transport and utilities), Nature (three categories: access to nature, natural environment, and pollution), and Health and well-being (only one category: health and community support). Surprisingly, only one out of the 24 studied QoL tools took into account the effects of water on health and well-being, whereas the results of studies, such as the BlueHealth project [28], indicated the benefits of water bodies, in terms of public health and well-being.
The climate-related aspects were considered in two domains only: Infrastructure (two categories: transport and technologies) and Nature (two categories: natural environment and pollution). According to the literature [67,68,69,70,71], the types of land cover, buildings, and urban structures have a strong influence on the urban topoclimate (especially the radiant temperature and urban heat island); however, none of the rankings considered the impact of this aspect on the quality of life in the domains of Architecture and urbanism or Health and well-being.
To address the challenges of water management and adaptation to climate change in cities—especially in their historic centers—it is necessary to change the approach towards the perception and assessment of the roles of water and greenery [72,73,74]. Leading international organizations, such as the IWA, have provided solutions—for example, by developing principles for Water Wise Cities (2017) [75]—to encourage collaborative action “so that local governments, urban professionals, and individuals actively engage in addressing and finding solutions for managing all waters of the city” [29].
4.2. The Most Comprehensive QoL Assessment Tools Including Water and Climate Aspects
In the vast majority of instruments, the water and climate-related indicators were omitted or underestimated. The water-related indicators were included only in eight of the international rankings, two Polish tools, and one Polish ranking, whereas climate-related aspects were incorporated to a small degree in the 10 international and two Polish rankings, as well as in two Polish tools. The most diverse and comprehensive tools turned out to be Monocle’s Quality of Life Survey (up to five different water-related indicators and up to five metrics and three different categories related to climate), Mercer’s Quality of Living Ranking Survey (up to three indicators from all sub-categories of water, and all categories of climate-related aspects), Deutsche Bank Liveability Survey (up to three different water-related aspects, and up to five metrics and two different categories related to climate), and How’s life going? 2020 Measuring well-being (up to three different water-related aspects, and up to six metrics from all categories of climate-related aspects.
QoL appraisal instruments can be used not only to assess the quality of life in entire cities, but also to compare living standards in individual districts, and especially downtown neighborhoods. However, the tools need to be remodeled in order to take into account the most important global challenges [32,33], the SDGs, and the growing vulnerability of an aging city population [76].
4.3. Comparison of the International and Polish QoL Assessment Tools
The International and Polish QoL assessment tools differed significantly, according to the water-related indicators. This may have resulted from an outdated approach to water management in Poland [77] and still low levels of climate and ecological awareness [78]. In international rankings, the indicators concerned a variety of aspects, such as pollution, quality and availability of water, sanitation, and water stress; whereas in Polish tools, only pollution- and sanitation-related indicators were included. International rankings were also more varied than Polish tools with regard to climate and weather-related indicators. However, the most common metrics (related to air pollution) were used in both groups of tools. In one Polish tool and several international rankings, indicators related to environmental initiatives were also included. The indicators that were omitted in Polish tools were related to temperature, humidity, weather, climate, CO2 emissions, and material footprint.
4.4. Indicators Used in QoL Assessment Tools
The water aspects related to the domain of Architecture and urbanism were measured only by five appraisal instruments. Almost all metrics concerned the topic of sanitation in accommodation, consisting of indoor flushing toilet and bath or shower (2.10), basic sanitary facilities (2.11), apartment connected to the sewage system (2.14), and warm running water, bathroom with bathtub and/or shower, flush toilet, sewers (3.4). The most distinctive indicator was Monocle’s waterfronts (2.3), which may be used to assess the image, aesthetics, form, and function of historic water districts. In terms of urban structures and architecture, there were no indicators linking land cover and types of buildings with the heat and humidity conditions in the city (i.e., green cover area, green roofs, share of low-carbon/ecologically certified buildings, rain water retention, and so on).
Metrics related to sustainable urban infrastructure and materials are missing. Based on the IWA Principles [29], we can propose some indicators related to the design of buildings and outdoor spaces, which allow for climate change adaptation and regenerative water services (e.g., green roofs), quick disaster recovery (e.g., vital infrastructure), the reduction of flood risks (e.g., drainage solutions integrated with urban infrastructure design), amplifying the livability with groundwater (i.e., roadside green infrastructure), and minimizing the impact of urban materials on water pollution (e.g., roof and wall materials not emitting pollutants). All aforementioned metrics should be considered in the context of urban heritage.
Almost half of the remaining water-related metrics corresponded to infrastructure, especially to the utilities category and for the evaluation of sanitation (2.6, 2.8, 3.1), as well as water quality (2.1, 2.3, 2.8) and availability (2.3, 2.4). Moreover, there was one water-related indicator in the transport category, water as means of transport (2.3), and one climate-related factor in the same category, CO2 Emissions Index, which is an estimation of CO2 consumption due to traffic time (2.4). One special climate-related indicator—a website or App allows effective monitoring of air pollution (2.6)—should be distinguished, as it can be classified as belonging to the technologies category. An essential indicator that was omitted in all compared tools was wastewater reuse, developed for the Cities Water Index [30].
The other water and climate-related indicators were correlated with the domain nature. There were aspects that may be included in the pollution category, such as sewage (2.2) water pollution (2.4), clear water (2.3), or air pollution/quality (2.2, 2.4, 2.6, 2.7, 2.9, 2.10, 2.11, 2.12, 2.14, 2.15, 3.1, 3.4); as well as in the natural environment category: Water stress (2.11), humidity/ temperature (2.1, 2.3, 2.4), hours of sunshine (2.3), climate (2.2), weather (2.7), carbon neutral (2.3), material footprint (2.11), renewable energy (2.11), record of natural disasters (2.2), and environmental initiatives (2.3, 2.12, 2.14).
Some of the most important aspects that were totally marginalized are those related to public safety and proactive approach. The key issue for citizens is their safety during extreme meteorological and hydrological phenomena. Extreme weather affects particularly vulnerable groups, such as the elderly [66].
For already-formed historic urban zones with specific surfaces, the indicators proposed by the IWA, such as investing in coastal storm risks mitigation as well as flood and drought early warning systems and using an WRM framework and plan for drought mitigation strategies, seem to be highly reasonable [29].
Metrics related to climate and water management may be developed on the basis of the scientific literature, recommendations (IWA Principles [29]), and appraisal instruments (e.g., Water City Index [79], Arcadis Sustainable Cities Water Index [30], Arcadis Sustainable Cities Index [63], Grosvenor Group Resilient Cities [64], and Global Ranking of Top 10 Resilient Cities [65]), and then adjusted to the domains and criteria proposed by the authors.
The results of our research confirm the conclusions of Estoque (2019) [32]: there is still a need to expand the range of indicators to incorporate climate-related issues into QoL assessment tools. It is crucial to include some essential climate variables, such as temperature and rainfall [80,81,82], as well as indicators such as exposure and sensitivity to climate hazards [83], thermal comfort, natural disaster exposure, and preparedness [32,84]. These effects of climate change, such as the urban heat island effect and rising temperatures, impact the well-being of citizens, especially the most vulnerable groups such as seniors [76,85].
4.5. Comparison of the Winning Cities in QoL and S&R Rankings
Only a few cities (Vienna, Zurich, Tokyo, Vancouver, Munich, Copenhagen, and Edinburgh) that ranked high in the QoL rankings were listed in the rankings evaluating the sustainability and climate resiliency (S&R) of cities. This is a serious cause for concern. Given the SDGs [2] and urban development agendas (e.g., ICOMOS_SDGs_Policy_Guidance_2021 [86], European New Bauhaus [87]), the significance and construction of global city rankings definitely necessitate a recalibration of the basics [88].
The top cities listed in both types of rankings were completely different, in terms of size, number of inhabitants, culture, and so on. The common issue was that each of these cities are among the richest places to live in the world. Environmental awareness and local politics are likely to be driven by financial resources [89,90,91], which are invested into eco-programs, and the existence of the world’s leading universities, which shape public awareness [92]. This should be the subject of further research. Among them there are also old towns with historic districts that, despite the limitations of their spatial structures, face new challenges. They are all waterside cities, and all implement green spatial policies. A more detailed analysis of these policies and strategies—especially regarding natural and cultural heritage—can improve the management of urban environments and the associated quality of life.
The Paris Agreement (2015) [93] which recognises the role of cities, regions, and local authorities in addressing climate change, and invites them to “uphold and promote regional and international cooperation”. The discrepancy between cities (rankings’ leaders) emphasizes their role in looking for a common policy against climate threats.
5. Conclusions
Climate, environmental, and water crises affect the quality of life and well-being of residents in many ways, comprising one of the most urgent and important challenges facing modern cities. In the context of a broad debate on QoL assessment, sustainability, and livability indices [5,32,94], the socio-ecological paradigm emerges [83,88,94], which highlights the close links between QoL and climate and environmental variability [3,31,32,33]. Moreover, the aging of societies poses new challenges for the assessment of factors determining the quality of life in cities [4,36,46]. Our research identifies gaps in many QoL rankings based on a comparative analysis of 24 selected QoL assessment tools in terms of the scope of application of water and climate-related indicators. The authors’ recommendation is that the rankings need to be refined if they are to help create climate-neutral and age-friendly cities.
Our review revealed that water and climate-related aspects are still underestimated in the appraisal instruments for QoL assessment. It has been analyzed that out of 24 QoL tools surveyed, only four rankings—Monocle’s [42], Mercer’s [41], Deutsche Bank’s [43], and How’s life going? 2020 Measuring well-being [50]—contain a broad spectrum of indicators related to water, climate, and environmental quality. Since international and Polish QoL assessment tools differ significantly, the tools should be remodeled to be more comprehensive and useful for decision-makers and urban planners. It has been found that water-related indicators most often focus on the efficiency of sanitation and water supply, disregarding broad ecosystem services, whereas climate-related metrics are based on current thermal and humidity conditions in cities, disregarding climate variability and increasing hydro-meteorological extremes. Moreover, comparing the results of the QoL and S&R rankings showed that the top cities differed, whereas those that ranked highly in both types, such as Copenhagen, provide a valuable source of information on how to combine sustainability and resilience with high quality of life, by shaping the city structure as well as social and environmental policies.
Some of the QoL assessment tools take into account measures of the availability of urban green areas and the quality of the natural environment; however, ecosystem services—especially regulatory and cultural ones—remain underestimated. Moreover, the rankings do not take into account the dynamics of environmental and climate changes and their long-term consequences.
Additionally, the importance of the presented research for urban planning and cultural heritage is a result not only of the growing climatic and environmental threats and their impact on the quality of life. Concentration of water and climate-related problems also affects the possibility of modernizing the urban fabric in historic centers of large cities. Among them there are the urban heat island effect, heat waves, and coastal, fluvial, and pluvial floods.
The historical districts of many cities (including Polish ones) are typically inhabited by aging communities [8,9,10], particularly sensitive to extreme weather phenomena [85]. There has been little research addressing the relationship between quality of life in aging cities and sustainable urban development [95]. We have attempted to partially address this gap. The next step should be to remodel the rankings and use them to evaluate not only entire cities, but also individual districts [5], especially downtown. This can be helpful in detailing climate change adaptation plans and urban renewal programs.
However, we came across certain limitations, mainly concerning a lack of availability of materials and transparency in the definition of particular metrics used in appraisal instruments. Institutions often do not reveal the details of their research methodology [96]; thus, it is hard to deduce what the indicators consider. Appraisal instruments differ significantly, in terms of their purpose, sample size, contracting authorities, intended audience of the study, indicators and categories; thus, they are often incomparable [3,4,5]. That pose also challenges in adopting such indicators in urban planning [3].
Meeting global challenges and the SDGs requires the improvement of QoL assessment tools, in order to support municipalities in their decision-making process and to avoid choosing between quality of life and sustainable urban development and resilience.
Author Contributions
Conceptualization, A.P.-W. and A.J.-S.; methodology A.G., M.M. and A.P.-W.; formal analysis, A.P.-W.; investigation, A.P.-W.; resources, A.P.-W., A.G., M.M. and A.J.-S.; data curation, A.P.-W.; writing—original draft preparation, A.P.-W.; writing—review and editing, A.P.-W., A.G., M.M. and A.J.-S.; visualization, A.P.-W.; supervision, A.G., M.M. and A.J.-S.; project administration, A.P.-W.; funding acquisition, A.G. All authors have read and agreed to the published version of the manuscript.
Funding
This research was funded by Poznan University of Technology, grant number 012/SBAD/0181.
Institutional Review Board Statement
Not applicable.
Data Availability Statement
The data that support the findings of this study are available from the corresponding author, A.P.-W., upon reasonable request.
Conflicts of Interest
The authors declare no conflict of interest. The funders had no role in the design of the study; in the collection, analyses, or interpretation of data; in the writing of the manuscript, or in the decision to publish the results.
References
- World Bank Group; Freire, M.; Lee, M.J.; Lee, M.J.; Bhada-Tata, P. Cities and Climate Change: Responding to an Urgent Agenda; World Bank Publications: Herndon, VA, USA, 2011; ISBN 978-0-8213-8667-5. [Google Scholar]
- United Nations. The Sustainable Development Goals Report 2019; UN: New York, NY, USA, 2019. [Google Scholar] [CrossRef]
- Lowe, M.; Whitzman, C.; Badland, H.; Davern, M.; Aye, L.; Hes, D.; Butterworth, I.; Giles-Corti, B. Planning Healthy, Liveable and Sustainable Cities: How Can Indicators Inform Policy? Urban Policy Res. 2015, 33, 131–144. [Google Scholar] [CrossRef]
- Gawlak, A.; Matuszewska, M.; Ptak, A. Inclusiveness of Urban Space and Tools for the Assessment of the Quality of Urban Life—A Critical Approach. Int. J. Environ. Res. Public Health 2021, 18, 4519. [Google Scholar] [CrossRef]
- Mittal, S.; Chadchan, J.; Mishra, S.K. Review of Concepts, Tools and Indices for the Assessment of Urban Quality of Life. Soc. Indic. Res. 2020, 149, 187–214. [Google Scholar] [CrossRef]
- World Urbanization Prospects: The 2018 Revision, Custom Data Acquired via Website; United Nations. Department of Economic and Social Affairs, Population Division: New York, NY, USA, 2018; Available online: https://population.un.org/wup/DataQuery/ (accessed on 28 April 2021).
- Statistics on European Cities; Eurostat: Luxembourg. 2019. Available online: https://ec.europa.eu/eurostat/statistics-explained/index.php/Statistics_on_European_cities#Population (accessed on 23 April 2021).
- Temelová, J.; Dvořáková, N. Residential Satisfaction of Elderly in the City Centre: The Case of Revitalizing Neighbourhoods in Prague. Cities 2012, 29, 310–317. [Google Scholar] [CrossRef]
- Chong, K.H.; To, K.; Fischer, M.M. Dense and Ageing: Social Sustainability of Public Places amidst High-Density Development. Grow. Compact. Urban Density Sustain. 2017. [Google Scholar] [CrossRef]
- Jancz, A.; Trojanek, R. Housing Preferences of Seniors and Pre-Senior Citizens in Poland—A Case Study. Sustainability 2020, 12, 4599. [Google Scholar] [CrossRef]
- GHO|By Category|Life Expectancy and Healthy Life Expectancy-Data by Country. Available online: https://apps.who.int/gho/data/node.main.688 (accessed on 19 May 2021).
- Gandini, A.; Garmendia, L.; San-Mateos, R. Towards sustainable historic cities: Adaptation to climate change risks. Entrep. Sustain. Issues 2017, 4, 319–327. [Google Scholar] [CrossRef]
- Dastgerdi, A.S.; Sargolini, M.; Pierantoni, I. Climate Change Challenges to Existing Cultural Heritage Policy. Sustainability 2019, 11, 5227. [Google Scholar] [CrossRef]
- Yang, H.; Lee, T.; Juhola, S. The Old and the Climate Adaptation: Climate Justice, Risks, and Urban Adaptation Plan. Sustain. Cities Soc. 2021, 67, 102755. [Google Scholar] [CrossRef]
- Leyva, E.W.A.; Beaman, A.; Davidson, P.M. Health Impact of Climate Change in Older People: An Integrative Review and Implications for Nursing. J. Nurs. Scholarsh. 2017, 49, 670–678. [Google Scholar] [CrossRef] [PubMed]
- Revi, A.; Satterthwaite, D.E.; Aragón-Durand, F.; Corfee-Morlot, J.; Kiunsi, R.B.R.; Pelling, M.; Roberts, D.C.; Solecki, W. Urban areas. In Climate Change 2014: Impacts, Adaptation, and Vulnerability. Part A: Global and Sectoral Aspects. Contribution of Working Group II to the Fifth Assessment Report of the Intergovernmental Panel on Climate Change; Field, C.B., Barros, V.R., Dokken, D.J., Mach, K.J., Mastrandrea, M.D., Bilir, T.E., Chatterjee, M., Ebi, K.L., Estrada, Y.O., Genova, R.C., et al., Eds.; Cambridge University Press: Cambridge, UK; New York, NY, USA, 2014; pp. 535–612. [Google Scholar] [CrossRef]
- World Economic Forum. The Global Risks Report 2021. Insight Report; World Economic Forum: Cologny/Geneva, Switzerland, 2021. [Google Scholar]
- Global Warming of 1.5 °C. An IPCC Special Report on the Impacts of Global Warming of 1.5°C above Pre-Industrial Levels and Related Global Greenhouse Gas Emission Pathways, in the Context of Strengthening the Global Response to the Threat of Climate Change, Sustainable Development, and Efforts to Eradicate Poverty; IPPC: Rome, Italy, 2019; Available online: https://www.ipcc.ch/sr15/ (accessed on 22 April 2021).
- Rosenzweig, C.; Solecki, W.D.; Hammer, S.A.; Mehrotra, S. Climate Change and Cities: First Assessment Report of the Urban Climate Change Research Network; Cambridge University Press: Cambridge, UK, 2011; Available online: https://books.google.pl/books?hl=en&lr=&id=9GHW24KCuBYC&oi=fnd&pg=PR7&dq=climate+change+impact+on+seniors%27+quality+of+life+and+cities++&ots=_4rBX1v_MC&sig=ZrrYpvXBrrvRfMlRffRmnyKlpbg&redir_esc=y#v=onepage&q=climate%20change%20impact%20on%20seniors’%20quality%20of%20life%20and%20cities&f=false (accessed on 23 April 2021).
- Benevolenza, M.A.; DeRigne, L. The impact of climate change and natural disasters on vulnerable populations: A systematic review of literature. J. Hum. Behav. Soc. Environ. 2019, 29, 266–281. [Google Scholar] [CrossRef]
- Hoornweg, D.; Sugar, L.; Lorena Trejos Gomez, C. in press; Cities and Greenhouse Gas Emissions: Challenges and Opportunities. Environ. Urban. 2011, 23, 207–227. [Google Scholar] [CrossRef]
- Mbow, H.-O.P.; Reisinger, A.; Canadell, J.; O’Brien, P. Special Report on Climate Change, Desertification, Land Degradation, Sustainable Land Management, Food Security, and Greenhouse Gas Fluxes in Terrestrial Ecosystems (SR2); IPCC: Geneva, Switzerland, 2017; Available online: https://www.ipcc.ch/report/srccl/ (accessed on 10 August 2020).
- Liang, L.; Deng, X.; Wang, P.; Wang, Z.; Wang, L. Assessment of the Impact of Climate Change on Cities Livability in China. Sci. Total Environ. 2020, 726, 138339. [Google Scholar] [CrossRef]
- Hunt, A.; Watkiss, P. Climate Change Impacts and Adaptation in Cities: A Review of the Literature. Clim. Chang. 2011, 104, 13–49. [Google Scholar] [CrossRef]
- Megarry, W. Future of Our Pasts: Engaging Cultural Heritage in Climate Action: Report of the ICOMOS Workings Group on Climate Change and Cultural Heritage; ICOMOS: Paris, France, 2019; Available online: https://adobeindd.com/view/publications/a9a551e3-3b23-4127-99fd-a7a80d91a29e/g18m/publication-web-resources/pdf/CCHWG_final_print.pdf (accessed on 19 May 2021).
- The United Nations World Water Development Report 2021: Valuing Water; UNESCO: Paris, France, 2021. Available online: http://www.unesco.org/reports/wwdr/2021/en/download-the-report (accessed on 23 March 2021).
- The 17 GOALS|Sustainable Development. Available online: https://sdgs.un.org/goals (accessed on 19 May 2021).
- Grellier, J.; White, M.P.; Albin, M.; Bell, S.; Elliott, L.R.; Gascón, M.; Gualdi, S.; Mancini, L.; Nieuwenhuijsen, M.J.; Sarigiannis, D.A.; et al. BlueHealth: A Study Programme Protocol for Mapping and Quantifying the Potential Benefits to Public Health and Well-Being from Europe’s Blue Spaces. BMJ Open 2017, 7, e016188. [Google Scholar] [CrossRef]
- The IWA Principles for Water Wise Cities, 2nd ed.; IWA: London, UK, 2016; Available online: https://iwa-network.org/publications/the-iwa-principles-for-water-wise-cities/ (accessed on 19 May 2021).
- Arcadis. Sustainable Cities Water Index: Which Cities Are Best. Placed to Harness Water for Future Success; Arcadis: Amsterdam, The Netherlands, 2016; Available online: https://www.arcadis.com/en/global/our-perspectives/which-cities-are-best-placed-to-harness-water-for-future-success-/ (accessed on 23 April 2021).
- Roberts, W.O. Climate Change and the Quality of Life for the Earth’s New Millions. Proc. Am. Philos. Soc. 1976, 120, 230–232. Available online: https://www.jstor.org/stable/986562 (accessed on 23 April 2021).
- Estoque, R.C.; Togawa, T.; Ooba, M.; Gomi, K.; Nakamura, S.; Hijioka, Y.; Kameyama, Y. A Review of Quality of Life (QOL) Assessments and Indicators: Towards a “QOL-Climate” Assessment Framework. Ambio 2019, 48, 619–638. [Google Scholar] [CrossRef] [PubMed]
- Newton, P.W. Liveable and Sustainable? Socio-Technical Challenges for Twenty-First-Century Cities. J. Urban Technol. 2012, 19, 81–102. [Google Scholar] [CrossRef]
- China Council for International Cooperation on Environment and Development and WWF. Report on Ecological Footprint in China; China Council for International Cooperation on Environment and Development and WWF: Beijing, China, 2008.
- Jones, C.; Newsome, D. Perth (Australia) as One of the World’s Most Liveable Cities: A Perspective on Society, Sustainability and environment. Int. J. Tour. Cities 2015, 1, 18–35. [Google Scholar] [CrossRef]
- Global Age-Friendly Cities: A Guide; World Health Organization: Geneva, Switzerland, 2007; Available online: https://www.who.int/ageing/publications/Global_age_friendly_cities_Guide_English.pdf (accessed on 23 April 2021).
- Van der Weijst, L. Measuring the Age-Friendliness of Cities: A Guide to Using Core Indicators; WHO: Kobe, Japan, 2015; Available online: https://www.who.int/ageing/age_friendly_cities_guide/en/ (accessed on 23 April 2021).
- Seniors, F.M.R. Age-Friendly Rural and Remote Communities: A Guide; Federal/Provincial/Territorial Ministers Responsible for Seniors: Toronto, ON, CA, 2007; Available online: https://www.phac-aspc.gc.ca/seniors-aines/alt-formats/pdf/publications/public/healthy-sante/age_friendly_rural/AFRRC_en.pdf (accessed on 23 April 2021).
- Błędowski, P.; Szatur-Jaworska, B.; Bakalarczyk, R.; Łuczak, P.; Szweda-Lewandowska, Z.; Zrałek, M.; Plak, J.; Zubrzycka-Czarnecka, A. System Wsparcia Osób Starszych w Środowisku Zamieszkania: Przegląd Sytuacji, Propozycja Modelu (System of Support for the Elderly in the Living Environment-Overview of the Situation, Model Proposal. Synthesis); Biuro Rzecznika Praw Obywatelskich: Warsaw, Poland, 2016; ISBN 978-83-65029-19-5. [Google Scholar]
- The Global Liveability Index 2019; The Economist Intelligence Unit: London, UK, 2019; Available online: https://www.eiu.com/public/topical_report.aspx?campaignid=liveability2019 (accessed on 23 April 2021).
- Mercer. Quality of Living-Location Reports. Available online: https://mobilityexchange.mercer.com/Insights/quality-of-living-rankings (accessed on 23 April 2021).
- Monocle. Quality of Life Survey. Monocle 2019, 13, 41–65. Available online: https://monocle.com/magazine/issues/125/quality-of-life-survey/ (accessed on 23 April 2021).
- Reid, J.; Nicol, C.; Allen, H. Mapping the World’s Prices 2019. Thematic Research; Deutsche Bank AG: London, UK, 2019; Available online: https://www.dbresearch.com/PROD/RPS_EN-PROD/PROD0000000000494405/Mapping_the_world%27s_prices_2019.pdf?undefined&realload=F2~IVP2mCVDyfT99gzd7uKrqddmpspNMhF8BAP9Ave1vRpxfiznJaIQdrVH3WOK73x~GZGNgCWzIHs~wiDkeQw== (accessed on 23 April 2021).
- Björnberg, A.; Phang, A.Y. Euro Health Consumer Index 2018; Health Consumer Powerhouse: Marseillan, France, 2019; Available online: https://healthpowerhouse.com/publications/ (accessed on 23 April 2021).
- IMD World Competitiveness Center’s Smart City Observatory, Singapore University of Technology and Design. IMD Smart City Index; The IMD World Competitiveness Center: Lausanne, France; Beach Road, Singapore, 2019; Available online: https://www.imd.org/research-knowledge/reports/imd-smart-city-index-2019/ (accessed on 23 April 2021).
- Kubendran, S.; Soll, L.; Irving, P. Best Cities for Successful Aging 2017; Milken Institute, Santa Monica, California, US 2017. Available online: https://milkeninstitute.org/reports/best-cities-successful-aging-2017 (accessed on 23 April 2021).
- Human Development Report 2019. Beyond Income, beyond Averages, beyond Today: Inequalities in Human Development in the 21st Century; UNDP: New York, NY, USA, 2019; Available online: http://hdr.undp.org/sites/default/files/hdr2019.pdf (accessed on 23 April 2021).
- Final Report of the Expert Group on Quality of Life Indicators; Publications office of the European Union, Eurostat: Luxembourg, 2017. [CrossRef]
- European Quality of Life Survey 2016: Quality of life, Quality of Public Services, and Quality of Society; Publications Office of the European Union: Luxembourg, 2017. [CrossRef]
- How’s Life? 2020: Measuring Well-Being; OECD: Paris, France, 2020; Available online: https://www.oecd-ilibrary.org/economics/how-s-life/volume-/issue-_9870c393-en (accessed on 19 May 2021).
- Quality of Life in Cities: Perception Survey in 79 European Cities; Publications Office: Luxembourg, 2013. [CrossRef]
- 2018 Active Ageing Index. Analytical Report; UNECE/European Commission: Geneva, Switzerland, 2019; Available online: https://unece.org/population/active-ageing-index (accessed on 23 April 2021).
- Polityka & Akademia Górniczo-Hutnicza. Ranking Jakości Życia. Wymiary Szczęścia (Quality of Life Ranking. Dimensions of Happiness); Polityka & Akademia Górniczo-Hutnicza: Cracow; Warsaw, Poland, 2018. [Google Scholar]
- Wałachowski, K.; Król, S. Uciekające Metropolie. Ranking 100 Polskich Miast (Runaway Metropolises. Ranking of 100 Polish Cities); Klub Jagielloński: Kraków, Polska, 2019. [Google Scholar]
- Bendowska, M.; Bieńkuńska, A.; Ciecieląg, P.; Luty, P.; Sobesjański, K.; Wójcik, J. Jakość Życia w Polsce. Edycja 2017 (Quality of Life in Poland 2017 Edition); Central Statistical Office: Warsaw, Poland, 2017. [Google Scholar]
- CBOS. Zadowolenie z Życia (Life Satisfaction); CBOS: Warsaw, Poland, 2020. [Google Scholar]
- Batorski, D.; Białowolski, P.; Czapiński, J.; Grabowska, I.; Kotowska, I.E.; Panek, T.; Pawlak, K.; Pytkowska, J.; Saczuk, K.; Strzelecki, P.; et al. Diagnoza Społeczna 2015. Warunki i Jakość Życia Polaków. Raport (Social Diagnosis 2015. Objective and Subjective Quality of Life in Poland. Report); Czapiński, J., Panek, P., Eds.; Rada Monitoringu Społecznego: Warsaw, Poland, 2015. [Google Scholar]
- Rokicka, E.; Petelewicz, M.; Woźniak, W.; Dytrych, J.; Przybylski, B.K.; Kruczkowska, P.; Drabowicz, T. Jakość Życia Mieszkańców Łodzi i Jej Przestrzenne Zróżnicowanie. (Quality of Life of Lodz Inhabitants and City’s Spatial Diversity); Rokicka, E., Ed.; Wydawnictwo Uniwersytetu Łódzkiego: Lodz, Poland, 2013. [Google Scholar]
- Jak Się Żyje Osobom Starszym w Polsce (How Is Life for the Elderly in Poland); Central Statistical Office: Warsaw, Poland, 2012. Available online: https://stat.gov.pl/obszary-tematyczne/warunki-zycia/dochody-wydatki-i-warunki-zycia-ludnosci/jak-sie-zyje-osobom-starszym-w-polsce-,8,1.html (accessed on 19 May 2021).
- Száraz, L. The Impact of Urban Green Spaces on Climate and Air Quality in Cities. Geogr. Locality Stud. 2014, 2, 326–354. [Google Scholar]
- Kozak, D.; Henderson, H.; de Castro Mazarro, A.; Rotbart, D.; Aradas, R. Blue-Green Infrastructure (BGI) in Dense Urban Watersheds. The Case of the Medrano Stream Basin (MSB) in Buenos Aires. Sustainability 2020, 12, 2163. [Google Scholar] [CrossRef]
- Hamel, P.; Tan, L. Blue–Green Infrastructure for Flood and Water Quality Management in Southeast Asia: Evidence and Knowledge Gaps. Environ. Manag. 2021, 1–20. [Google Scholar] [CrossRef]
- Citizen Centric Cities. The Sustainable Cities Index 2018; Arcadis: Amsterdam, The Netherlands, 2018; Available online: https://www.arcadis.com/en/global/our-perspectives/sustainable-cities-index-2018/citizen-centric-cities/ (accessed on 21 February 2021).
- Resilient Cities: A Grosvenor Research Report; Grosvenor: San Francisco, CA, USA, 2014; Available online: https://www.adaptationclearinghouse.org/resources/resilient-cities-a-grosvenor-research-report.html (accessed on 28 April 2021).
- Cohen, B. Global Ranking of Top 10 Resilient Cities; TriplePundit: Northampton, MA, USA, 2011; Available online: https://www.triplepundit.com/story/2011/global-ranking-top-10-resilient-cities/76411 (accessed on 28 April 2021).
- Wyzwania i Rekomendacje Dla Krajowej Polityki Miejskiej. Raport Tematycznych Grup Eksperckich Kongresu Polityki Miejskiej 2019; Kongres Polityki Miejskiej: Katowice, Poland, 2019; Available online: http://obserwatorium.miasta.pl/wp-content/uploads/2020/07/raport-wyzwania-i-rekomendacje-krajowa-polityka-miejska-Rajmund-Ry%C5%9B-Pawe%C5%82-G%C3%B3rny-Agnieszka-Sobol-Alina-Muzio%C5%82-Wec%C5%82awowicz.pdf (accessed on 19 May 2021).
- Oke, T.R. City Size and the Urban Heat Island. Atmos. Environ. 1973, 7, 769–779. [Google Scholar] [CrossRef]
- Oke, T.R.; Mills, G.; Christen, A.; Voogt, J.A. Urban Climates; Cambridge University Press: Cambridge, UK, 2017. [Google Scholar]
- Voogt, J.A.; Oke, T.R. Thermal remote sensing of urban climates. Remote Sens. Environ. 2003, 86, 370–384. [Google Scholar] [CrossRef]
- Davtalab, J.; Deyhimi, S.P.; Dessi, V.; Reza Hafezi, M.; Adib, M. The impact of green space structure on physiological equivalent temperature index in open space. Urban Clim. 2020, 31, 100574. [Google Scholar] [CrossRef]
- Fortuniak, K. Numerical estimation of the effective albedo of an urban canyon. Theor. Appl. Climatol. 2008, 91, 245–258. [Google Scholar] [CrossRef]
- Januchta-Szostak, A. River-Friendly Cities, 1st ed.; Peter Lang: Berlin, Germany; Bern, Switzerland; Bruxelles, Belgium; New York, NY, USA; Oxford, UK; Warszawa, Poland; Wien, Austria, 2020. [Google Scholar] [CrossRef]
- Krauze, K.; Wagner, I. From Classical Water-Ecosystem Theories to Nature-Based Solutions—Contextualizing Nature-Based Solutions for Sustainable City. Sci. Total Environ. 2019, 655, 697–706. [Google Scholar] [CrossRef] [PubMed]
- Kundzewicz, Z.W. Non-structural Flood Protection and Sustainability. Water Int. 2002, 27, 3–13. [Google Scholar] [CrossRef]
- Koop, S.H.A. Towards Water-Wise Cities: Global Assessment of Water Management and Governance Capacities. Ph.D. Thesis, Utrecht University, Utrecht, The Netherlands, 2019. Available online: https://dspace.library.uu.nl/handle/1874/378386 (accessed on 23 April 2021).
- Watts, N.; Amann, M.; Ayeb-Karlsson, S.; Belesova, K.; Bouley, T.; Boykoff, M.; Byass, P.; Cai, W.; Campbell-Lendrum, D.; Chambers, J. The Lancet Countdown on Health and Climate Change: From 25 Years of Inaction to a Global Transformation for Public Health. Lancet 2018, 391, 581–630. [Google Scholar] [CrossRef]
- Januchta-Szostak, A.; Banasik, K.; Chudziński, P.; Drzewiecki, S.; Hausner, J.; Jania, J.; Kundzewicz, Z.; Kutek, K.; Konieczny, R.; Licznar, P.; et al. Alert Wodny Nr 3–Woda w Miastach. Gospod. Wodna 2020, 8, 4–6. [Google Scholar]
- Sobol, A. Raport Roboczy Grupy Eksperckiej Kongresu Polityki Miejskiej Ds. Środowiska i Adaptacji Do Zmian Klimatu, Obserwato-Rium Polityki Miejskiej; IRMiR: Cracow, Poland, 2019. [Google Scholar]
- Ćmielowski, M.; Głowacki, J.; Hausner, J.; Kudłacz, M.; Kutek, K. Water City Index 2020. Ranking Efektywności Wykorzystania Zasobów Wody w Polskich Miastach; Arcadis: Amsterdam, The Netherlands, 2020; Available online: https://oees.pl/water-city-index-2020/ (accessed on 23 April 2021).
- Li, G.; Weng, Q. Measuring the Quality of Life in City of Indianapolis by Integration of Remote Sensing and Census Data. Int. J. Remote Sens. 2007, 28, 249–267. [Google Scholar] [CrossRef]
- Rao, K.R.M.; Kant, Y.; Gahlaut, N.; Roy, P.S. Assessment of Quality of Life in Uttarakhand, India Using Geospatial Techniques. Geocarto Int. 2012, 27, 315–328. [Google Scholar] [CrossRef]
- Morais, P.; Camanho, A.S. Evaluation of Performance of European Cities with the Aim to Promote Quality of Life Improvements. Omega 2011, 39, 398–409. [Google Scholar] [CrossRef]
- Estoque, R.C.; Murayama, Y. A Worldwide Country-Based Assessment of Social-Ecological Status (c. 2010) Using the Social-Ecological Status Index. Ecol. Indic. 2017, 72, 605–614. [Google Scholar] [CrossRef]
- PwC. Cities of Opportunity; PwC: London, UK, 2016. [Google Scholar]
- Lee, J.Y.; Kim, H. Projection of Future Temperature-Related Mortality Due to Climate and Demographic Changes. Environ. Int. 2016, 94, 489–494. [Google Scholar] [CrossRef]
- Labadi, S.; Giliberto, F.; Rosetti, I.; Shetabi, L.; Yildirim, E. Heritage and the Sustainable Development Goals: Policy Guidance for Heritage and Development Actors; ICOMOS: Warsaw, Poland, 2021; Volume 1, pp. 1–69. [Google Scholar]
- New European Bauhaus: Beautiful, Sustainable, Together. Available online: https://europa.eu/new-european-bauhaus/index_en (accessed on 19 May 2021).
- Bieri, D. Are Green Cities Nice Places to Live? Examining the Link between Urban Sustainability and Quality of Life. Mich. J. Sustain. 2013, 1, 44–73. [Google Scholar] [CrossRef]
- Promoting Investment for Sustainable Development in Cities; UNCTAD: Geneva, Switzerland, 2019; Available online: https://unctad.org/system/files/official-document/diaepcbinf2019d1_en.pdf (accessed on 26 May 2021).
- Marco, K.; Mihir, P.; Hannes, B. Financing Sustainable Urbanization: Counting the Costs and Closing the Gap; UN-Habitat: Nairobi, Kenya, 2020; Available online: https://unhabitat.org/sites/default/files/2020/02/financing_sustainable_urbanization_-_counting_the_costs_and_closing_the_gap_february_2020.pdf (accessed on 26 May 2021).
- 2019 Forum of the Standing Commitee on Finance: Climate Finance and Sustainable Cities; United Nations. Framework Convention on Climate Change: Bonn, Germany, 2019. Available online: https://unfccc.int/sites/default/files/resource/SCF%20Forum%202019%20report_final.pdf (accessed on 26 May 2021).
- Mochizuki, Y.; Fadeeva, Z. Competences for Sustainable Development and Sustainability: Significance and Challenges for ESD. Int. J. Sustain. High. Educ. 2010, 11, 391–403. [Google Scholar] [CrossRef]
- Paris Agreement; United Nations: Bonn, Germany, 2015. Available online: https://unfccc.int/sites/default/files/english_paris_agreement.pdf (accessed on 26 May 2021).
- Leach, J.M.; Braithwaite, P.A.; Lee, S.E.; Bouch, C.J.; Hunt, D.V.; Rogers, C.D. Measuring Urban Sustainability and Liveability Performance: The City Analysis Methodology. Int. J. Appl. Sci. Technol. 2016, 1, 86–106. [Google Scholar] [CrossRef]
- Qian, Q.K.; Ho, W.K.; Ochoa, J.J.; Chan, E.H. Does Aging-Friendly Enhance Sustainability? Evidence from Hong Kong. Sustain. Dev. 2019, 27, 657–668. [Google Scholar] [CrossRef]
- Acuto, M.; Pejic, D.; Briggs, J. Taking City Rankings Seriously: Engaging with Benchmarking Practices in Global Urbanism. Int. J. Urban Reg. Res. 2021, 45, 363–377. [Google Scholar] [CrossRef]


Publisher’s Note: MDPI stays neutral with regard to jurisdictional claims in published maps and institutional affiliations. |
© 2021 by the authors. Licensee MDPI, Basel, Switzerland. This article is an open access article distributed under the terms and conditions of the Creative Commons Attribution (CC BY) license (https://creativecommons.org/licenses/by/4.0/).