Article

Electrospun Nanofibre Air Filters for Particles and Gaseous Pollutants

1
Department of the Built Environment, Aalborg University, DK-2450 Copenhagen, Denmark
2
Department of Chemistry, University of Copenhagen, DK-2100 Copenhagen, Denmark
3
Department of Materials and Production, Aalborg University, DK-9220 Aalborg, Denmark
*
Author to whom correspondence should be addressed.
Sustainability 2021, 13(12), 6553; https://doi.org/10.3390/su13126553
Submission received: 23 March 2021 / Revised: 1 June 2021 / Accepted: 4 June 2021 / Published: 8 June 2021
(This article belongs to the Special Issue Sustainable Building and Sustainable Indoor Environment)

Abstract

:
Nanofibre filters may offer new properties not available in commercial fibre filters. These include a higher surface area and the ability to include novel materials within the fibres. In addition the small size allows potential gains in performance due to the slip-flow phenomenon in which normal gas viscosity does not apply to objects smaller than the mean free path of the gas. We tested the properties of novel electrospun fibre filters generated from polyvinyl alcohol solutions, optionally embedded with nano-grains of photocatalytic TiO2 and activated charcoal. The tested materials exhibited pressure drops in the range of 195 Pa to 2693 Pa for a face velocity of 5.3 cm/s and a removal efficiency greater than 97% for 12–480 nm particles. Basis weights for the filters ranged from 16.6 to 67.6 g/m2 and specific surface areas ranged from 1.4 to 17.4 m2/g. Reactivity towards volatile organic compounds (VOCs) was achieved by irradiating the photocatalytic filters with ultraviolet light. It is necessary to solve the problems connected to the absorbance of VOCs and further reduce the resistance to airflow in order for these filters to achieve widespread use. The incorporation of reactive air filtration into building ventilation systems will contribute to improved indoor air quality.

1. Introduction

Air pollution is responsible for an estimated global mortality rate of 8.8 million/year and an estimated loss of life expectancy of 2.9 years [1]. This is higher than the mortality rate for tobacco smoke (active and passive), estimated at 7.2 million/year by the World Health Organization (WHO) [2]. The loss of life expectancy from air pollution exceeds that of all forms of violence, HIV/AIDS, and smoking [1]. Several studies have reported correlations between outdoor air pollution and cardiovascular and respiratory diseases [3,4,5,6].
As people now spend most of their lives indoors, most exposure to air pollution occurs inside buildings. The origin of such indoor air pollutants is either the outdoor air pollution entering buildings or indoor sources, including cooking, cleaning products, office equipment, chemical reactions with indoor materials, and different biological sources, such as pets, people, and mould [7]. Air pollution is based on a mixture of numerous components, including solid substances, such as particles, and gaseous pollutants, such as volatile organic compounds (VOCs), carbon monoxide (CO), sulphur dioxide (SO2), ozone, and nitrogen dioxide (NO2) [8]. The removal of pollutants through air filters as part of the building ventilation system is a common solution to ensure adequate indoor air quality. In addition filters are used to ensure sufficient supply of clean air from outside the building.
Particles and VOCs can be filtered or removed using different types of filters available on the market. Conventional fibre filters are commonly used in ventilation systems to remove coarse, fine, and even ultrafine particles. Adsorption, condensation, membrane separation, and thermal or catalytic oxidation are some of the methods available for the removal or destruction of VOCs [9,10]. Commercial fibrous filters usually achieve a high filtration efficiency combined with the requirement of a high pressure drop (typical behaviour for HEPA filters) because of their multilayered structure of relatively thick fibres in the diameter range from a few to tens of micrometres. Every fibre filter resists the flow of air, resulting in a pressure drop. In SI units, the pressure drop is measured using Pa = J m−3. Multiplying the pressure drop by a flow (e.g., m3/s), results in the Watts of power needed to sustain the flow as W = J/s. Thus, a large amount of energy is used to filter air. In commercial buildings with an installed rooftop HVAC unit, the fan energy needed to move the air accounts for 7% of the total building energy use [11].
Nanofibre air filters are of increasing interest because of their larger surface-to-volume ratio, lower air resistance, and enhanced filtration performance compared with conventional microfibre filters [12]. According to theoretical models, the use of nanofibres should lead to a smaller pressure drop than for a microfiber filter of the same particle cleaning efficiency by taking advantage of slip flow. Slip flow is a phenomenon in which the friction of a gas passing an object decreases when the object is smaller than the mean free path of the molecules in the gas, which is around 65 nm for air [13]. Recently, a filter was fabricated and tested, and the authors demonstrated this effect for electrospun nanofibres [14].
Electrospinning is a versatile and effective method for producing polymer-based nanofibres. The electrospinning setup consists of the following basic components: a syringe pump, including tubes and a needle where the polymer solution is kept and carried from the syringe cylinder to the tip of the needle; a high-voltage electric source connected to the needle; and a collector connected to the ground. High voltage is applied to the fluid, which overcomes its surface tension and forms a so-called Taylor cone on the needle tip. The fluid elongates in a jet form, and as it moves towards the collector, the solvent evaporates. The result is nanofibre formation with a diameter ranging from about 50 to 500 nm, deposited on the collector [15]. The critical advantage of electrospinning is related to the unique opportunity of integrating active catalysts onto the fibre surface to provide the simultaneous filtration of particles and the removal of gaseous compounds [16].
A wide variety of materials can be spun, such as polymers, composites, and ceramics [17]. Many high-molecular-weight polymers have been electrospun in previous research studies, including polyurethane [18], polyvinylpyrrolidone [19], polysulfone (PSU) [20], polyacrylonitrile (PAN) [14,21], and poly(vinyl alcohol) (PVA) [22,23,24]. Zhao et al. [14] fabricated PAN-based electrospun nanofibre membranes to investigate the slip flow phenomenon and evaluate the filtration performance. Optimising the fabrication parameters, the authors obtained a low pressure drop of 29.5 Pa under a face velocity of 5.3 cm/s and the filtration of particulate matter with an aerodynamic diameter below 2.5 µm (PM2.5) of 99.09%. Wang et al. [22] demonstrated that PVA nanofibres electrospun on a conventional cotton scaffold can achieve a higher filtration efficiency for particles under 1 µm compared with conventional fibrous filters. Compared with other polymers, such as PAN, which is soluble in N,N-dimethylformamide, a highly toxic organic solvent, PVA is a water-soluble, biodegradable polymer, which makes it a more sustainable choice for fabricating air filters.
Several additives have been investigated in regards to their capacity to enhance the filtration selectivity of electrospun nanofibre filters, including titanium dioxide (TiO2) and activated charcoal (AC). Polymer-based activated carbon nanofibres have exhibited doubled formaldehyde absorbance capacity compared with conventional activated carbon fibres with a larger fibre diameter [21], a toluene adsorption capacity of above 65 g of toluene/100 g of composite [25,26] and NO removal in the air at room temperature, as stated in [27]. Activated carbon is usually produced on the nanofibre surface through carbonisation after electrospinning [21,25,26,27]. Wan et al. [20] demonstrated that a PSU/TiO2 membrane has an improved filtration efficiency (99.997%) for 300- to 500-nm sodium chloride particles and a pressure drop (43.5 Pa) under an airflow of 30 L/min compared with a pristine PSU nanofibre filter. Titanium dioxide has been widely used as a catalyst to initiate photocatalytic oxidation and degrade VOCs [10,23]. The PVA/TiO2 electrospun nanofibre filter exhibited 99% removal efficiency of acetone with an ultraviolet light source at 254 nm and a retention time of 100 s. The filter also performed well for air particles, with a removal efficiency of 90% for particles over 200 nm [23].
The hypothesis of this study is that composite electrospun nanofibre filters will be better than conventional fibre filters in simultaneously removing particles and gaseous pollutants, with a reduced pressure drop, including in the context of indoor air quality. The objective of the study is to develop a PVA-based electrospun nanofibre filter that is effective for both particle filtration and gaseous contaminant removal. Ideally, the resulting filter will have a pressure drop that has a minimal impact on building energy use when installed in the HVAC system. The assumption is that the electrospun PVA nanofibre filter will remove particles through interception and diffusion. In contrast, additives, such as TiO2 or activated carbon, mixed inside the polymer solution prior to electrospinning, chemically activate the filter towards gaseous compounds and promote the degradation or absorbance of gaseous pollutants. The nanofibre dimension promotes slip flow which will ideally allow the filter to function with minimal pressure drop.
The electrospinning process and nanofibre characterisation are presented in this paper. Furthermore, the experimental study results are described and discussed regarding the filtration performance for the degradation of toluene, the removal of 12- to 480-nm diameter particles, and the filter pressure drop.
Ideally, the filter developed here would find use in improving indoor air quality in residential and office buildings. The low pressure drop would ensure that the use of the filter would impact building energy use as little as possible while simultaneously removing particles and gaseous pollutants with a single stage filtration technology.

2. Materials and Methods

2.1. Materials

Poly(vinyl alcohol) (PVA, MW 89,000–98,000 g/mol, 99+% hydrolysed) and AC (MW 12.01 g/mol) in powder form were purchased from Sigma-Aldrich. Aeroxide TiO2 P25 in nanopowder form was a gift from Evonik Industries. Ethanol 96% vol and distilled water were used as received. The materials were used without further purification.

2.2. Fabrication of Electrospun Nanofibre Filters

The solutions were prepared by mixing the materials at different ratios. The PVA (10 w/v%) was prepared by adding 5 g of PVA into 50 mL of distilled water at 90–100 °C under vigorous stirring until the polymer was completely dissolved. In addition, 1 g and 2.5 g of AC were dispersed separately in 10 mL of ethanol and then added to the polymer solutions (5 g of PVA dissolved into 40 mL of distilled water) and stirred for 1 h. Two different solutions were prepared by mixing 2.5 g of TiO2 into 15 mL of ethanol. One was added to a solution of 5 g of PVA dissolved into 35 mL of distilled water. The second was mixed into 4 g of PVA dissolved in 35 mL of distilled water.
The electrospinning setup consisted of a syringe pump, a high-voltage power supply, a flat plate, and a 1.1 mm inner diameter needle. Electrospinning was performed in an upward vertical configuration. The different solutions were loaded in 10 mL syringes, which were inserted into the electrospinning setup. The electrospinning parameters were considered and tuned during the experiment to reach stability are the tip-to-collector distance (TCD), applied voltage, and the feed rate of the polymer solution. The TCD was set between 16 and 19.5 cm, whereas the applied voltage ranged from 11.1 to 25.7 kV. The feed rate varied between 0.12 and 1 mL/h.

2.3. Nanofibre Characterisation

The surface morphology of the filter samples was evaluated using scanning electron microscopy (SEM; Zeiss XB1540), operating at 5 kV. Before scanning, the samples were coated with a thin layer of gold. The average fibre diameter was determined by analysing the SEM pictures using the DiameterJ plugin to the ImageJ software (NIH, USA). Specific surface areas (SSAs) were characterised using the Brunauer–Emmett–Teller (BET) method. Total pore volume and pore size were estimated using the Barrett–Joyner–Halenda (BJH) method. A BET instrument from the company Quantachrome, the Autosorb 1-MP, was used for this purpose. The samples were degassed at 50 °C. The surface area of the samples was measured by nitrogen adsorption using the BET equation at 77.3 K. The integrity of the materials and the presence of solvent in the filters were investigated using Fourier transform infrared spectroscopy (FTIR; LUMOS, Bruker Corporation, Billerica, MA, USA) on the pure PVA filter in the spectral range between 600 and 4000 cm−1 with a resolution of 2 cm−1. Furthermore, the Raman spectra of PVA and PVA/TiO2 filter samples was recorded using a Renishaw InVia spectrometer with 532 nm laser excitation. Thermogravimetric analysis (TGA; Discovery TGA, TA Instruments, New Castle, DE, USA) was performed on the PVA sample from 26 to 60 °C at a heating rate of 5 °C/min in the air.

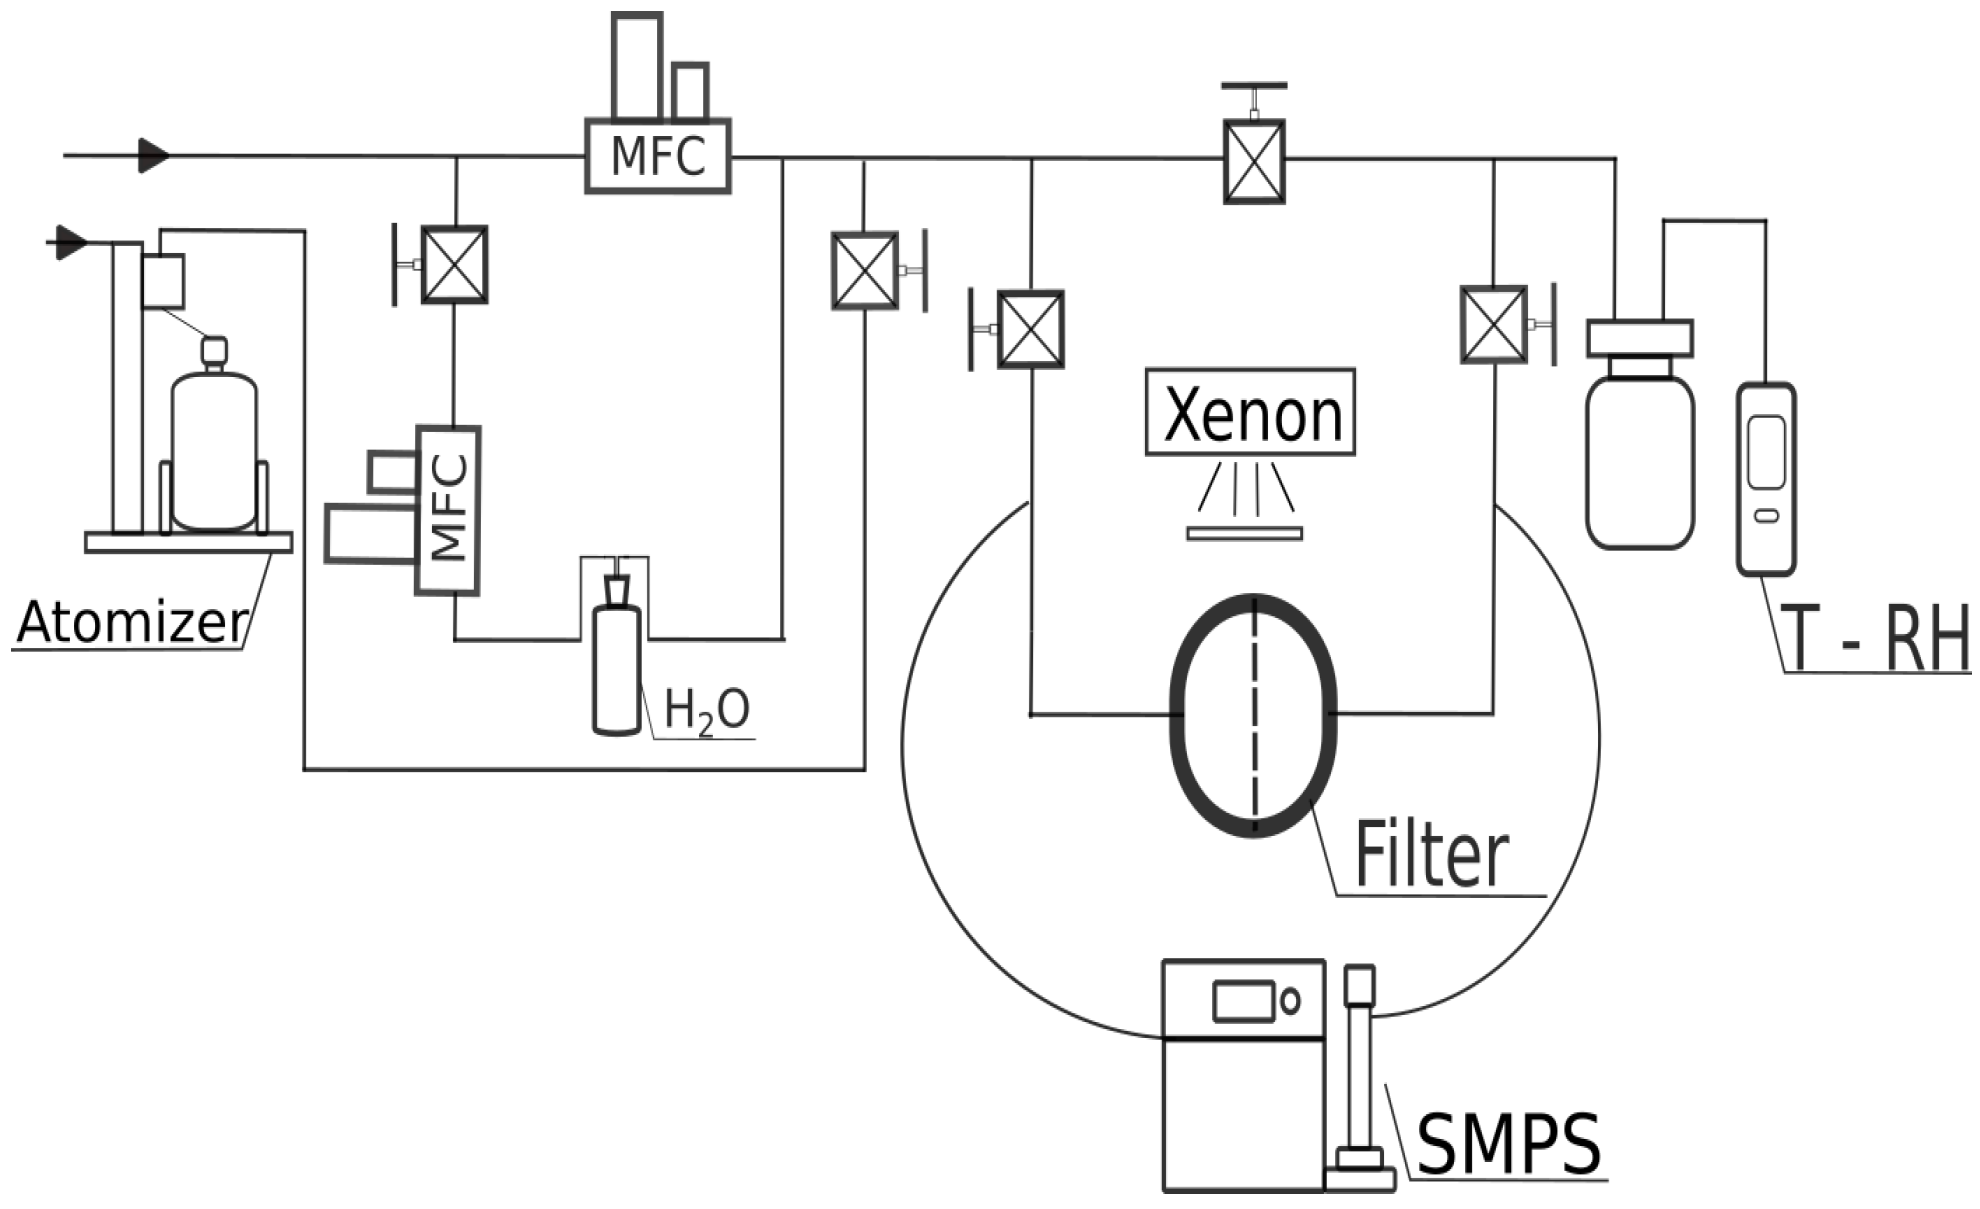
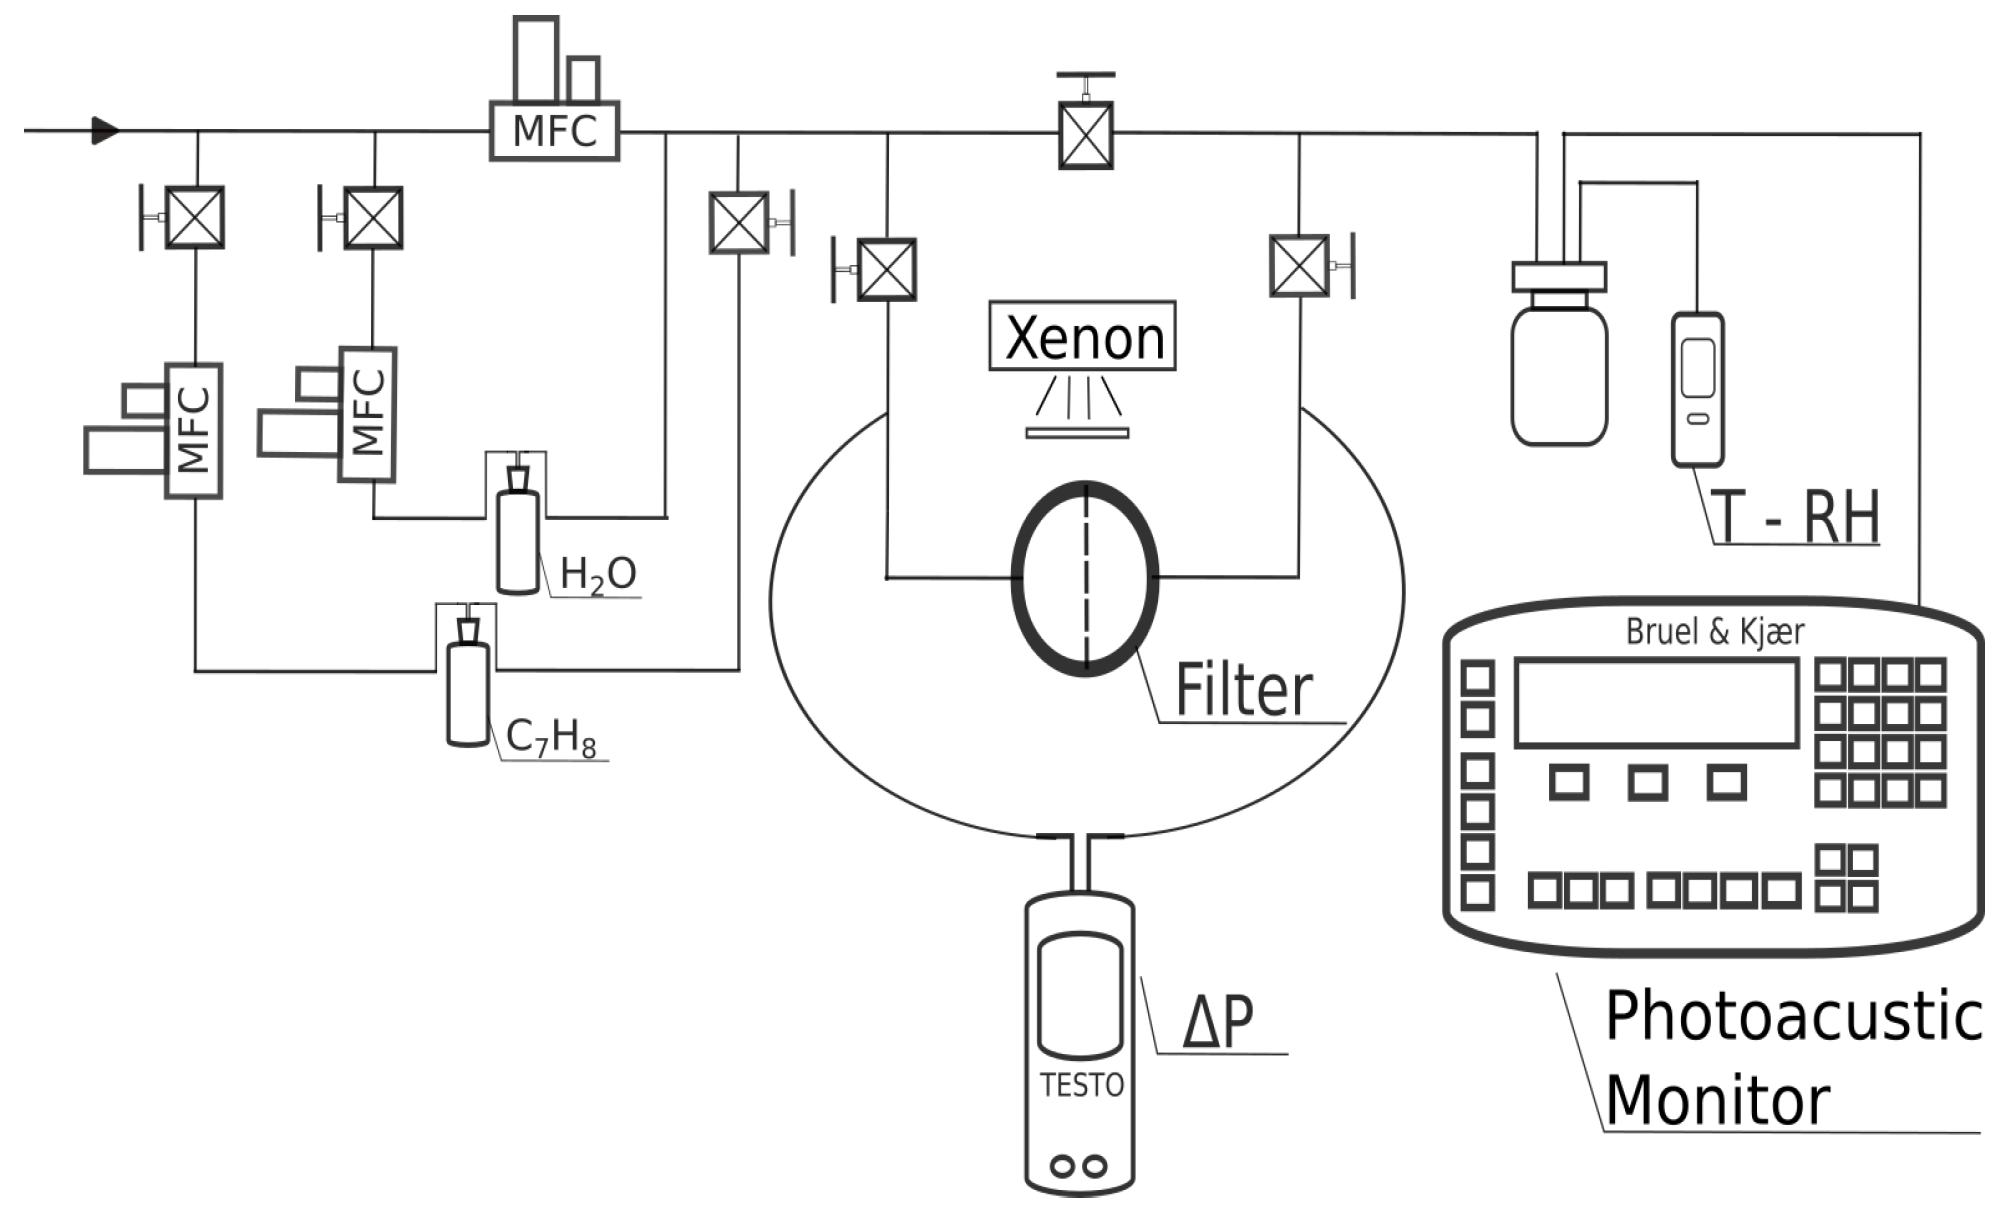
2.4. Investigation of Filtration Performance

The filtration performance of the PVA-based filter samples was investigated for pressure drop, particle filtration, and VOC removal. The nanofibre materials were cut into 5.1 cm diameter filters and weighed using an electronic balance to measure the filter basis weight. Each filter was placed into a reactor with a 4 cm diameter filtration area. The pressure drop was evaluated at three different face velocities (5.3 cm/s, 7.95 cm/s, 10.6 cm/s) to investigate the correlation between the pressure drop and face velocity [28]. The Testo 480 differential pressure sensor was used, with a resolution of ±0.1 Pa and an accuracy of ±0.3 Pa. Before starting the pressure measurement, the background pressure drop of the reactor was measured for each face velocity.
The particle filtration and VOC removal investigations were performed at a face velocity of 5.3 cm/s using compressed air divided into wet, dry, and polluted streams. The air temperature was between 20 and 24 °C. The relative humidity ranged between 47 and 54%.
The setup built to evaluate the pressure drop and VOC removal of the electrospun nanofibre filters is presented in Figure 1. Toluene at a concentration between 1 and 1.5 ppm was used as a reference pollutant to evaluate the ability of the PVA/AC and PVA/TiO2 filters to adsorb and degrade VOCs. The toluene concentration was adjusted by flowing dry and clean air into a 250 mL gas-washing bottle with four 1.5 mL G-vials of toluene inside. A photo-acoustic multigas monitor (Model 1302, Bruel&Kjær, Nærum, Denmark) with a filter for the total VOCs (TVOCs) was employed to track the concentration before and after the filter through a flow splitter, as illustrated in Figure 1. It was also possible to record the water content through the photo-acoustic monitor, which is relevant for cross-compensation purposes and to understand the photocatalytic oxidation reactions. Photocatalytic oxidation was initiated using a high-pressure Xenon lamp (ILC technology R100-IB) through a bandpass filter with a peak wavelength of 335 nm.
For the particle filtration experiments, the setup in Figure 2 was used. A constant output atomiser (Model 3076, TSI, Shoreview, MN, USA) was used for particle formation, employing sodium chloride in a Milli-Q water solution with a concentration of 0.12 mg/cm3. A scanning mobility particle sizer (SMPS, Model 3080C, TSI) examined the particle mass density and size distribution between 12 and 480 nm. The most penetrating particle size for air filters was between 0.1 and 0.3 µm; therefore, the air filters were only investigated against particles of this size range [15]. The total average particle mass density was 110.5 µg/m3.
The filtration efficiency η was calculated using the following equation:
η = ( C 1 C 2 ) / C 1 × 100 ,
where C 1 and C 2 are the toluene mole fraction (ppm) and particle mass density (µg/m3) before and after the filter, respectively.

3. Results and Discussion

3.1. Electrospinning

Polymer solutions were prepared with a PVA concentration from 6 w/v% to 12 w/v%, and each was electrospun to assess the electrospinning stability. Once the polymer concentration was selected (10 w/v%), the additives were added, and their concentrations were increased until the electrospinning of the polymer/additive solution showed a steady development. The electrospinning results were listed in Table 1, where the polymer/solvent ratio, additive concentration, TCD, applied voltage, and feed rate for each solution are given. Each filter was assigned a tag based on the chemical composition of the electrospun solution to simplify the referencing of the filters. Stable electrospinning depends on the concurrence of factors, such as the polymer concentration and the solvent used, which defined the viscosity and surface tension of the polymer solution and the involved electrospinning parameters (TCD, feed rate, and voltage). The values in Table 1 present stable and constant electrospinning which allowed the formation of the nanofibre filters. The last filter contained a lower polymer concentration than that of the other four samples because the polymer solution viscosity was increased by adding TiO2. Therefore, 8 w/v% of PVA was sufficient to reach a constant electrospinning condition. Ethanol was used as a solvent with water when the additives were included in the polymer solution. For the AC, ethanol was necessary to decrease the dielectric constant of the solution and avoid the phase separation because AC is very hydrophobic. In addition, ethanol was employed to decrease the surface tension of the polymer solutions and favour the formation of nanofibres.

3.2. Nanofibre Characterisation

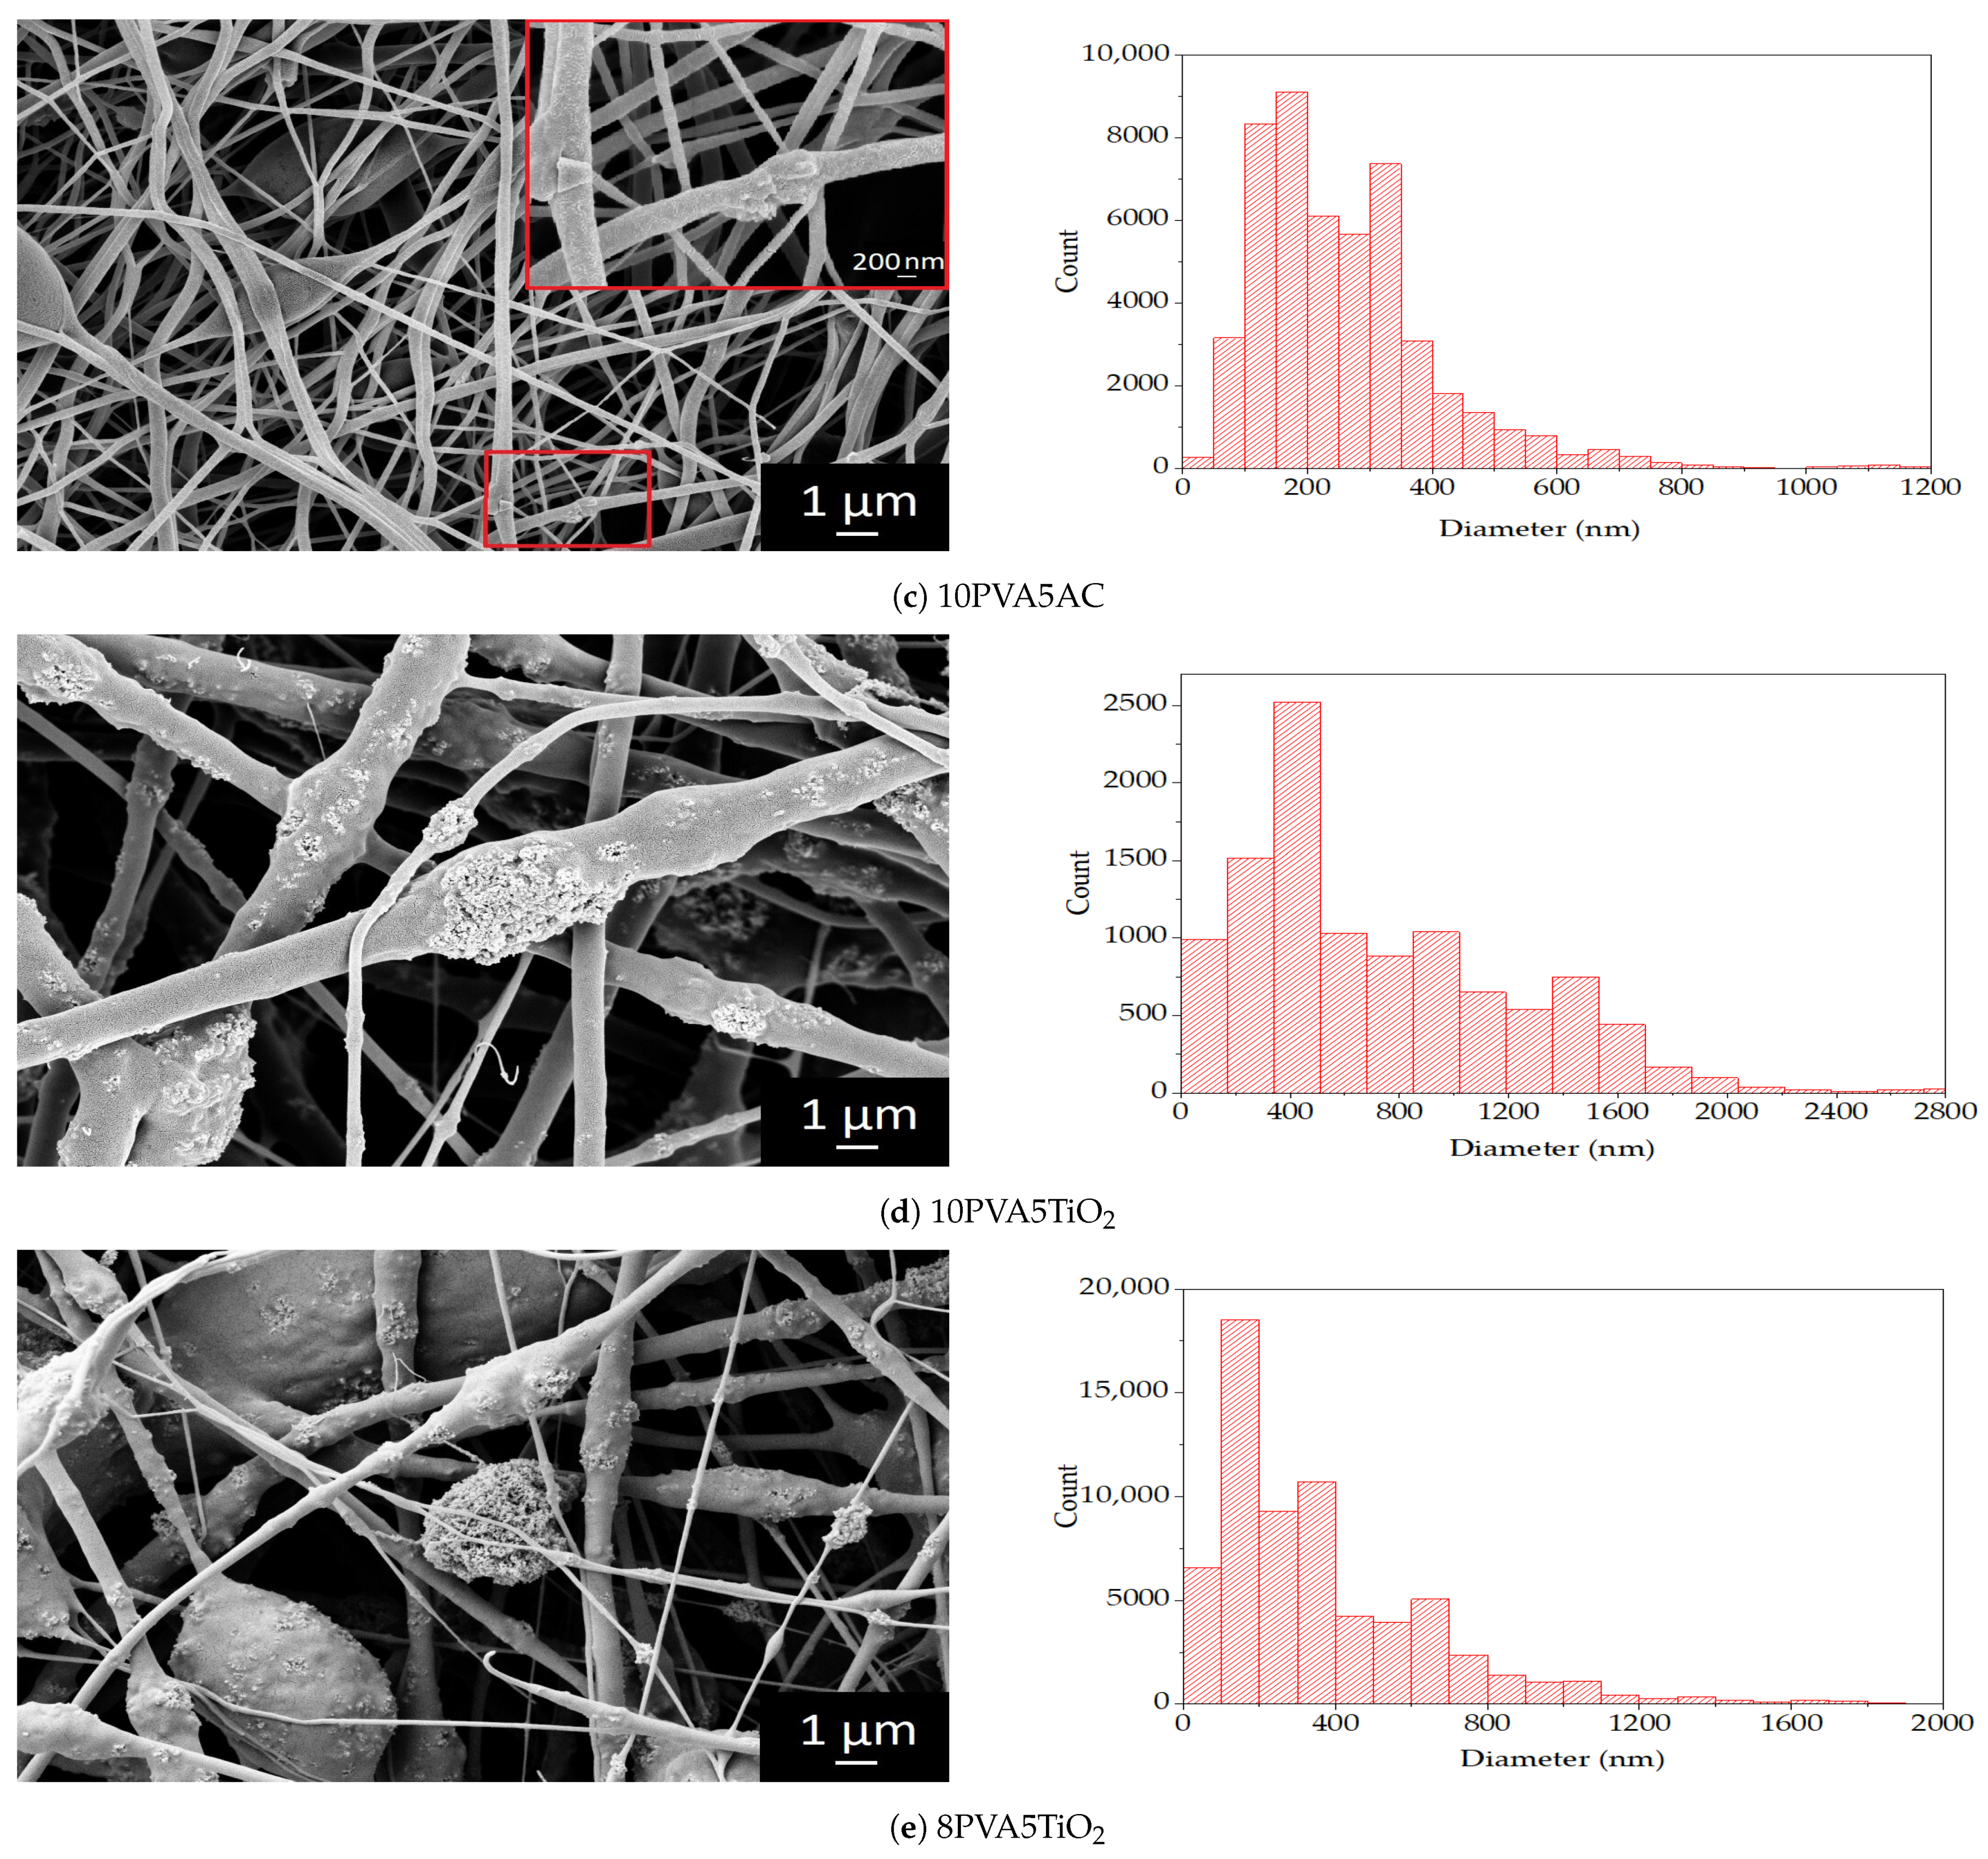
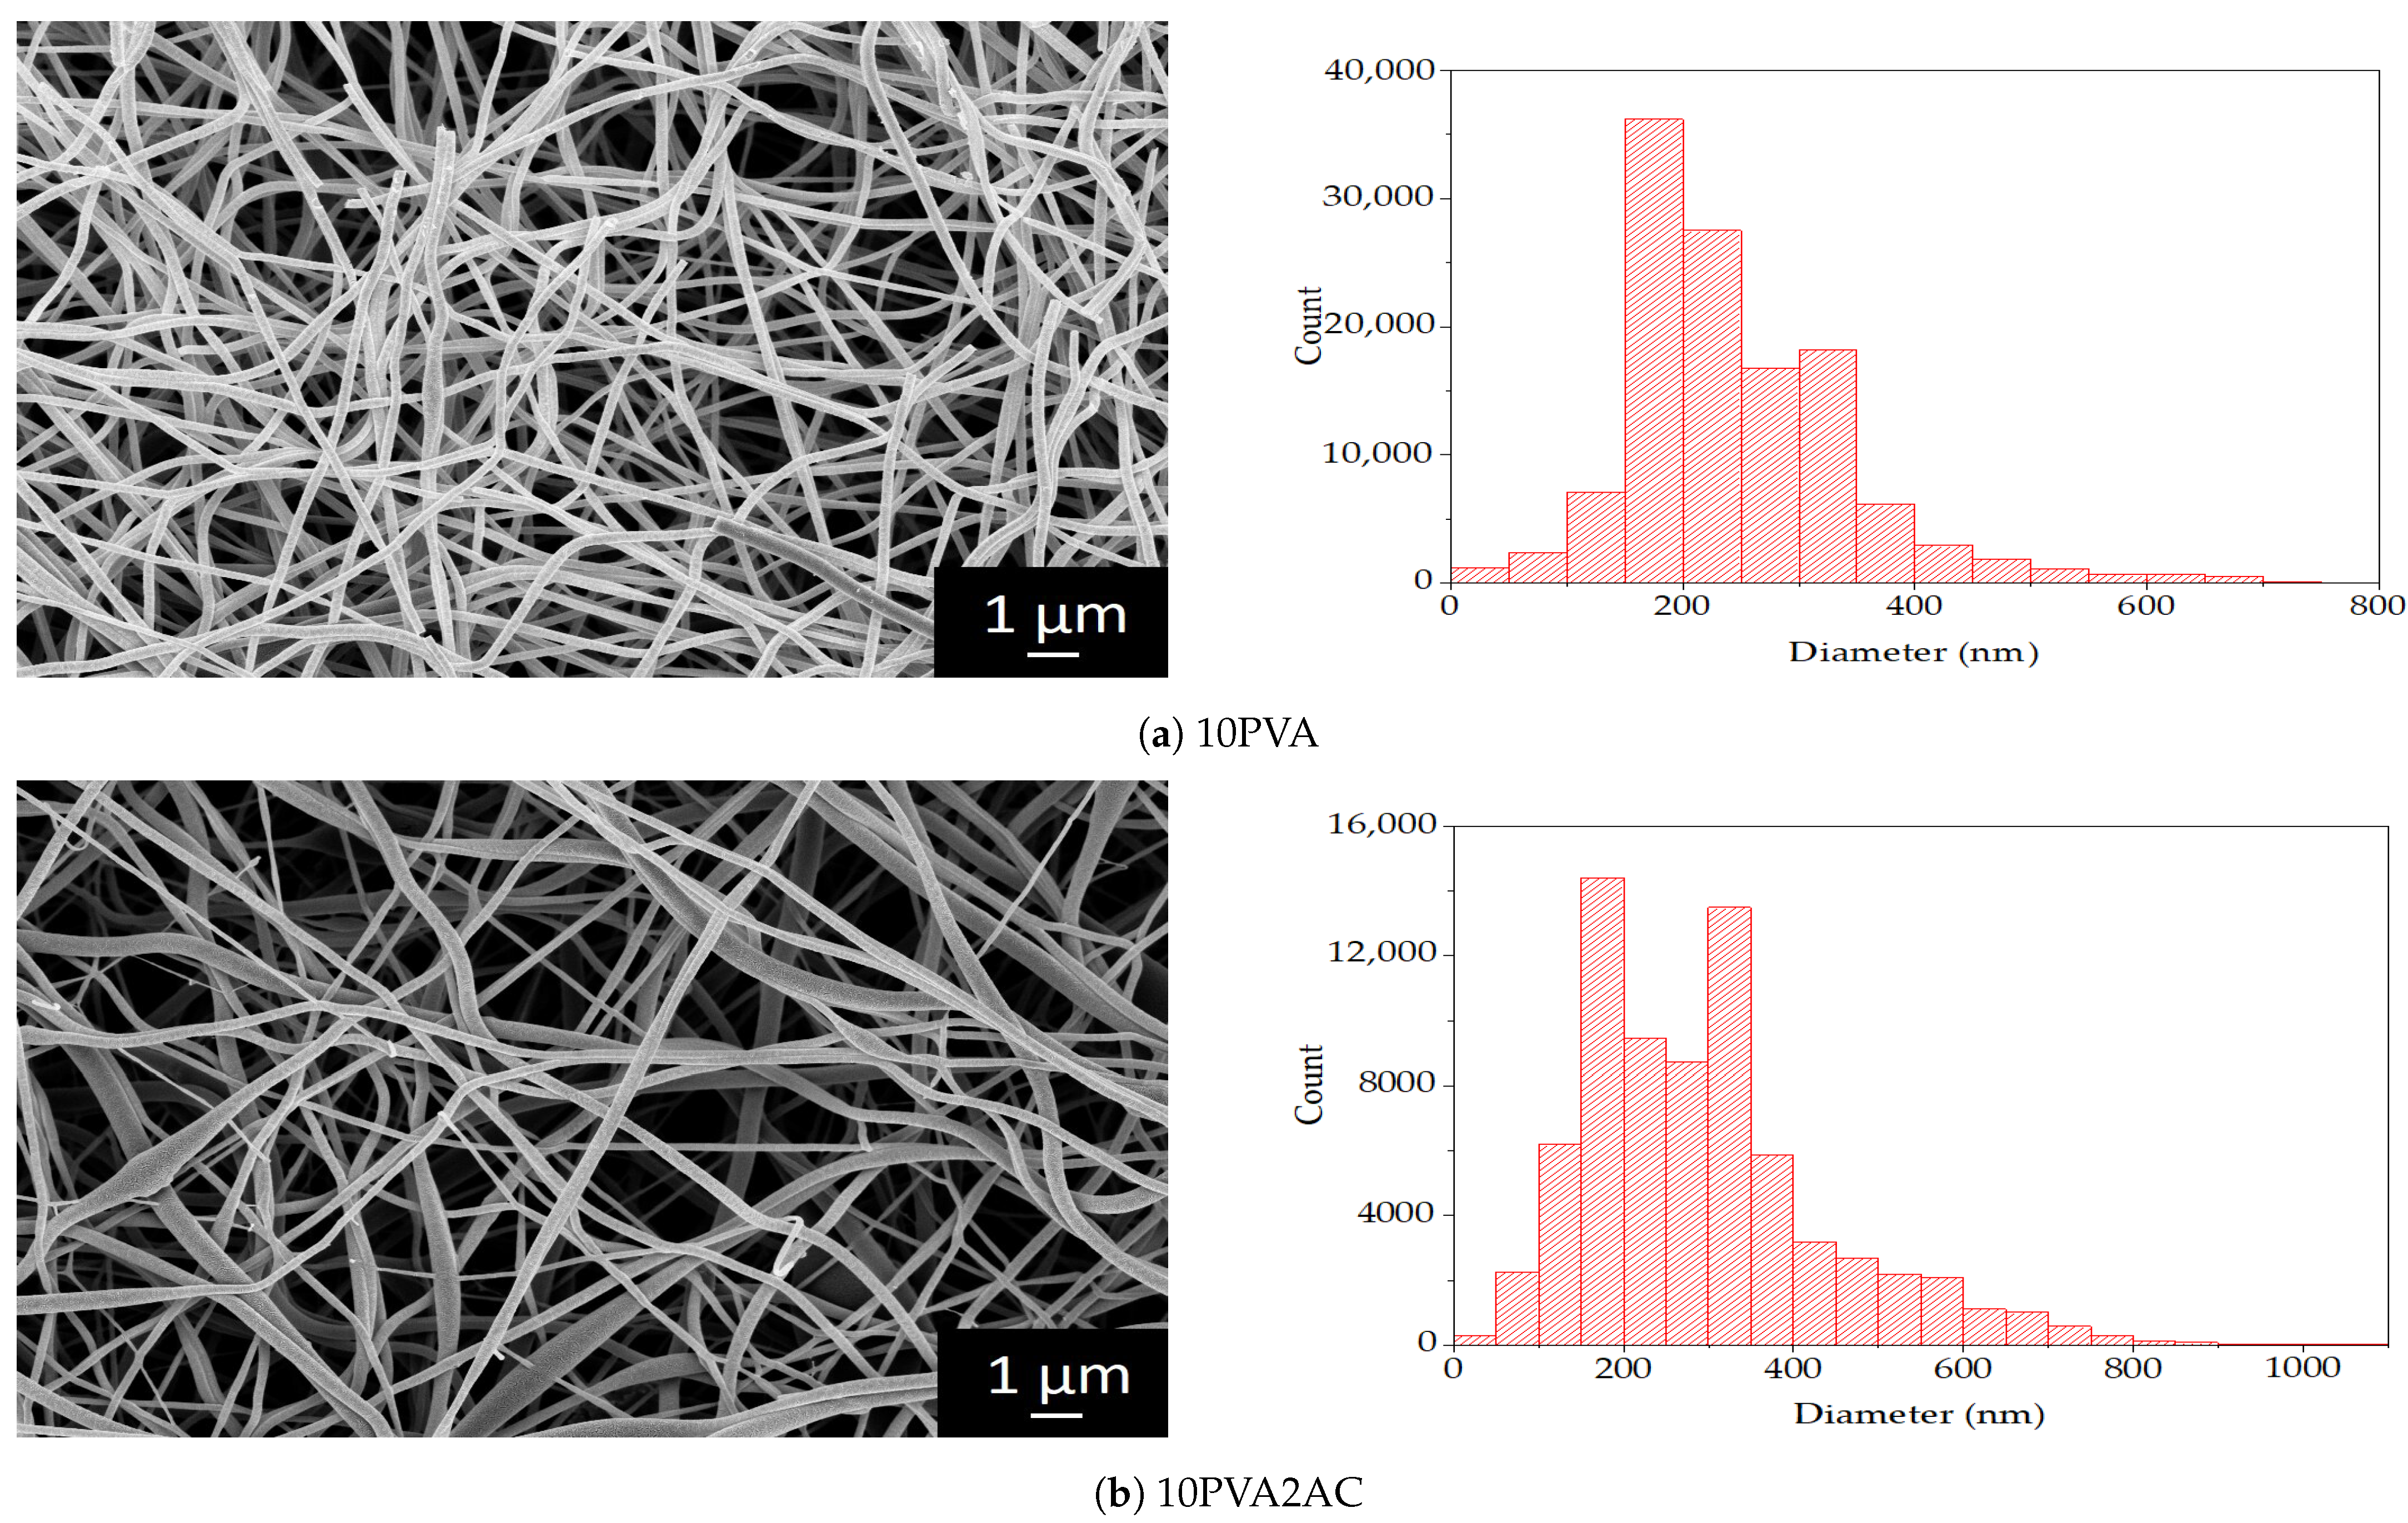
3.2.1. Scanning Electron Microscopy, Fibre Diameter and BET Analysis

The nanofibre morphologies of the PVA filter and the doped filter with PVA/AC and PVA/TiO2 are presented in Figure 3, revealing the randomly oriented structures of the nanofibres. The pure PVA nanofibres presented a uniform morphology, and although they are rather brittle, as observed by the number of broken fibres in Figure 3a. The use of additives has an important effect on the nanofibre structures. The PVA/AC nanofibres in Figure 3b,c present less uniformity, characterised by the presence of the bead structures. A clear protuberance is visible in Figure 3c, which is formed from an agglomerate of AC nanoparticles. Compared with the smooth pure PVA nanofibres, the PVA/TiO2 morphology is characterised by a nonuniform and bulky structure, formed by an agglomeration of TiO2 nanoparticles, as illustrated in Figure 3d,e.
The analysis results of the fibre diameters in terms of average size are presented in Table 2, whereas the fibre diameter distribution graphs were displayed in Figure 3. The smallest diameter of the pure PVA nanofibre filter was 213 nm, with a distribution reaching 800 nm. Moreover, the 10PVA5TiO2 filter has the widest fibres with an average diameter of 430 nm, with fibres that reached 2.8 °m.
The filters present considerably different average diameters due to the different electrospinning conditions employed to fabricate them. The 10PVA filter was electrospun at a voltage higher than 20.3 kV and at a 0.23 mL/h feed rate, compared with 13.5 kV and 0.12 mL/h for the two PVA/AC filters. Decreasing the voltage and feed rate, the 10PVA2AC and 10PVA5AC filters showed an increase in the average diameter of 33% and 24%, respectively. This result indicates that the voltage and feed rate affected the fibre diameter, as mentioned in the literature [29,30]. There is a more significant increase in the diameter for the two PVA/TiO2 filters. The average diameter of the fibres in the 10PVA5TiO2 filter is twice that of the pure PVA nanofibres (430 nm).
This result is primarily related to using TiO2 in the PVA solution, contributing to forming large nanoparticle agglomerates and wider fibres. The use of TiO2 plays an essential role in the average fibre diameter size [20]. When reducing the PVA amount to 8 w/v% (8PVA5TiO2), the average fibre diameter was 301 nm. This filter was fabricated using a 1 mL/h feed rate and an applied voltage of 11.1 kV, which are considerably different electrospinning conditions than the other filters, which, combined with a lower polymer concentration, contributed to the formation of thinner nanofibres compared with 10PVA5TiO2.
The basis weight of the filters is also reported in Table 2. The 10PVA5TiO2 filter has the highest basis weight at 67.6 g/m2, whereas the 10PVA2AC filter has the lowest at 16.6 g/m2. The PVA/TiO2 filters have the high specific weight due to the use of TiO2. In contrast, the higher specific weight of 10PVA compared with the PVA/AC filters indicates a higher number of deposited nanofibres.
The BET results for SSA, pore size, and total pore volume are reported in Table 2. The filters with AC exhibit a higher SSA compared to 10PVA, which is an expected result as AC is a highly adsorbent material with a surface area of 950 to 2000 m2/g [31]. As visible in Figure 3, PVA/TiO2 filters present nonuniform morphology, densely characterized by TiO2 nanoparticle agglomerates. These bulky structures do not contribute to the SSA, resulting in a lower BET surface area even when compared to 10PVA. A similar result has been reported in [32], where Wang et al. showed that as the TiO2 ratio and consequent agglomeration increases, the BET surface area of PVA/TiO2 decreases. Thus, 10PVA presents the smallest average pore diameter. Concomitant with the increased average fibre diameters, the use of additives also contributed to a larger average pore size, as can be seen in Table 2. Moreover, 10PVA5AC and 10PVA5TiO2 showed a slight increase in average pore size compared to 10PVA2AC and 8PVA5TiO2. This result could be related to the nonuniform morphology of the nanofibres.

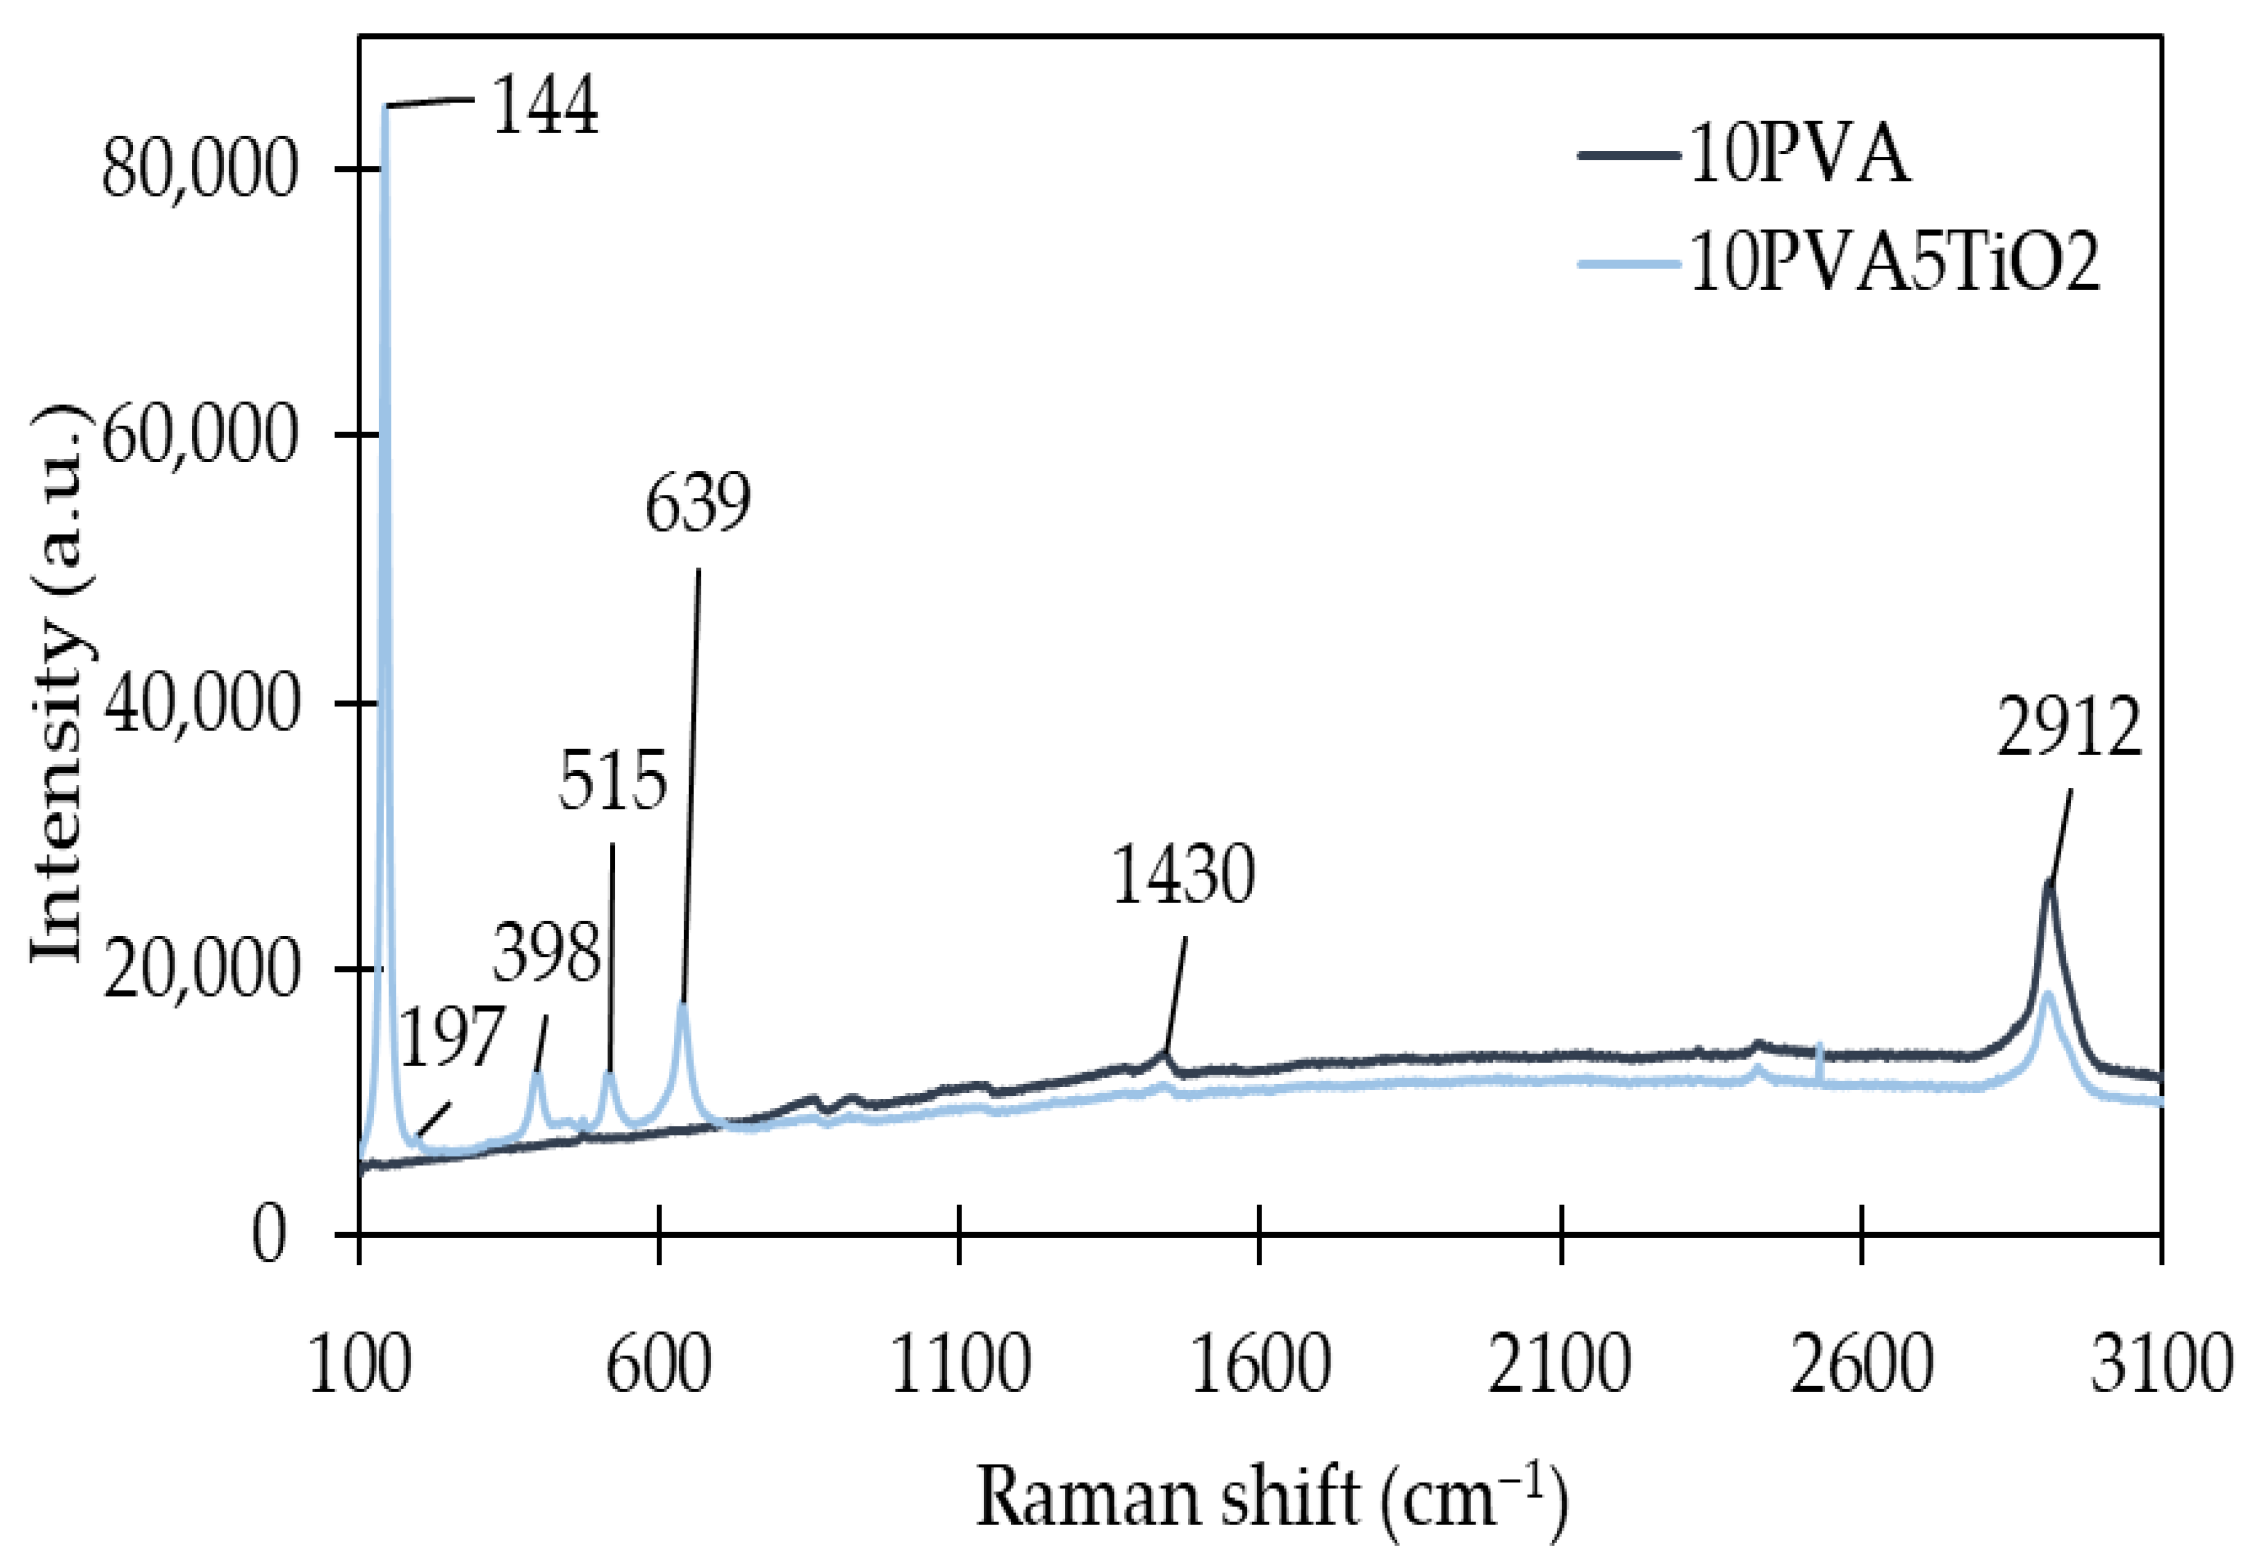
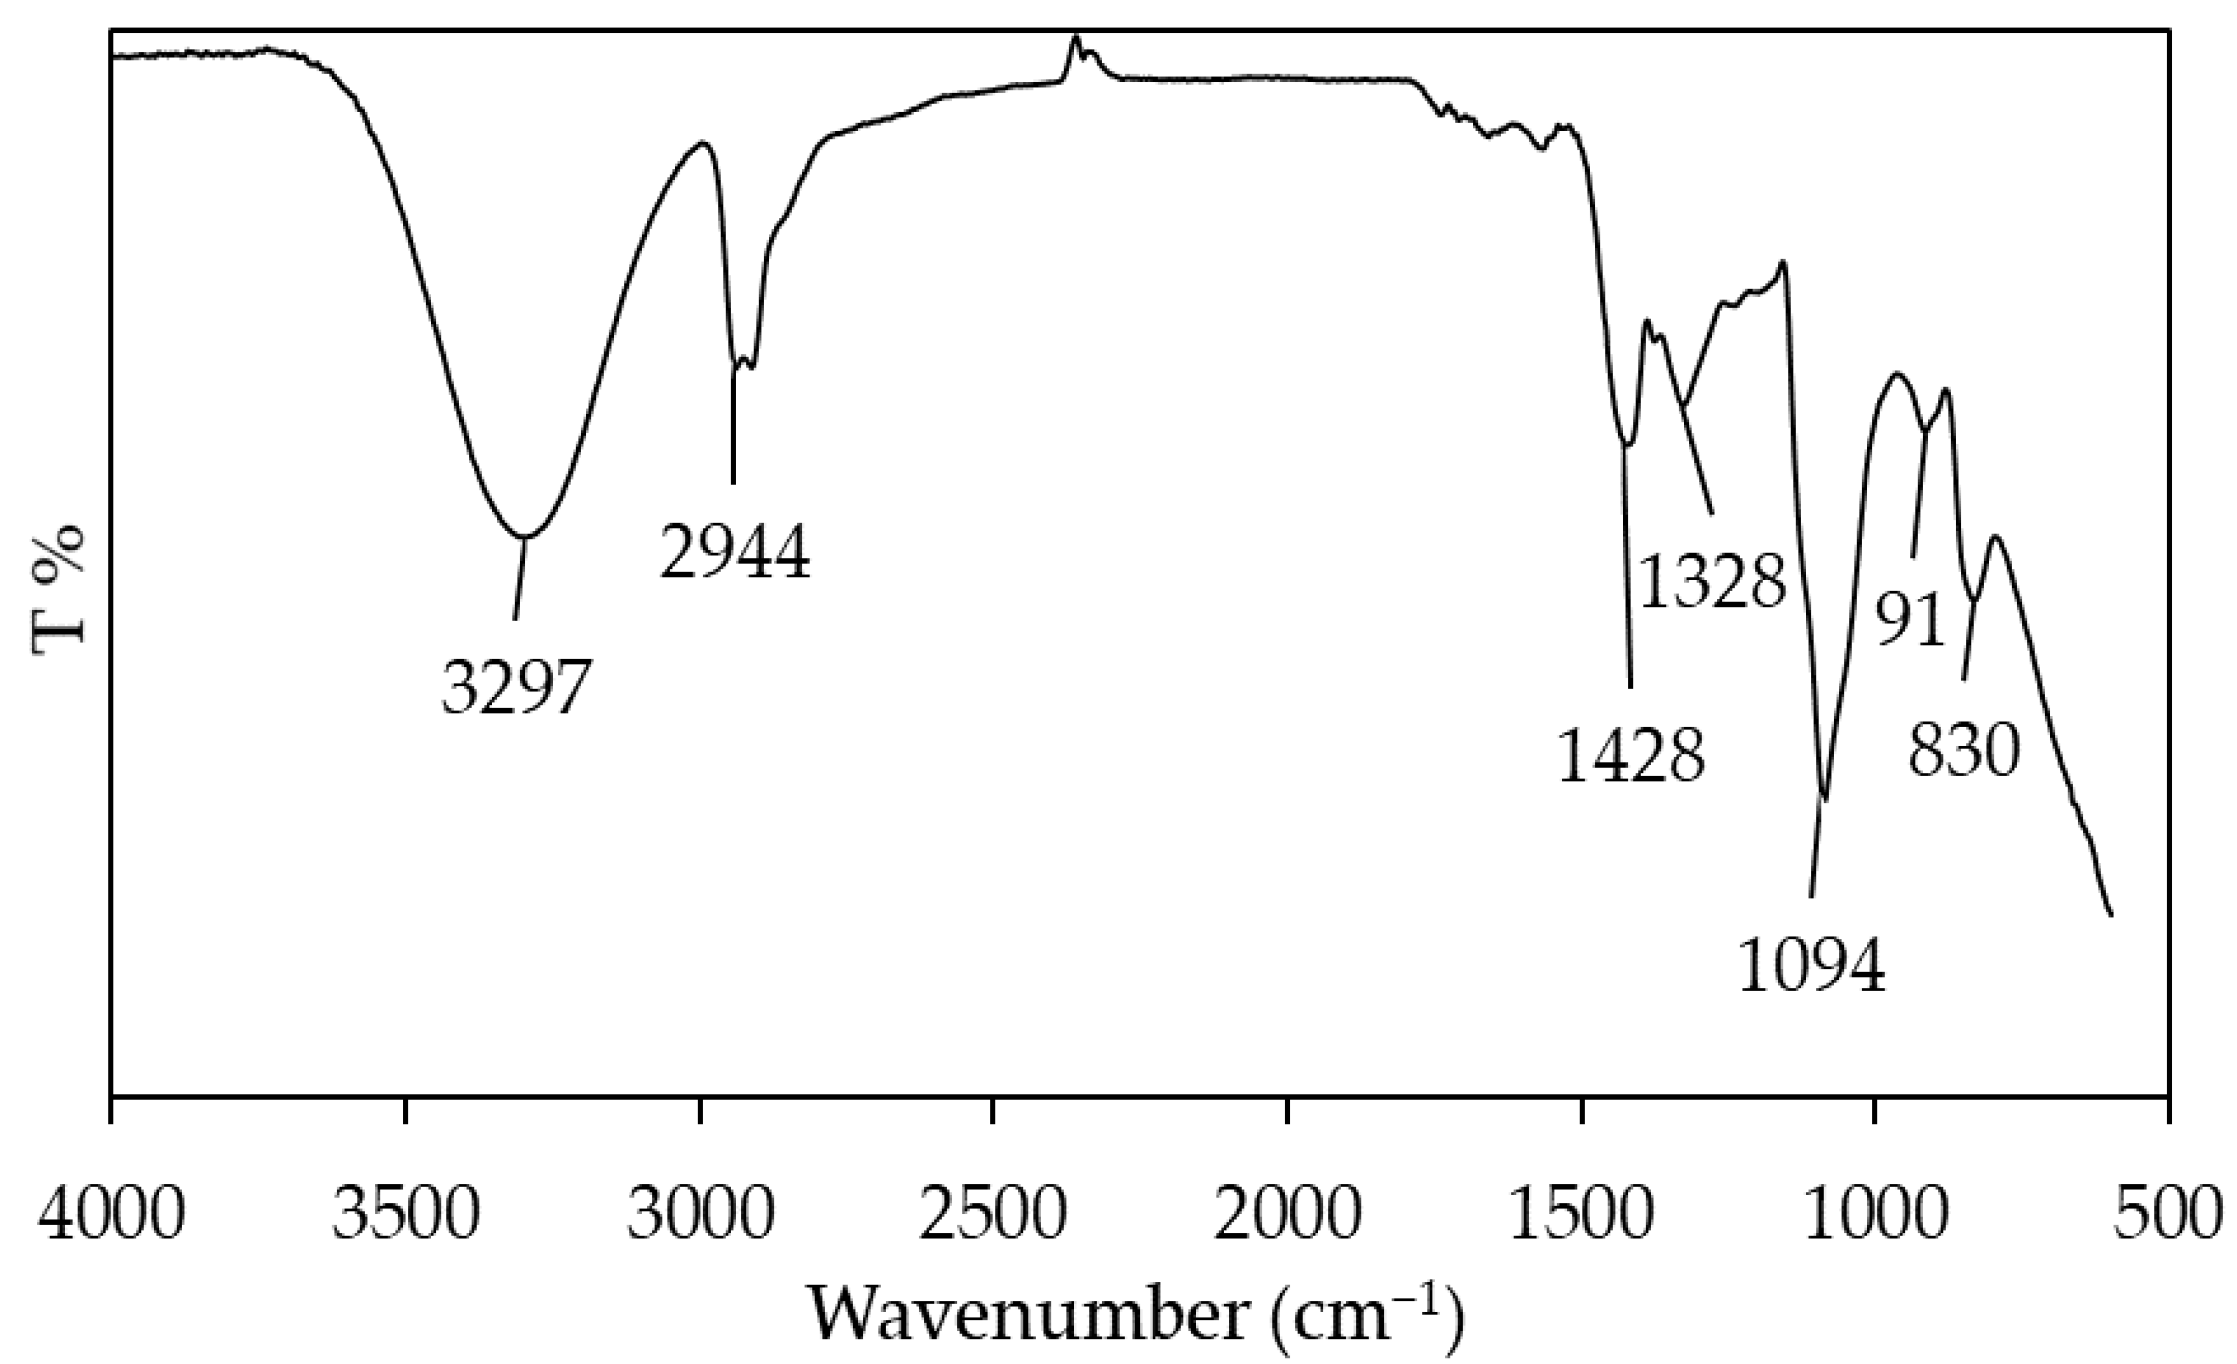
3.2.2. FTIR and Raman Spectroscopy Analysis

The characterisation by the FTIR spectroscopy of the 10PVA filter sample is presented in Figure 4. As mentioned before, the FTIR spectroscopy was performed to investigate the polymer structure. The characteristic bands of PVA are visible in the spectrum. The broadband marked with the first peak at 3297 cm−1 is linked to the stretching of the hydroxyl group O–H for intra- and intermolecular hydrogen bonding. The peak at 2919 cm−1 represents the stretching C–H from the alkyl group. The peak at 1428 cm−1 refers to the C–H bending vibration of the CH2 group. The last four peaks, 1328, 1094, 916, and 830 cm−1 are, respectively, linked to C–H deformation vibrations, C–O stretching of acetyl groups, CH2 rocking, and the vibration of C–C stretching [33,34,35,36]. Peaks between 1750 and 1735 cm−1 have been reported to be due to the stretching of C=O and C–O from the acetate group. These peaks are of very low intensity when the polymer presents a very high degree of hydrolysis, indicating that the polymer chain was characterised by only a few acetate groups [34,37]. The PVA used to create the fibres was 99+% hydrolysed; thus, the peak is not visible in the FTIR spectrum of the analysed sample.
Raman spectroscopy was performed to investigate the structural characteristics of PVA and the structural changes in the PVA/TiO2 nanofibres further. Therefore, the Raman spectra of the 10PVA and 10PVA5TiO2 filters are presented in Figure 5. The two most noticeable peak bands visible on the PVA spectra were at 1430 cm−1 and 2912 cm−1. The first peak is assigned to the stretching vibration of –CH in the PVA molecules, whereas the most intense band at 2912 cm−1 is attributed to the stretching vibration of –CH2 [38,39]. In the PVA/TiO2 spectra, both characteristic peaks were visible but with a lower intensity.
The dominant modes of the PVA/TiO2 Raman spectra are the six typical Raman active modes of the anatase crystal: 144 (Eg,1), 197 (Eg,2), 395 (B1g,1), 515 (A1g, B1g,2), and 639 (Eg,3) cm−1 [40,41]. This result is consistent with the crystal characterisation of the aeroxide P25 sample, which predominantly consists of anatase TiO2.

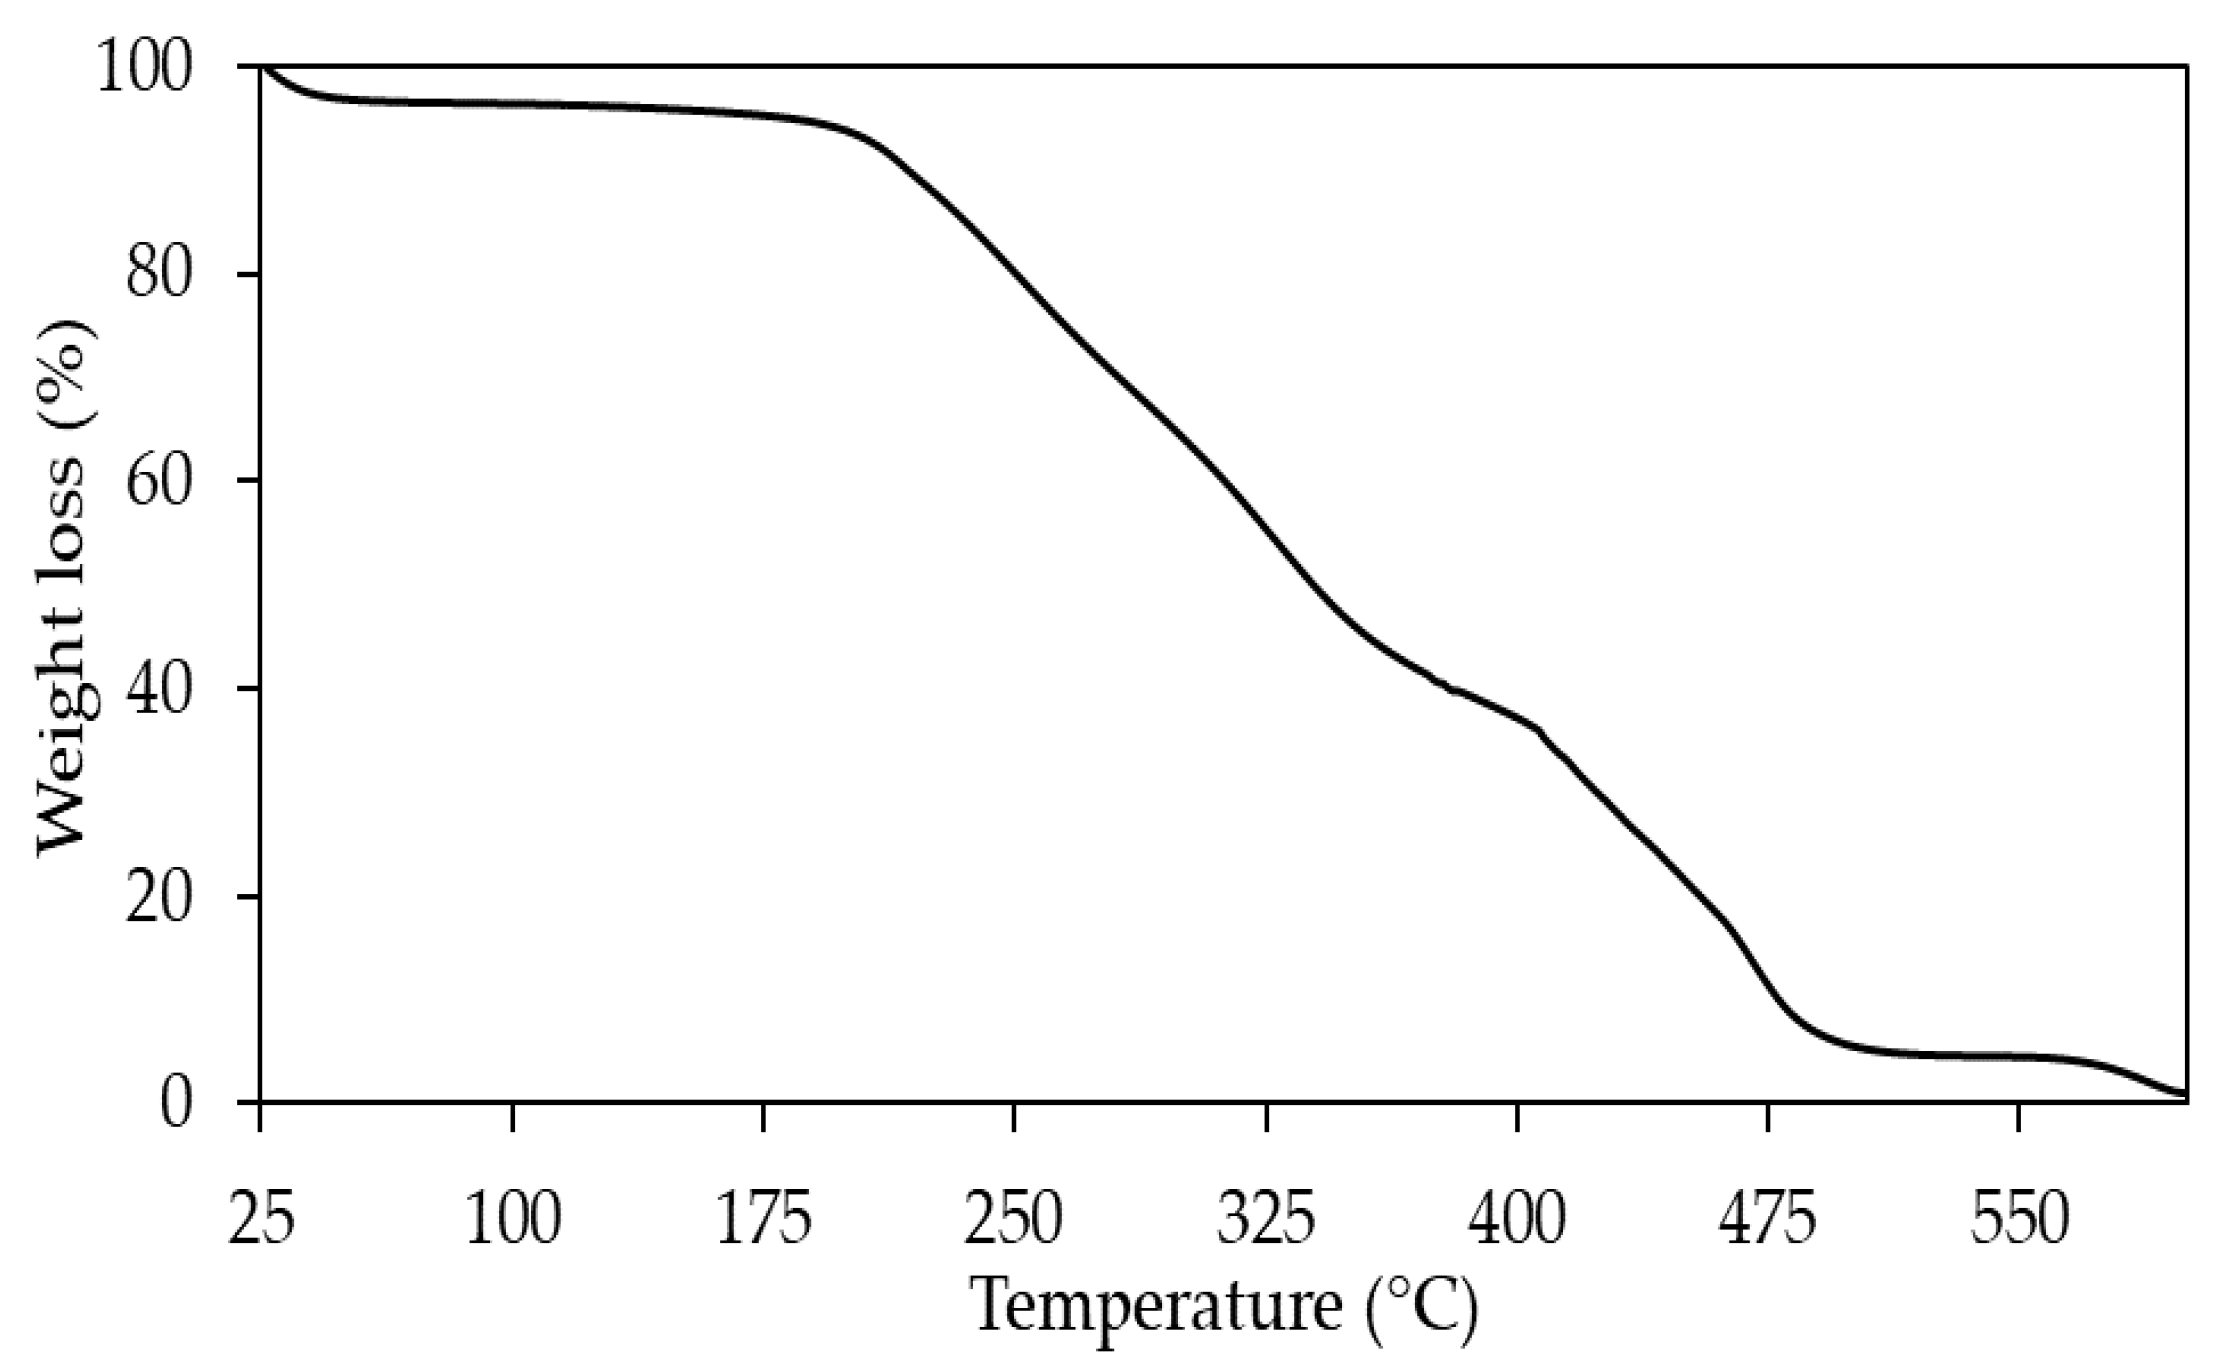
3.2.3. Thermogravimetric Analysis

The TGA curve of the 10PVA nanofibre sample is presented in Figure 6. The TGA reveals that the sample presented three weight-loss phases. At temperatures below 120 °C, a 4% weight loss by mass was detected, which can be ascribed to the weight loss of the adsorbed moisture. The second and most significant stage of weight loss was between 170 °C and 400 °C, where the 60% weight loss was due to the decomposition of the side chain of PVA. A further smaller weight loss of 31.5% was observed in the third stage, between 400 °C and 540 °C, during which the main chain of PVA was decomposed [42,43]. The significant weight loss of 91.5% observed in the range between 170 °C and 540 °C corresponds to the structural decomposition of the PVA. This result suggests that no solvent remains in the fibre.

3.3. Filtration Performance

The electrospun nanofibre membranes were cut into filters with 52 mm diameter, as presented in Figure 7, to investigate the filtration performance for the pressure drop, toluene removal, and particle filtration.

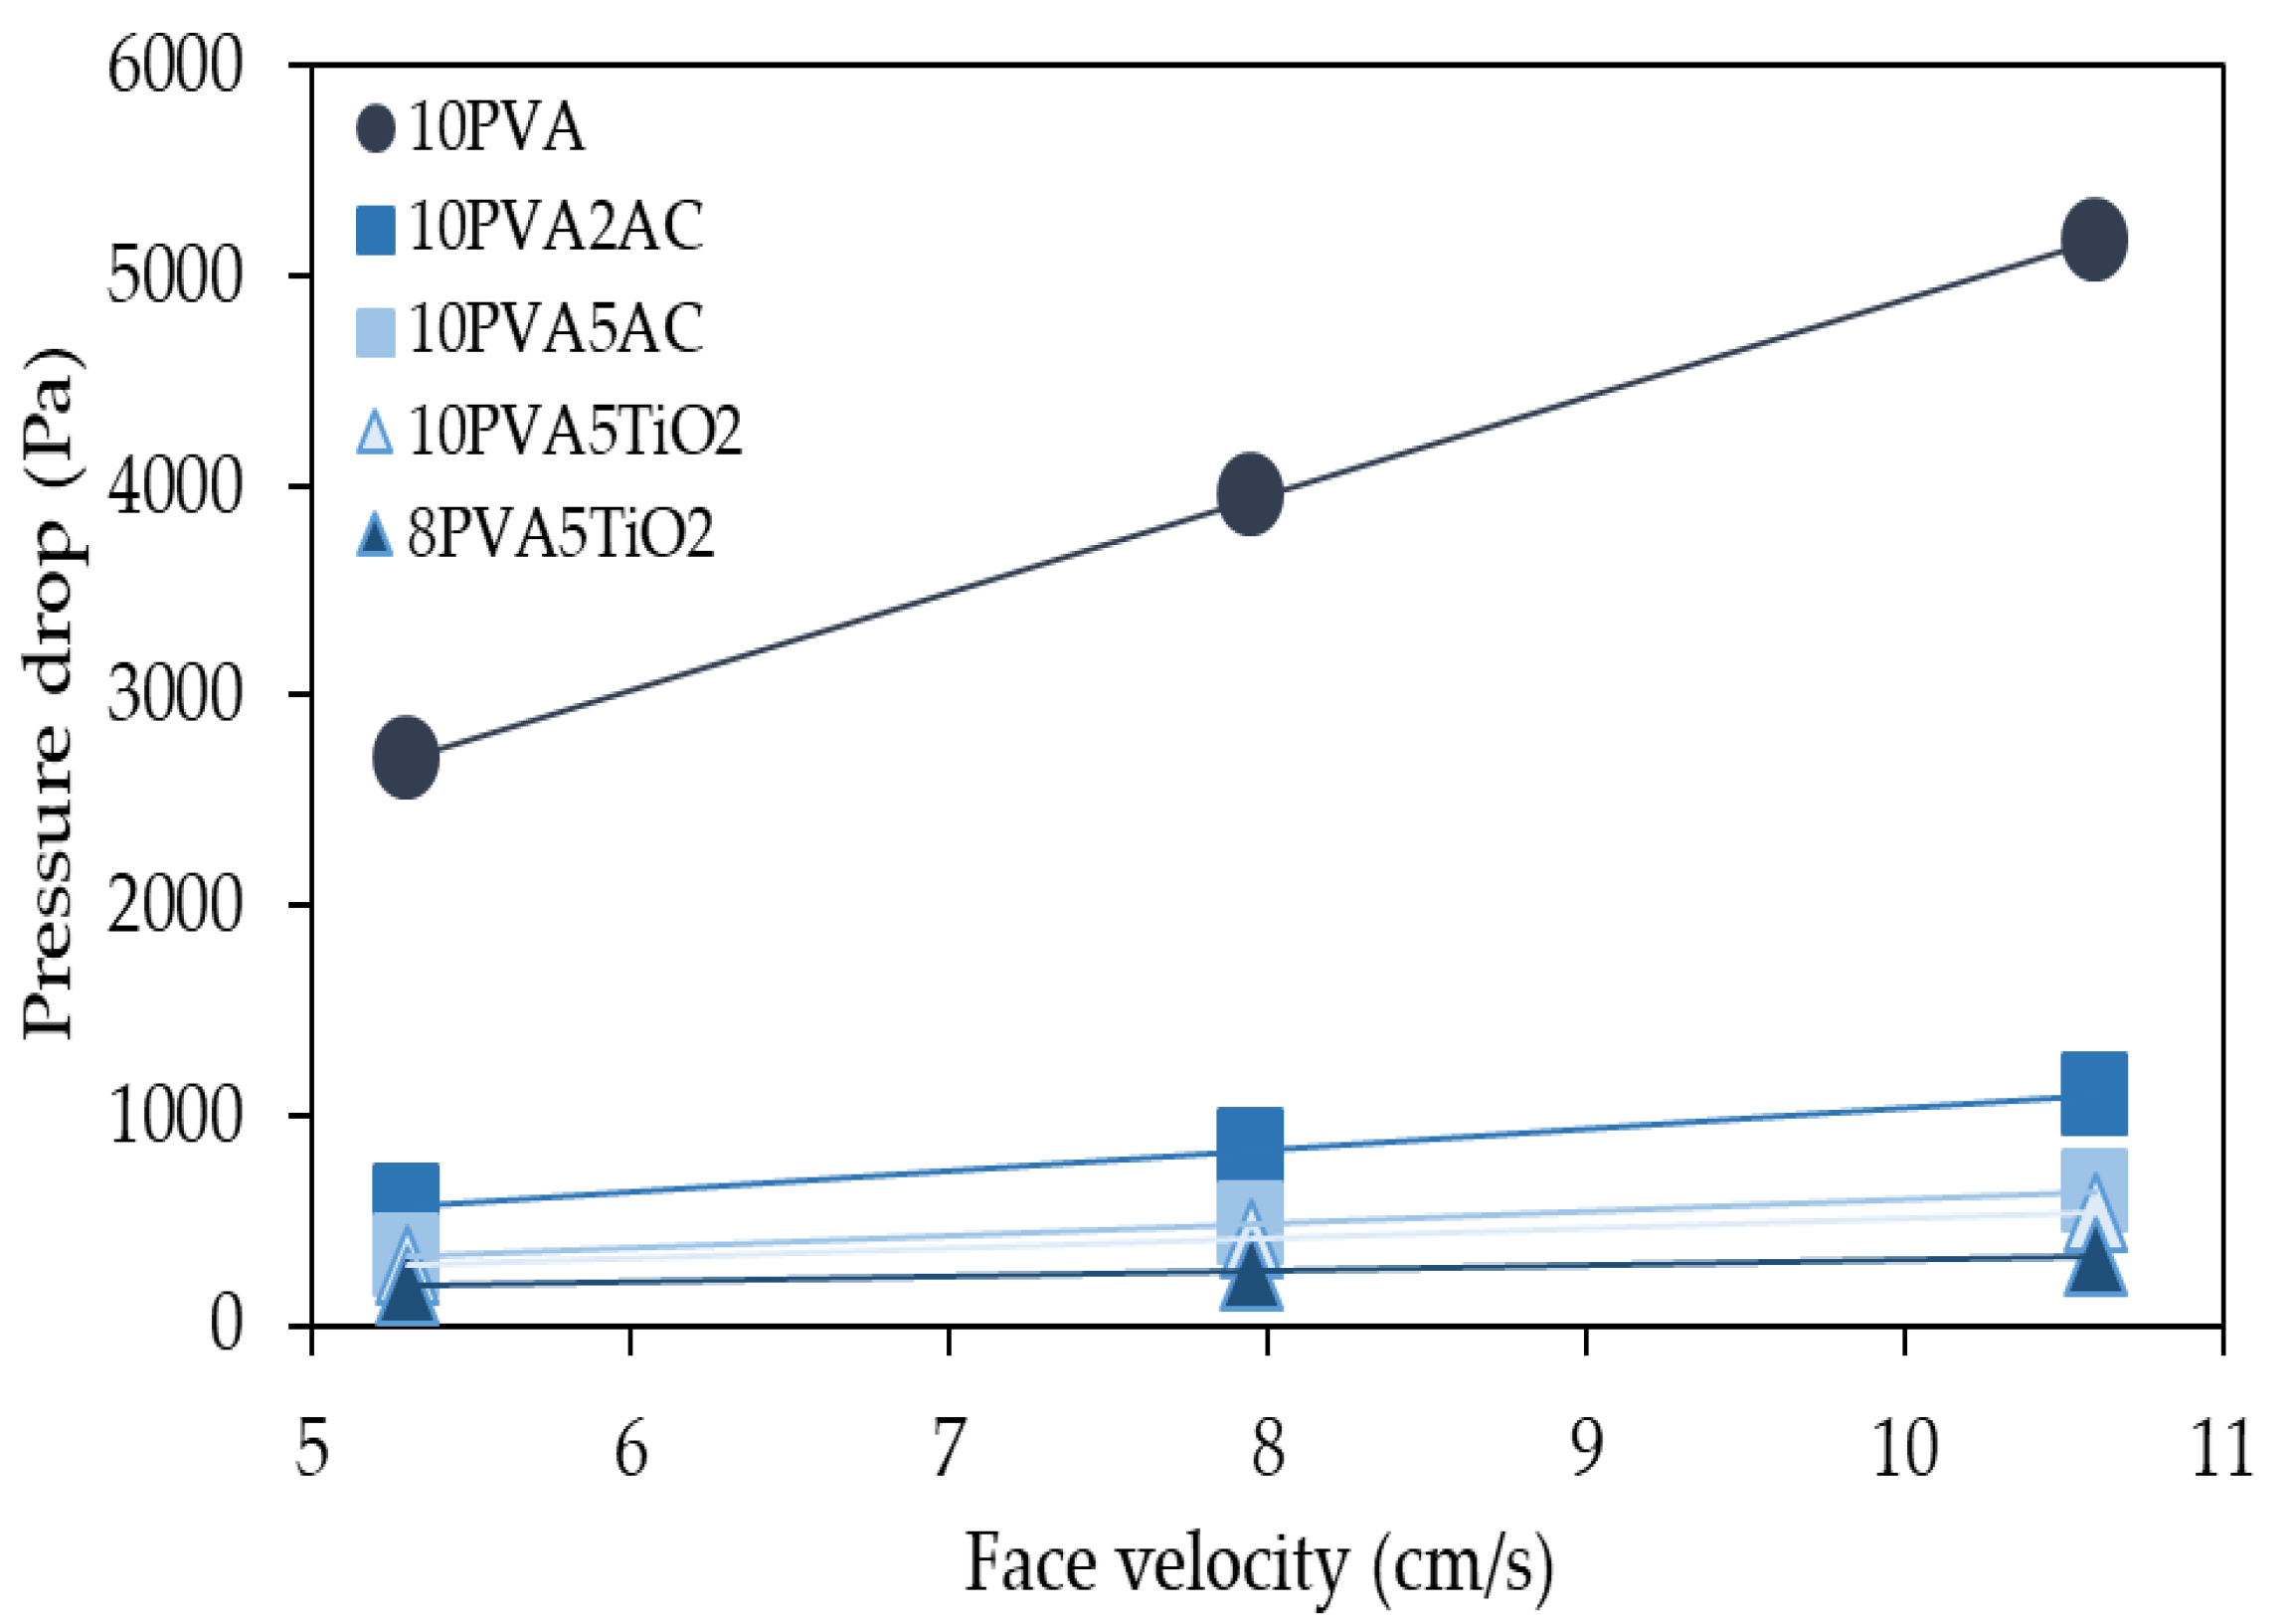
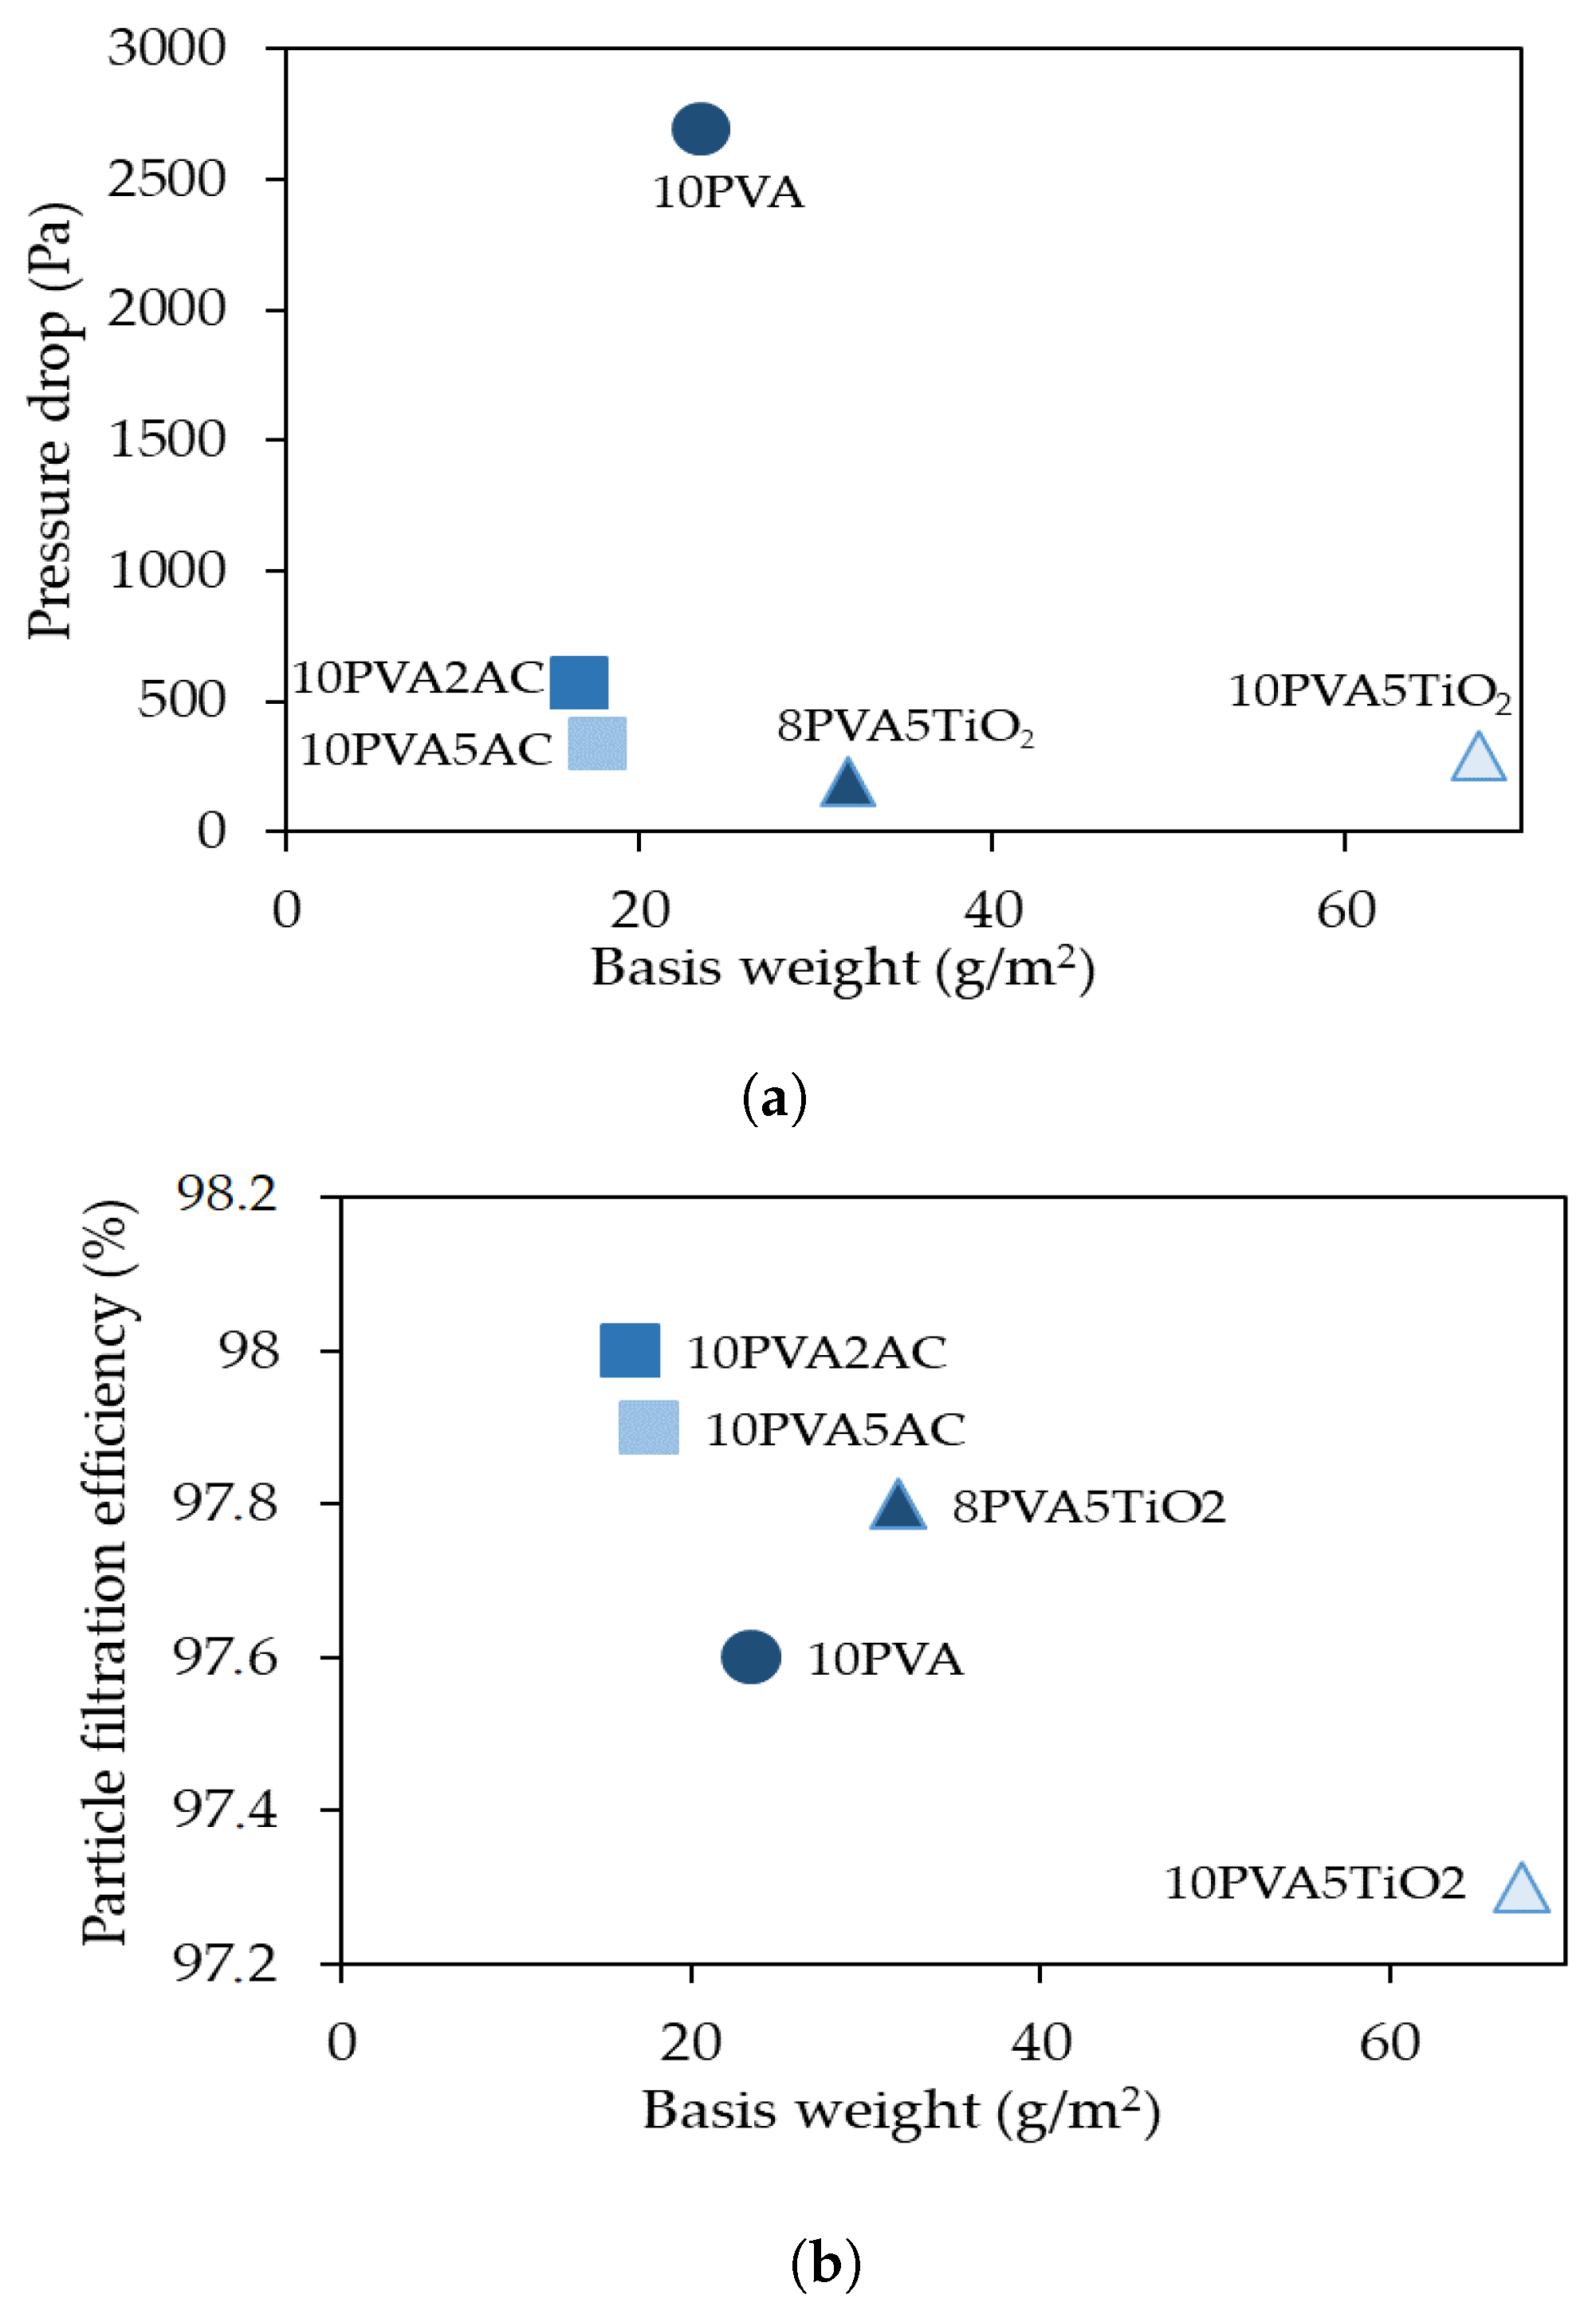
3.3.1. Pressure Drop

The relationship between the face velocity and pressure drop was investigated using linear regression. Figure 8 presents the results for the five filter samples. The linearity of the relationship was confirmed, with R2 above 0.9992. The highest pressure drop was registered with the pure PVA filter, reaching 2693 Pa at 5.3 cm/s face velocity. The pressure drop was smaller for PVA/AC filters. The 10PVA2AC filter recorded a pressure drop of 568 Pa, representing a decrease of 78.9% compared with the 10PVA filter. Similarly, the 10PVA5AC filter reached a pressure drop of 336 Pa, 87.5% lower than the pure PVA filter.
The decrease was even more significant for the PVA/TiO2 filters. The 10PVA5TiO2 filter had an air resistance that led to a pressure drop of 291 Pa. The best result came from the 8PVA5TiO2 filter, with a pressure drop of 195 Pa, which decreased 92.8% compared with the pure PVA filter. The use of additives influenced the morphology of the fibres and affected the pressure drop. The beaded morphology of the PVA/TiO2 filters was responsible for a lower pressure drop, as the beads lead to larger pores, as confirmed by the average pore sizes in Table 2. This result is linked to the fact that the permeability increases with pore diameter, resulting in a decreased pressure drop [44]. This result is interesting in contrast to other studies of polymer-based electrospun nanofibre filters with additives [45,46]. For example, Bortolassi et al. described how a PAN/TiO2 filter led to a larger pressure drop compared to a pure PAN filter [46]. The explanation is likely due to the role of other parameters like the filter thickness.
The pure PVA filter has the smallest average fibre diameter, corresponding to the highest observed pressure drop. The smallest nanofibres are probably more densely packed, leading to a smaller pore size and higher pressure drop. As mentioned, the slip flow phenomenon was dominant when the diameters of the nanofibres (df) were comparable to or smaller than the mean free path of the air molecules ( λ ), around 65 nm [13]. The transition flow regime is defined when the Knudsen number (Kn = 2 λ /df) ranges between 0.1 and 10 [14]. The dimension of the nanofibres of the fabricated filters ranges between 200 and 500 nm, indicating a Knudsen number of between 0.3 and 0.6. The decrease in the fibre diameter increased the pressure drop, although the Knudsen number indicates a transition flow regime, in which the gas slip effect was considered significant.
Although the PVA/AC filters have a similar morphology to the pure PVA with nanofibre diameters in the same range of 200 to 300 nm, these filters present a significantly lower pressure drop than the 10PVA filter. These results are possibly related to the average pore size and the filter basis weight. Figure 9a presents the pressure drop versus the basis weights of different filters. For the two PVA/AC filters, the lower basis weight compared with 10PVA indicates fewer deposited fibres. Fewer fibres over the same area indicate larger pores in the filter and a lower pressure drop.
A higher basis weight does not correspond to a higher pressure drop for the PVA/TiO2 compared with the 10PVA filter. Titanium dioxide plays a vital role in terms of the weight increase in the filter [46]. The pressure drop remained lower than that of the 10PVA filter due to the larger pores and lower fibre density. This conclusion is also supported by the high basis weight of the 10PVA5TiO2 filter (67.6 g/m2) and the relatively small pressure drop change compared to the 8PVA5TiO2 filter (basis weight 31.8 g/m2).

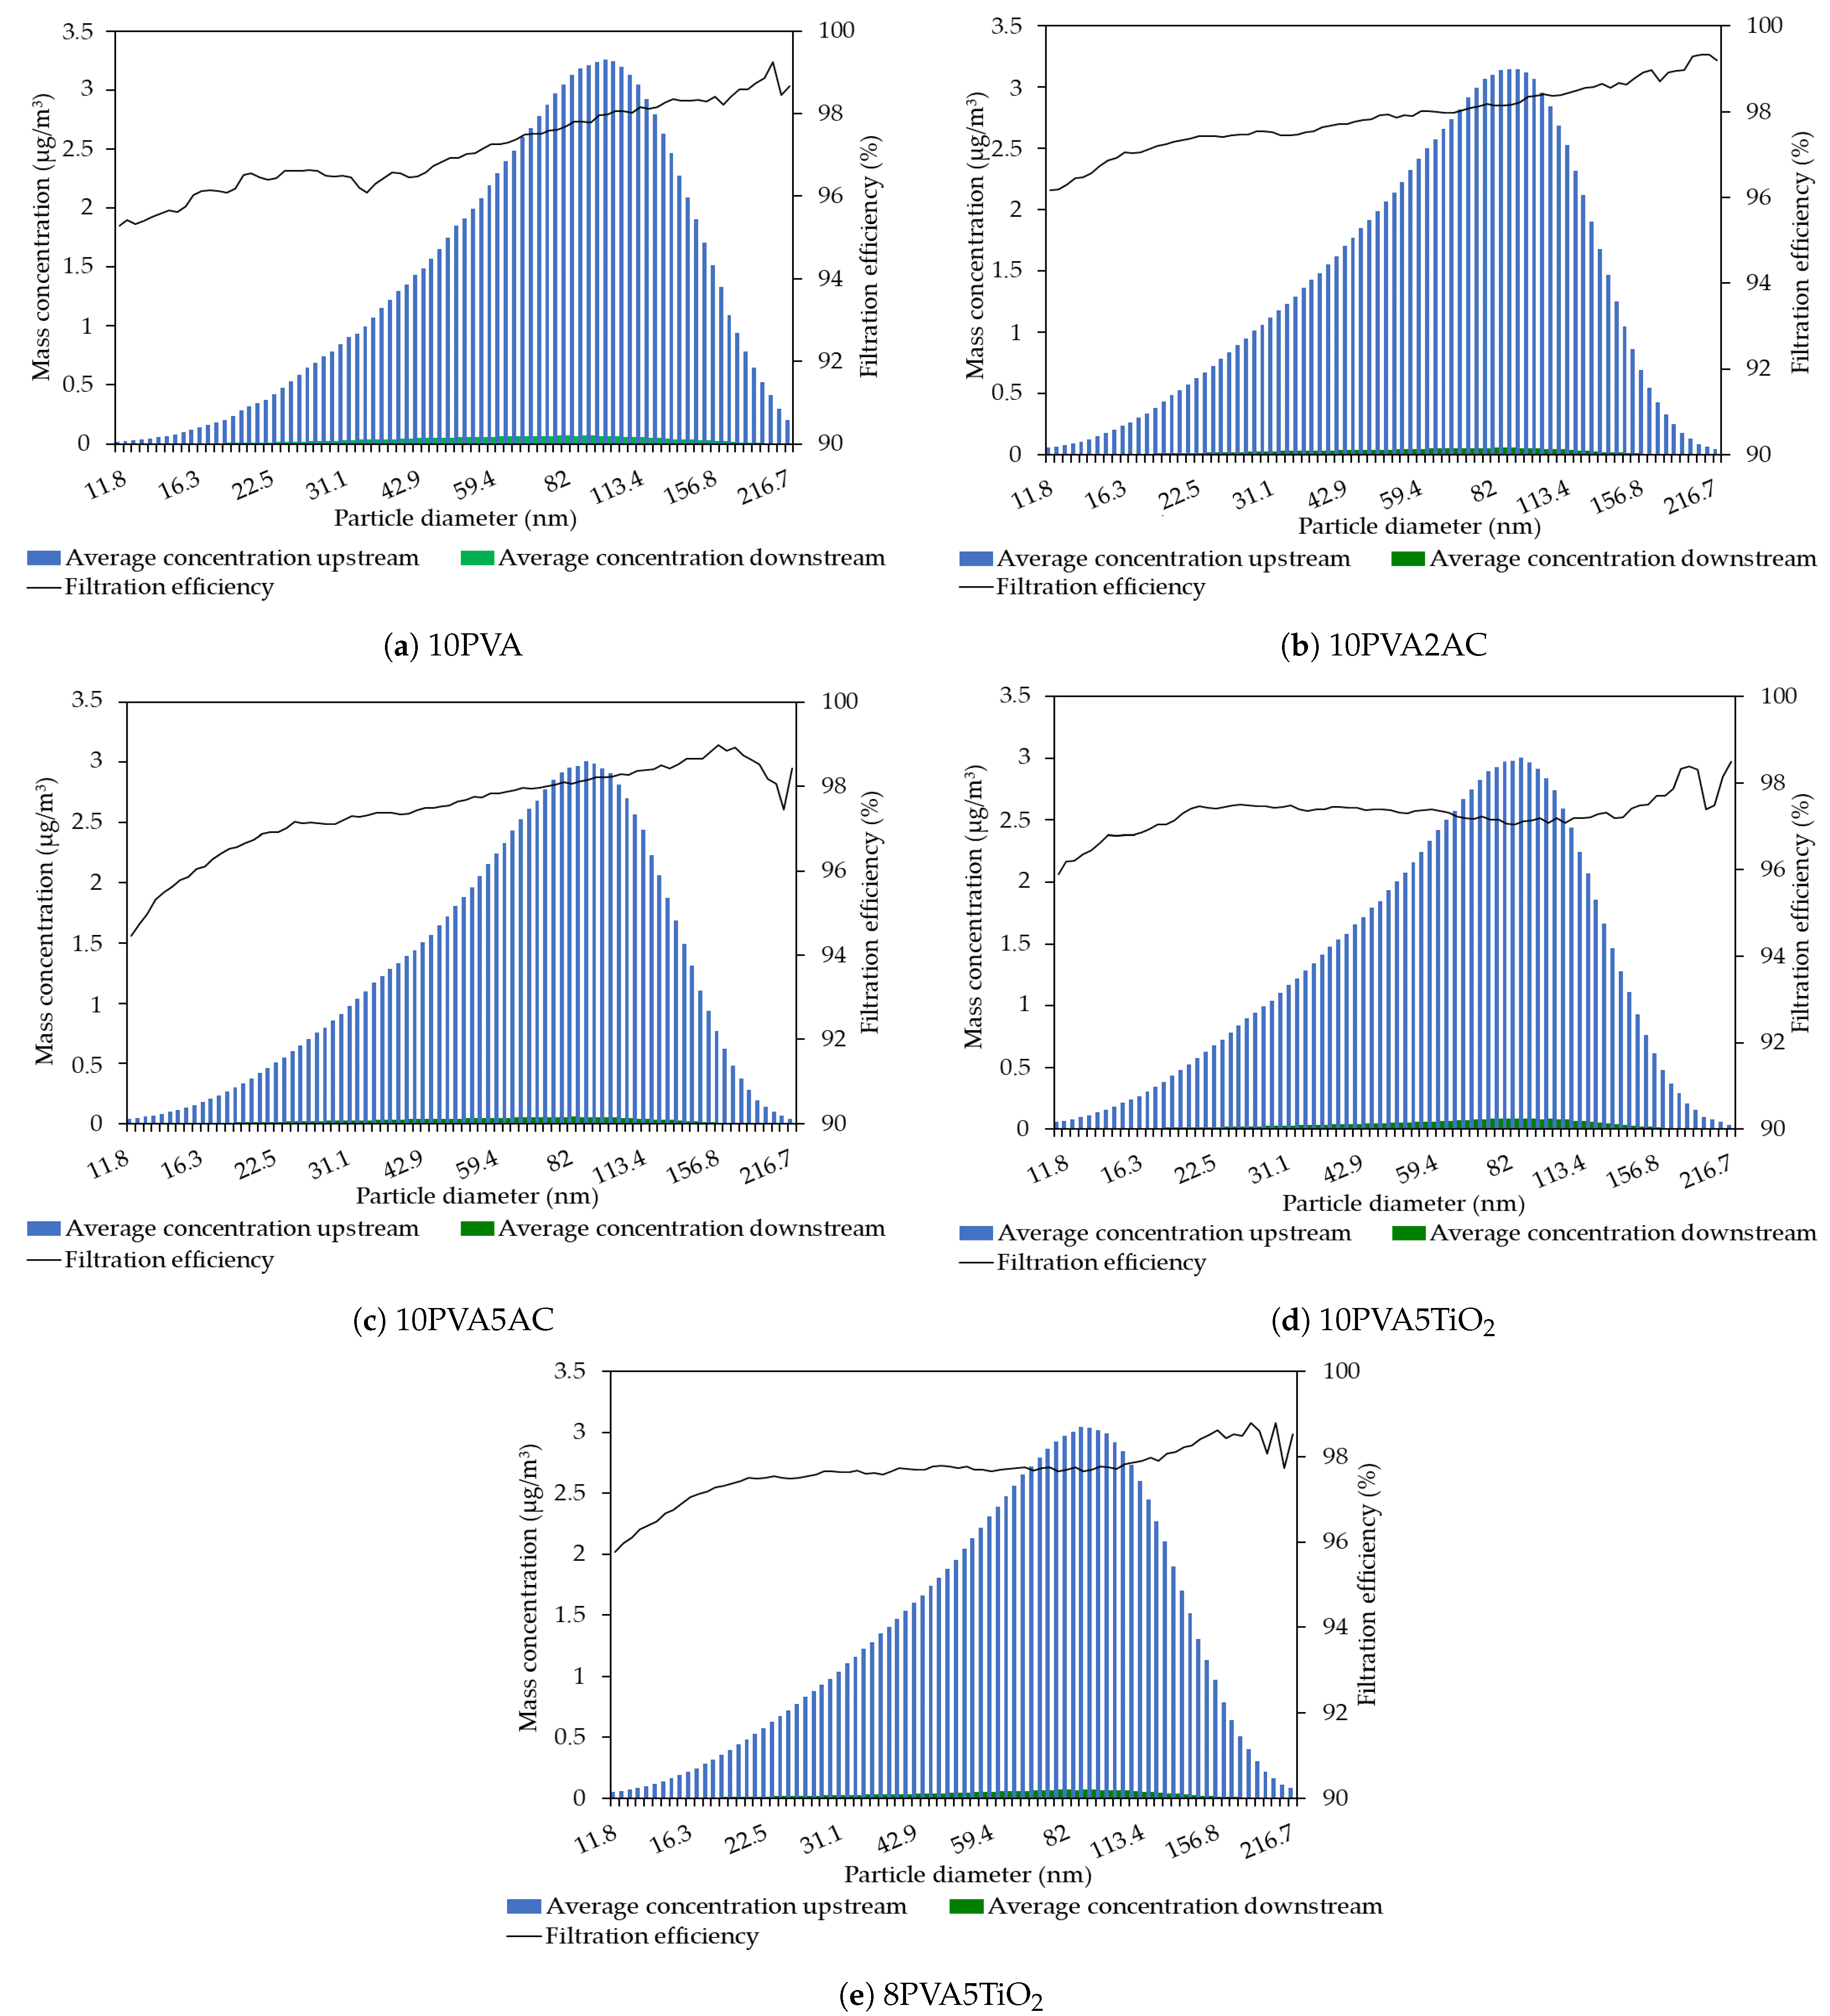
3.3.2. Particle Filtration Efficiency

The results of the total filtration efficiency are presented in Table 3. The total filtration efficiency values for the particles are all above 97%. Figure 9b reveals that the filtration efficiency for each filter is presented as a function of the basis weight. The PVA filters with additives follow the same trend: the higher the basis weight, the lower the particle filtration efficiency. This result is in line with the observed pressure drop behaviour of different filters. The basis weight increases due to the extra weight of the additive. The PVA/TiO2 filters are heavier but characterised by larger pores due to the beaded fibre morphology, resulting in lower particle filtration efficiency. It can be noticed that higher SSA values corresponded to an increase in the total particles’ filtration efficiency of the filters, as visible when comparing Table 2 and Table 3. However, this increase is not linear. SSA values ranged between 1.4 and 17.4 m2/g, while the total filtration efficiencies registered changes all below 1%.
The filtration efficiencies for particles as a function of the particle size for the five different filters are presented in Figure 10. Each of the five filters has lower filtration efficiency values on the smaller particle sizes. The 10PVA filter in Figure 10a exhibited an increasing filtration efficiency for 12 nm diameter particles (95.4%) to 202 nm diameter (99.3%) particles. Similar behaviour for the 10PVA2AC (Figure 10b) and 10PVA5AC (Figure 10c) filters was observed. Respectively, the filters recorded a minimum filtration efficiency of 96.2% and 94.5% for the smallest particles size (12 nm), reaching a maximum of 99.3% for 209 nm diameter particles and 99% for the 157 nm diameter particles.
The two filters containing TiO2 exhibited a slightly different curve regarding their filtration efficiencies as a function of particle size. For 12 nm particles, the filters recorded minimum efficiency values at 95.9% for 10PVA5TiO2 (Figure 10d) and 95.8% for 8PVA5TiO2 (Figure 10e). The increasing trend lasted until reaching a particle size of 21 nm for both filters. For the 8PVA5TiO2 filter, a constant filtration efficiency of 97.7% up to a particle size of 102 nm was observed. Above this threshold, the efficiency constantly increased until the maximum of 98.8% filtration efficiency for the 181 nm particle size. The 10PVA5TiO2 filter filtration efficiency reached a maximum of 97.5% at a particle size of 26 nm and decreased again to 97% for 85 nm diameter particles, for which the concentration was recorded as one of the highest at around 3 µg/m3. Thereafter, the efficiency increased again to reach a maximum of 98.4% at a 181 nm particle size.
For all filters, for particle sizes greater than 217 nm, not enough particles were present to obtain a statistically meaningful result.
In their recent study, Elkamhawy and Jang characterised a novel hybrid air purification technology with good performance for particulate matter below 10 m (removal efficiency of 87.3%) in the outdoor environment. There was a trend of decreasing efficiency with decreasing particle size, as below 2.5 µm, the removal efficiency dropped to 73.1% [47]. This study showed that the PVA-based filters investigated are highly efficient at removing particles in the range of the most penetrating particle size between 0.1 and 0.3 µm, and therefore they represent a promising and much needed solution.

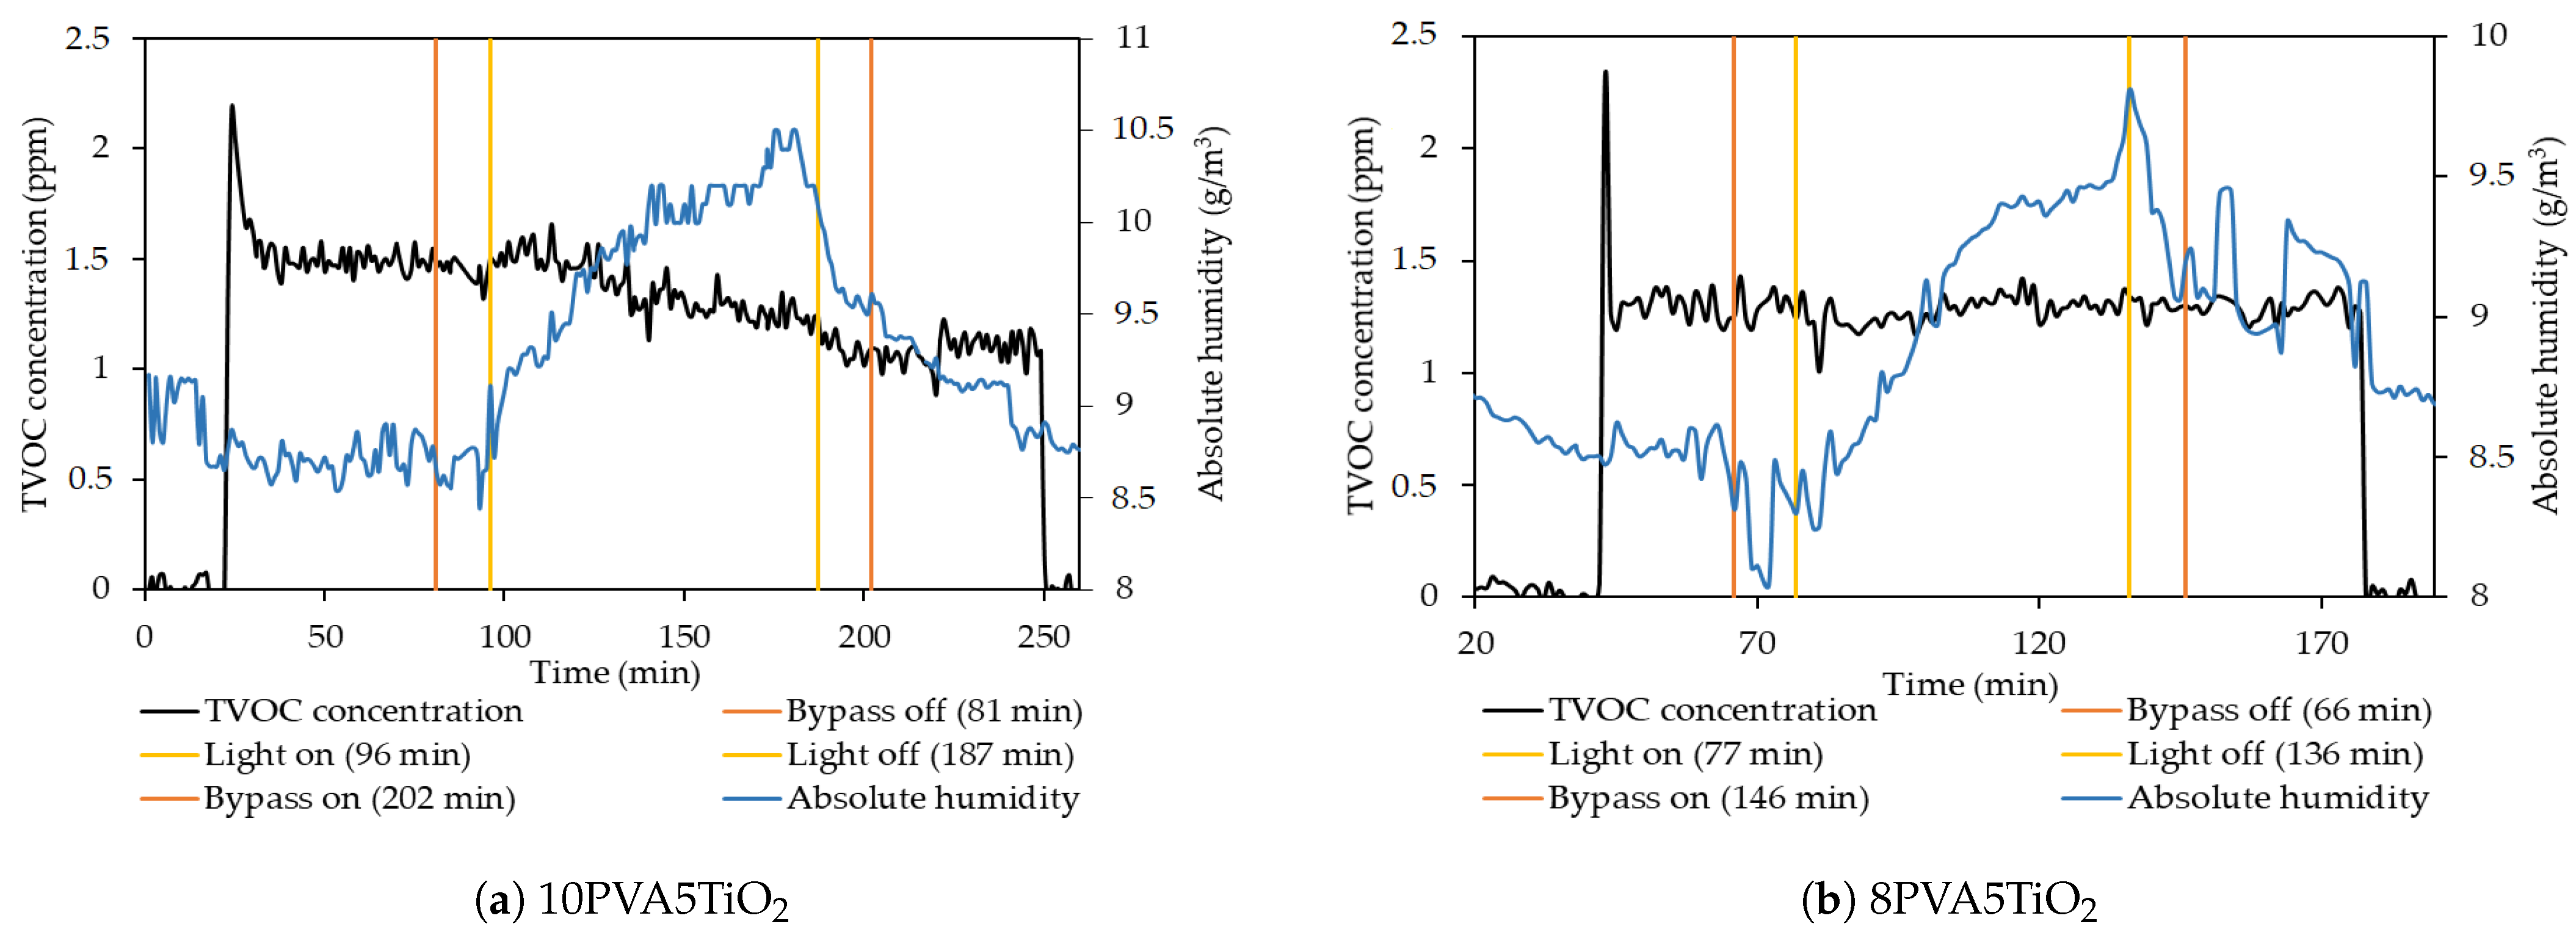
3.3.3. Toluene Removal

The pure PVA filter did not show any toluene removal, which was an expected result. PVA is a polymer that is not known for its adsorbance. The 10PVA2AC and 10PVA5AC filters have also not presented any toluene adsorption. The preparation method is responsible for the final surface that the samples present to the airstream. In previous experimental studies, activated carbon was formed on the nanofibre surface after electrospinning through carbonisation [21,25]. Activated carbon in powder form was added to the polymer solution prior to electrospinning in the present work. The activated carbon surface is likely wet with the dissolved polymer, which covers the AC surface when the solvent evaporates. This configuration is most probably responsible for the non-adsorption of toluene from the PVA/AC filters.
The performance of the two filters with TiO2 is presented in Figure 11, which was investigated using the setup in Figure 1. The graphs show the TVOC concentration in ppm and the absolute humidity in g/m3 that were recorded by the photo-acoustic gas monitor. Toluene was the only VOC added to the technical air to perform the experiment, although photocatalytic oxidation can generate byproducts in the form of VOCs. The orange lines represent when the airstream was first moved from the bypass to the reactor, facing the filter, and then back to the bypass stream. The yellow lines represent when the Xenon light was switched on and off, illuminating the filter surface.
Figure 11a displays the experiment for the 10PVA5TiO2 filter. The TVOC concentration was stable at around 1.5 ppm when it entered the reactor. The moment the lamp was switched on, a slight increase in the TVOC concentration was recorded, followed by a consistent drop that stabilised at around 1.1 ppm when the airstream moved to the bypass. The TVOC concentration did not return to the original 1.5 ppm at the end of the experiment, which could lead to the conclusion that the toluene concentration decreased due to instability in the toluene source. However, the water content in the airstream suggested differently. The graph indicates that the water amount in the airstream increased steeply when the light shined on the filter but then decreased again as soon as the light was switched off and met the initial concentration at the end of the experiment. Water is a product of the photocatalytic oxidation of toluene, presented in the following chemical reaction scheme:
C 7 H 8 + 9 O 2 7 C O 2 + 4 H 2 O
Figure 11b presents the performance of the 8PVA5TiO2 filter. The situation here is different from the first filter concerning the TVOC concentration, was not been affected throughout the experiment. It stabilised at around 1.3 ppm without consistent changes. However, the water content presented a development similar to the previous filter: it increased steeply when the filter was illuminated, suggesting that the Xenon light initiated oxidation. The two PVA/TiO2 filters were weighed before and after the experiments to determine whether the increased water content in the airstream could be related to the evaporation of water adsorbed from the filters when the surfaces were exposed to the Xenon light. The 10PVA5TiO2 filter did not exhibit any weight change, whereas the 8PVA5TiO2 filter lost 1 mg. The water content increased by 1.3 mg/L of air through the experiment. Such an amount of water content can only be explained by the photocatalytic oxidation of toluene, as it corresponds to the total amount of water produced and is two orders of magnitude higher than the filter weight loss. The resulting water content change indicates that there may also be changes in the relative humidity over time which should be taken into account when evaluating the long-term efficacy of the filter [48].
The results show active photocatalytic oxidation as the water content in the air flow showed a steep increase. The formation of byproducts is very likely the cause of the increased TVOC concentration recorded after the filters. The photocatalytic oxidation of VOCs by TiO2-doped filters has been reported in previous studies [23,45], as well as the formation of byproducts as a result of an incomplete reaction [49]. Su et al. have described the photocatalytic activity of their TiO2/PAN composite membranes and reported toluene conversion rates from 33.5% to 97.9%, depending on the TiO2/PAN mass ratio [45]. The main differences between this study’s TiO2/PVA filters and the TiO2/PAN membranes in [45] are in the doping method and the design of the photocatalytic experiments. In their study, TiO2 was electrosprayed on the PAN nanofibres, while in this work, TiO2 nanoparticles were mixed into the PVA solution prior to electrospinning. Electrospraying TiO2 nanoparticles probably led to a larger TiO2 surface facing the polluted air and the Xenon light. In addition, Su et al. performed a static experiment, during which toluene was injected into a reactor where TiO2/PAN membranes were kept and irradiated using the Xenon light for 2 h. The static experimental design seems to favour good performance by photocatalytic oxidation. This was probably due to the considerably higher retention time used in [45] compared to the photocatalytic experiment designed for the TiO2/PVA filters, which were studied under a face velocity of 5.3 cm/s.

4. Conclusions

In summary, five PVA-based nanofibre filters were fabricated via electrospinning. The use of additives leads to larger fibre diameters and pore size relative to the undoped filter, leading to a lower pressure drop. The investigated filters were still in a transition region between the slip and non-slip flow, as indicated by the Knudsen number. The 8PVA5TiO2 filter presented the lowest observed pressure drop of 195 Pa, whereas the highest particles filtration efficiency (98%) was recorded for the 10PVA2AC filter. The AC filters did not adsorb any toluene due to the preparation method for the filter. Photocatalytic oxidation was initiated by the Xenon light when investigating the PVA/TiO2 filter capacity of degrading toluene. This study showed that the efficiency of the filters towards particles and VOCs is promising, but the pressure drop needs further optimization.

Author Contributions

Conceptualisation, R.O., A.A., M.S.J. and P.F.; methodology, R.O. and P.F.; validation, R.O.; formal analysis, R.O. and M.P.; investigation, R.O. and M.P.; resources, A.A., M.S.J. and P.F.; project administration, A.A. and P.F.; writing—original draft preparation, R.O.; writing—review and editing, all authors; visualization, R.O.; supervision, A.A., M.S.J. and P.F.; funding acquisition, A.A. and P.F. All authors have read and agreed to the published version of the manuscript.

Funding

This research was funded by Grundejernes Investeringsfond, the Department of the Built Environment, the Department of Chemistry of the University of Copenhagen, and the Department of Materials and Production at Aalborg University.

Acknowledgments

The authors thank research technician Peter Kjær Kristensen and laboratory technician Thomas Sørensen Quaade from the Department of Materials and Production at Aalborg University for their support in performing the SEM images and running FTIR and Raman spectroscopy, respectively. We also thank laboratory manager Szymon Kwiatkowski from the Department of Chemistry at the University of Copenhagen for their support.

Conflicts of Interest

The authors declare no conflict of interest. The funders had no role in the study design; collection, analyses, or interpretation of data; writing the manuscript, or decision to publish the results.

Abbreviations

The following abbreviations are used in this manuscript:
ACActivated Charcoal
BETBrunauer–Emmett–Teller method
BJHBarrett–Joyner–Halenda method
FTIRFourier Transform Infrared
HEPAHigh Efficiency Particulate Air
HVACHeating, Ventilation and Air Conditioning
PVAPolyvinyl Alcohol
SEMScanning Electron Microscopy
SSASpecific Surface Area
TCDTip-to-Collector Distance
TGAThermogravimetric Analysis
TVOCsTotal Volatile Organic Compounds
VOCsVolatile Organic Compounds

References

  1. Lelieveld, J.; Pozzer, A.; Pöschl, U.; Fnais, M.; Haines, A.; Münzel, T. Loss of life expectancy from air pollution compared to other risk factors: A worldwide perspective. Cardiovasc. Res. 2020, 116, 1910–1917. [Google Scholar] [CrossRef] [PubMed]
  2. World Health Organization. Available online: https://www.who.int/data/gho (accessed on 11 January 2021).
  3. Mills, N.L.; Donaldson, K.; Hadoke, P.W.; Boon, N.A.; MacNee, W.; Cassee, F.R.; Sandström, T.; Blomberg, A.; Newby, D.E. Adverse cardiovascular effects of air pollution. Nat. Clin. Pract. Cardiovasc. Med. 2009, 6, 36–44. [Google Scholar] [CrossRef] [PubMed]
  4. Brunekreef, B.; Holgate, S.T. Air pollution and health. Lancet 2002, 360, 1233–1242. [Google Scholar] [CrossRef]
  5. Katsouyanni, K.; Touloumi, G.; Samoli, E.; Gryparis, A.; Le Tertre, A.; Monopolis, Y.; Rossi, G.; Zmirou, D.; Ballester, F.; Boumghar, A.; et al. Confounding and effect modification in the short-term effects of ambient particles on total mortality: Results from 29 European cities within the APHEA2 project. Epidemiology 2001, 12, 521–531. [Google Scholar] [CrossRef] [Green Version]
  6. Pope, C.A.; Dockery, D.W. Health effects of fine particulate air pollution: Lines that connect. J. Air Waste Manag. Assoc. 2006, 56, 709–742. [Google Scholar] [CrossRef]
  7. Fisk, W.J. Health benefits of particle filtration. Indoor Air 2013, 23, 357–368. [Google Scholar] [CrossRef]
  8. Mannucci, P.M.; Harari, S.; Martinelli, I.; Franchini, M. Effects on health of air pollution: A narrative review. Intern. Emerg. Med. 2015, 10, 657–662. [Google Scholar] [CrossRef] [PubMed]
  9. Khan, F.I.; Ghoshal, A.K. Removal of Volatic Organic Compounds from polluted air. J. Loss Prev. Process Ind. 2000, 13, 527–545. [Google Scholar] [CrossRef]
  10. Mamaghani, A.H.; Haghighat, F.; Lee, C.S. Photocatalytic oxidation technology for indoor environment air purification: The state-of-the-art. Appl. Catal. B Environ. 2017, 203, 247–269. [Google Scholar] [CrossRef]
  11. Zaatari, M.; Novoselac, A.; Siegel, J. The relationship between filter pressure drop, indoor air quality, and energy consumption in rooftop HVAC units. Build. Environ. 2014, 73, 151–161. [Google Scholar] [CrossRef]
  12. Sundarrajan, S.; Tan, K.L.; Lim, S.H.; Ramakrishna, S. Electrospun nanofibers for air filtration applications. Procedia Eng. 2014, 75, 159–163. [Google Scholar] [CrossRef] [Green Version]
  13. Li, P.; Wang, C.; Zhang, Y.; Wei, F. Air filtration in the free molecular flow regime: A review of high-efficiency particulate air filters based on Carbon Nanotubes. Small 2014, 10, 4543–4561. [Google Scholar] [CrossRef] [PubMed]
  14. Zhao, X.; Wang, S.; Yin, X.; Yu, J.; Ding, B. Slip-Effect Functional Air Filter for Efficient Purification of PM 2.5. Sci. Rep. 2016, 6, 1–11. [Google Scholar] [CrossRef]
  15. Kadam, V.V.; Wang, L.; Padhye, R. Electrospun nanofibre materials to filter air pollutants—A review. J. Ind. Text. 2018, 47, 2253–2280. [Google Scholar] [CrossRef]
  16. Zhu, M.; Han, J.; Wang, F.; Shao, W.; Xiong, R.; Zhang, Q.; Pan, H.; Yang, Y.; Samal, S.K.; Zhang, F.; et al. Electrospun Nanofibers Membranes for Effective Air Filtration. Macromol. Mater. Eng. 2017, 302. [Google Scholar] [CrossRef]
  17. Li, D.; Xia, Y. Electrospinning of nanofibers: Reinventing the wheel? Adv. Mater. 2004, 16, 1151–1170. [Google Scholar] [CrossRef]
  18. Scholten, E.; Bromberg, L.; Rutledge, G.C.; Hatton, T.A. Electrospun polyurethane fibers for absorption of volatile organic compounds from air. ACS Appl. Mater. Interfaces 2011, 3, 3902–3909. [Google Scholar] [CrossRef] [Green Version]
  19. Park, J.Y.; Lee, I.H. Characterization and Morphology of Prepared Titanium Dioxide Nanofibers by Electrospinning. J. Nanosci. Nanotechnol. 2010, 10, 3402–3405. [Google Scholar] [CrossRef] [PubMed]
  20. Wan, H.; Wang, N.; Yang, J.; Si, Y.; Chen, K.; Ding, B.; Sun, G.; El-Newehy, M.; Al-Deyab, S.S.; Yu, J. Hierarchically structured polysulfone/titania fibrous membranes with enhanced air filtration performance. J. Colloid Interface Sci. 2014, 417, 18–26. [Google Scholar] [CrossRef]
  21. Lee, K.J.; Shiratori, N.; Lee, G.H.; Miyawaki, J.; Mochida, I.; Yoon, S.H.; Jang, J. Activated carbon nanofiber produced from electrospun polyacrylonitrile nanofiber as a highly efficient formaldehyde adsorbent. Carbon 2010, 48, 4248–4255. [Google Scholar] [CrossRef]
  22. Wang, H.; Zheng, G.F.; Wang, X.; Sun, D.H. Study on the air filtration performance of nanofibrous membranes compared with conventional fibrous filters. In Proceedings of the 2010 IEEE 5th International Conference on Nano/Micro Engineered and Molecular Systems, NEMS 2010, Xiamen, China, 20–23 January 2010; pp. 387–390. [Google Scholar] [CrossRef]
  23. Chuang, Y.H.; Hong, G.B.; Chang, C.T. Study on particulates and volatile organic compounds removal with TiO2nonwoven filter prepared by electrospinning. J. Air Waste Manag. Assoc. 2014, 64, 738–742. [Google Scholar] [CrossRef]
  24. Givehchi, R.; Li, Q.; Tan, Z. Quality factors of PVA nanofibrous filters for airborne particles in the size range of 10–125 nm. Fuel 2016, 181, 1273–1280. [Google Scholar] [CrossRef]
  25. Oh, G.Y.; Ju, Y.W.; Jung, H.R.; Lee, W.J. Preparation of the novel manganese-embedded PAN-based activated carbon nanofibers by electrospinning and their toluene adsorption. J. Anal. Appl. Pyrolysis 2008, 81, 211–217. [Google Scholar] [CrossRef]
  26. Ju, Y.W.; Oh, G.Y. Behavior of toluene adsorption on activated carbon nanofibers prepared by electrospinning of a polyacrylonitrile-cellulose acetate blending solution. Chem. Eng. J. 2017, 34, 2731–2737. [Google Scholar] [CrossRef]
  27. Wang, M.X.; Huang, Z.H.; Shimohara, T.; Kang, F.; Liang, K. NO removal by electrospun porous carbon nanofibers at room temperature. Chem. Eng. J. 2011, 170, 505–511. [Google Scholar] [CrossRef]
  28. Xia, T.; Bian, Y.; Zhang, L.; Chen, C. Relationship between pressure drop and face velocity for electrospun nanofiber filters. Energy Build. 2018, 158, 987–999. [Google Scholar] [CrossRef]
  29. Subbiah, T.; Bhat, G.S.; Tock, R.W.; Parameswaran, S.; Ramkumar, S.S. Electrospinning of nanofibers. J. Appl. Polym. Sci. 2005, 96, 557–569. [Google Scholar] [CrossRef]
  30. Deitzel, J.M.; Kleinmeyer, J.D.; Harris, D.; Beck Tan, N.C. The effect of processing variables on the morphology of electrospun. Polymer 2001, 42, 261–272. [Google Scholar] [CrossRef]
  31. Lu, J.D.; Xue, J. Poisoning: Kinetics to Therapeutics. In Critical Care Nephrology, 3rd ed.; Elsevier Inc.: Amsterdam, The Netherlands, 2019; pp. 600–629. [Google Scholar] [CrossRef]
  32. Wang, Y.; Zhong, M.; Chen, F.; Yang, J. Visible light photocatalytic activity of TiO2/D-PVA for MO degradation. Appl. Catal. B Environ. 2009, 90, 249–254. [Google Scholar] [CrossRef]
  33. Coates, J. Interpretation of Infrared Spectra, A Practical Approach. In Encyclopedia of Analytical Chemistry; Meyers, R.A., Ed.; John Wiley and Sons Ltd.: Hoboken, NJ, USA, 2000. [Google Scholar]
  34. Mansur, H.S.; Sadahira, C.M.; Souza, A.N.; Mansur, A.A. FTIR spectroscopy characterization of poly (vinyl alcohol) hydrogel with different hydrolysis degree and chemically crosslinked with glutaraldehyde. Mater. Sci. Eng. C 2008, 28, 539–548. [Google Scholar] [CrossRef]
  35. Kharazmi, A.; Faraji, N.; Hussin, R.M.; Saion, E.; Yunus, W.M.M.; Behzad, K. Structural, optical, opto-thermal and thermal properties of ZnS-PVA nanofluids synthesized through a radiolytic approach. Beilstein J. Nanotechnol. 2015, 6, 529–536. [Google Scholar] [CrossRef] [PubMed] [Green Version]
  36. Bhat, N.V.; Nate, M.M.; Kurup, M.B.; Bambole, V.A.; Sabharwal, S. Effect of γ-radiation on the structure and morphology of polyvinyl alcohol films. Nucl. Instrum. Methods Phys. Res. Sect. B Beam Interact. Mater. Atoms 2005, 237, 585–592. [Google Scholar] [CrossRef]
  37. Elashmawi, I.S.; Hakeem, N.A.; Selim, M.S. Optimization and spectroscopic studies of CdS/poly(vinyl alcohol) nanocomposites. Mater. Chem. Phys. 2009, 115, 132–135. [Google Scholar] [CrossRef]
  38. Shi, Y.; Xiong, D.; Li, J.; Wang, K.; Wang, N. In situ repair of graphene defects and enhancement of its reinforcement effect in polyvinyl alcohol hydrogels. RSC Adv. 2017, 7, 1045–1055. [Google Scholar] [CrossRef] [Green Version]
  39. Ferrari, A.C.; Meyer, J.C.; Scardaci, V.; Casiraghi, C.; Lazzeri, M.; Mauri, F.; Piscanec, S.; Jiang, D.; Novoselov, K.S.; Roth, S.; et al. Raman spectrum of graphene and graphene layers. Phys. Rev. Lett. 2006, 97, 1–4. [Google Scholar] [CrossRef] [Green Version]
  40. Surmacki, J.; Wroński, P.; Szadkowska-Nicze, M.; Abramczyk, H. Raman spectroscopy of visible-light photocatalyst—Nitrogen-doped titanium dioxide generated by irradiation with electron beam. Chem. Phys. Lett. 2013, 566, 54–59. [Google Scholar] [CrossRef]
  41. Balachandran, U.; Eror, N.G. Raman spectra of titanium dioxide. J. Solid State Chem. 1982, 42, 276–282. [Google Scholar] [CrossRef]
  42. Ding, W.; Wei, S.; Zhu, J.; Chen, X.; Rutman, D.; Guo, Z. Manipulated electrospun PVA nanofibers with inexpensive salts. Macromol. Mater. Eng. 2010, 295, 958–965. [Google Scholar] [CrossRef]
  43. Kim, G.M.; Asran, A.S.; Michler, G.H.; Simon, P.; Kim, J.S. Electrospun PVA/HAp nanocomposite nanofibers: Biomimetics of mineralized hard tissues at a lower level of complexity. Bioinspir. Biomimetics 2008, 3. [Google Scholar] [CrossRef]
  44. Mancin, S.; Zilio, C.; Cavallini, A.; Rossetto, L. Pressure drop during air flow in aluminum foams. Int. J. Heat Mass Transf. 2010, 53, 3121–3130. [Google Scholar] [CrossRef]
  45. Su, J.; Yang, G.; Cheng, C.; Huang, C.; Xu, H.; Ke, Q. Hierarchically structured TiO2/PAN nanofibrous membranes for high-efficiency air filtration and toluene degradation. J. Colloid Interface Sci. 2017, 507, 386–396. [Google Scholar] [CrossRef] [PubMed]
  46. Bortolassi, A.C.C.; Guerra, V.G.; Aguiar, M.L.; Soussan, L.; Cornu, D.; Miele, P.; Bechelany, M. Composites based on nanoparticle and pan electrospun nanofiber membranes for air filtration and bacterial removal. Nanomaterials 2019, 9, 1740. [Google Scholar] [CrossRef] [Green Version]
  47. Elkamhawy, A.; Jang, C.M. Performance evaluation of hybrid air purification system with vegetation soil and electrostatic precipitator filters. Sustainability 2020, 12, 5428. [Google Scholar] [CrossRef]
  48. Ollier, R.; Pérez, C.; Alvarez, V. Effect of Relative Humidity on the Mechanical Properties of Micro and Nanocomposites of Polyvinyl Alcohol. Procedia Mater. Sci. 2012, 1, 499–505. [Google Scholar] [CrossRef] [Green Version]
  49. Yu, W.; In ‘T Veld, M.; Bossi, R.; Ateia, M.; Tobler, D.; Feilberg, A.; Bovet, N.; Johnson, M.S. Formation of formaldehyde and other byproducts by TiO2 photocatalyst materials. Sustainability 2021, 13, 4821. [Google Scholar] [CrossRef]
Figure 1. Setup used to study the pressure drop and volatile organic compound removal for various filters.
Sustainability 13 06553 g001
Figure 2. Setup used for studying the filtration efficiency of various filters.
Sustainability 13 06553 g002
Figure 3. Scanning electron microscopy images of nanofibre filter samples and the related nanofibre diameter distribution.
Sustainability 13 06553 g003aSustainability 13 06553 g003b
Figure 4. FTIR spectra of the 10PVA filter sample.
Sustainability 13 06553 g004
Figure 5. Raman spectra of the 10PVA and 10PVA5TiO 2 filter samples.
Sustainability 13 06553 g005
Figure 6. Thermogravimetric analysis curve of the 10PVA filter sample.
Sustainability 13 06553 g006
Figure 7. Pictures of the electrospun nanofibre filters: (a) 10PVA; (b) 10PVA2AC; (c) 10PVA5AC; (d) 10PVA5TiO2; and (e) 8PVA5TiO2.
Sustainability 13 06553 g007
Figure 8. Plot of the pressure drop versus the face velocity for each filter. The three measurement points are 5.3, 7.95 and 10.6 cm/s.
Sustainability 13 06553 g008
Figure 9. Plots of the (a) pressure drop and (b) total particle filtration efficiency versus the basis weight, comparison between filters.
Sustainability 13 06553 g009
Figure 10. Particle size distribution recorded before and after the reactor where the filters were placed and the filtration efficiency was based on particle size.
Sustainability 13 06553 g010
Figure 11. Development over time of the TVOC concentration and water content during the experiment to evaluate the toluene degradation of PVA/TiO2 using the Xenon light.
Sustainability 13 06553 g011
Table 1. Composition of polymer solutions and electrospinning conditions to fabricate filters.
10PVA10PVA2AC10PVA5AC10PVA5TiO 2 8PVA5TiO 2
SolutionPVA 10 w/v%PVA 10 w/v%PVA 10 w/v%PVA 10 w/v%PVA 8 w/v%
AC 2 w/v%AC 5 w/v%TiO 2 5 w/v%TiO 2 5 w/v%
PVA (g)55554
H 2 O (mL)5040403535
Etanol (mL)-10101515
AC (g)-12.5--
TiO 2 (g)---2.52.5
TCD (cm)16.5161619.516
Voltage (kV)20.3–25.713.513.513.5–16.511.1
Feed rate (mL/h)0.230.120.120.121
PVA: polyvinyl alcohol; AC: activated charcoal; TCD: tip-to-collector distance.
Table 2. Results of the fibre diameter analysis, basis weight calculation, and BET measurements; specific surface area (SSA), average pore diameter, and total pore volume for pores smaller than 31,917.2 Å.
FilterFibre AverageSTDBasis WeightSSAAverage PoreTotal Pore
Diameter DiameterVolume
(µm)(µm)(g/m 2 ) (m 2 /g) (Å) (cm 3 /g)
10PVA0.2130.02723.57.91030.165.965 × 10 3
10PVA2AC0.2830.04716.68.51941.478.889 × 10 3 *
10PVA5AC0.2640.0417.617.4331.261.362 × 10 2
10PVA5TiO 2 0.4300.08367.61.43432.481.165 × 10 3
8PVA5TiO 2 0.3010.05531.82.52540.672.568 × 10 3
* Pores smaller than 31,914.1 Å.
Table 3. Total particles filtration efficiency for different electrospun nanofibre filters.
10PVA10PVA2AC10PVA5AC10PVA5TiO 2 8PVA5TiO 2
Total filtration efficiency (%)97.698.097.997.397.8
Publisher’s Note: MDPI stays neutral with regard to jurisdictional claims in published maps and institutional affiliations.

