Article

Can Space–Time Shifting of Activities and Travels Mitigate Hyper-Congestion in an Emerging Megacity, Bangkok? Effects on Quality of Life and CO2 Emission

by
Witsarut Achariyaviriya
1,*,
Yoshitsugu Hayashi
2,
Hiroyuki Takeshita
2,
Masanobu Kii
3,
Varameth Vichiensan
4 and
Thanaruk Theeramunkong
5,6
1
Department of Constructional Engineering, Graduate School of Engineering, Chubu University, Kasugai 487-8501, Aichi, Japan
2
Center for Sustainable Development and Global Smart City, Chubu University, Kasugai 487-8501, Aichi, Japan
3
Faculty of Engineering and Design, Kagawa University, Hayashi-cho 2217-20, Takamatsu, Japan
4
Department of Civil Engineering, Faculty of Engineering, Kasetsart University, Bangkok 10900, Thailand
5
Sirindhorn International Institute of Technology, School of Information, Computer, and Communication Technology, Thammasat University, Pathum Thani 12000, Thailand
6
The Academy of Science, The Royal Society of Thailand, Sanam Suea Pa, Dusit, Bangkok 10300, Thailand
*
Author to whom correspondence should be addressed.
Sustainability 2021, 13(12), 6547; https://doi.org/10.3390/su13126547
Submission received: 14 May 2021 / Revised: 27 May 2021 / Accepted: 1 June 2021 / Published: 8 June 2021
(This article belongs to the Collection Sustainable Urban Mobility Project)

Abstract

:
Many megacities in the world, especially Bangkok, are facing severe congestion in road traffic and public transport, particularly during peak hours. This situation (a) worsens the quality of life, (b) releases emissions causing air pollution and climate change, and (c) subsequently creates requests for massive investment in transport infrastructure, which easily exceed the budget’s limit. Instead of solving the problem by supply-side strategies, applying ICT-based solutions to reform people’s daily activities, particularly commuting and working behaviors, on the demand-side is an alternative solution. As a promising solution, Mobility as a Service (MaaS) introduces ICT to persuade people to use public modes of transport. However, modal shift is a partial solution to mitigate traffic congestion. With technological advancements in communication, people become more flexible in their activities in terms of place and time aspects. MaaS should not only induce a transport mode shift but also a workplace shift and working time shift by extending the planning service in daily activity-travel level, exploiting people’s flexibilities for an activity’s place and time to manage travel demand. This paper proposes the QOL-MaaS as the extended MaaS to support space–time shift of activity-travel and reveals its potential impacts on traffic congestion, quality of life, and CO2 emission.

1. Introduction

1.1. A Brief History of Bangkok’s Transport

Bangkok is the capital city of Thailand, forming along the Chao Phraya River. In the past, Bangkok was the so-called “Venice of East” because of boat travel’s charm. From absorbing the culture and obtaining technology from foreign countries, many roads were built, and cars became popular. At this point, it is the beginning of various problems consequence in the present. From the study of Hanaoka [1], rickshaws were brought to Bangkok about 1887, following motorcars in 1907. At that time, Bangkok was developed by adopting a western way to be accepted as a civilized country. Western culture turned out to be appreciated, and it was finally assimilated into Thai culture. Over time until 1953, rickshaws were considered as traffic obstruction and a symbol of undeveloped. Therefore, rickshaws were banned and prohibited on the street of Bangkok. Since then, roads have been continuously developed, including expressways and elevated roadways. For more than 30 years, many trails have been built around the area in Bangkok, together with traffic problems that have accumulated continuously. After the financial crisis in 1997, the Mass Transit Master Plan (MTMP), which was proposed in 1995 to provide the backbone of public transport, was revised as the Urban Rail Transportation Master Plan (URMAP) in 2000 and continue to develop the rail system. BTS Skytrain and Metropolitan Rapid Transit (MRT) underground metro lines were operated in 1999 and 2004. Despite the operations of BTS and MRT, traffic congestion could not be solved, and the number of car users still increased.

1.2. Requirement for Transport Solutions in Bangkok

During rapid economic growth, the demand for cars increases dramatically, especially in car-dependent cities like Bangkok [2]. When the road infrastructure is unable to meet demand, traffic congestion subsequently undermines citizens’ lives. Back in the early days before 1990, road transport was given a priority and continuously developed. The development plan mainly focuses on road development and rarely gives importance to urban rail transport [3].
For a long time, the government has expanded roads and railways to relieve traffic congestion. However, it still cannot solve the problem completely. This way began to enter a dead-end due to the limited land area and also budget. The traveling behavior of people using personal cars is ineffective and non-sense to encourage. Shifting people to a public transportation system is one of the solutions, reducing the burden on transport infrastructure and the environment. Recently, the MaaS concept has been introduced. This concept aims to shift from personally owned modes of transport towards public modes and shared modes of transport by providing an integrated system of transport modes and related services via ICT platform to afford maximum convenience for users, which has been pilot tested and implemented in many countries.
However, it is only a partial solution for changing traveling behavior limited to consideration of transport modes. As long as people’s activity destinations and timings remain unchanged, travel demand at peak-hour is still high, resulting in unnecessary social cost and worsening people’s quality of life. During the peak hours of the day, there are a large number of people traveling, including on public transport, in which government and service providers need to procure massive land for right of ways for railways and roads, additional transport operation staff, and numerous facilities (such as station, buses, train cars, etc.) enough for the passenger volume and the social distancing. However, off-peak hours, those resources are not fully utilized, and many opportunity costs are created.
Therefore, MaaS should be extended to support a flexible working lifestyle; people can design or partially design their workplaces and work hours by serving an optimal activity-travel plan to people managing space–time distribution of travel demand for better overall mobility in the transport network and individual quality of life (QOL). The activity-travel planning extension also has the capability to accelerate lifestyle shift from traditional 9-to-5 working to flexible working by giving the information to people to raise their awareness of the quality of life and social burdens, such as recommending alternative plans of daily activity-travel for people in the form of flexible working, offering them enhancement to their quality of life and contributing to social burden mitigation at the same time.
In this paper, the concept of Quality-of-Life oriented MaaS (QOL-MaaS) is proposed as the extended MaaS concept for space–time shift of activity-travel adopting a flexible work-life. The potential impact of flexible working and the role of QOL-MaaS to support future flexible working is examined by scenario simulation applying MATSim.

2. Related Research

2.1. MaaS Research

MaaS is the emerging concept that researchers in transport-related fields are paying attention to. Many pilot systems of MaaS have been implemented based on their own definition. There have been studies on emerging MaaS projects to understand its characteristics. Jittrapirom et al. (2017) [4] studied the MaaS definition by examining the service functions in some MaaS schemes. Additionally, the risk and opportunity of MaaS were taken into consideration as well [5]. Sochor et al. (2018) [6] classified MaaS based on objectives of integration into five levels: level (0) no integration, level (1) integration of information, level (2) integration of booking and payment, level (3) integration of the service offer, and level (4) integration of societal goals. Recently, Arias-Molinares and García-Palomares (2020) conducted a literature review of MaaS applying the W-question framework [7]. In the policy aspect, the framework to analyze MaaS policies has been developed [8]. The potential of MaaS to support behavior change is examined by in-depth interviews with people [9]. In the following section, we have selected some well-known MaaS applications, which are frequently mentioned in the literature, to examine the service’s features and reviewed its potential impact and limitation.

2.2. MaaS in Practices

Table 1 represents the service features of the six well-known MaaS schemes/applications—(1) UbiGo, (2) Whim, (3) SHIFT, (4) Smile, (5) Moovel, and (6) Optymod Lyon. To understand their similarity and difference, their properties are characterized based on three service functions: transport modes, information services, and customization. Their details are described as follows.
  • Transport modes: As the first mode, public transport includes buses, railways, and boats, which have at least one service in the application. The second mode, sharing vehicles, enables their users to share their vehicles such as bicycles, scooters, or cars via the application platform. The third mode is vehicle rental service where the existence of cooperating or associating with the service of vehicle rental companies is considered. Finally, on-demand service, the fourth mode, specifies the availability of door-to-door services, including taxis and other paratransit.
  • Information services: The first service is real-time information provider that supplies real-time situation such as real-time road traffic situation, public transport congestion level, real-time location of service vehicles. As the second service, notification triggers alerts to users for upcoming travel activities such as warnings of the bus schedules, the arrival of the booked on-demand taxi, or when to get off the bus. The route planning, the third service, helps users to find the best route choices and mode combination choices.
  • Customization: The users can customize their trips in terms of (i) service options such as transport mode preference, payment options, personal capability/disability, etc.; and (ii) route search factors, which allow users to set the factor for route optimization, e.g., travel time, cost, distance, level of emission, etc.
According to the literature and examining the selected MaaS system, generally, transport mode integration and payment integration are the MaaS characteristics that many projects have focused on and implemented. The wide variety of transport modes can provide users more convenience and recognize the new or unknown services. The flexible payment options allows users to choose their suitable package [10], attracting more people to participate in the system. Apart from that, the MaaS concept also creates a new market for mobility services, such as bike-sharing or community transport [11]. Therefore, these indicate that MaaS focuses mainly on the trip-level to offer convenience and suitable transport means to maximize the user’s satisfaction.

2.3. Potential of MaaS in Bangkok and Its Limitation

In the future, it is high potential that Bangkok will have its MaaS system that integrates all transport modes and payment systems—including public transport, sharing vehicles, on-demand service, and rental vehicles. In Bangkok, many parts of the MaaS system have been developed from the viewpoint of transport modes integration [12], and most of them are on-demand services that become popular nowadays. This kind of service can help reduce the rate of using private cars and shift people to use public modes of transport, but some researchers showed that on-demand service might not reduce traffic congestion [13]. Bike-sharing or rental bike systems have been operated in many areas. In terms of payment integration, currently, the government has been developing an integrated payment system for public transport [14]. From here, we can see that MaaS in Thailand is continuously being developed actively.
Finally, when imagining the MaaS system for Bangkok, the authors ask “how much potential of MaaS to reduce the burden on society?”. Obviously, MaaS can reduce the burden limited only to the trip level by transport mode shift means. In a crowded city like Bangkok, not only are roads traffic-congested, but the public transport system is also crowded, especially during rush hours with very high travel demand that may make MaaS unable to persuade people to shift to public transport. Perhaps even worse, it could turn people using public transport to use on-demand service.

2.4. ICT-Based Transformation of Daily Activities

Valenduc and Vendramin (2002) [15] said the increasing use of ICT is blurring between working time and other social times. Future work styles could be more decentralized [16,17]. People do not need to concentrate in the office all working hours [18]. The government should promote a flexible working policy that allows employees to shift their fixed working times and places. For example, work from home or working at a co-working space outside the city center avoids commuting during peak-hours and utilizes more ICT for cooperation. This is also good for work-life balancing [19].
Since the end of 2019, the outbreak known as COVID-19 has spread quickly around the world. Many cities have taken various measures to mitigate the pandemic of the COVID-19 [20]. One of the most important measures is social distancing. Public transportation systems, especially during peak hours, are considered a high-risk place for spreading the virus. Both governments and transport experts need to find solutions to reduce travel demand. According to the social distance policy, the reducing working days and work from home (WFH) regulations have been applied [21,22], and the flexibility of working hours is also used in many organizations. The survey result shows that about 40% of respondents perform flexible working during the pandemic [23]. Distance learning is also applied in many schools and universities in Thailand [24]. These reveal the potential for flexible working to be applied in future lifestyle for the post-COVID-19.
Flexibility in space and time of activity and ICT-based systems are the keys to improve people’s quality of life and to reduce social burden. Therefore, the new generation working should be more flexible in working and other activities without location and time constraints. This will be creating enormous potential demand for an ICT-based management system, integrating business-living activity, transport, and communication.

2.5. Daily Activity-Travel Scheduling Models

As mentioned, future urban activities should be more supported by cyberspace, creating greater flexibility in space and time constraints. Under this new paradigm, services for personal activity-travel planning play a more important role in providing people a better quality of life with less social burden.
There have been many researchers who proposed the daily activity-travel planning to support this flexibility, such as (a) trip-chain design combined mode and route choices [25], (b) the activity-travel scheduling method for flexible space–time condition [26,27,28,29], and (c) activity-travel scheduling for inter-individual to travel or do some activities together [30].
The authors think that these kinds of mentioned research are helpful to support future people’s lifestyles and to induce the workplace and worktime shifting, which are very useful for MaaS to increase the degree of sustainability in transportation. Still, the point is, “What is the goal of recommendation for people to achieve sustainable transport?”. Generally, MaaS services and activity-travel planning research are designed to provide a person with the maximum user’s benefit or user’s efficiency, such as saving time and/or travel costs. However, the burden on society created by personal activity-travel is often neglected.

2.6. Analysis of Social Burden

Inevitably, the daily travels of people create social burdens on the economy, environment, and transport infrastructure. Choosing locations and timings for activity in the daily plan is very significant to the level of social burdens. The planning system can exploit the advantage of flexibility conditions to minimize the social burden from individuals’ daily plans. For example, in daily life, people travel to the city center to work in the morning and back home in the evening. It is known that this habit is the cause of severe peak traffic congestion in the morning and evening. If people can divide their work hours to work out of the office as a way of work from home (WFH) or remote working at co-working spaces, the scheduling system can recommend a suitable place and time for travel to avoid generating huge burdens. Therefore, the planning system needs to have a comprehensive evaluation of social burdens in various aspects.
The first is the economic loss caused by traffic congestions. Many economists say that it is the critical factor causing market failure and social problems [31]. The social cost from this loss can be evaluated from the time loss in transportation, such as “delayed time” and “queuing time”, in which the valuation of time loss can be assessed by the loss of GDP [32]. J. Kim (2019) [31] conducted the research to determine social cost creating from traffic congestion using individuals trip level datasets, and Li and Yang (2017) [33] estimated the level of congestion charged as a social cost.
Second, environmental burdens are also crucial for global society to prioritize, as they affect people’s well-being, via such issues as global warming, air pollution, and natural disasters. In the transport sector, the most evident influence on the environment is the emission from energy usage, including CO2 and PM 2.5, etc. [34]. Therefore, these impacts should be considered as one of the social costs. Many researchers are trying to create models for estimating the value of these burdens. Barth and Boriboonsomsin (2008) develop the emission function based on travel speed [35]. van den Bergh and Botzen (2015) study the potential for the monetary valuations of CO2 [36]. Du and Li (2016) estimate the cost associated with the health impact resulting from PM 2.5 [37].
The third is the burden due to transport infrastructure and maintenance. The daily commuting of people in the city causes damage to the transport infrastructure, resulting in subsequent maintenance costs. Different types of vehicles cause various degrees of damage to road surfaces [38]. Therefore, the vehicle conditions also need to consider:
These three critical aspects of the social burden—(1) economic, (2) environmental, and (3) infrastructure—can be considered in the optimization process of the daily activity-travel planning for counterbalancing with user’s benefit or the quality of life, for which Table 2 shows its related literature.

2.7. Quality of Life (QOL) Research

Quality of Life (QOL) use to evaluate a person’s benefits. QOL considers people’s perceptions and expectations for a good life. The QOL approach can be extended to evaluate Gross National Happiness (GNH) and Sustainable Development Goals (SDGs) [51]. Daily activity-travel influences QOL in two main aspects: (1) the satisfaction of the place for activity defined as place-specific QOL (P-QOL) and (2) the satisfaction of traveling defined as travel-specific QOL (T-QOL).
  • Place-specific QOL (P-QOL) is defined as the level of satisfaction of individuals toward place’s factors, including five groups of factors [47,52]: (1) economic opportunity factors, (2) living opportunity factors, (3) amenity factors, (4) safety and security factors, and (5) environmental factors. The importance of each factor differs for each person and also the kind of activity.
  • Travel-specific QOL (T-QOL) is defined as the level of satisfaction of individuals during traveling toward (1) route conditions, e.g., travel time, cost, walking distance, or a number of transfers, (2) transport mode condition, such as comfort (e.g., congestion, availability of air conditioner, or privacy), safety (e.g., accident risk, crime risk, or level of protection).

3. Materials and Methods

3.1. Scenario Simulation Using MATSim

MATSim [53] is an agent-based mobility simulation on a virtual transport network based on travel demand scenarios. This tool can be utilized to model and study the characteristic of the traffic situation in the virtual transport network in both space and time dimensions. This model is also applied to the evaluation of SDGs achievement of urban policies along with the land use model [54]. The virtual transport network as a supply-side of the transport system is one of the main components for simulation consists of spatial information of roads, railways, bus routes, etc., in terms of nodes and links with its attributes such as the free-flow speed, the number of lanes, and capacity. To simulate mobility of citizens in the virtual transport network, activity plans of citizens or agents are needed to assign as a travel demand scenario, in which each agent’s plan contains activity times, activity locations, and travel means. Other than demand and supply of transport, there are mathematical models that needed to configure which are (1) mobsim (mobility simulation) module; (2) scoring module as a decision model of agent for plan selection; and (3) re-planning module for plan optimization, which system flow is shown in Figure 1.
Mobsim or mobility simulation [55] is the part of MATSim that serves the route planning for the population and calculates the traffic conditions of the transport network. Generally, the size of the population and transport network for simulation are scaled down to obtain reasonable calculation time. Therefore, scaling parameters for mobility calculation are required to configure in this part. The scoring process serves the evaluation of the agent’s activity-travel plans based on the Charypar-Nagel utility function [56] as a decision model of agents for plan selection, in which the level of utility of factors are needed to define. The re-planning perform to optimize the agent’s plans through the iteration loops by modifying the travel plan of some agents, which strategies [57,58,59] of the modification are needed to specify. The configuration of parameters in each module using in this study is shown in Table 3.
Table 3, there are three modules that need configuration. For Mobsim, flow capacity and storage capacity factors are the scaling value depending on the population’s sample size. Since the sample size of the population in this study is about 0.7%, the scaling value should be 0.007. However, the effect of the simplified transport network, in which public transport network and non-main roads (alleyways) are excluded, causes the irregularity high travel time. Therefore, tuning these parameters is necessary to obtain a reasonable average travel time of simulation results compared with Bangkok’s actual situation. When the tuning parameters are 0.125, the average travel time of agents in the business-as-usual scenario is approximately 31 min, while the report of travel demand survey by OTP is about 36 min [60]. Thus, the simulation result has an 13.9% deviation that we think it is an acceptable discrepancy. The scoring module has five setting parameters to set up the Charypar-Nagel utility function [56]. In the re-planning module, the re-routing strategy randomly selects the 10% of the agents to re-routing their travel plans, and the rest 90% will be assigned to the best score strategy, which selects the best score of their available plans.

3.2. Business as Usual (BAU) Scenario Simulation

The Business-as-Usual (BAU) scenario is representative of travel demand of 9-to-5 working style. This scenario assumes that all people travel to work in the morning and go back home in the evening, which causes peak traffic congestion in these periods. The process of BAU scenario simulation consist of three main parts: (1) target area and related data, (2) travel demand modeling, (3) agent’s activity-travel plan creation. The methods and details in each part of the framework will be described in the following subsections.

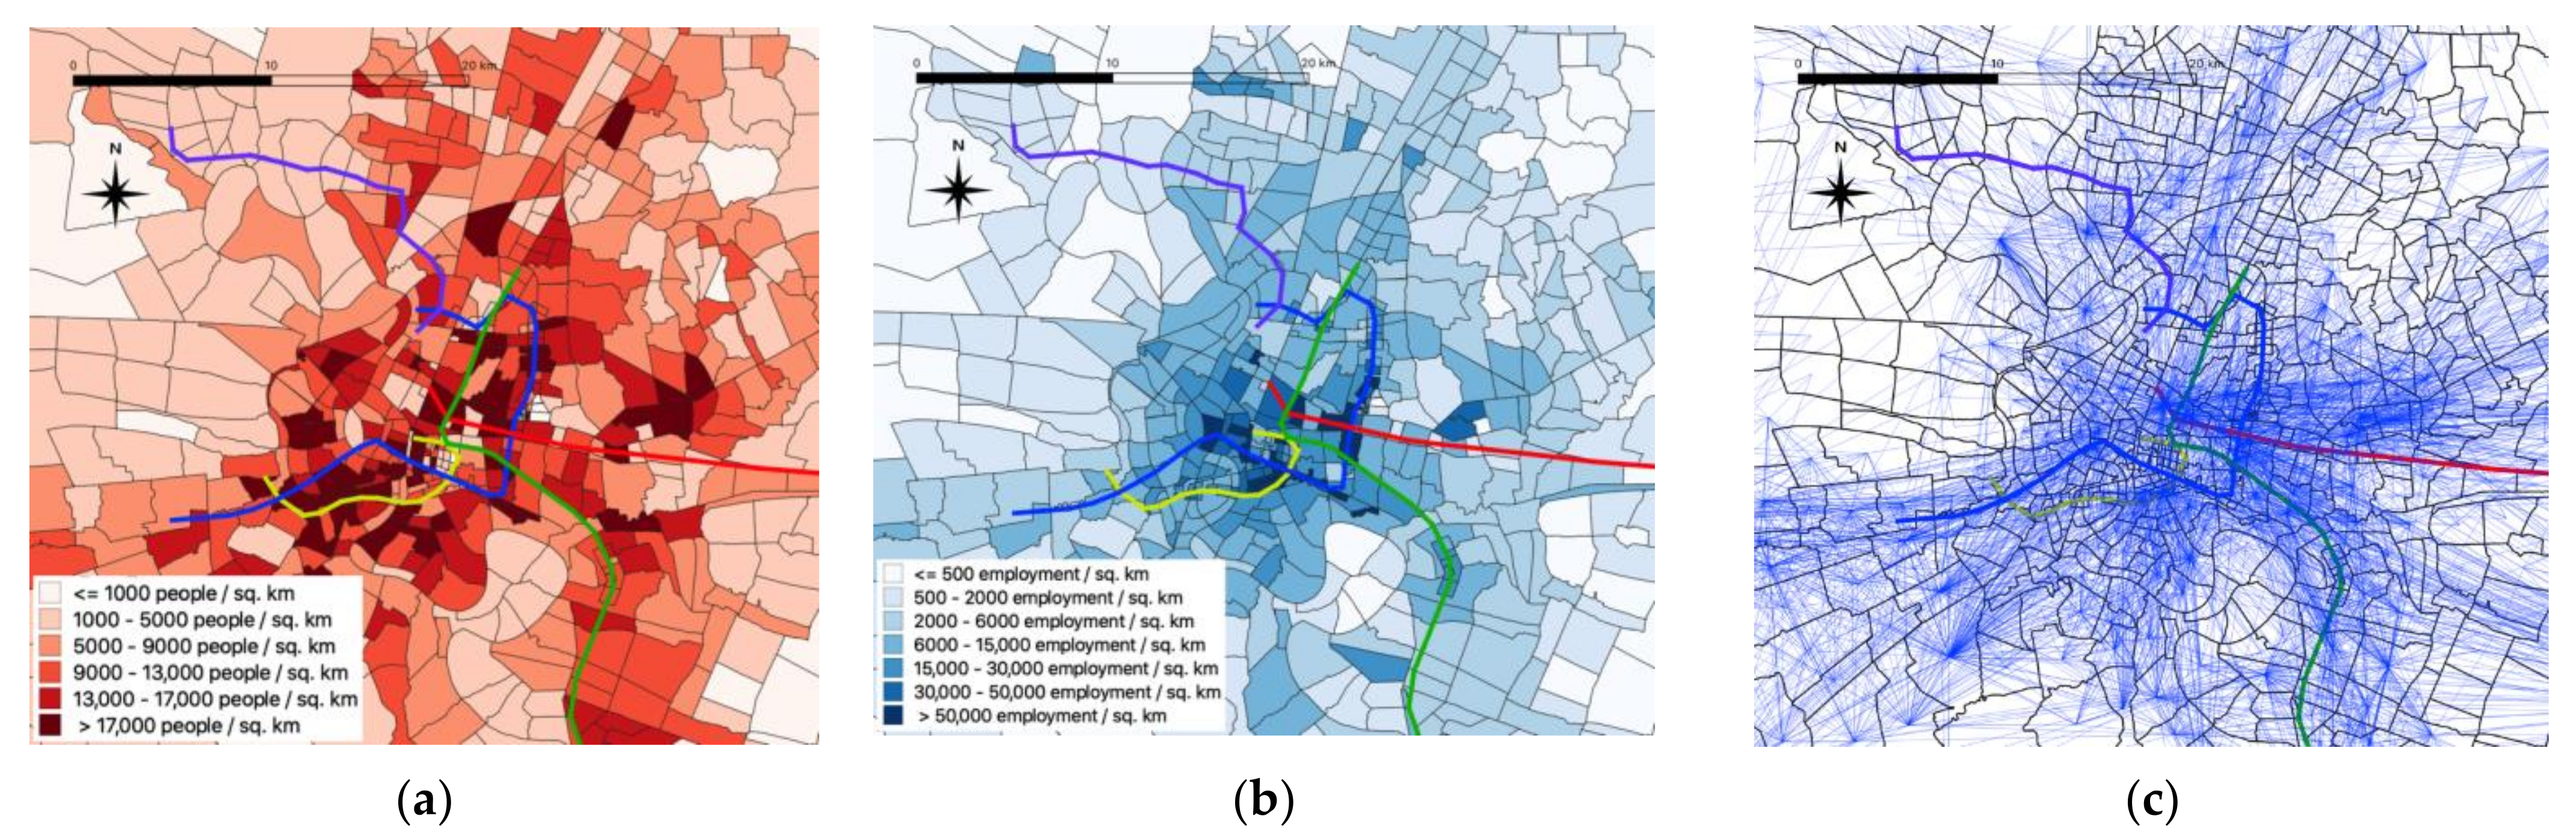
3.2.1. Target Area and Related Data

The target area is Bangkok Metropolitan Region (BMR) boundary, covering about 7.7 thousand square kilometers having approximately 14.6 million population in 2010 [61]. In this study, there are three types of data using for the simulation of the BAU scenario. The first type is person-trip statistics. Second, traffic analysis zone (TAZ) data consist of 847 zones expressing the spatial attributes of census information and land use, which the number of population and employment in zones are used to estimate initial travel demand by gravity model. Third, the transport network is obtained from OpenStreetMap (OSM), where only main roads are included in the simulation to save to computation time, as shown in Figure 2.

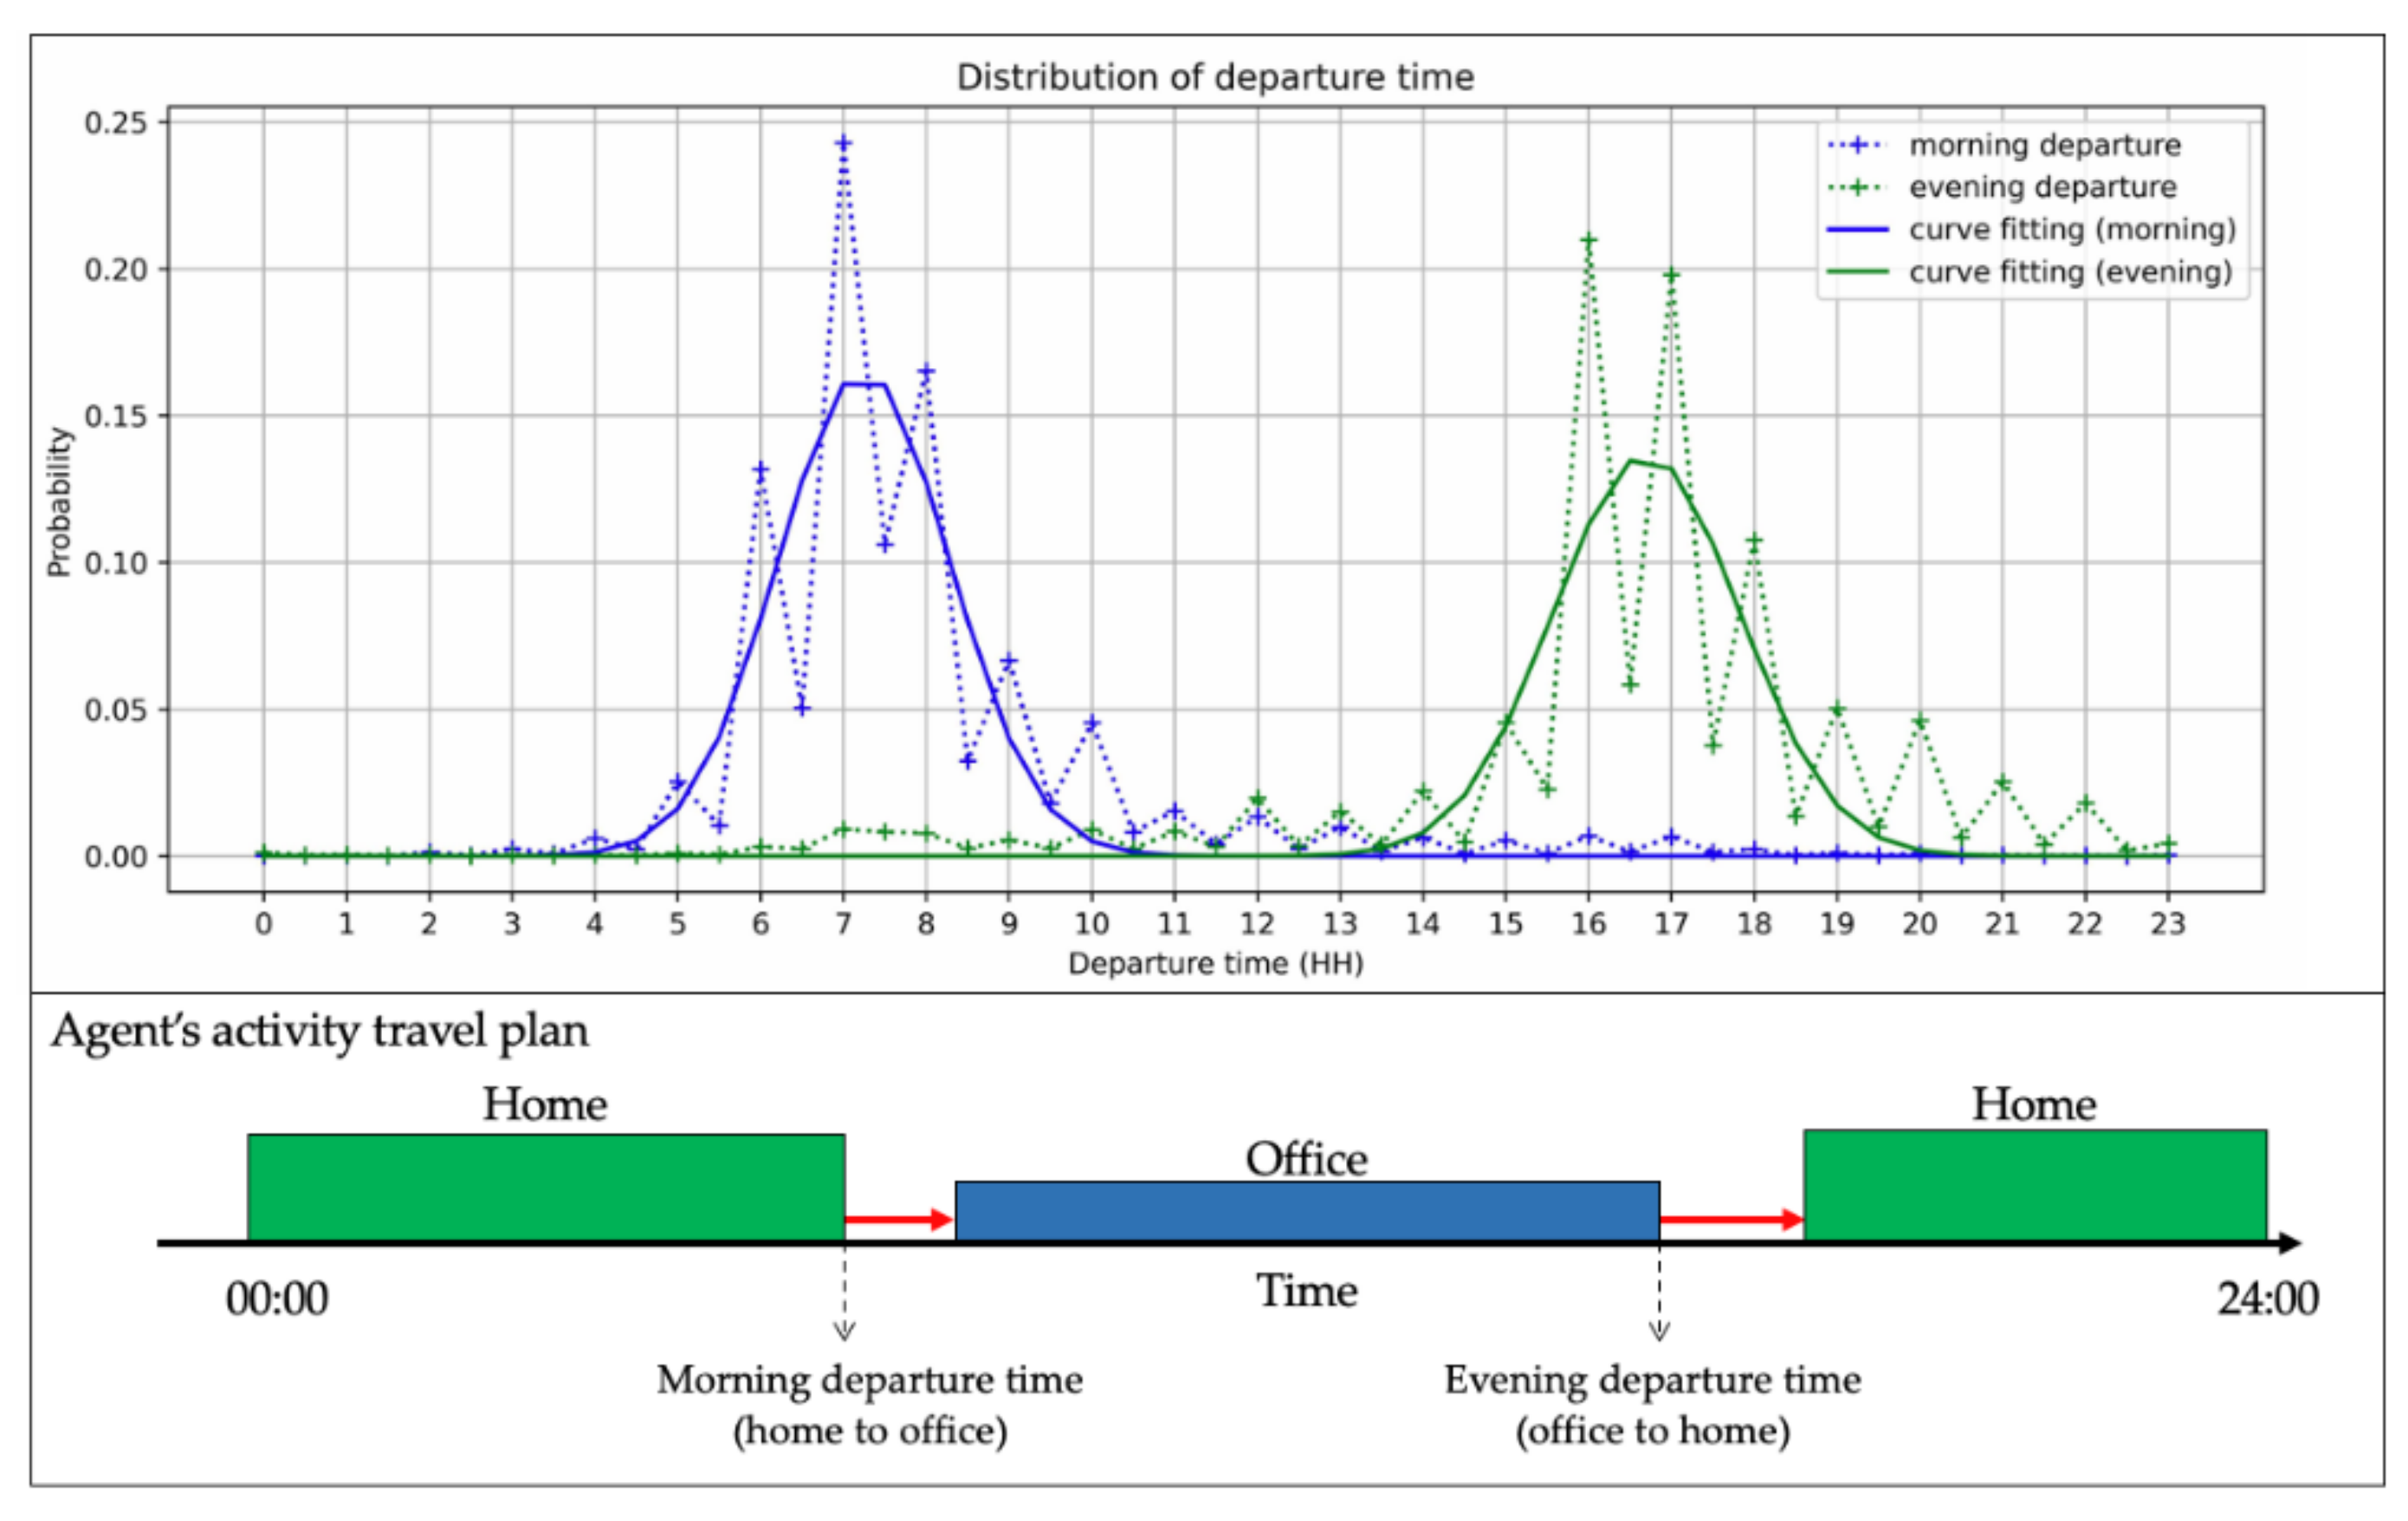
3.2.2. Travel Demand Analysis

In estimating the initial travel demand between zones, the number of population and employment are used for trip generation and trip attraction by means of gravity model. Figure 3a,b show the population density and employment density in each zone. It is obvious that population and employment concentrated in the inner part of the city. The parameters of the gravity model are estimated in reference to the average travel distance from person-trip data. Then, Fratar method is applied to adjust trip distribution among zones for consistency of trip generation and trip attraction. The desire line of travel demand is shown in Figure 3c. It is again obvious that most of the travels are coming in and out of the city center.

3.2.3. Activity-Travel Plan Creation

The agent’s home and office (workplace) locations are selected based on travel demand among zones. However, the schedule of trips in a day is also needed to specify for MATSim. Considering Figure 4, the graph shows the distribution of departure time, in which the dash lines and solid lines represent the person-trip statistics and the Gaussian curve fitting results. These Gaussian functions are applied to assign agent’s departure times for morning and evening trips by starting time of destination activity is assigned 1-h after departure time.

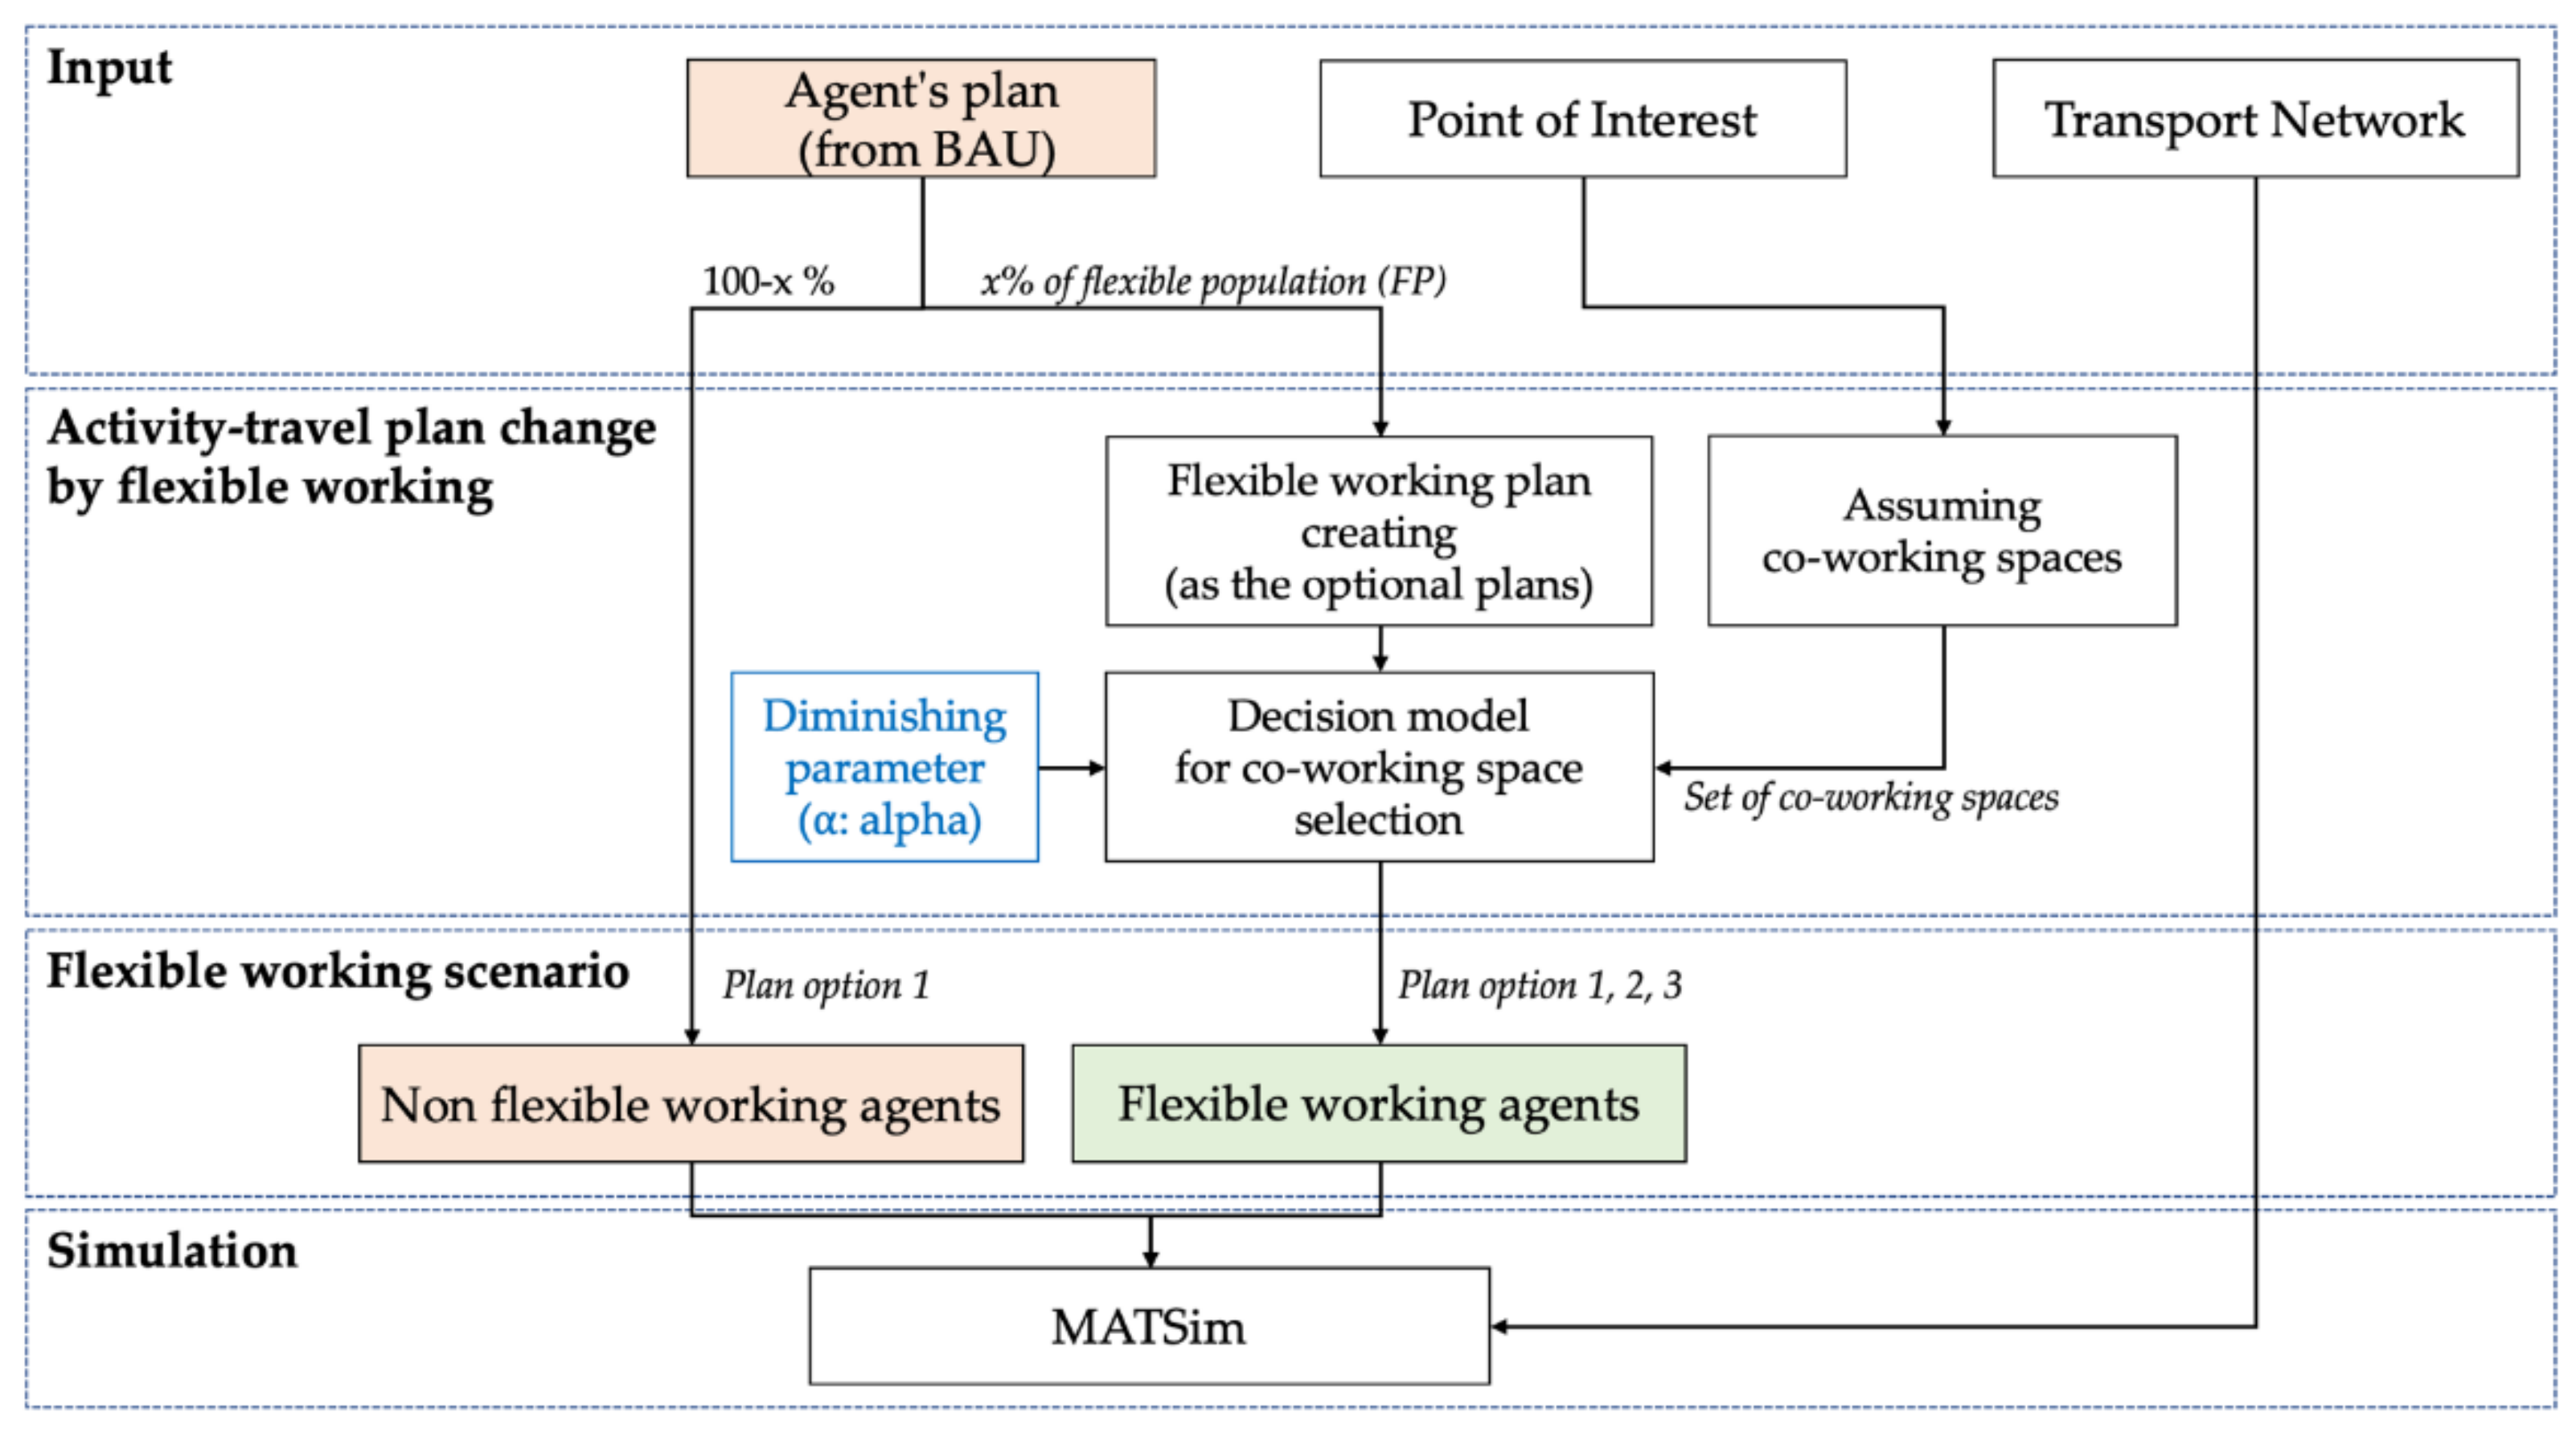
3.3. Flexible Working Scenario Simulation

The flexible working scenario simulates travel demand in that x% of the agents can perform flexible working, defined as the percentage of the flexible population (FP), which assumes that agents have choices to do remote work from a co-working space before or after going to work at the office. This scenario is created by modifying the agent’s activity-travel plan of the BAU scenario without changing the home and office locations and keeping the same work hours and home activity hours. The framework of the flexible working scenario is shown in Figure 5.

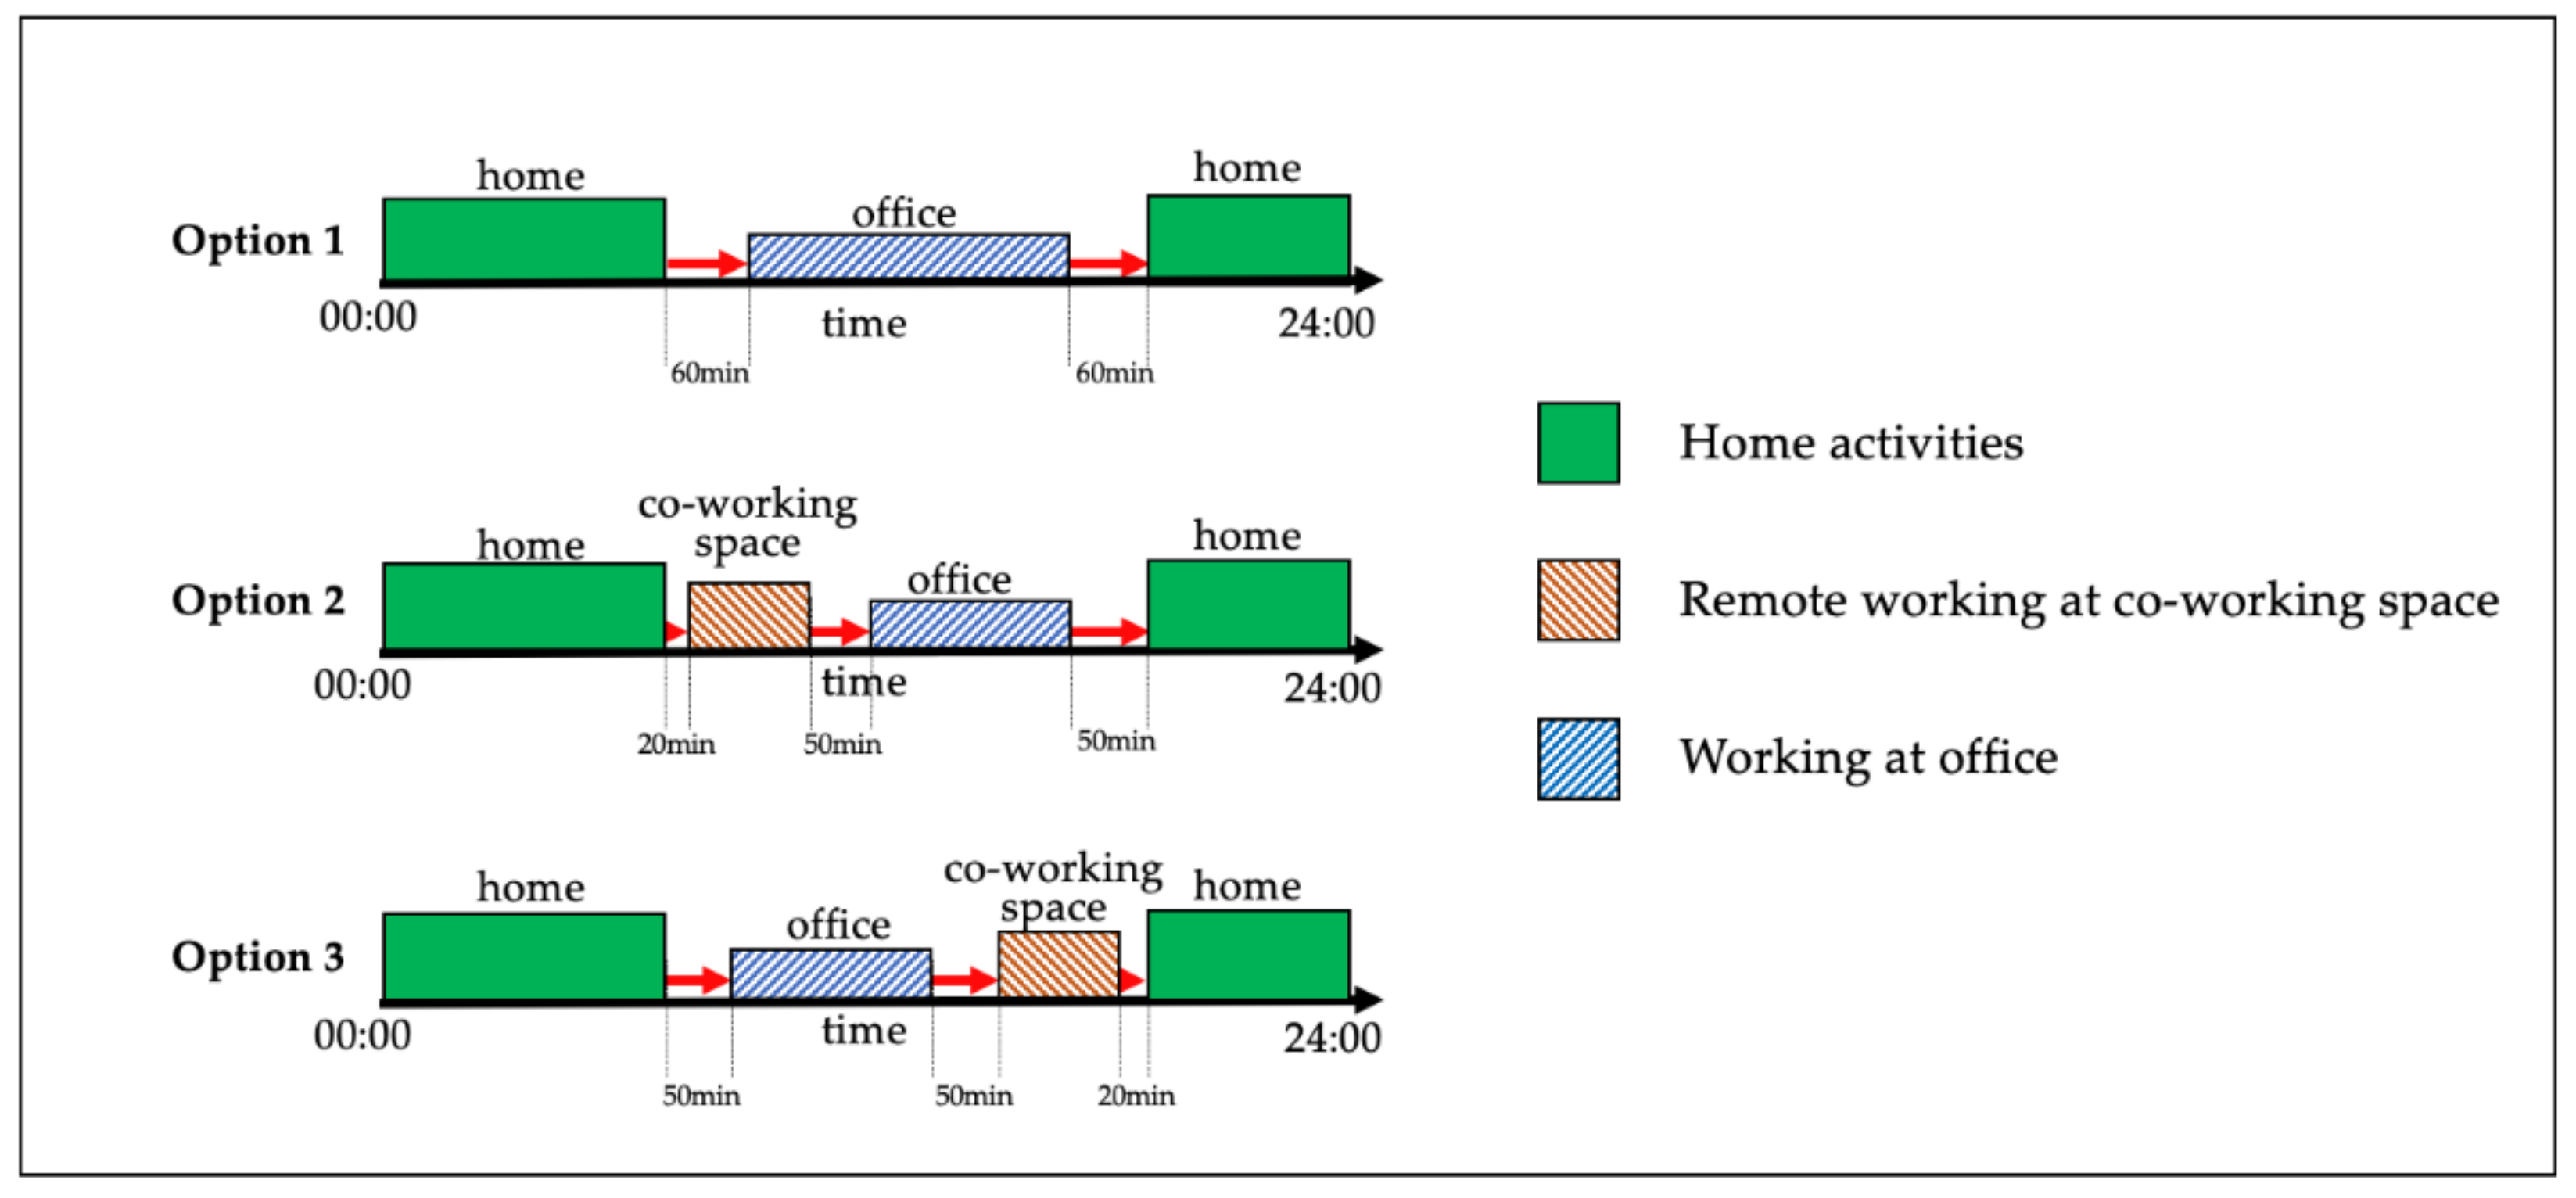
3.3.1. Creating Plans of Flexible Working Space and Time

Figure 6 shows the three options of activity-travel plans assigned for flexible populations, which are 9-to-5 working (option 1), flexible working in the morning (option 2), and flexible working in the afternoon (option 3). For options 2 and 3, the work hours (initially 100% in BAU) are split into two parts: 30% remote working at a co-working space and 70% working at the office.
The departure time of the first trip is the same as the original BAU plan. The time gap sparing for trips is set as follow:
  • A trip between home and office trips is set to 50 min (for option 2 and 3)
  • A trip between home and co-working space is set to 20 min
  • A trip between office and co-working space is set to 50 min
Therefore, the total sparing gap for daily travels and the total activities hours in a day for each agent is 2 h and 22 h for all plan options.

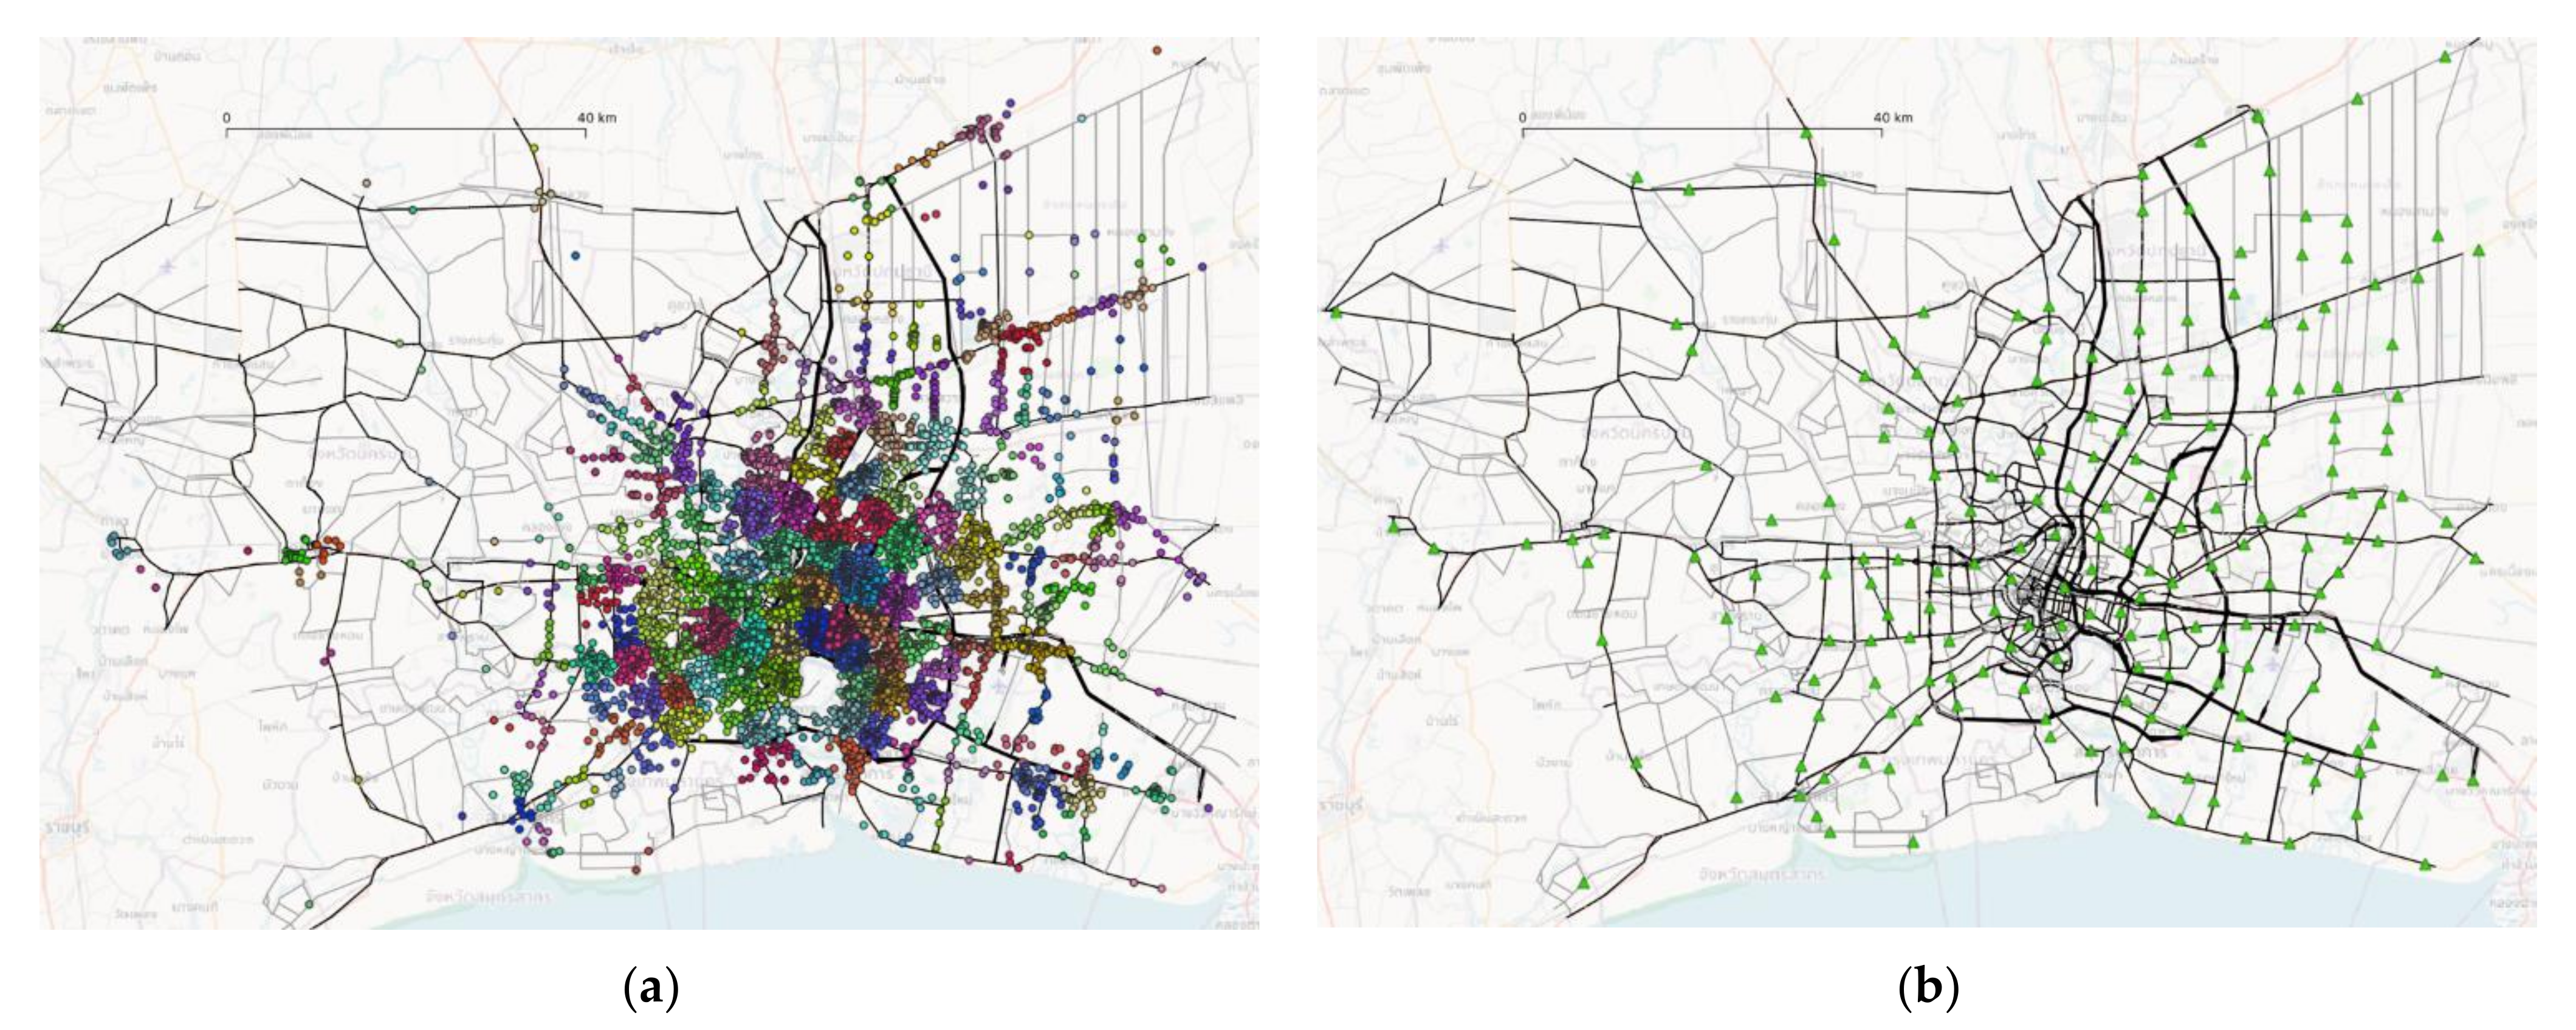
3.3.2. Assuming Co-Working Space Locations

Since currently, there is no widespread development of public co-working spaces in Bangkok and its vicinity, the locations of co-working spaces are assumed based on residential POI data by applying the k-mean clustering method to assign a co-working space locations (Figure 7a). In this study, three sets of co-working space locations with different number are generated—i.e., sets of 200, 500, and 1000 locations. For example, in the case of 200 potential co-working spaces, their locations are shown in Figure 7b.

3.3.3. Decision Model for Co-Working Space Selection

The probability of person or agent k selecting a co-working space j ( P c w s j k ) is determined by Equation (1), that is similar to a multinomial logit model, where the utility of co-working space j to person k, is attributed by the Euclidean distance between person k and co-working space j, d k , c w s j and α k is a parameter for the specific person k. In this paper, the parameter α k is experimented for different values of 0.5, 1.5, 3.0, and 5.0.
P c w s j k = 1 j e α k d k , c w s j · e α k d k , c w s j

3.4. Evaluating Effects of Space–Time Shifting

3.4.1. Traffic Congestion

Equation (2) shows the calculation model of congestion level of road network where ρ t represent the congestion level at the time t where v f f , i and v t ,   i denote the free-flow speed and the actual speed at the time t for road segment i; d i and D   represent the length of road segment i and total length road network.
ρ t = 1 D · i = 1 i = I d i · v f f , i v t , i   v f f , i

3.4.2. Quality of Life (QOL)

The QOL evaluation in this study focuses on travel-specific QOL (T-QOL), considering only route conditions. The QOL of person k ( Q O L k ) is the exponential decay function of total generalized cost of daily travels, where C k , T is a generalized cost for trip T and N T is the number of trips in a day, as expressed in Equation (3).
Q O L k = exp γ · T = 1 T = N T C k , T
C k , T = f = 1 f = N f W k , f · X T , f
where W k , f is the unit cost value of factor f in perception of person k and X T , f is the level of factor f of trip T. The diminishing constant γ is estimated by the assumption that QOL is 0.5 when travel time and travel distance are equal to the average of person-trip data [60,62].
Table 4 shows the considered QOL factors and its generalized cost parameters in this study. The generalized cost of travel time estimated by OTP in 2010 [63] is applied and the cost of travel distance is estimated based on the government assessment of expenses rate per kilometer, which is 4 baht per kilometer for car travels.

3.4.3. CO2 Emission

Equation (5) shows the estimation model of daily CO2 emission where E v t ,   i is the average emission rate per distance as a function of travel speed, in which this study employs the model developed by M. Barth and K. Boriboonsomsin (2008) [35]. N t , i represent the number of vehicle flow between time t-1 and t, and i denote the road segment index.
C O 2 = t = 1 t = 24 i = 1 i = I d i · N t , i · E v t ,     i  

4. Results

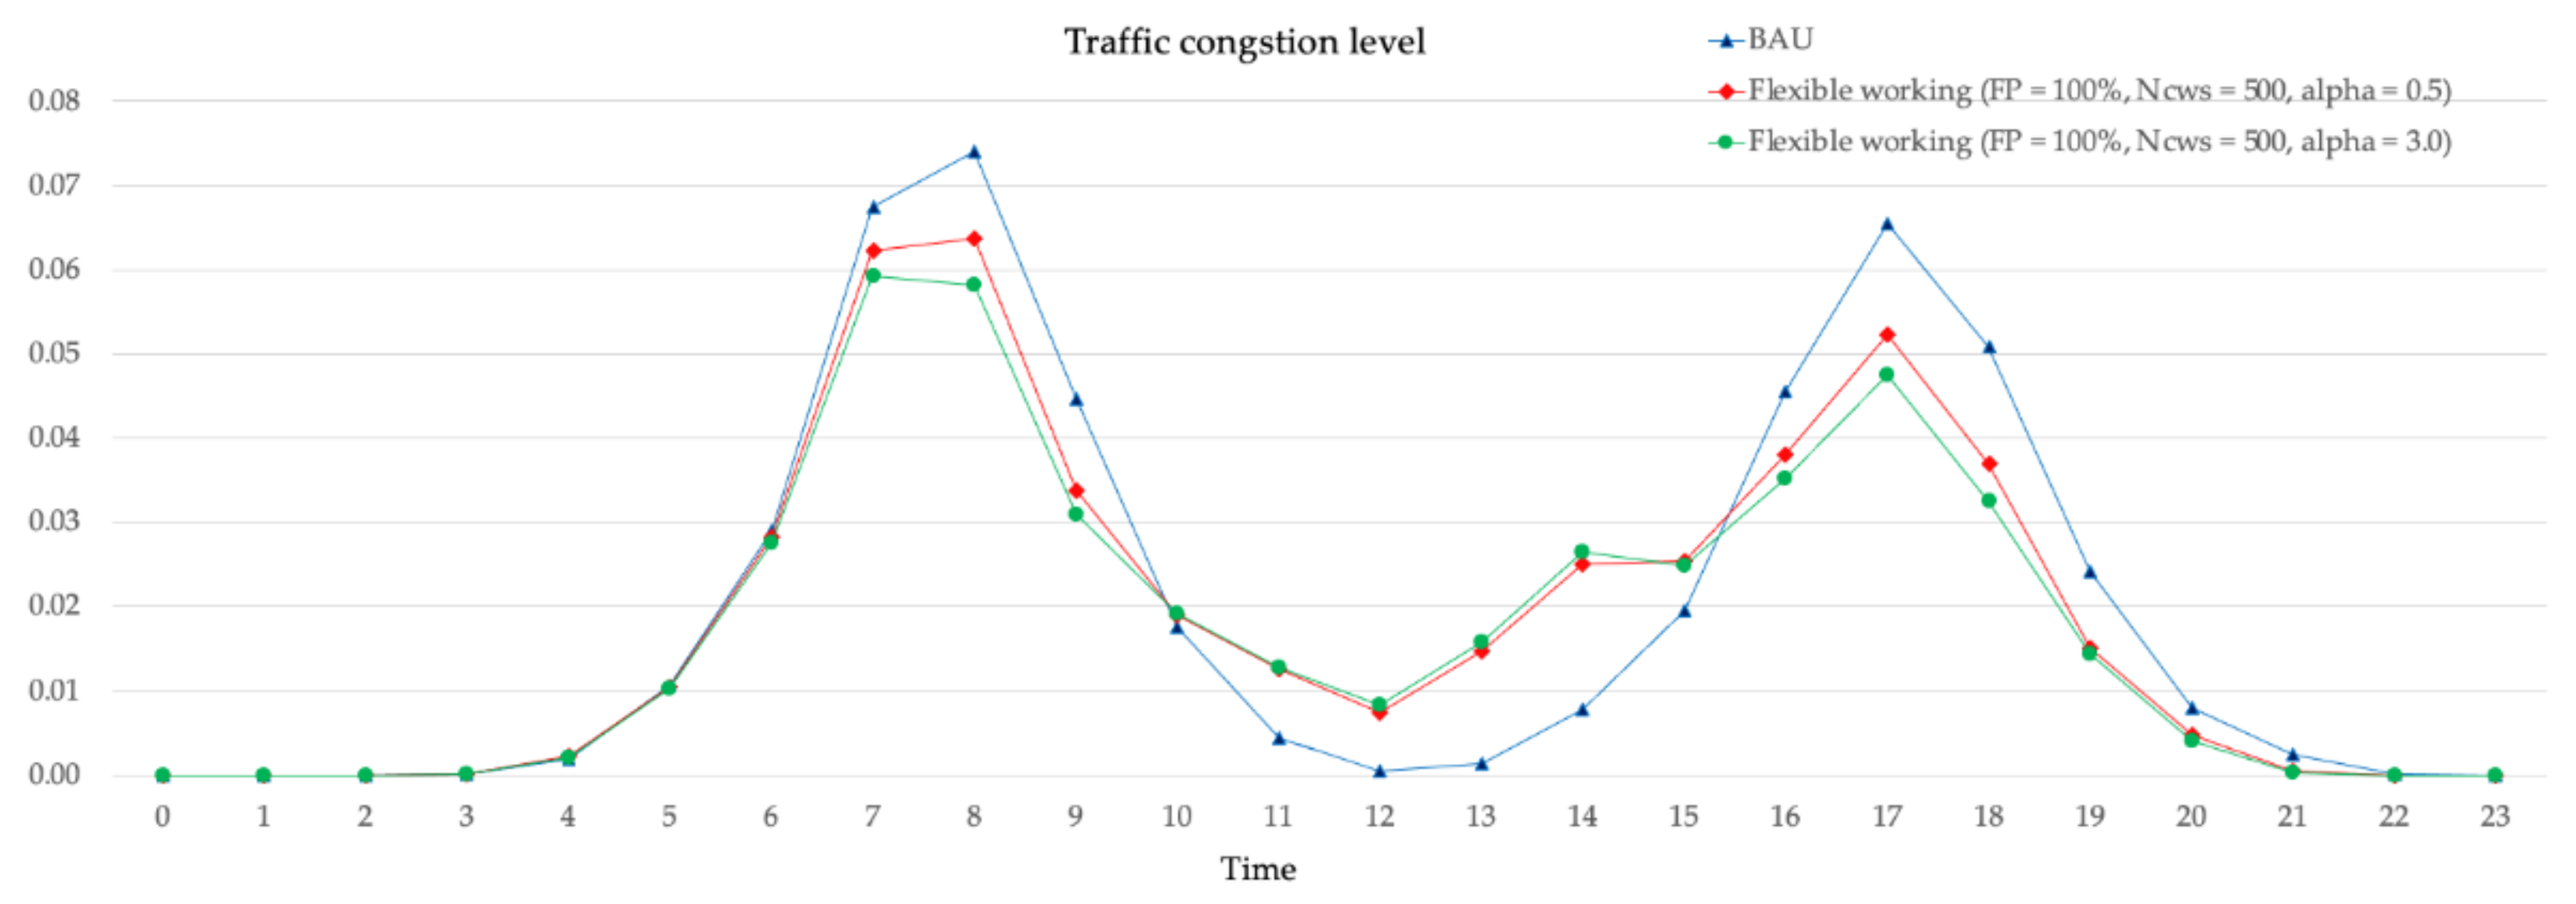
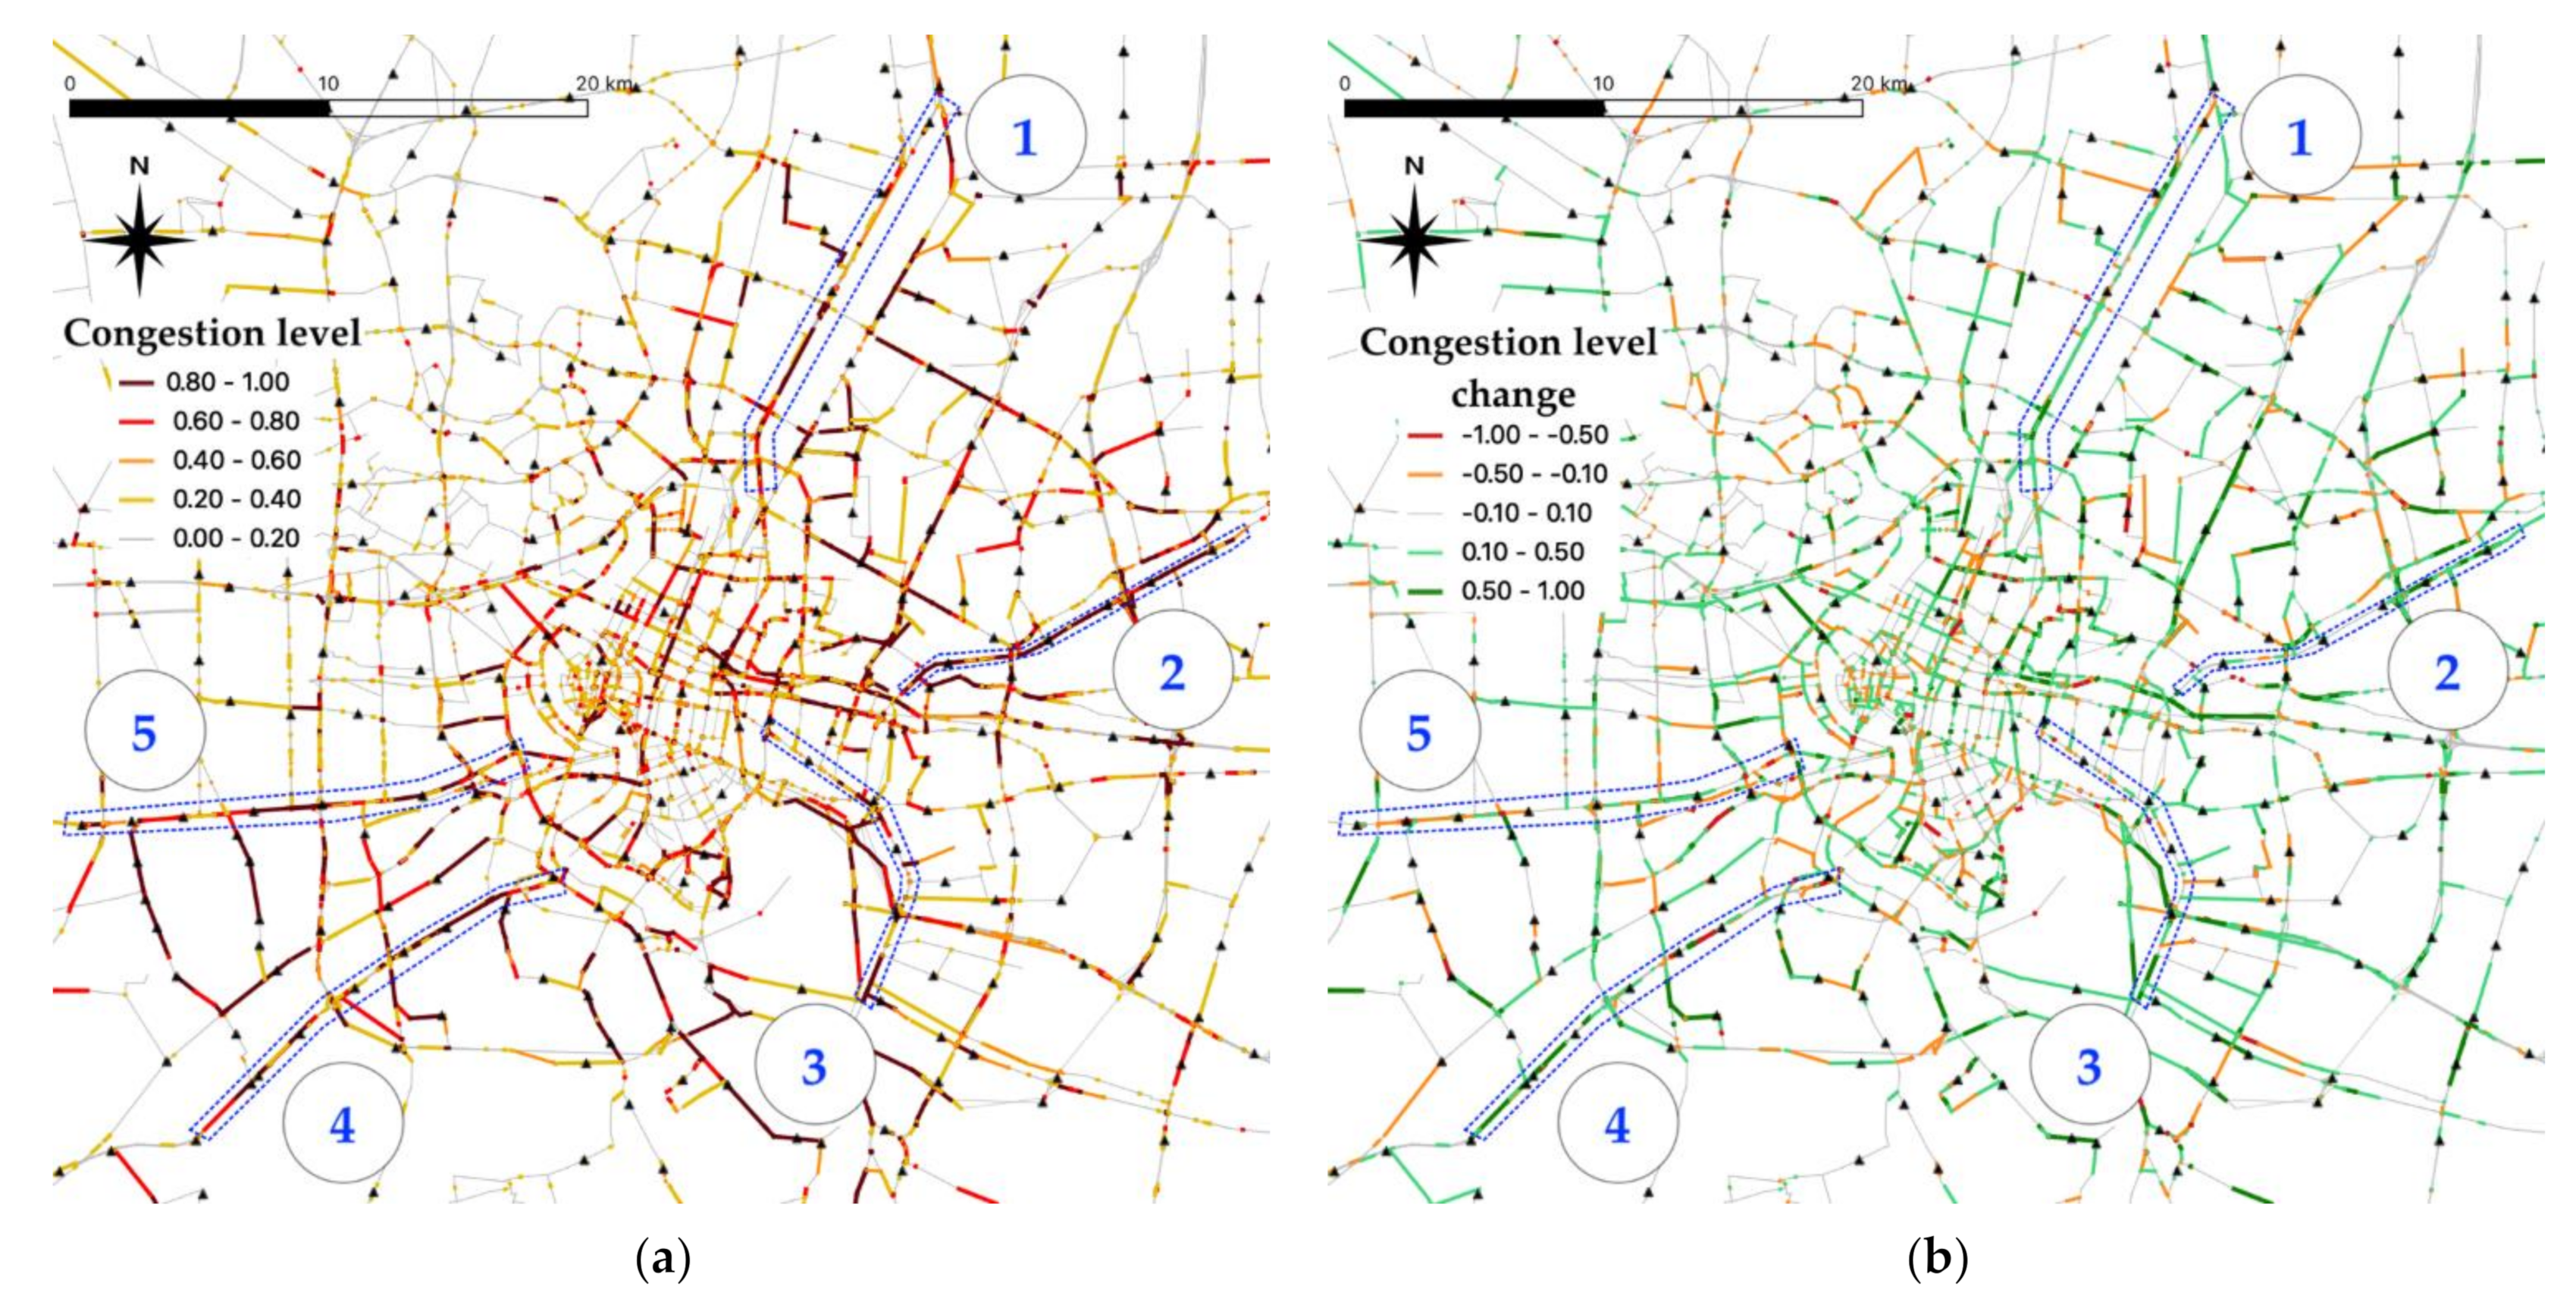
4.1. Space–Time Distribution of Traffic Congestion

Figure 8 shows the traffic congestion level by time of the day comparing BAU and two scenarios of flexible working represented by blue, red, and green lines. The flexible working scenarios are tested at 100% flexible population (FP) and 500 locations of co-working spaces. The diminishing parameter ( α ,alpha) is varied for 0.5 and 3.0 to examine the implications.
As a result of the simulation, both flexible working scenarios have lower peak traffic congestion during the morning and evening rush hours and slightly increase the congestion level in the late morning and early afternoon resulted from travel time shift of some population that perform activity-travel plan option 2 and 3. Also, the increasing alpha parameter results in reducing traffic congestion level.
Figure 9a shows the spatial distribution of morning peak congestion of Bangkok focusing on the city center. From this result, we can observe that main roads entering the city center have heavy traffic congestion during the morning peak-hour in the BAU scenario. In term of Figure 9b, the difference in traffic congestion level between the flexible working scenario and BAU scenario is illustrated. The green color represents traffic congestion reduction, and the red color represents traffic congestion increase. Considering the six examples of the main roads represented by numbers and bounded by blue dashed lines, The space–time shift by flexible working results in greater mobility on Vibhavadi Rangsit Road (No. 1) and Ramkhamhaeng Road (No. 2) obviously. Sukhumvit Road (No. 3), Rama II Road (No. 4), and Phet Kasem road (No. 5), are partly more congested.
The locations of co-working spaces are one of the factors influencing the traffic situation of the flexible working scenario. Considering Rama II Road (No. 4) and Phet Kasem road (No. 5), we can observe that the traffic congestion is worsen around the co-working space locations. Therefore, the allocation of the co-working spaces needs further comprehensive analysis to obtain maximum benefit.

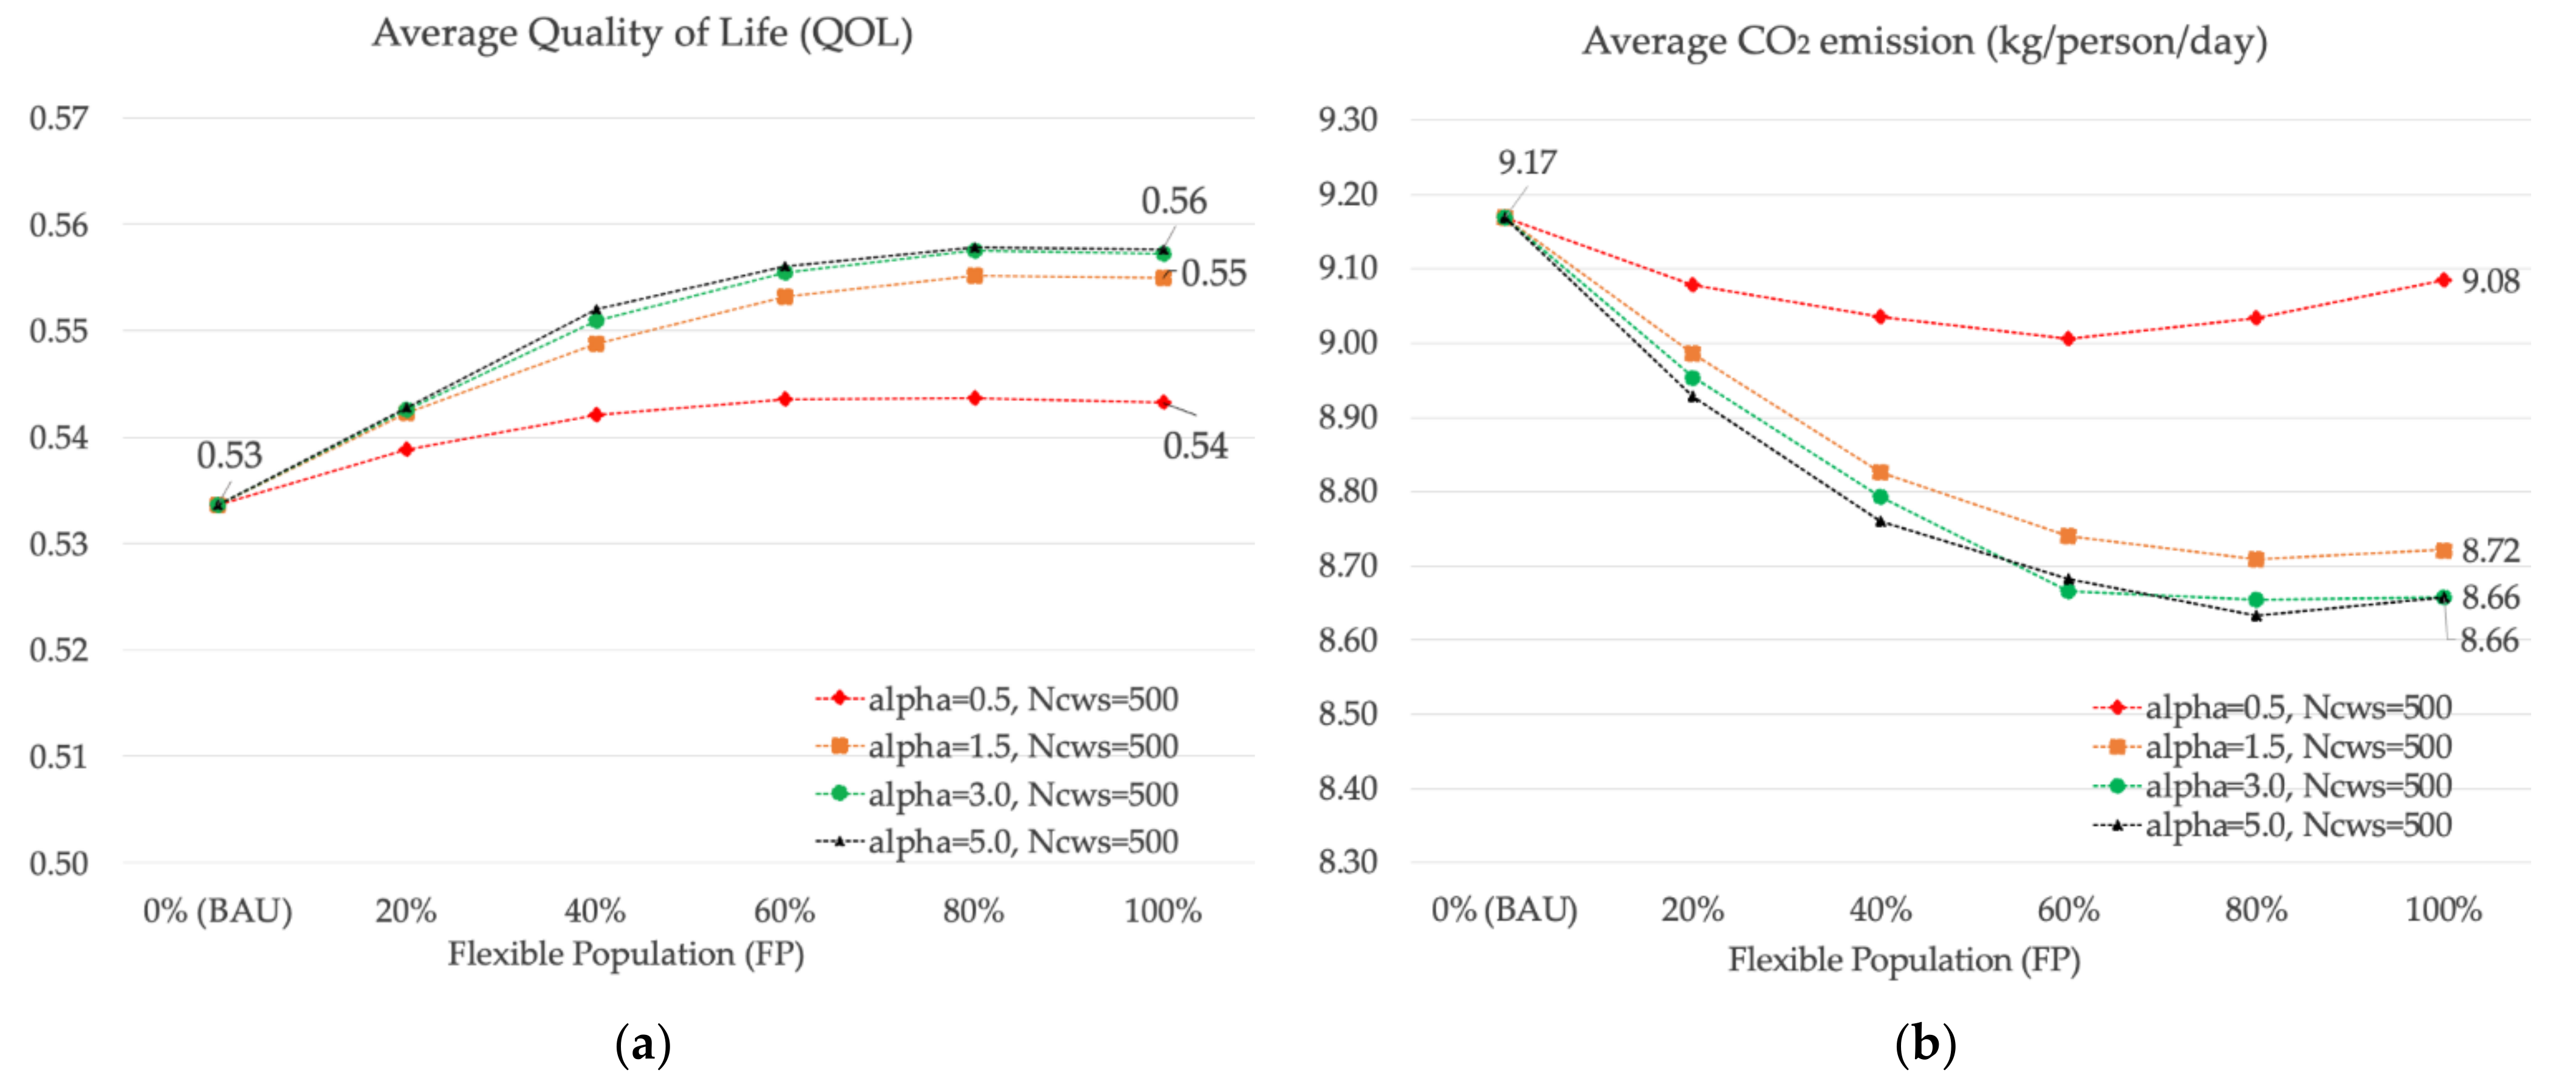
4.2. Effects of the Proportion of Space–Time Flexible Population

This section discusses the implication of the work-life shifting, from 9-to-5 working style to flexible working, on QOL and the CO2 emission by comparing different diminishing parameters ( α , alpha). Figure 10 reveals that the increase of flexible population can increase average QOL and reduce CO2 emission significantly.
It is found that the value of alpha parameter affects QOL and CO2 emission because it is the diminishing effect of travel distance in the decision model for co-working space selection. In the other words, the level of quality of life and CO2 emission are dependent on travel distance. The alpha parameter may be interpreted as the awareness level of the effect of travel distance on QOL and CO2 emission in a specific ratio. Therefore, it is considered as an awareness parameter in this study.

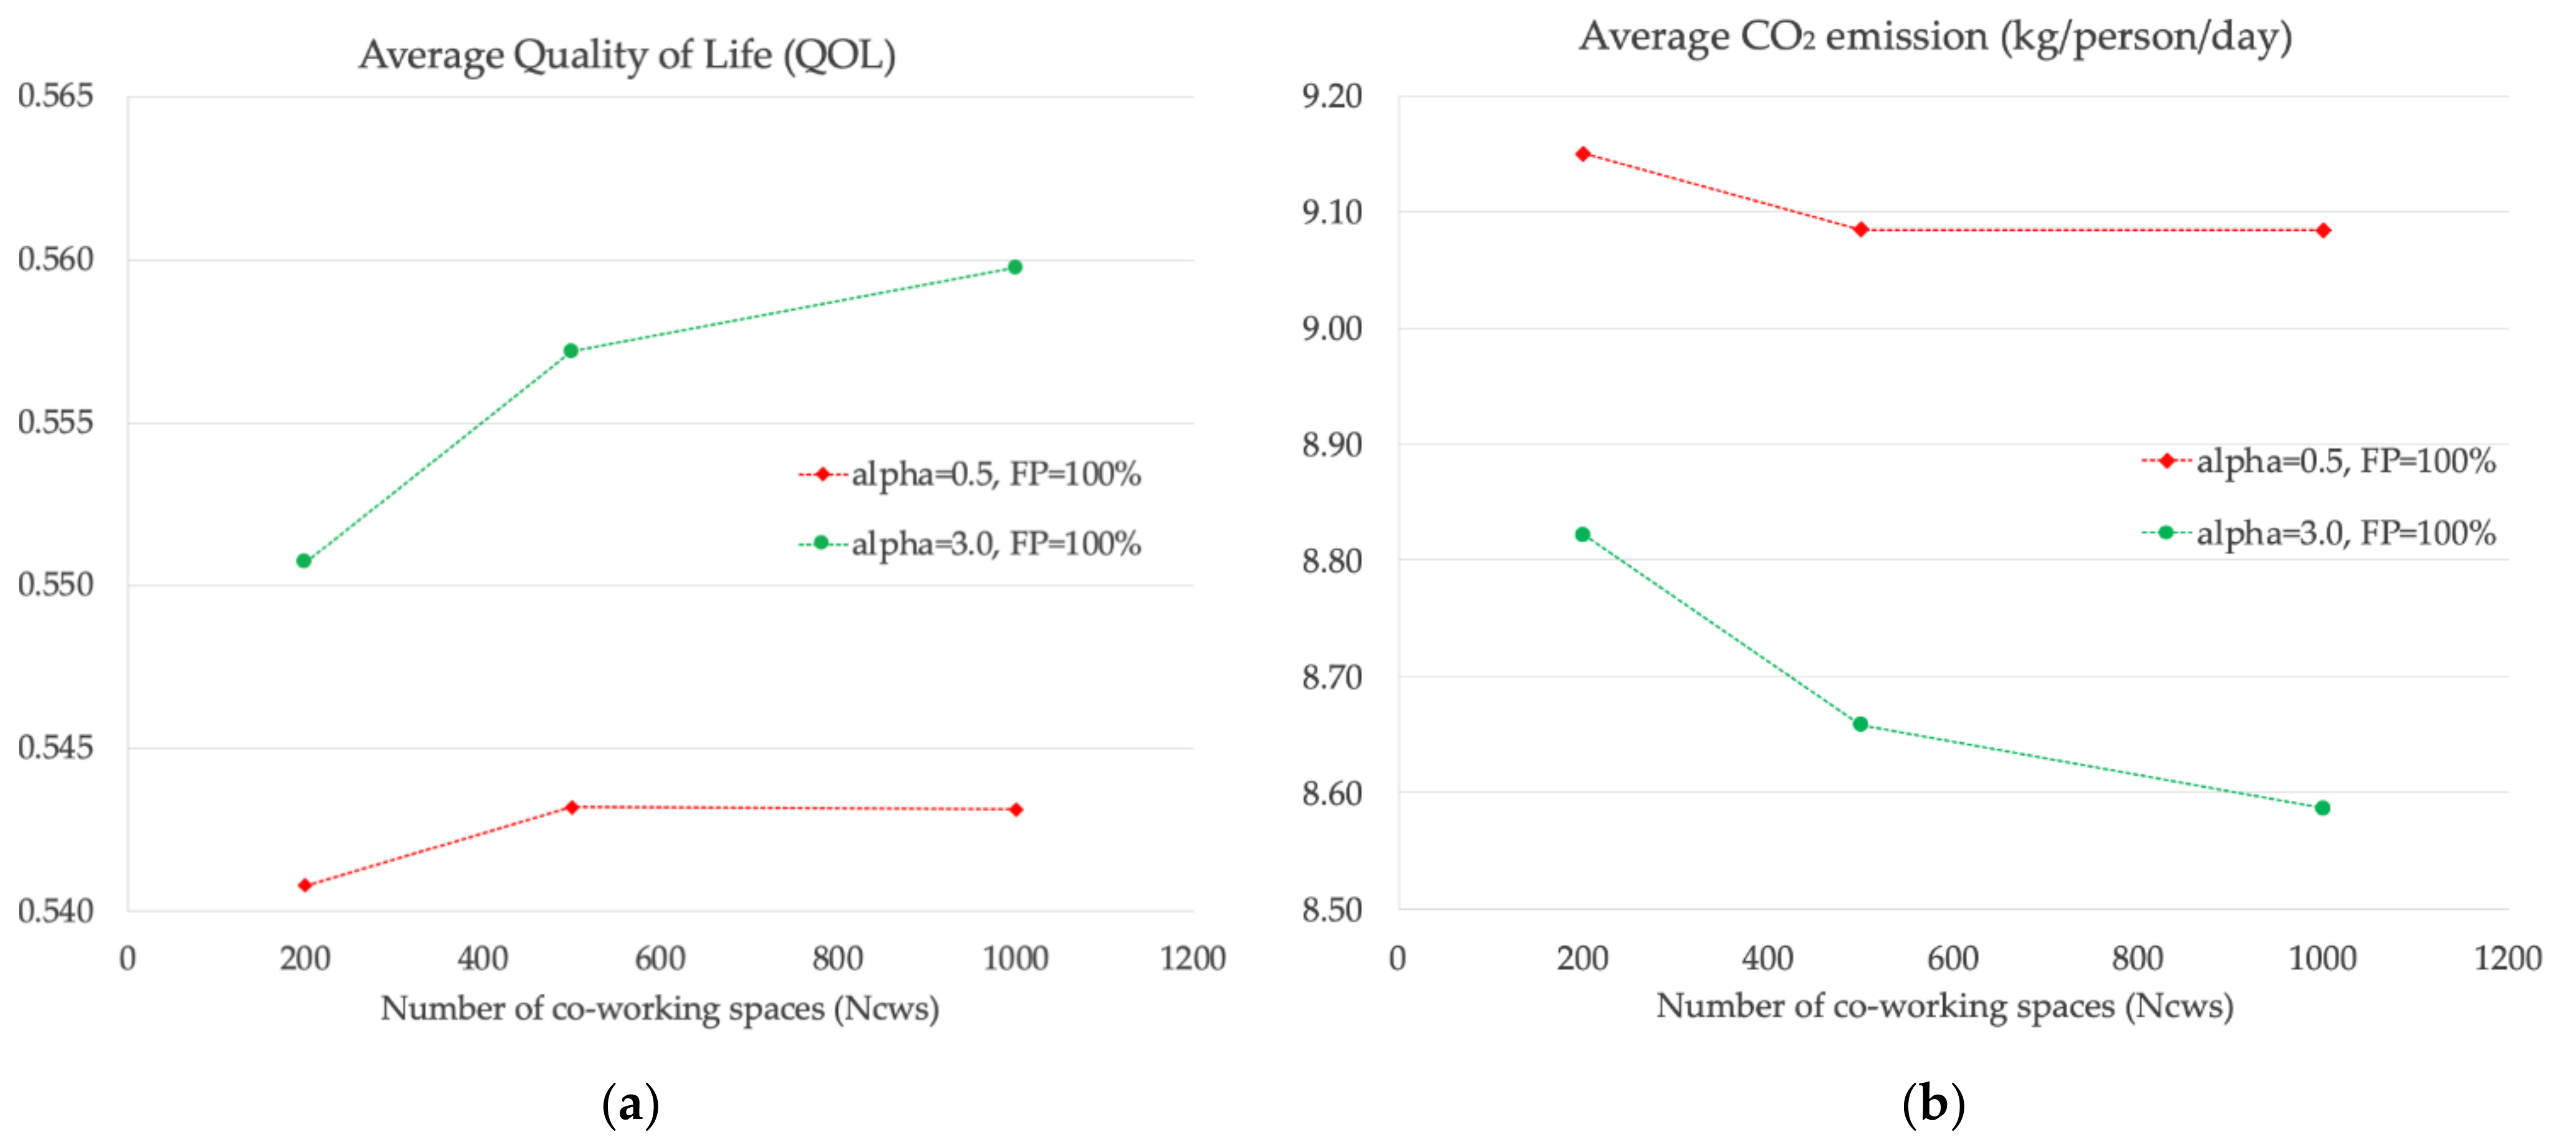
4.3. Effects of Increase in Co-Working Spaces Available

Figure 11 shows the result of a varying number of co-working spaces with a constant flexible population by comparing low awareness level case (alpha = 0.5) and high awareness level cases (alpha = 3.0). The growing number of co-working spaces results in the QOL increase and CO2 emission reduction. In terms of awareness level, it has a strong influence on the degree of QOL improvement and CO2 emission reduction.
Besides the co-working allocation issue mentioned previously, many co-working spaces with widespread distribution enhancing the ease of accessibility can lead to the lifestyle shift to flexible working by 200, 500, and 1000 locations of co-working space can induce the flexible population to perform activity-travel plan option 2 and 3 (Figure 7) up to 40%, 45%, and 46%, respectively (the case of alpha = 3.0).

5. Discussion

5.1. Can Space–Time Shifting of Activity-Travel Practically Solve the Peak Traffic Congestion?

Obviously, the simulation results show that flexible working can mitigate peak traffic congestion significantly, as shown in Figure 8. However, it is still limited under many assumptions creating a gap between reality and simulation. Therefore, the potential of flexible working in practice to solve traffic congestion is discussed in this section.
Flexible working, in practice, may mitigate traffic congestion more than what the simulation shows. In the simulation, only three activity sequences are defined, as shown in Figure 6. The result shows that increasing the number of activity sequences from one sequence (BAU scenario) to three sequences (flexible working scenario) can mitigate peak-hour congestion by equalizing travel demand throughout the day. Practically, there are more various activity–travel patterns that can be created than defined sequences in simulation. This implies that flexible working can cause a better distribution of travel demand in the time dimension.
However, more various activity-travel patterns may create more activities and travels in a day, causing a higher average travel distance of individual. Consequently, this situation may worsen the levels of QOL, CO2 emission, and also traffic congestion, which the degree of worsening depends on people’s awareness of QOL and CO2 emission. Therefore, applying ICT to stimulate people’s awareness by providing information and recommendations is an important issue.
The locations and amount of existing co-working spaces may not enough and have well distribution as the simulation. There is likely to be concentrated in the city center or a prosperous district. This may not reduce traffic congestion as expected because of the narrow distribution of activities in the spatial dimensions. Therefore, co-working space allocation is an important factor in distributing activity/working locations, avoiding concentration in the city center. For implementation, it is important to analyze the potential locations of remote workplaces or co-working spaces further to realize the implications on travel demand distribution in the spatial dimension. These measures would affect the spatial structure of whole urban activities and consequently traffic situations [64]. Our approach can examine the impacts not only on the specific locations or activities, but also on the metropolitan-wide transportation level of service and its temporal variations.

5.2. QOL-MaaS: The Extended MaaS Concept for Space–Time Shift of Activity-Travel

Reforming people’s daily activity-travel to achieve sustainable transportation needs to balance both people’s utility and the burden on the ecosystem [65], which presents in the aspect of the QOL and the CO2 emission in this study. Although applying flexible working results in a better quality of life, whether the level of awareness parameters is high nor low (as shown in Figure 10a), there is the possibility of negative consequences in the ecosystem. The flexible working with inefficient activity-travel planning can worsen the CO2 emission, which the level of awareness parameter can infer the efficiency of activity-travel planning. According to Figure 10b, CO2 emissions tend to increase in the situation of low awareness case (alpha is 0.5). Therefore, it is crucial that flexible working should be applied together with measures or strategies to prevent the worst case of awareness level and to achieve optimal benefits for people and society.
Basically, the MaaS concept aims to shift the transport modes from private to public. For countries with good public transport infrastructure, providing convenience for people such as trip information, integrated payment, and integrated transport services may potentially shift people to use public transport. However, the conventional MaaS concept focuses mainly on trip-level, which MaaS left people to plan their daily activities and travels as convenient. In the future, when people have more flexibility, the ecosystem may face the risk of CO2 emissions increasing from inefficient daily activity-travel planning. Therefore, extending MaaS to serve in the level of daily activity-travel, as the high awareness planning tool, will take a role in managing and balancing the benefit between people and ecosystems.
Of course, this QOL-MaaS approach should be incorporated with the enhancement of transportation infrastructure and services, as well as the spatial structure of travel activities. Statistically, the viability of public transport operation is shown to be higher as higher the population density is [66], then it would afford an opportunity to invest in the transportation systems. That would change the locational value and induce development, which would again change the transportation demand [67]. The potential of QOL-MaaS would be further enhanced in coordination with these traditional urban and transportation planning and policies.

6. Conclusions

This paper reveals that the space–time shifting of activities and travels can mitigate hyper-congestion in Bangkok, which MaaS concept should be extended to cover this space–time shifting strategy.
We propose the QOL-MaaS concept as the extended MaaS to induce space–time shift of activity and travel, supporting the new-normal of flexible working. This study examines the impact of a flexible working scenario in several cases on traffic congestion, quality of life, and CO2 emission by comparing it with the BAU scenario. The three factors of flexible working scenarios are tested, which are: (1) percentage of the flexible population, (2) awareness level of citizen, and (3) the number of prepared co-working spaces.
The analysis found that the increase of the flexible population can mitigate peak-time traffic congestion and enhance people’s quality of life. The increasing number of co-working spaces also results in a higher quality of life and lower CO2 emission. However, flexible working may induce more travel distance, worsening emissions if the population has a low awareness of social burden.
Therefore, to achieve sustainable transportation for the new-normal of flexible working, strategies or methods to convince or manage people to perform the daily life with a high awareness on the quality of life and CO2 emission should be developed. The QOL-MaaS concept is one of the strategies aim to reform people’s daily lives by recommending daily activity-travel plans and mobility services with high awareness of the quality of life and ecosystem.

Author Contributions

Conceptualization, Y.H.; Supervision, Y.H., H.T., and T.T.; Methodology, W.A., H.T., M.K., and V.V.; Validation, W.A.; Formal Analysis, W.A.; Data Curation, W.A., M.K., and V.V.; Writing—original draft preparation, W.A.; Writing—review and editing, W.A.; Funding acquisition, Y.H. and T.T. All authors have read and agreed to the published version of the manuscript.

Funding

This research was funded by Science and Technology Research Partnership for Sustainable Development (SATREPS), grant number JPMJSA1704 (co-leaders: Yoshitsugu Hayashi and Thanaruk Theeramunkong).

Acknowledgments

This research is a part of Smart Transport Strategy for Thailand 4.0 project supported by the Japan Science and Technology Agency (JST) and the Japan International Cooperation Agency (JICA).

Conflicts of Interest

The authors declare no conflict of interest.

References

  1. Hanaoka, S. Review of urban transport policy and its impact in Bangkok. In Proceedings of the Eastern Asia Society for Transportation Studies, Dalian, China, 24–27 September 2007; Volume 6. [Google Scholar] [CrossRef]
  2. Ito, K.; Nakamura, K.; Kato, H.; Hayashi, Y. Influence of Urban Railway Development Timing on Long-term Car Ownership Growth in Asian Developing Mega-cities. J. East. Asia Soc. Transp. Stud. 2013, 10, 1076–1085. [Google Scholar] [CrossRef]
  3. Wasuntarasook, V.; Hayashi, Y. A Historic Review on Consequences of Critical Events Leading Revolution in Mass Rapid Transit in Bangkok. In Proceedings of the Eastern Asia Society for Transportation Studies, Taipei, Taiwan, 9–12 September 2013; Volume 9, pp. 9–12. [Google Scholar]
  4. Jittrapirom, P.; Caiati, V.; Feneri, A.M.; Ebrahimigharehbaghi, S.; Alonso-González, M.J.; Narayan, J. Mobility as a service: A critical review of definitions, assessments of schemes, and key challenges. Urban Plan. 2017, 2, 13–25. [Google Scholar] [CrossRef] [Green Version]
  5. Wittstock, R.; Teuteberg, F. Sustainability Impacts of Mobility as a Service: A Scoping Study for Technology Assessment; Springer International Publishing: New York, NY, USA, 2019; ISBN 9783030122669. [Google Scholar]
  6. Sochor, J.; Arby, H.; Karlsson, I.C.M.A.; Sarasini, S. A topological approach to Mobility as a Service: A proposed tool for understanding requirements and effects, and for aiding the integration of societal goals. Res. Transp. Bus. Manag. 2018, 27, 3–14. [Google Scholar] [CrossRef]
  7. Arias-Molinares, D.; García-Palomares, J.C. The Ws of MaaS: Understanding mobility as a service from a literature review. IATSS Res. 2020. [Google Scholar] [CrossRef]
  8. Smith, G.; Hensher, D.A. Towards a framework for Mobility-as-a-Service policies. Transp. Policy 2020, 89, 54–65. [Google Scholar] [CrossRef] [Green Version]
  9. Matyas, M. Opportunities and barriers to multimodal cities: Lessons learned from in-depth interviews about attitudes towards mobility as a service. Eur. Transp. Res. Rev. 2020, 12. [Google Scholar] [CrossRef] [Green Version]
  10. Matyas, M.; Kamargianni, M. The potential of mobility as a service bundles as a mobility management tool. Transportation 2018. [Google Scholar] [CrossRef] [Green Version]
  11. Mulley, C.; Nelson, J.D.; Wright, S. Community transport meets mobility as a service: On the road to a new a flexible future. Res. Transp. Econ. 2018, 69, 583–591. [Google Scholar] [CrossRef] [Green Version]
  12. Narupiti, S. Exploring the possibility of MaaS service in Thailand, implications from the existing conditions and experts’ opinions on “Who should be the MaaS provider in Bangkok?”. IATSS Res. 2019, 43, 226–234. [Google Scholar] [CrossRef]
  13. LeBLANC, S. Studies are Increasingly Clear: Uber, Lyft Congest Cities. Available online: https://apnews.com/e47ebfaa1b184130984e2f3501bd125d (accessed on 7 August 2020).
  14. Sukato, A. Mangmoom Card a Joint Card for Modern Life [in Thai]. Available online: https://library2.parliament.go.th/ebook/content-issue/2560/hi2560-082.pdf (accessed on 24 December 2020).
  15. Valenduc, G.; Vendramin, P. ICT, flexible working and quality of life. In Proceedings of the “Unity and Diversity: The Contribution of the Social Sciences and the Humanities to the European Research Area”, European Commission (EUR 20484), Brussels, Belgium, 29–30 October 2002; pp. 186–191. [Google Scholar]
  16. Dadashpoor, H.; Yousefi, Z. Centralization or decentralization? A review on the effects of information and communication technology on urban spatial structure. Cities 2018, 78, 194–205. [Google Scholar] [CrossRef]
  17. Messenger, J.C.; Gschwind, L. Three generations of Telework: New ICTs and the (R)evolution from Home Office to Virtual Office. New Technol. Work Employ. 2016, 31, 195–208. [Google Scholar] [CrossRef]
  18. Rasel, F. Combining Information Technology and Decentralized Workplace Organization: SMEs versus Larger Firms. Int. J. Econ. Bus. 2016, 23, 199–241. [Google Scholar] [CrossRef]
  19. The National Advisory Council on Employment of Women Flexible Work Arrangements Literature Review. Available online: https://women.govt.nz/sites/public_files/flexible-working-literature-review%281%29.pdf (accessed on 10 November 2020).
  20. Zhang, J.; Hayashi, Y.; Frank, L.D. COVID-19 and transport: Findings from a world-wide expert survey. Transport Policy 2021, 103, 68–85. [Google Scholar] [CrossRef] [PubMed]
  21. Tantrakarnapa, K.; Bhopdhornangkul, B.; Nakhaapakorn, K. Influencing factors of COVID-19 spreading: A case study of Thailand. J. Public Health 2020, 19. [Google Scholar] [CrossRef]
  22. Chayomchai, A.; Phonsiri, W.; Junjit, A.; Boongapim, R.; Suwannapusit, U. Factors affecting acceptance and use of online technology in Thai people during COVID-19 quarantine time. Manag. Sci. Lett. 2020, 10, 3009–3016. [Google Scholar] [CrossRef]
  23. International Health Policy Development Agency of Thailand a Survey on Implementing the Measure “Stay Home to Stop the Infection for the Nation”. Available online: https://thaifightcovid19.com/ (accessed on 28 January 2021).
  24. UNESCO Bangkok Education Minister Nataphol Teepsuwan on COVID-19 strategy in Thailand. Available online: https://bangkok.unesco.org/content/education-minister-nataphol-teepsuwan-covid-19-strategy-thailand (accessed on 17 August 2020).
  25. Shimamoto, H.; Higuchi, T.; Uno, N.; Shiomi, Y. A trip-chain-based combined mode and route-choice network equilibrium model. Transp. B 2017, 5, 312–329. [Google Scholar] [CrossRef]
  26. Liao, F.; Rasouli, S.; Timmermans, H. Incorporating activity-travel time uncertainty and stochastic space-time prisms in multistate supernetworks for activity-travel scheduling. Int. J. Geogr. Inf. Sci. 2014, 28, 928–945. [Google Scholar] [CrossRef]
  27. Liao, F.; Arentze, T.; Timmermans, H. Incorporating space-time constraints and activity-travel time profiles in a multi-state supernetwork approach to individual activity-travel scheduling. Transp. Res. Part B Methodol. 2013, 55, 41–58. [Google Scholar] [CrossRef]
  28. Liao, F. Modeling duration choice in space-time multi-state supernetworks for individual activity-travel scheduling. Transp. Res. Part C Emerg. Technol. 2016, 69, 16–35. [Google Scholar] [CrossRef]
  29. Liu, P.; Liao, F.; Huang, H.J.; Timmermans, H. Dynamic activity-travel assignment in multi-state supernetworks. Transp. Res. Part B Methodol. 2015, 81, 656–671. [Google Scholar] [CrossRef] [Green Version]
  30. Fu, X.; Lam, W.H.K. Modelling joint activity-travel pattern scheduling problem in multi-modal transit networks. Transportation 2018, 45, 23–49. [Google Scholar] [CrossRef]
  31. Kim, J. Estimating the social cost of congestion using the bottleneck model. Econ. Transp. 2019, 19, 100119. [Google Scholar] [CrossRef]
  32. Wardman, M.; Chintakayala, V.P.K.; de Jong, G. Values of travel time in Europe: Review and meta-analysis. Transp. Res. Part A Policy Pract. 2016, 94, 93–111. [Google Scholar] [CrossRef]
  33. Li, S.; Yang, J. The Marginal Cost of Traffic Congestion and Road Pricing: Evidence from a Natural Experiment in Beijing. SSRN Electron. J. 2017, 12, 418–453. [Google Scholar] [CrossRef]
  34. Cheewaphongphan, P.; Junpen, A.; Garivait, S.; Chatani, S. Emission Inventory of On-Road Transport in Bangkok Metropolitan Region (BMR) Development during 2007 to 2015 Using the GAINS Model. Atmosphere 2017, 8, 167. [Google Scholar] [CrossRef] [Green Version]
  35. Barth, M.; Boriboonsomsin, K. Real-world carbon dioxide impacts of traffic congestion. Transp. Res. Rec. 2008, 163–171. [Google Scholar] [CrossRef] [Green Version]
  36. Van den Bergh, J.C.J.M.; Botzen, W.J.W. Monetary valuation of the social cost of CO2 emissions: A critical survey. Ecol. Econ. 2015, 114, 33–46. [Google Scholar] [CrossRef]
  37. Du, Y.; Li, T. Assessment of health-based economic costs linked to fine particulate (PM2.5) pollution: A case study of haze during January 2013 in Beijing, China. Air Qual. Atmos. Health 2016, 9, 439–445. [Google Scholar] [CrossRef]
  38. Chu, C.P.; Tsai, J.F. Road pricing models with maintenance cost. Transportation 2004, 31, 457–477. [Google Scholar] [CrossRef]
  39. Kim, H.M.; Cocks, M. The role of Quality of Place factors in expatriate international relocation decisions: A case study of Suzhou, a globally-focused Chinese city. Geoforum 2017, 81, 1–10. [Google Scholar] [CrossRef]
  40. Nakamura, K.; Morita, H.; Vichiensan, V.; Togawa, T.; Hayashi, Y. Comparative Analysis of QOL in Station Areas between Cities at Different Development Stages, Bangkok and Nagoya. In Proceedings of the Transportation Research Procedia. Transp. Res. Procedia 2017, 25, 3188–3202. [Google Scholar] [CrossRef]
  41. Berežný, R.; Konečný, V. The Impact of the Quality of Transport Services on Passenger Demand in the Suburban Bus Transport. Procedia Eng. 2017, 192, 40–45. [Google Scholar] [CrossRef]
  42. Nakamura, K.; Gu, F.; Wasuntarasook, V.; Hayashi, Y. Failure of Transit-Oriented Development in Bangkok from a Quality of Life Perspective. Asian Transp. Stud. 2016, 4, 194–209. [Google Scholar] [CrossRef]
  43. Gu, F.; Hayashi, Y.; Shi, F.; Zhang, H.; Kato, H. Measuring and mapping the spatial distribution of the quality of life in a city: A case study in Nanjing. Int. J. Urban Sci. 2016, 20, 107–128. [Google Scholar] [CrossRef]
  44. Von Wirth, T.; Grêt-Regamey, A.; Stauffacher, M. Mediating Effects Between Objective and Subjective Indicators of Urban Quality of Life: Testing Specific Models for Safety and Access. Soc. Indic. Res. 2015, 122, 189–210. [Google Scholar] [CrossRef]
  45. Nakamura, K.; Wasuntarasook, V.; Gu, F.; Vichiensan, V.; Kii, M.; Hayashi, Y. Evaluation for Low-carbon Land-use Transport Development with QOL Indexes in Asian Developing Megacities: A Case Study of Bangkok. J. East Asia Soc. Transp. Stud. 2015, 11, 1047–1063. [Google Scholar] [CrossRef]
  46. Lotfi, S.; Koohsari, M.J. Analyzing accessibility dimension of urban quality of life: Where urban designers face duality between subjective and objective reading of place. Soc. Indic. Res. 2009, 94, 417–435. [Google Scholar] [CrossRef]
  47. Doi, K.; Kii, M.; Nakanishi, H. An Integrated Evaluation Method of Accessibility, Quality of Life, and Social Interaction. Environ. Plan. B Plan. Des. 2008, 35, 1098–1116. [Google Scholar] [CrossRef]
  48. Kachi, N.; Kato, H.; Hayashi, Y. A Computable Model for Optimizing Residential Relocation Based on Quality of Life and Social Cost in Built-Up Areas. J. East Asia Soc. Transp. Stud. 2007, 6, 1460–1474. [Google Scholar]
  49. Talen, E. Neighborhoods as service providers: A methodology for evaluating pedestrian access. Environ. Plan. B Plan. Des. 2003, 30, 181–200. [Google Scholar] [CrossRef]
  50. Lever, J.P. The development of an instrument to measure quality of life in Mexico City. Soc. Indic. Res. 2000, 50, 187–208. [Google Scholar] [CrossRef]
  51. Hayashi, Y. QOL Accessibility Method for Project Evaluation. Expressways Automob. 2020, 63, 6–10. (In Japanese) [Google Scholar]
  52. Hayashi, Y.; Sugiyama, I. Dual strategies for the environmental and financial goals of sustainable cities: De-suburbanization and social capitalization. Built Environ. 2003, 29, 8–15. [Google Scholar] [CrossRef]
  53. Horni, A.; Nagel, K.; Axhausen, K.W. The Multi-Agent Transport. Simulation MATSim; Horni, A., Nagel, K., Eds.; Ubiquity Press: London, UK, 2016; ISBN 9781909188754. [Google Scholar]
  54. Llorca, C.; Silva, C.; Kuehnel, N.; Moreno, A.T.; Zhang, Q.; Kii, M.; Moeckel, R. Integration of land use and transport to reach sustainable development goals: Will radical scenarios actually get us there? Sustainability 2020, 12, 9795. [Google Scholar] [CrossRef]
  55. Çetİn, N. Large-Scale Parallel Graph-Based Simulations. Ph.D. Thesis, ETH Zurich, Zurich, Switzerland, 2005. [Google Scholar] [CrossRef]
  56. Charypar, D.; Nagel, K. Generating complete all-day activity plans with genetic algorithms. Transportation 2005, 32, 369–397. [Google Scholar] [CrossRef] [Green Version]
  57. Balmer, M.; Raney, B.; Nagel, K. Adjustments of Activity Timing and Duration in an Agent-Based Traffic Flow Simulation. In Progress in Activity-Based Analysis; Elsevier: Amsterdam, The Netherlands, 2005; pp. 91–114. [Google Scholar]
  58. Lefebvre, N.; Balmer, M. Fast shortest path computation in time-dependent traffic networks. Arb. Verk. Raumplan. 2007, 439. [Google Scholar] [CrossRef]
  59. Grether, D.; Chen, Y.; Rieser, M.; Nagel, K. Effects of a Simple Mode Choice Model in a Large-Scale Agent-Based Transport Simulation. In Complexity and Spatial Networks; Springer: Berlin/Heidelberg, Germany, 2009; pp. 167–186. [Google Scholar]
  60. Office of Transport and Traffic Policy and Planning Interview information from Home: Travel Time. Available online: http://mistran.otp.go.th/mis/Interview_12TravelTime.aspx (accessed on 10 May 2021).
  61. Population Statistics Group; Social Statistics Bureau. The 2010 Population and Housing Census; National Statistical Office: Bangkok, Thailand, 2011.
  62. Office of Transport and Traffic Policy and Planning Interview information from Home: Travel Distance. Available online: http://mistran.otp.go.th/mis/Interview_11TravelDistance.aspx (accessed on 10 May 2021).
  63. Office of Transport and Traffic Policy and Planning (Thailand). A Study to Adjust the Master Plan of the Rail Mass Transit System in Bangkok and its Vicinity (M-MAP); OTP: Bangkok, Thailand, 2010. [Google Scholar]
  64. Kii, M.; Akimoto, K.; Doi, K. Measuring the impact of urban policies on transportation energy saving using a land use-transport model. IATSS Res. 2014, 37, 98–109. [Google Scholar] [CrossRef] [Green Version]
  65. United Nations Framework Convention on Climate Change Balancing Use of Land for People and Ecosystems. Available online: https://unfccc.int/topics/education-youth/youth-engagement/global-youth-video-competition/global-youth-video-competition-2019/balancing-use-of-land-for-people-and-ecosystems (accessed on 20 April 2021).
  66. Kii, M. Reductions in CO2 Emissions from Passenger Cars under Demography and Technology Scenarios in Japan by 2050. Sustainability 2020, 12, 6919. [Google Scholar] [CrossRef]
  67. Wegener, M. Overview of Land Use Transport Models. In Handbook of Transport Geography and Spatial Systems; Emerald Group Publishing Limited: Bingley, UK, 2004; pp. 127–146. [Google Scholar]
Figure 1. Simulation framework of MATSim.
Sustainability 13 06547 g001
Figure 2. Road network of Bangkok Metropolitan Region (BMR).
Sustainability 13 06547 g002
Figure 3. Traffic analysis zone (TAZ) and the associated travel demand: (a) spatial distribution of population density; (b) spatial distribution of employment density; (c) the desire lines of travel demand between zones (≥250 trips).
Sustainability 13 06547 g003
Figure 4. Departure time distribution for agent’s activity-travel plan creation (BAU scenario).
Sustainability 13 06547 g004
Figure 5. The framework of the flexible working scenario simulation.
Sustainability 13 06547 g005
Figure 6. Daily activity-travel plan options for flexible population.
Sustainability 13 06547 g006
Figure 7. Assuming co-working space locations by k-mean clustering of residential POIs: (a) the example of POI clustering in the case of 200 clusters; (b) assumed co-working space locations (200 locations).
Sustainability 13 06547 g007
Figure 8. Impact of space–time shifting of agent’s activity-travel on distribution of traffic congestion in time dimension.
Sustainability 13 06547 g008
Figure 9. Impact of space–time shifting of citizen’s activity-travel on spatial distribution of morning peak traffic congestion (8 a.m.): (a) spatial distribution of traffic congestion level of BAU scenario; (b) the difference of traffic congestion level between BAU scenario and flexible working scenario (at 100% of FP, 3.0 of alpha, and 500 locations of co-working space), where the black triangle markers represent coworking space locations.
Sustainability 13 06547 g009
Figure 10. Effects of change in flexible population: (a) average quality of life (QOL) as a function of flexible population level; (b) average CO2 emission as a function of flexible population level.
Sustainability 13 06547 g010
Figure 11. Effects of change in the number of co-working spaces: (a) the effect on average quality of life (QOL); (b) the effect on average CO2 emission.
Sustainability 13 06547 g011
Table 1. Summary of mobility as a service characteristics and function.
MaaS ProjectOperating AreaService Functions
(1) Transport mode Availability(2) Information Services(3) Customization
Public TransportSharing Vehiclevehicle RentalOn-DemandReal-Time Info.NotificationsRoute PlanningServices OptionsRoute Search Factors
UbiGoGothenburg, Sweden Transport modes selection, Mobility budget, Subscription top-up,
WhimHelsinki,
Finland
Mobility budget, Subscription top-up,Travel time, green trip
SHIFTLas Vegas, USA Mobility budget, Subscription top-up
SmileVienna, Austria Transport mode filteringCost, Travel time, CO2 footprint
MoovelGermany Transport mode
Optymod LyonLyon, France transport mode, Personal capability (Driving, riding, walking)
Table 2. Related literature of urban quality of life.
AuthorsP-QOL FactorsT-QOL FactorsStudy Area
EconomicLivingAmenitySafetyEnvironmentRoute conditionTransport Mode Characteristics
H. M. Kim and Cocks (2017) [39] Suzhou
Nakamura et al. (2017) [40] Bangkok, Nagoya
Berežný and Konečný (2017) [41] Žilina
Nakamura et al. (2016) [42] Bangkok
Gu et al. (2016) [43] Nanjing
von Wirth et al. (2015) [44] Limmattal region
Nakamura et al. (2015) [45]Bangkok
Lotfi and Koohsari (2009) [46] Tehran City
Doi, Kii, and Nakanishi (2008) [47] Takamatsu
Kachi, Kato, and Hayashi (2007) [48] Iida City
Talen (2003) [49] Portland
Lever (2000) [50] Mexico City
Table 3. Parameter configuration for MATSim in this study.
ModulesParametersValuesUnit
MobsimFlow capacity factor0.125-
Storage capacity factor0.125-
ScoringLate arrival−18utility/h
Early departure0utility/h
Performing activity6utility/h
Waiting0utility/h
Traveling−6utility/h
Re-planningRe-route probability0.1-
Best score probability0.9-
Table 4. Quality of life factors and its generalized cost parameters.
CategoryFactorsValuesUnit
T-QOL
(Route impedance)
Travel time1.19Baht/minute
Travel distance4.00Baht/km
Publisher’s Note: MDPI stays neutral with regard to jurisdictional claims in published maps and institutional affiliations.

