Article

Reducing Food Waste in the Retail Supply Chains by Improving Efficiency of Logistics Operations

1
Faculty of Technical Sciences, University of Novi Sad, 21000 Novi Sad, Serbia
2
Faculty of Transport and Traffic Engineering, University of Belgrade, 11000 Belgrade, Serbia
*
Author to whom correspondence should be addressed.
Sustainability 2021, 13(12), 6511; https://doi.org/10.3390/su13126511
Submission received: 30 April 2021 / Revised: 31 May 2021 / Accepted: 2 June 2021 / Published: 8 June 2021
(This article belongs to the Section Sustainable Management)

Abstract

:
One of the basic problems of sustainability in modern society is the reduction of waste, particularly when it comes to food. Food waste has negative impacts on different dimensions of sustainability: social (hunger), economic (resource costs), and environmental (resource consumption and waste generation). This paper focuses on waste reduction through improving the inventory management system in the dairy distribution chain by the application of modern information and communication technologies (ICT). The approach is tested and verified in a case study by application of simulation modelling. Two inventory management models are created, and their impact on waste in the distribution part of the supply chain is examined. Model 1 represents the current dairy inventory management system in the supply of retail stores. Model 2 is based on a higher level of information connectivity between participants (RFID product labelling and the appropriate level of information technology), enabling automatic product ordering and changes in inventory management policy. The obtained results confirm that coordinated inventory management, supported by the application of modern ICT, can significantly contribute to the improvement of the sustainability of the food supply chain, and provide an exact quantification of the given contribution in the case of the dairy industry.

1. Introduction

In the 21st century, companies and society are facing major changes and numerous challenges. Perhaps the biggest challenges arise from the concept of sustainability, which is becoming an important component of present-day business models. The biggest opportunities for facing these challenges are provided by modern information and communication technologies (ICT).
The reduction of waste is one of the fundamental issues in a sustainable modern society, and when it comes to food, the implications are even broader. At the origin of economic, environmental, and social concerns, food losses and waste tend to become a symbol of the inefficiency, unfairness and unsustainability of food systems. Food losses and waste can occur in various phases of the food supply chain: (1) agricultural production (pre-harvest/production, harvest); (2) post-harvest handling and storage; (3) processing; (4) distribution; (5) retailing; and (6) consumption (adapted from [1]), and their reduction contributes to the establishment of sustainable food systems and the overall sustainability of a society. Adopting a more respectful approach to the environment is now an obligation, not a choice [2].
The last decade has seen a huge increase in the adoption of various information and communication technologies in all industrial sectors. ICT and digital platforms enable increased connectivity of digital technologies to enhance communication, services, and trade between people, organizations, and things [3]. There is no sector in any industry that has been left untouched by digitization [4]. Logistics and supply chain management is no exception. The functioning of a logistics system results in the flow of materials and related information and is based on the application of different logistics strategies and the use of a wide range of resources. Due to the adoption of ICT technologies, logistics and supply chains are able to monitor both the material and the information flow and collect and analyze a variety of data for efficient management [5].
This paper embraces the premise that synchronization of information and material flow is essential for reducing food waste and improving the sustainability of a perishable food supply chain [6], and that logistics is instrumental in the synchronization and management of these flows. Appropriately designed, developed, and applied logistics solutions can help reduce food waste. In confirmation of this claim, the paper [7] identified nine particular logistics solutions with strong potential in reducing food waste, of which seven of them reduce food waste in terms of passed expiration dates (collaborative forecasting, matchmaking lead time and shelf life by coordination mechanism of rules, low safety stock, make-to-order flows, coordination mechanism of rules in defining stock level, price reductions for products that have exceeded, and coordination mechanism of information sharing), and two reduce food waste in terms of damaged packaging (visualizing damaged packaging by information sharing and joint decision in packaging development). Based on these starting points, the paper explores the potential of Radio Frequency Identification (RFID) labelling of products as a technology that allows flows of goods and information to be connected at the lowest level, as a prerequisite for efficient information sharing and coordinated decision making. This research deals with one category of dairy products for the following reasons: (i) it is one of the main product groups associated with food waste in stores, estimated to be around 12–14 kg per capita per year [8] or with share of around 6% of total retail food waste, after vegetables (around 27%), bread (around 23%), meat and fish (around 19%), and fruits (around 17%) [9]; (ii) dairy products require about 3500 g CO2-equivalents per kilogram for their production, processing, packaging, storage, transport, and trading [10]; (iii) they have a clearly defined shelf life and are generally discarded when their best before date has expired and, finally; and (iv) they are sold in a package (which makes them suitable for RFID tagging). The focus of the research is on the quantification of inventory performance (the amount of waste, average inventory, turnover ratio, and turnover time) in the downstream part of the supply chain (from the manufacturer to the retailer), for two inventory management models. The first model examines the existing replenishment policy and the second is a modified and enhanced replenishment policy that uses RFID technology. To determine stock performance, due to uncertainty in product demand, simulation modelling was performed.
This research contributes to the literature in two ways. Firstly, it confirms the positive impact of modern technological trends on inventory management, supported by concrete values in a real case study. This is performed by combining the relevant literature on logistics and supply chain management along with ICT as enabling and disruptive technologies with real problems in dairy distribution in the Western Balkans. Secondly, it enables the generalization and extrapolation of the results to the other countries in the region. To our knowledge, no similar research has been conducted in this region, and due to similarities in customer behavior and the principle with which the stocks are managed, we believe that the obtained results can be generalized to other nearby countries. Besides, solving the identified research gaps, our results also have a practical value for supply chain managers, since identified amounts of dairy product waste can be accepted as a point of reference for the region and can help managers in deciding on inventory management policy.
This paper is organized as follows: Section 2 gives a brief review of the literature on the sustainability of food systems and the role of logistics, the impact of RFID on logistics processes, and the simulation modelling of logistics processes. Section 3 defines the problem, proposes a solution procedure, and explains the structure of the developed simulation models. The results are presented and discussed in Section 4. Finally, research limitations, potential future research, and concluding remarks are given in Section 5.

2. Literature Survey

Due to the complexity of this research, which involves different research topics, the literature review comprehends: (1) food waste reduction in the context of sustainable supply chain management; (2) RFID technology in logistics and supply chains; and (3) simulation modelling of logistics processes.

2.1. Food Waste Reduction in the Context of Sustainable Supply Chain Management

Logistics ensures availability of products on the market connecting production processes with consumption processes. Logistics management activities typically include inbound and outbound transportation management, fleet management, warehousing, materials handling, order fulfillment, logistics network design, inventory management, supply/demand planning, and management of third-party logistics services providers. Logistics management is part of supply chain management (SCM) that plans, implements, and controls the efficient, effective forwarding and reverse flow and storage of goods, services, and related information between the point of origin and the point of consumption in order to meet customers’ requirements [11]. SCM is understood as the organization and coordination of a set of distinct functions performed intra and inter-firms that constitute the supply chain, in order to create value by the supply of products and services to the market [12]. In this paper, supply chain activities are understood as all activities of general vertical coordination among supply chain partners, without a focus on the hands-on execution of logistics task [13].
The concept of sustainability with its three dimensions (economic, environmental, and social) is increasingly becoming a strategic business initiative in companies [14]. In the past few decades, logistics management and supply chain management have actively considered sustainable development [15]. Its application has been extended from the original economic performance to cover the environmental impact and community quality of life [16]. However, an SC is only sustainable when it achieves realistic business performance [17] and the economic dimension is the first consideration in most sustainable SCM-related decisions [18]. The concept of a sustainable supply chain currently covers a wide range of possible aspects, requiring that its actors meet environmental criteria (reduction in the consumption of energy, water, and other natural resources; reduction of CO2 emissions, waste reduction, etc.) as well as social criteria (improved working conditions, safety at work, consumer safety, etc.), while at the same time expecting maintained competitiveness by meeting customer needs and related economic criteria [19].
The development of sustainable supply chains is focused on improving economic, environmental, and social benefits and can be measured by a number of performance criteria. In the reference [20], the authors defined seven dimensions of sustainability and for each they also identified the appropriate set of indicators. Waste reduction is one of the primary goals, and when it comes to food the implications are even broader. This is confirmed by the fact that the UN has defined goal 12.3 as one of the development goals of sustainability: by 2030, it seeks to halve per capita global food waste at the retail and consumer levels and reduce food losses along production and supply chains, including post-harvest losses [21]. Food losses and waste can occur at different stages of the food supply chain depending on several specific factors such as type and characteristics of food products, economic and climatic conditions, production and infrastructure systems, and market and consumption features [22,23]. Food waste occurs when an edible item is unconsumed at the end of the supply chain, including retail [24], which is estimated to account for around 5% of total food waste along the supply chain [25], or around 4.6 million tons in 2012 [26]. The problem of food waste depends on the characteristics of the product as well as the characteristics of the supply chain: in responsive supply chains, more food losses are more expected than in efficient ones since generally the improvement of responsiveness leads to an excess of buffer capacity and inventories to face demand variability, while in an efficient supply chain the members manage their activities in order to meet predictable demand at the lowest cost [27]. The set of causes of food waste as well as of reduction practices identified in the literature is quite extensive. The paper [28] summarized the causes of waste and practices to reduce or prevent it in the retail sector and divided them according to six categories of causes based on the Ishikawa Diagram: machines, method, labor, material, environment, and measurement. For each category of causes they identified a range of particular causes and related reducing practices. According to this paper, one of the most cited causes was poor control/management of inventory, lack of coordination/collaboration, lack of information sharing, lack of integrated IT systems, lack of operational control, lack of waste management, inadequate packaging, etc. As the main food waste reduction practices, they stated the collaboration/communication between supply chain partners, inventory policy, employee awareness of waste, pack-aging development, etc. Apart from these reduction practices and strategies for waste prevention, which are analyzed in [28,29], adopting the concept of sustainability and raising awareness of the need and importance of reducing food waste in supply chains have resulted also in various strategies for food recovery and food donation, as well as food waste valorization through processing food waste into chemicals, materials, and energy, or extracting high-value target compound from food waste [30]. Approaches for recovery and food donation were analyzed in [27] from an economic perspective. The authors have developed a model that determines the optimal time to withdraw products from retail and divert them to an alternative purpose (e.g., donate to feed poor people, or, if they cannot be used for human consumption, use them to feed livestock). For fast localization of such products, it is necessary to apply new technologies such as RFID. The results showed that in order to apply this approach, it is necessary that tax reliefs and cost savings in retail be higher than the profit that would be realized without such an approach.
It is estimated that about 1/3 of food (approximately 1.3 billion tons) is globally lost annually [1]. In developing countries, higher food losses are mainly in the first stages of the supply chain, and in developed countries, they are at the level of retail and consumption [1]. If the lowest loss and waste percentages achieved in any region in each step of the FSC could be reached globally, food supply losses could be halved [31]. It is estimated that 25% to 50% of food in the supply chain becomes waste [32]. If the part of the food supply chain from the food production company to the consumption is examined, the largest quantities of food waste are generated in households (53–71%), then in food production and processing companies (17–30%), food service providers (9–12%), and retail (2–9%) [33]. Although the amounts and types of food waste generated in retail have been studied in detail, the food waste quantities are not always well documented [34]. However, all studies come to similar conclusions regarding the food commodities that account for the highest share of retail food waste. As it has been already stated, types of food that are mostly wasted in retail include fruits, vegetables, and bread [35]. Thus in retail in Austria 81% of the total food waste (in monetary terms) comes from fruits and vegetables, bread, pastries, and dairy products [36]. In Sweden, of the total amount of food waste, 42% is bread and pastries, 29% is fruits and vegetables, 12% is meat, 6% is ready meals, and 6% is dairy products [37]; in New Zealand, of the total amount of food waste, 44% is fresh vegetables and fruit, 23% is bread, 19% is meat and fish, and 6% is dairy products [9]; and in Finland, the main product groups associated with food waste in stores are fruits, vegetables, bread, dairy products, and fresh meat and fish, whereas estimations regarding Finnish wholesale sector and retail losses are around 65–75 million kg annually, which corresponds to around 2% of the total food waste [8]. Even though retail has lower amounts of food waste compared to other steps in the food value chain, it has a significant influence on food waste generated throughout the supply chain [37]. In addition, there are several reasons why the study of retail food waste is particularly important [26]: retailers have a great influence on both food production and consumers, the absolute quantities of food waste at retail stores are very significant in relation to the number of the points where it is generated, and retail stores are the place where several different food chain actors meet.
If food losses and waste were halved at all stages of the supply chain, there would be enough food for a billion extra people [31]. In addition to ethical implications, food waste produces significant economic and environmental costs. Food waste causes the waste of valuable natural resources (land, water, and energy), increases the cost of food production [22], and has negative effects on the environment by increasing the total amount of waste (from food and non-food products). Companies that adopt some of the food waste reduction strategies can achieve financial savings and reputational gains [33].
The importance of reducing food waste will be even more important as we move into the future. Considering the amount of waste generated, it is also important to understand that, as a matter of fact, it is not just food that is wasted. Another element that should also be considered is packaging. With a disturbing amount of food packaged with long-lasting plastic, which is exactly the situation in the case study this paper deals with, food and packaging disposal is fast becoming a nightmare for sustainability.
It is clear that the reduction of food waste in supply chains can contribute to the economic, environmental, and social dimensions of sustainability. One of the preventive approaches for reducing food waste, very often perishable products, implies better inventory management, i.e., better matching of product supply with their demand. Therefore, the synchronization of information and material flow could be essential for reducing food waste and thus improves the sustainability of the perishable food supply chain [6].

2.2. RFID in Logistics and Supply Chains

In addition to the concept of sustainability, digitalization is becoming an important element of business models and causes radical changes in the way companies operate. Although manufacturing, logistics, and SCM have gained maturity over the last decades, saturated markets and new customer demands put pressure on these systems, turning them into even more complex ones [38]. The adoption of various ICT and digital platforms has enabled logistics and supply chains to meet new market demands and reduce their complexity. At the same time, new business opportunities have emerged and new requirements and changes in the structuring and management of these systems have been initiated, further increasing their complexity. Nowadays, the volume of data in every supply chain is exploding from different data sources, business processes, and IT systems, including enterprise resource planning (ERP) systems; orders and shipment logistics; customer buying patterns; and technology-driven data sources such as global positioning systems (GPS), radio-frequency-based identification (RFID) tracking, mobile devices, and others.
Logistics real-time visibility becomes more important when it is necessary to be able to react to sudden changes [39]. Auto-ID technologies establish a connection between logistics-physical objects and management systems and represent the first step in achieving logistics real-time visibility. The application of bar code and RFID technologies in logistics, as the most common forms of auto-ID technologies, enables fast and accurate product identification and supports production, transport, handling, warehousing, and sales operations, together with the reduction of lead time and operational and transaction costs [40]. Despite the fact that in the last fifty years the bar code has become omnipresent in retail, the new business environment explores the potential of sensors, block-chain, and other technologies that are being introduced in the retail supply chain [40]. RFID technology enables automatic, contactless identification of objects, people, or animals via radio signals transmitted on a certain frequency [41], which has numerous advantages over bar code technology such as identification and tracking of individual objects (product, pallet, container, transport, or loading equipment), high reading speed, and simultaneous reading of several objects. Reading is possible outside the visual range, storing a large amount of data, direct communication with the product, decentralized data storage, two-way communication, etc. [40]. In the context of food quality and safety, EC Regulation 178/2002 stipulates that some food products and their ingredients must be continuously monitored along the entire process chain, down to the original manufacturer, a requirement that can be supported by RFID technology. RFID tags with built-in sensors that measure different ambient conditions (e.g., temperature, humidity, and pressure) can contribute to preserving product quality (signaling when defined conditions are violated), which is especially important for (longer) perishable food supply chains.
Research on the application of RFID in supply chains is numerous and focused on various topics: technical problems and methodological implementation procedure, costs and usefulness of technology for different participants in supply chains, operational efficiency of logistics processes, inventory management policies, security and privacy issues, etc. A review and systematization of the abundance of academic literature on the application of RFID in supply chains has been given by several authors. The general classification of papers according to the most used approaches and the main topics of the publications on RFID applications in supply chains given in [42] is particularly useful.
At the beginning of this century, large retail chains such as Wal-Mart, Metro, Tesco, BestBuy, and others gave a strong impetus to the development and introduction of RFID in retail supply chains. Wal-Mart was the first to issue an RFID technology mandate, which required its top 100 suppliers to put RFID tags on their pallets and cases beginning in January 2005 [43]. As a result of the application of RFID technology on pallets and larger packaging in Wal-Mart stores, they reduced out-of-stock items by 16% while reducing inventory in the supply chain [44]. A test at Metro showed that inventory shortage costs, which ranged from 9% to 14%, could be reduced by 17%; thefts could be reduced from 11% to 18%, and labor costs from 8% to 11% [45]. After the initial expansion in the use of RFID in retail, its adoption slowed down slightly after 2008 [43]; however, a general hypothesis that RFID could help retailers to sell more and dispose of less can be made.
To determine the impact of RFID systems on logistics and supply chains, it is first necessary to identify the type and location of RFID impacts on business processes and then calculate the benefits in the supply chain as shown in [41]. In [46], a model was proposed that supports the structuring and calculation of benefits in business processes from RFID investments and enables the identification of the type and place of influence in the value chain, and impact measurement indicators. The application of RFID in retail supply chains contributes to reduced costs and increased operational efficiency of logistics processes through automated entry, commissioning and exit of goods, as well as better utilization of employees, as concluded in [47,48]. The application of RFID technology and the electronic product code system to the main processes of the three-tier supply chain for fast-moving consumer goods has shown that at the pallet level positive economic effects are achieved for all chain participants, while product-level labeling showed negative economic results [49]. However, labeling items in retail supply chains allows for increased visibility of demand [50]. Product value and demand characteristics have a significant impact on the expected benefits of integrating RFID into a three-tier supply chain [51]. Better management of inventory is a reason why RFID is being used by retailers [52,53]. For determining the benefit of the RFID in the retail sector, in [52] content analysis was used by combining trade and academic articles, including both pilot studies and real implementations. The authors demonstrated that there were strong relationships between retailer benefits and RFID business processes, and that better management of inventory is a reason why RFID is being used by retailers. The impact of RFID tagging on out-of-stock items is not the same across all product categories. For some product categories (products that have a greater turnover, greater sales volume, greater product variety, lower item cost, and greater inventory density), the out-of-stock reduction ranges from 21% to 36% [53]. There is a strong relationship between the cost of RFID technology and the value of products lost due to inaccurate inventory data [54]. Inventory inaccuracies are eliminated or reduced in the supply chain by implementing RFID [55]. Inter alia, integrating sensors with product-level RFID tags can help reduce waste in perishable food supply chains [56]. In general, from a food waste perspective it is particularly important to protect food products with high environmental impact, such as fish, meat, and dairy products. Therefore, solutions that give some kind of “smartness” to the products and enhance efficient data sharing at the same time may increase their shelf life. Intelligent food packaging driven by RFID provides opportunities to retailers for sharing data with suppliers that help them to improve their production planning, achieve faster stock turnover, and reduce waste [57]. The role of technology-based innovation, as is the case with RFID, could be crucial for solving an issue as complex as food wastage [58]. RFID provides a broad range of possibilities for their expanded usability through a number of new and innovative solutions whose application can reduce waste in different parts of the supply chain. According to the aforementioned paper [59], RFID systems are one of several technological solutions (as well as ERP, electronic data interchange, cloud computing, and machine-to-machine) that can improve both efficiency and reduction of food waste in the FSC. For example, in [60] the authors explored the usage of RFID technology in the newly proposed household-based food waste charging system with the final aim to reduce food waste while empirically demonstrating the justification of the proposed system.
One of the main problems in the implementation of the RFID system is the disagreement between the participants in the supply chain concerning the division of necessary investments and the achieved profit [61]. While most savings are achieved in retail, suppliers are mostly burdened by the cost of introducing RFID [47]. Despite the many advantages of RFID technology, there is a view that RFID is an upgraded barcode system with a huge cost and few benefits [62].
If there has been any skepticism regarding the usefulness of RFID applications in supply chains, the new wave of technological change happening now is about to change that. In the era of digitalization as the personification of Industry 4.0 [63], RFID is an efficient means of object identification and one of the primary sources for generating data in the supply chain. As a result of a systematic literature review of Logistics 4.0 and the main characteristics of new logistics systems, provided in [13], it was concluded that new logistics systems are a necessary element of future production and trade networks. This review covered new technologies such as the Internet of Things (IoT), cyber-physical systems (CPS), big data, or cloud computing, and pointed out that IoT, which is strongly associated with RFID, is the main technology that provides the necessary visibility in logistics. RFID is a major prerequisite for the Internet of Things (IoT), which connects physical objects to the Internet [55], i.e., RFID-based information systems are considered the best candidate for IoT-based implementations, which connect the physical and virtual worlds by “sensing” different “things” of interest [40]. It could be concluded that RFID technology is a disruptive technology to transform supply chains into more efficient systems [64].

2.3. Simulation Modelling of Logistics Processes

Two approaches can generally be used to model logistics processes: analytical and simulation [65]. Analytical models are characterized by numerous advantages such as conciseness in the problem description, closed form of a solution, simple assessment of the impact of input on output variables, and ability to achieve optimal results, but they also have disadvantages such as inability to include multiple variables, system assumptions can be unrealistic, and complex mathematical formulations can be complicated to solve [66]. Therefore, simulation modelling is often the only way to effectively model complex processes in supply chains. According to the systematic literature review, the simulation modeling was most frequently used method in the research of the following topics: supply chain management, production planning, and inventory management and control [67]. In addition, simulation is widely used methodology for evaluation of economic, social, and environmental aspects of sustainable supply chains [68].
A simulation model is a representation of a system of interest, used to gain insights into existing systems and investigate systems under new operating conditions. Discrete event models represent a system in which the state of the system changes only at a discrete set of points in time [69]. The main reasons to use discrete event simulation for system analysis in supply chain management are (i) the possibility to include dynamics and (ii) the simplicity of modelling [70]. In the field of logistics and supply chain management, discrete system simulation offers solutions to a wide range of issues at strategic, operational, and tactical levels, addressing supply chain design and reconfiguration [71,72,73], production scheduling [65], and supply chain collaboration and information sharing [74]. The object-oriented approach is particularly well suited for supply chain modeling, because there is a natural mapping between objects in the system being modelled (e.g., distributor, supplier, plant, vehicle, etc.) and their abstractions in the object model [75].
An important guideline for this research was the simulation model of the collaborative logistics in the agri-food supply chain, which, when tested on a case study, proved that increase of information sharing frequency can significantly improve the performance of a SC and that the benefits of it increase with the order frequency [76].

3. Research

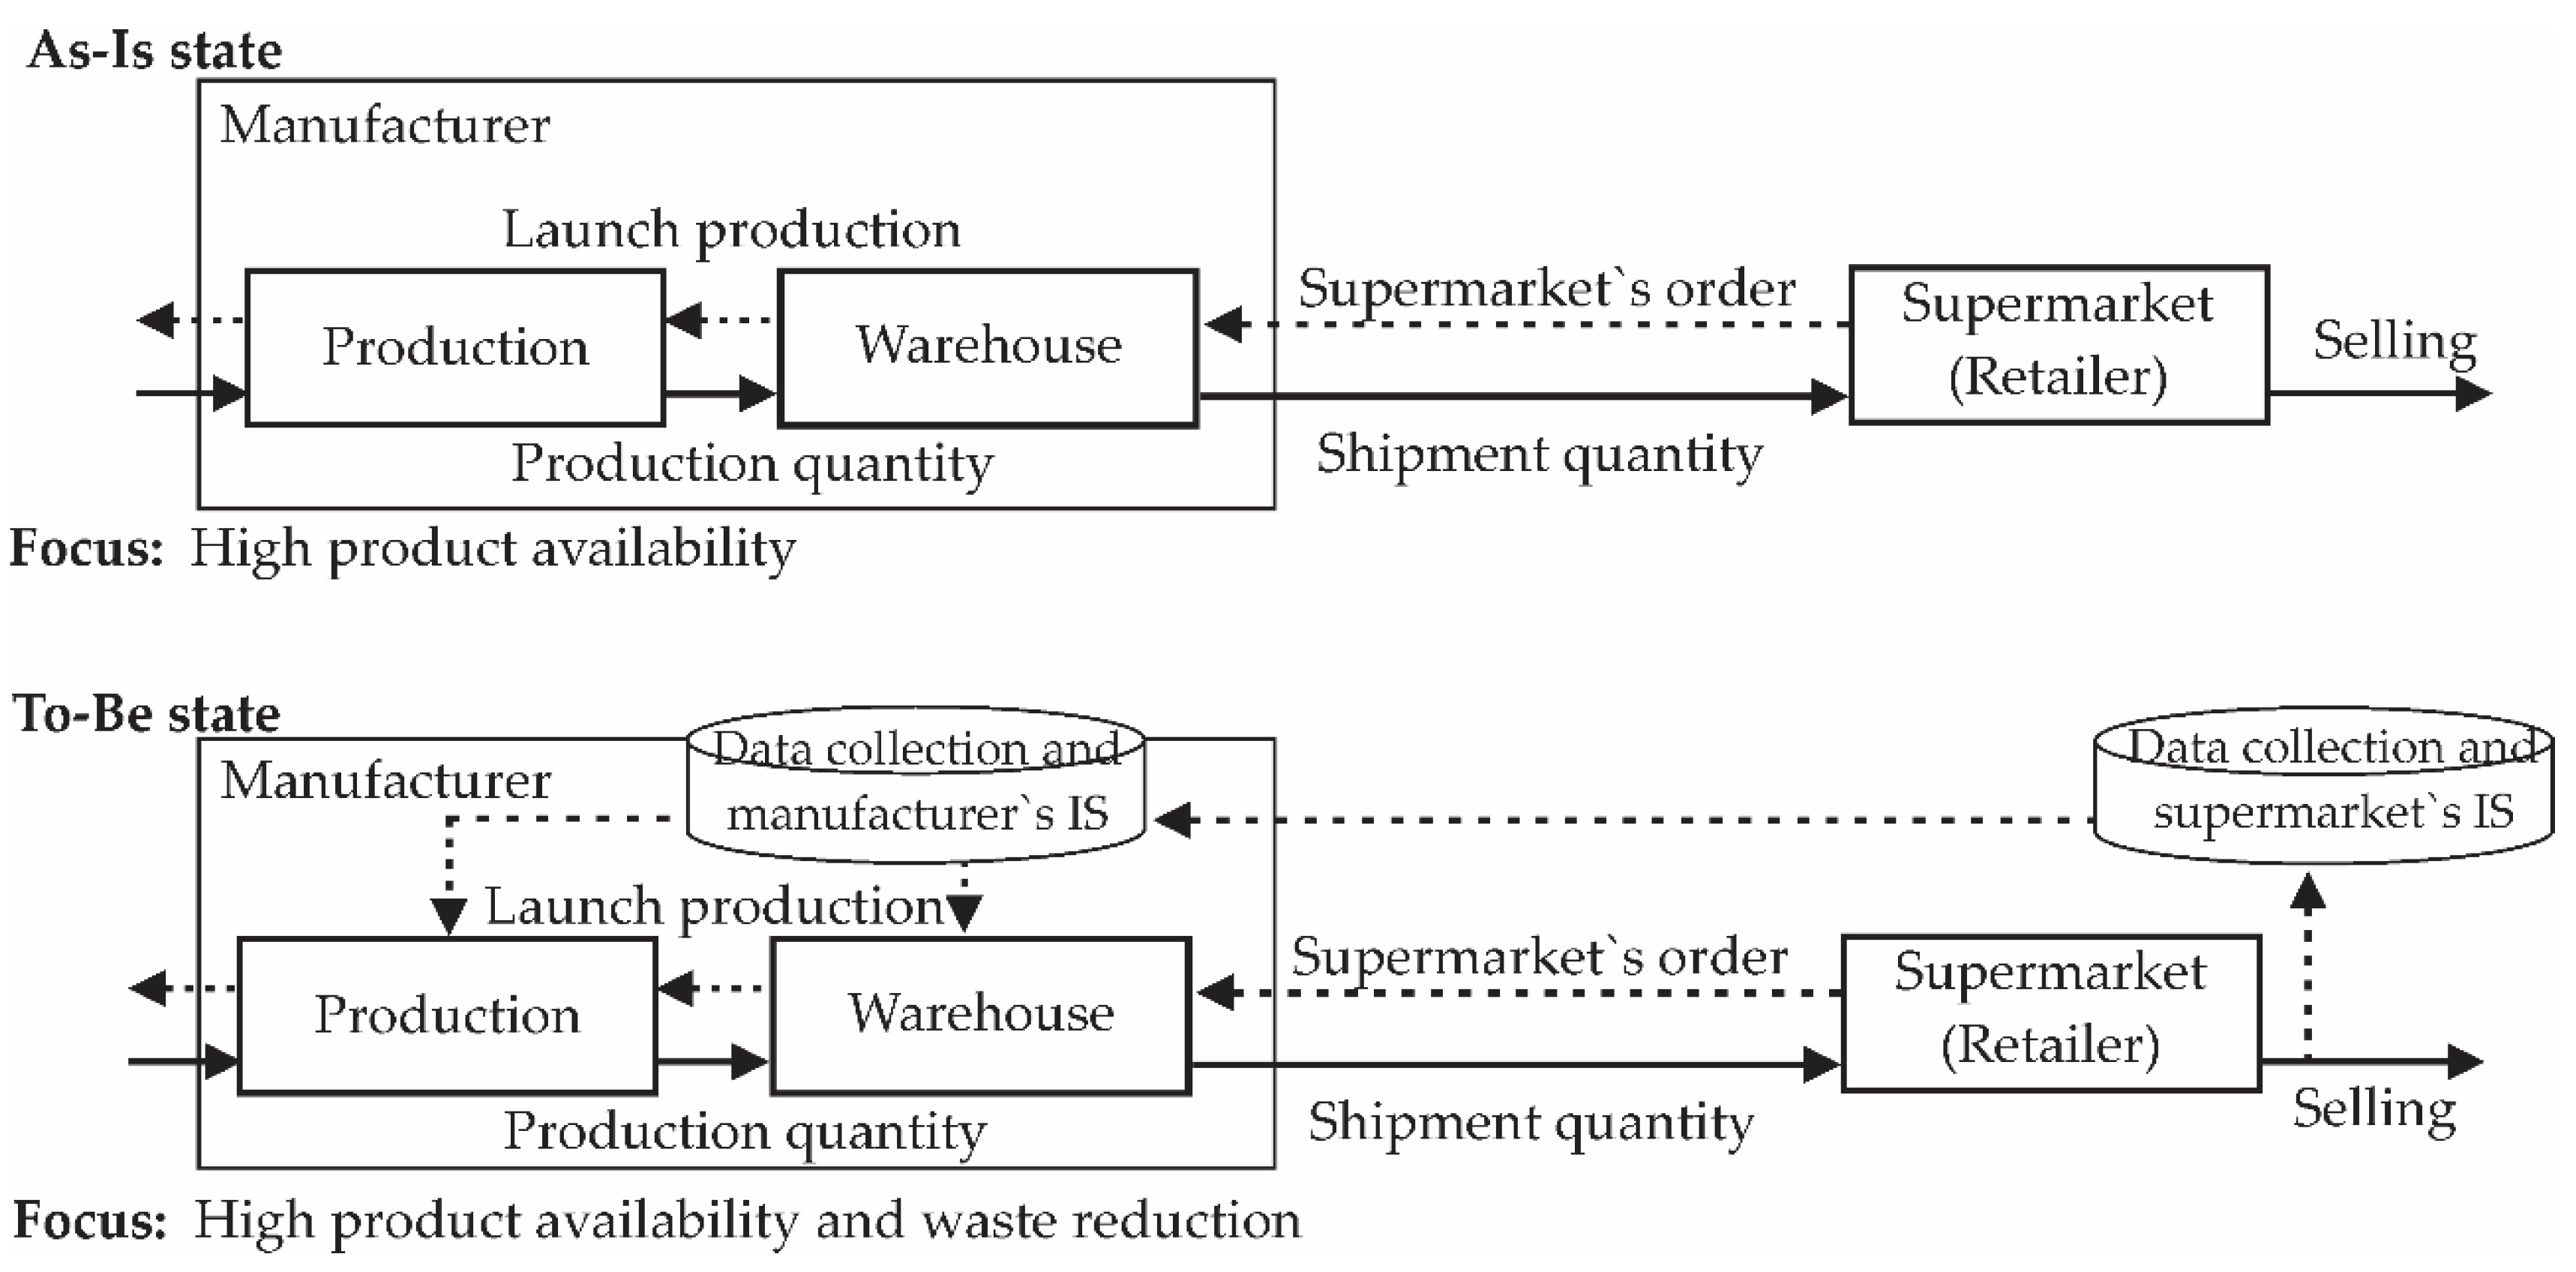
3.1. Problem Description

This paper investigates the possibilities for the preventive reduction of waste from dairy products through synchronization of information and product flow in the distribution part of the supply chain. The case which is analyzed is the distribution of dairy products directly from producer to milk processing plant to supermarket, as a place of sale of dairy products (Figure 1). The term food waste refers to the total amount of products that are neither sold nor returned and that can occur both at the producer site and in the supermarket.
The manufacturer produces and processes milk in the Western Balkans region, and it delivers its products to over 300 stores. Both the producer and the retail chain strive to provide their customers with high-quality products, ensure high levels of customer service, and integrate the concept of sustainability into their business models. In order to meet the market demands for products, both the producer and the supermarket hold large stocks, which, combined with other factors such as short shelf life of dairy products; insufficient visibility of products in warehouses; sales; and other segments of the supply chain, as well as lack of information on expiration dates at particular locations, results in a significant amount of waste generated in the distribution process.
The purpose of this research is to examine and quantify the possibilities for reducing dairy waste by improving inventory management systems and product ordering processes. The research is conducted through the case study and simulation modelling of logistics processes and flows of goods. The first step was collection of the necessary data from the real case, followed by the development of the simulation models that enabled the quantification of food waste and other indicators of inventory management efficiency (average inventory level, turnover ratio, and inventory costs). Two simulation models were created: the first model considers the existing inventory management policy and ordering process (Model 1-As-Is state), and the second represents improved inventory management and ordering policy (supported by RFID technology) aimed at reducing food waste while meeting market demand for products (Model 2-To-Be state).

3.2. Problem Statement and Solution Proposal

The structure of the studied two-echelon supply chain, i.e., the created simulation models, is composed of two nodes: the producer and the supermarket, between which the flows of materials and information take place (product delivery, sales, purchase order, and production start order). Each node is described through the initial state of inventory and input and output product flows (dynamics and quantity) and the rules based on which product flows are started, i.e., stocks are replenished. The research domain and problem outline are shown in Figure 1.
One type of dairy product was selected as the target product for the case study. This product category requires temperature-controlled conditions (during warehousing, transport, storage in stores, and storage at the final consumer’s home) and is classified as short-term products with a shelf life of up to 30 days. The supermarket was chosen as the sales format for the following reasons: the width and depth of the sales assortment, as well as the size of the sales space, enable the generalization of results to other retail categories; due to economies of scale, it is estimated that RFID has a positive impact on process efficiency in supermarkets [78]. Two different questionnaires were developed for collecting data—one for the producer and one for the supermarket—and they were complemented with the data obtained by direct process monitoring. The questionnaires were designed to collect general data such as product type, packaging type, product value, employees, technical means, mode of transport, working costs, number of shipped/received packages per day, number of products sold daily, days of the week when shipment/receiving takes place, and rules of stock replenishment, as well as specific information related to the research processes. The intensity of product flows was determined using the time interval of one day and the data on the daily input-output of the product.
As mentioned above, two simulation models were developed. The model of the existing flow of goods (Model 1-As-Is state) examines the functioning of the actual system and was developed based on the collected data and in consultation with employees working in current systems. The process of selling products (product exit) in the supermarket drives all other processes in the chain. Every morning by 8 o’clock, the manager inspects the state of the product in the supermarket, and, if necessary, orders from the producer. During this inspection, errors are possible due to insufficient visibility of the product in the back-room storage and on the shelves and the lack of information on the shelf life of the product. The quantity of the order is variable and defined by the difference between the maximum stock level for that product (S) and the state determined by the inspection. Therefore, the supermarket applies a (T, S) stocking system (renewal period T = 1 day). The producer processes the received orders at 12 p.m. and confirms the delivery that is made the next day (LT = 1 day). The delivery that is made from the warehouse of finished products is made by the producer. It takes a minimum of 3 days (about 10% of the product shelf life) for the product to arrive from the warehouse to the supermarket, and often more than 10 days pass before the product is available for sale. The producer replenishes their stocks of finished products from the production process, and the production of the quantity Q begins when the stocks fall to the level of s (reorder point), i.e., the manufacturer applies a (s, Q) stocking system. According to the collected data, no out-of-stock situations were recorded in this case. Both the producer and the supermarket hold larger stocks to meet market demand, which, along with the fact that there is no complete visibility of product age by location, leads to longer product retention in the chain and waste generation due to product expiration. Output results from the model were validated by managers of the participating companies.
As a preventive approach to waste reduction, a new model of inventory management (Model 2-To-Be state) was proposed. It assumes that the information connectivity of participants in the supply chain is achieved through RFID systems and appropriate IT level (the participants have appropriate technical equipment, software for processing the collected data, and direct communication). In this way, the participants in the implementation of logistics processes have accurate information on the inventory of dairy products (quantity, remaining shelf life, location, and input/output), which allows them to undertake the necessary activities in their domain based on real-time information and not only based on demand forecasts. In Model 2, the characteristics of demand for supermarket products (determined in the current system and confirmed in the As-Is model) were considered as constant values, but the replenishment parameters (reorder point, maximum stocks, and review period) were modified and adjusted to actual demand. This principle was also applied to the producer. Based on the defined ordering rules and real-time stock status information, the supermarket can generate automatic orders once a day, when stocks fall to or below the defined reorder point ss. Stocks are replenished the next day, up to the maximum level (S), i.e., the (T, ss, S) replenishment system is applied. This change does not cause changes in the dynamics of product delivery. The producer has real-time information on the sale of the product in the supermarket and insights into the actual consumption of their product, which allows them to improve short-term forecasting and adjust their production program by product structure and quantity, thus enabling them to adapt the production process to the actual sales. Since these products have a short shelf life, fewer days of product storage in the warehouse means more days for its sale in the store. In this model, the producer’s inventory replenishment policy remained the same as in Model 1, but compared to the existing situation, the reorder point was reduced to a level that did not jeopardize product delivery. This change was made due to the fact that the availability of real-time, accurate data on the sales in stores allows the producer to forecast the demand more accurately with the ability to take advantage of the flexibility of the production process in terms of time scheduling production by ±2 days and changing production Q up to 10% in the sales function.
Although different ICTs can be used for generating sales data, exchanging information between supply chain participants and automatic ordering, RFID technology was chosen for the following reasons: it can generate large amounts of product data, the product is monitored throughout its life cycle from production to final sale, full product traceability is enabled (extremely important for food safety), the location of the product and its characteristics can be monitored, situations where products are lost are avoided, inadequate environmental conditions are alarmed, and product shelf life is easily checked. All the above characteristics of RFID labeling can contribute to the preservation of food safety and reduction of waste, and thus to the establishment of sustainable food systems. Besides, RFID is one of the key technologies in the establishment of smart stores and the complete digitalization of processes based on the Internet of Things concept.
In both models, the supermarket orders product package units (one package includes six product units). The product is delivered by the manufacturer’s trucks, six days a week (except Sundays). The truck in one cycle serves a number of stores, and there may be deviations in the delivery time depending on the routing plan.
The models respect the proportions in terms of the quantities of products that the manufacturer sends to the supermarket and other customers (other stores of the retail chain to which the supermarket belongs are included in this category). For that reason, in addition to the flows of goods that take place between the observed supermarket and the producer, the simulation model incorporates the total amount of production and consumption through the component labelled “other customers”, thus enabling the quantification of total food waste in the described models. However, we must note that for the category “other customers” we had only the data on the overall quantities of products shipped from producers and reported not to have been sold, without rules and characteristics of individual orders, so for this category of customers the obtained results concerning waste should be accepted with some reservation.

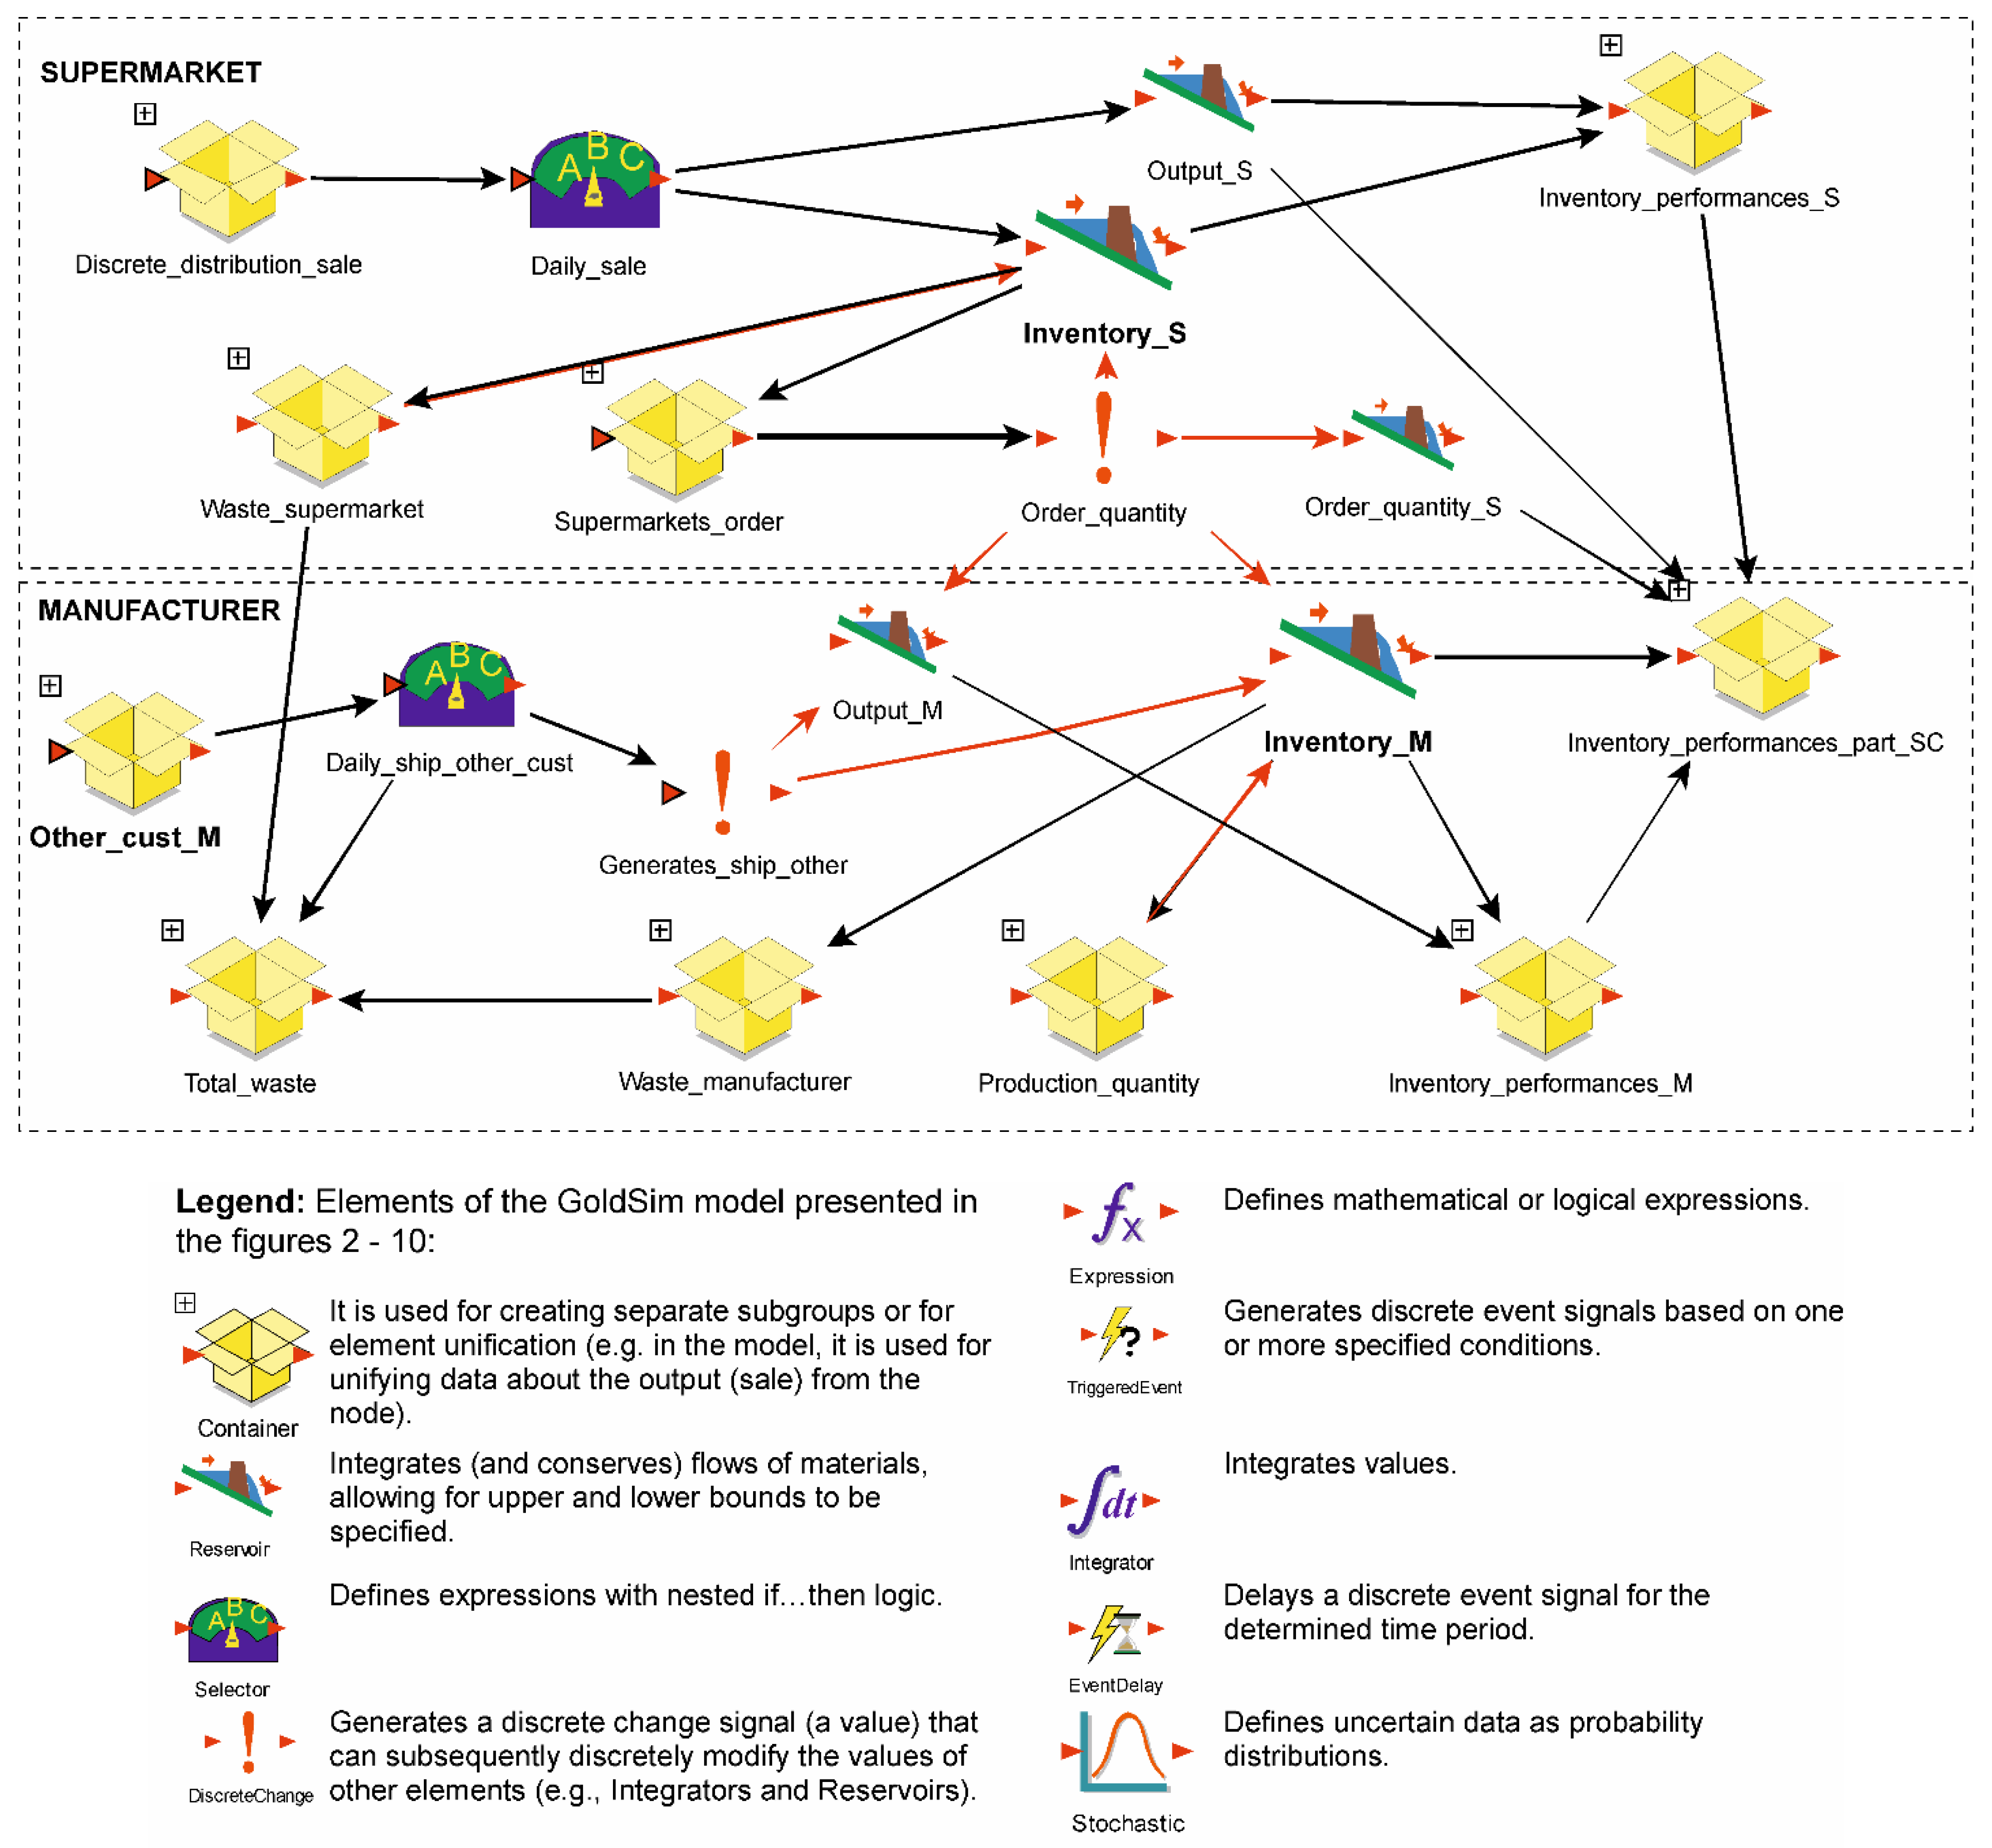
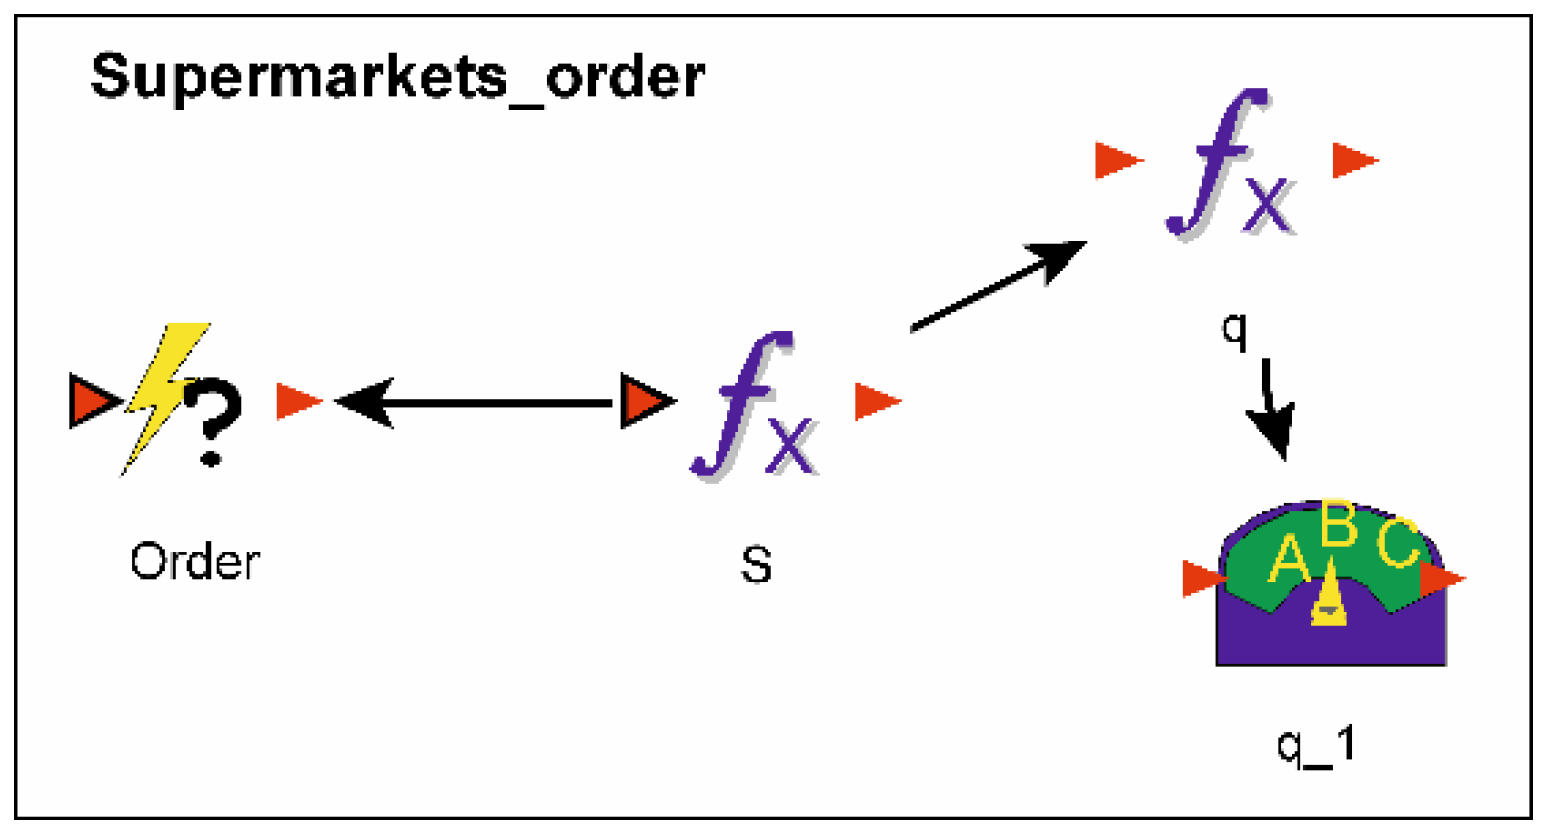
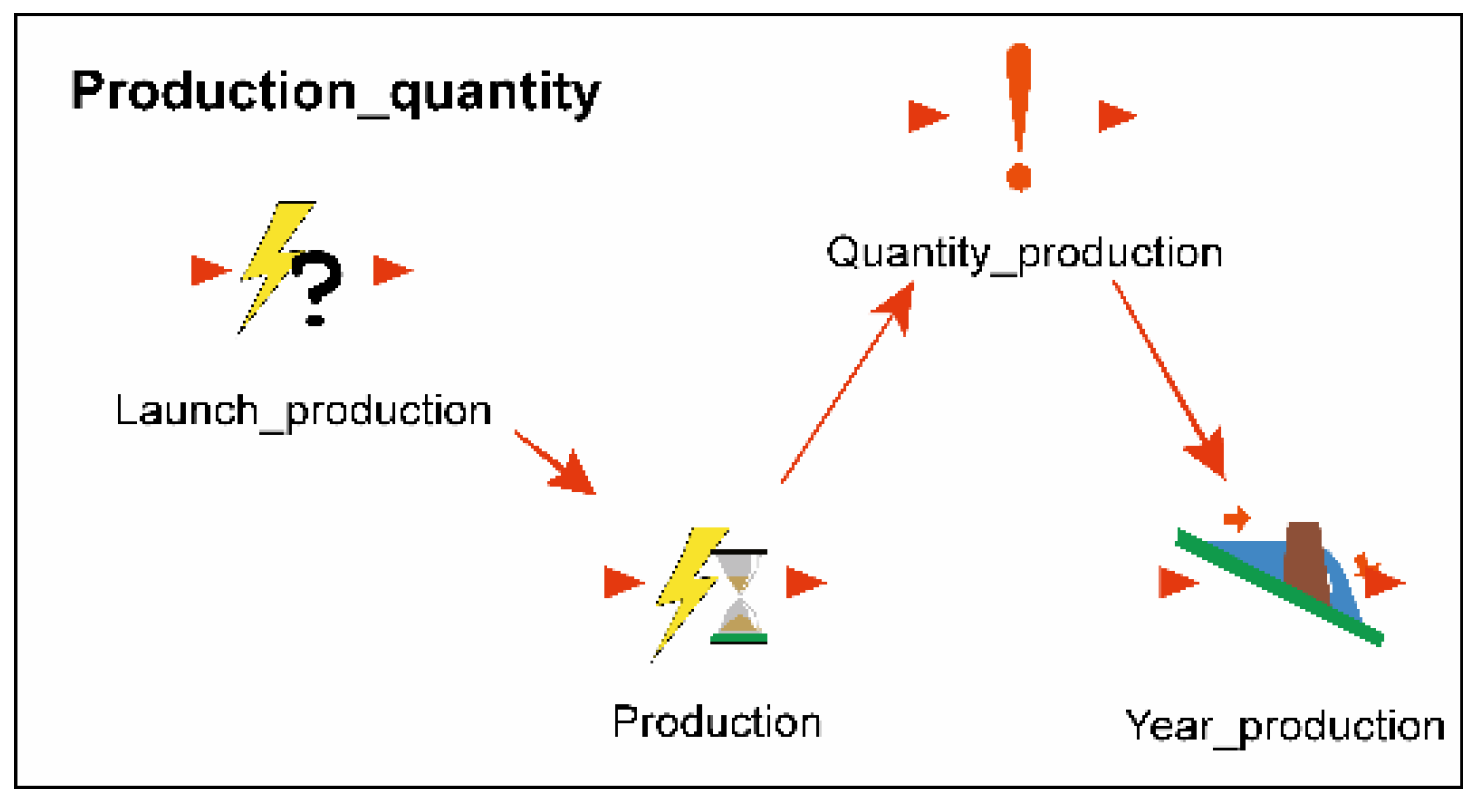
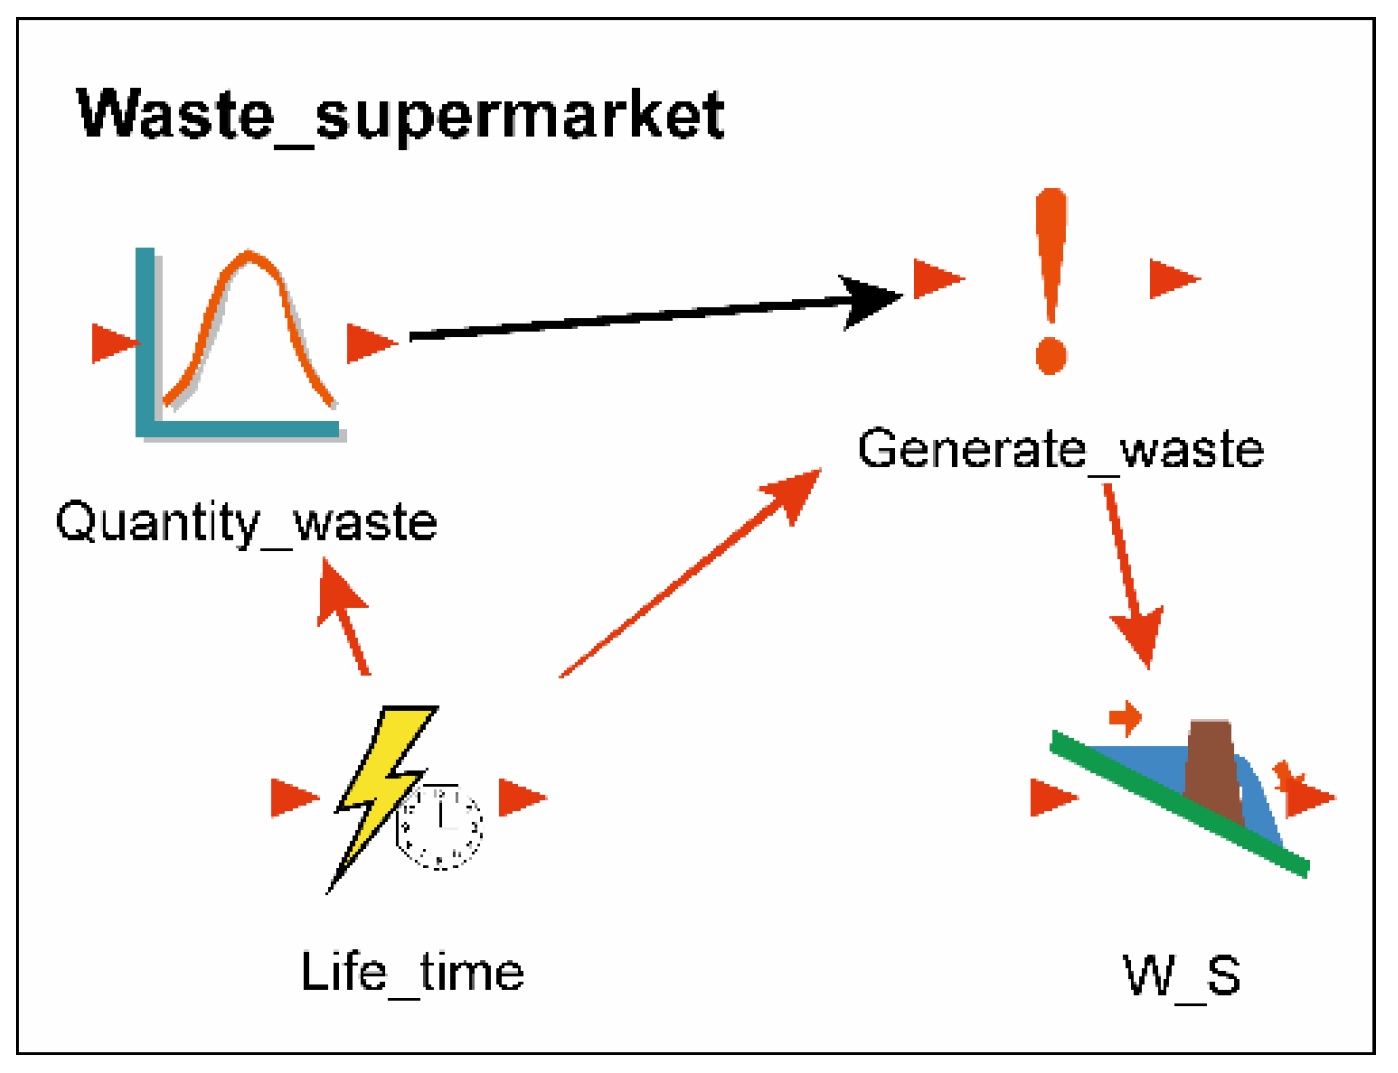
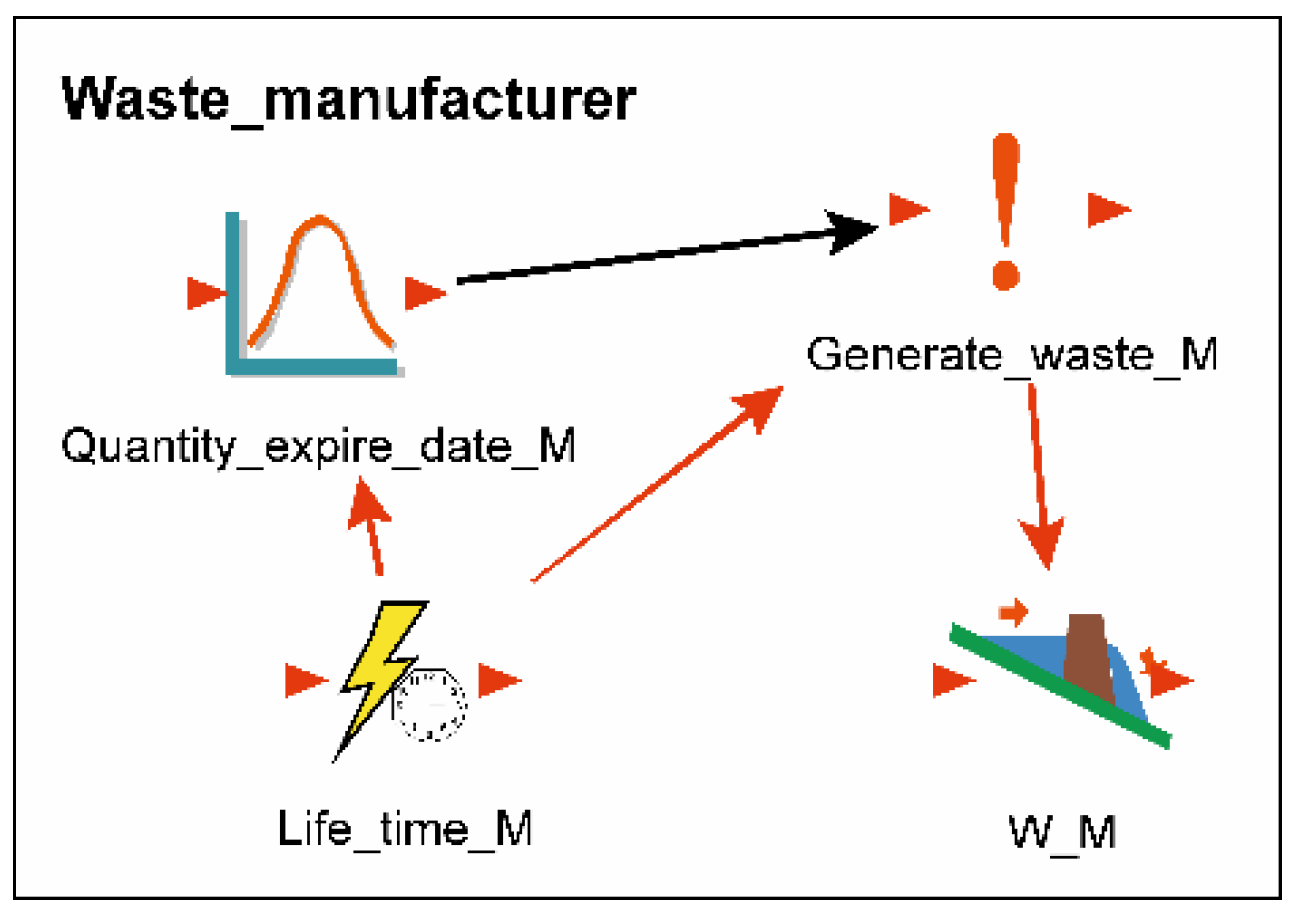
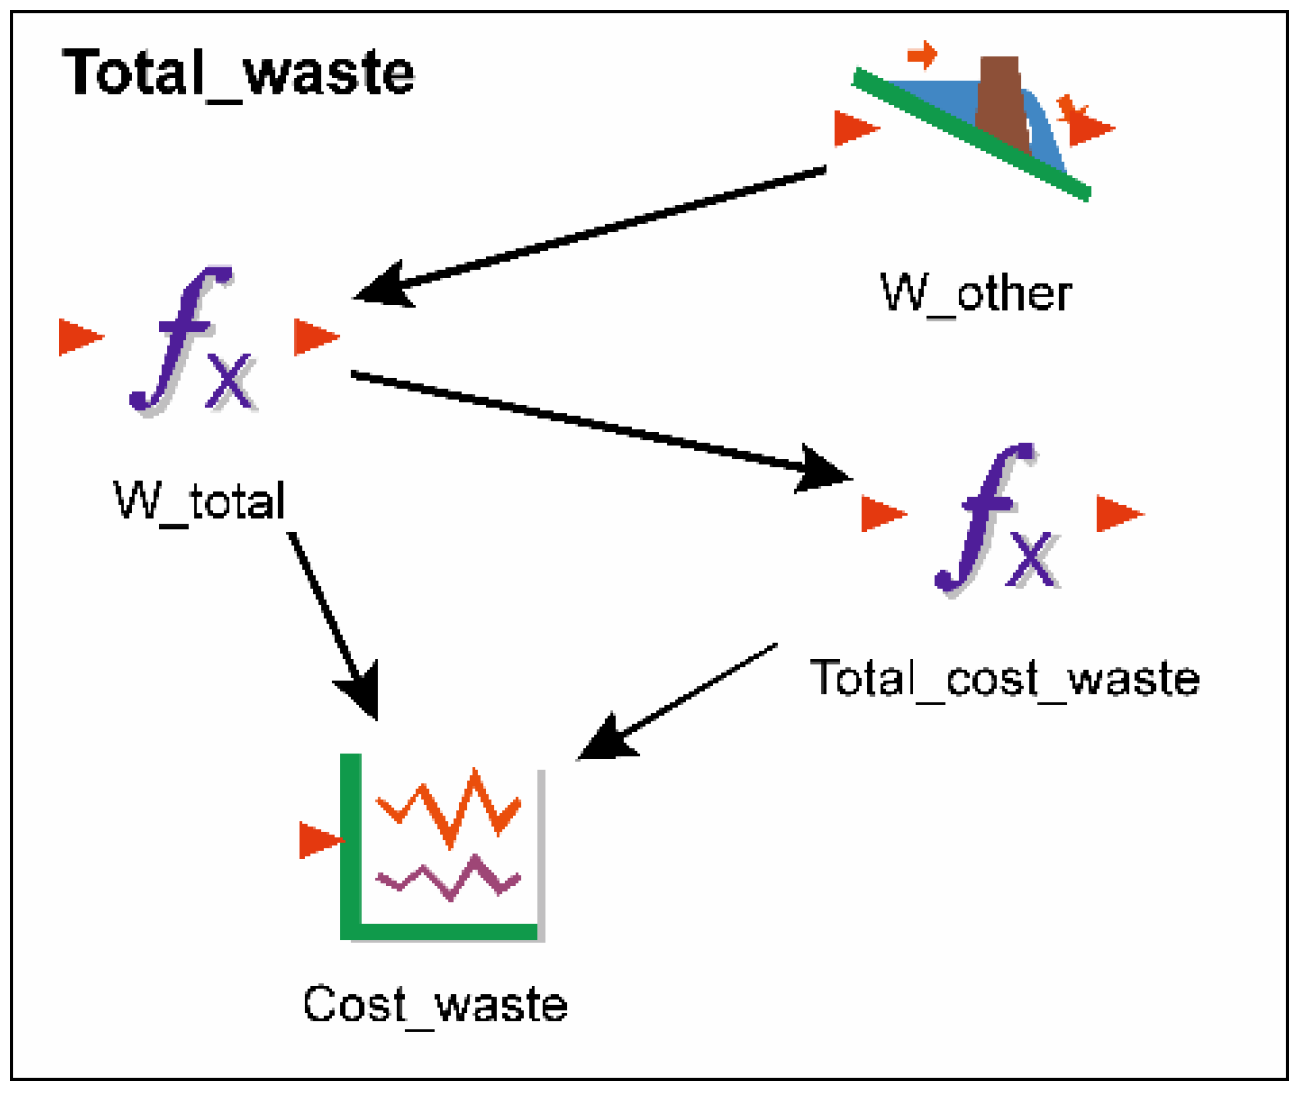
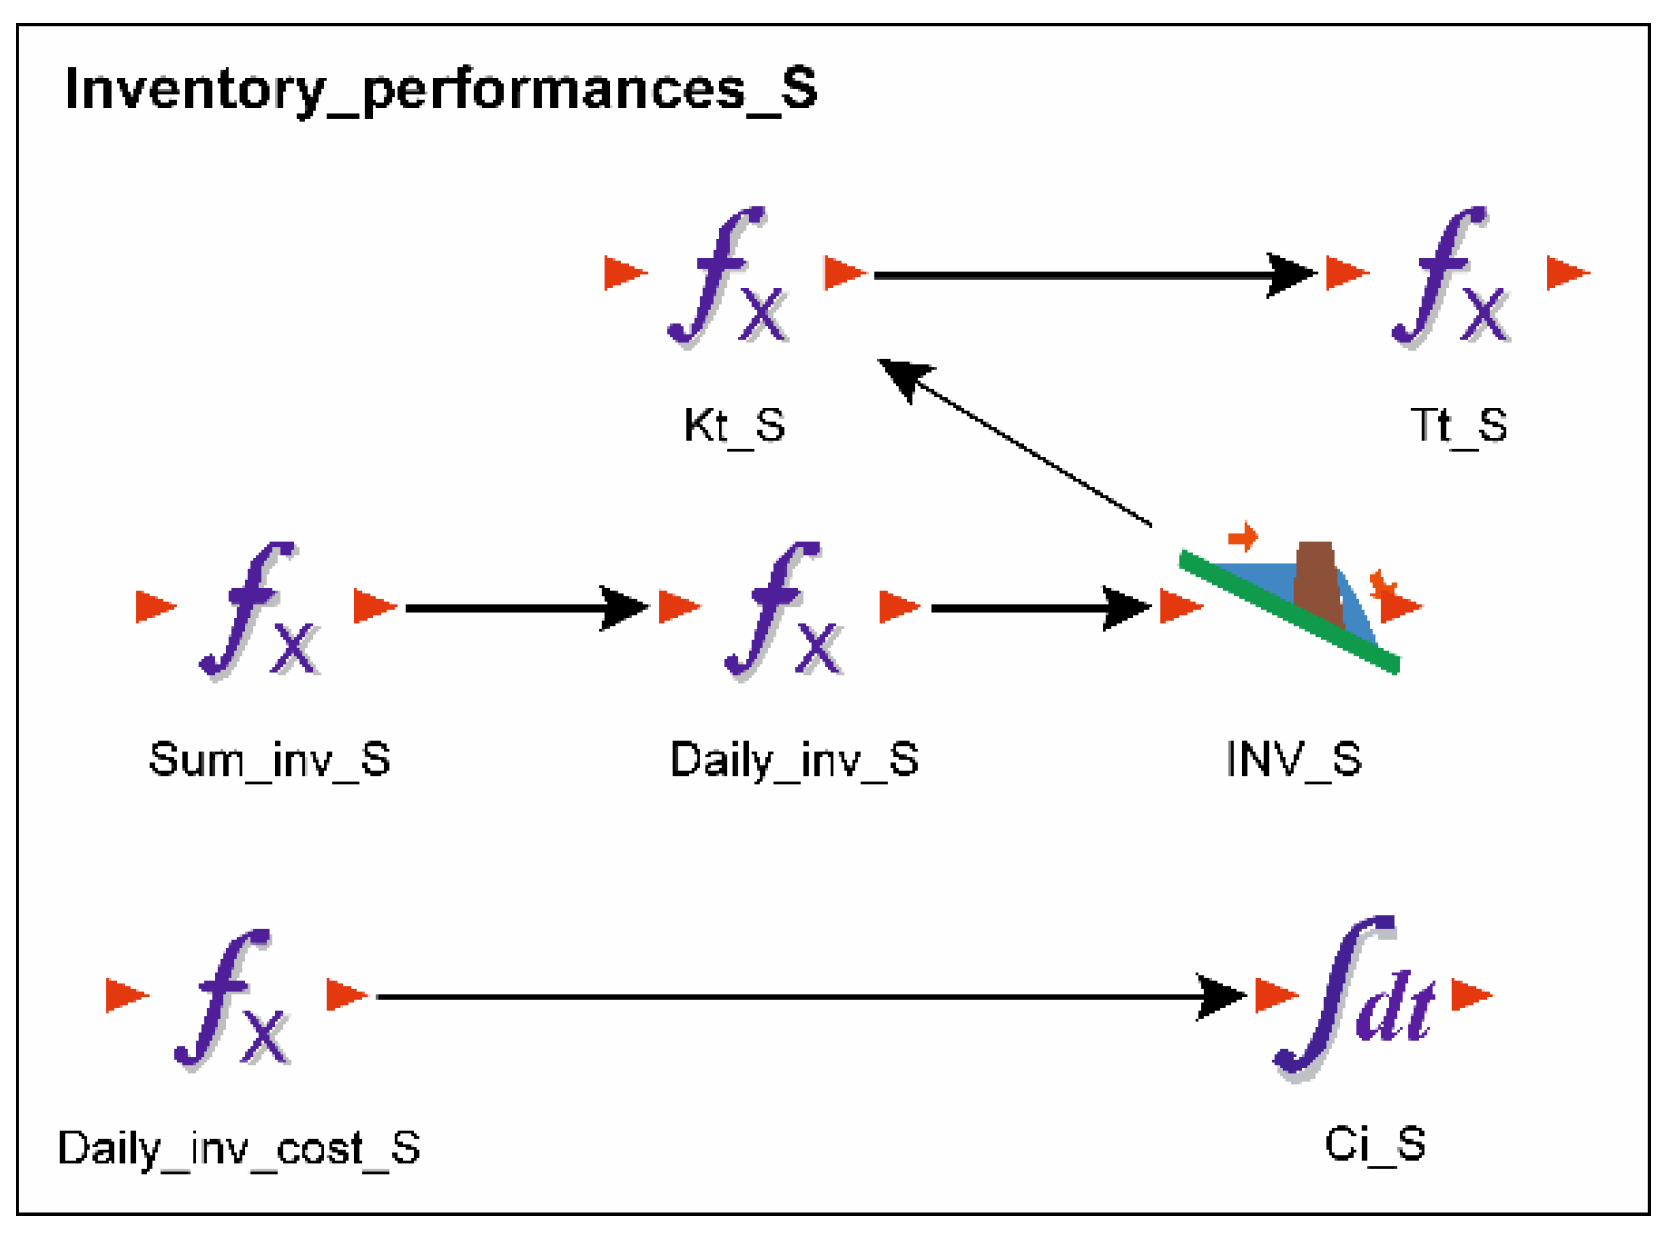
3.3. Structure of the Simulation Model—Model Parameters

Each of the nodes in the observed supply chain is described through its inventory state and actions that drive product flows. Product flows are characterized by a high degree of stochasticity (especially at the retail level), both in terms of quantity (demand, sales, procurement) and in terms of time characteristics of the flow (time of flow initiation, delivery time). Discrete event simulation was used in this study to model product flows that take place between the nodes in the chain. The focus of the model is on the quantitative and temporal characteristics of product flows, which made it possible to monitor stocks at the manufacturer’s plant, in the supermarket and in the chain, and to determine the defined stock indicators (amount of waste, average stock level, stock costs).
The input parameters for simulation modelling (rules and initial values) are listed in Table 1.
In general, the demand for a product in a store is a random variable that can be described by a known probability distribution. In a typical store, demand cannot be seen directly (customers do not place orders but buy goods from the shelves), so the current sales data are considered to be close to real demand. In the observed system, which operates with high stock, such simplification may be acceptable (such an approach can be questioned in cases where there is a shortage of products and buyers do not buy at all, because sales data will underestimate real demand) [79]. Based on the data on daily sales, it was not possible to determine the agreement between the experimentally determined data and theoretical distribution, so experimentally determined (discrete) distributions were used in the model to show demand, i.e., basic distribution parameters: the mathematical expectation of daily consumption µd and standard deviation from daily consumption σd. All product flows in the models were quantified in the same way.
In addition to food waste (W), other stock indicators were calculated as an output of the simulation model, such as average inventory (INV), stock turnover ratio (Kt), and turnover time (Tt). All these indicators that measure the efficiency of inventory management are part of the decision support system and can be valuable in changing company behavior toward more sustainable decisions. The outputs of the developed models, in accordance with the purpose of this paper and the requirements of the simulation model, are determined as follows:
Average inventory at the i-th participant (INVi) [65]:
I N V i = 1 N · H n = 1 N t = 1 H I n , t
where N = number of simulations; H = length of the time period; In,t = ending stock level in simulation n at time t; and i = supermarket (S) or manufacturer (M).
Amount of expired products at the i-th participant (Wi) [29]:
W i ( t ) = σ · I N V i ( t )
where δ = the rate of exponential distribution of lifetime.
Cost of capital tied up in inventories (CIi):
C I i = c i · p · 1 N · H n = 1 N t = 1 H I n , t
where ci = a value of the stock unit at the i-th participant and p=coefficient of proportionality (interest on assets tied to inventories).
Product turnover ratio (Kt):
K t = 1 N n = 1 N t = 1 H S n , t I n , t
where: Sn,t = sales in the n-th simulation at time t.
Product turnover time (Tt):
T t = N · H n = 1 N t = 1 H S n , t I n , t
Costs of applied warehouse technology at the manufacturer (Cw):
C w i = H · k w i · I N V i
where kwi = storage costs per package unit.
The value of the parameters used in the calculation are the price of the product (c) in the supermarket is 6.35 EUR/package, and at the manufacturer, it is 3.84 EUR/package; the proportionality coefficient (p) is 0.25/year; and daily warehouse costs at the manufacturer (kwi) are 0.0013 EUR/package.
Using the defined research domain (Figure 1) and the described flows of information and dairy products during the supply of supermarkets (Section 3.2), a simulation model was created (Figure 2). The As-Is and To- Be models share the same basic structural elements, and the difference is present only in the settings of individual parameters (rules and values), as previously described. Numerical and logical elements that characterize the nodes in the observed two-echelon supply chain and product flows between them were observed in simulation models formed using the academic version of the software package GoldSim 9.0. The simulation covers a period of one year. The time step used for the simulation is chosen to be 1 day.
The model mimics the logic of the functioning of the process in the observed case study. The initial level of stocks in the supermarket is nine packages (defined in the element: “Inventory_S”), and it allows for the start of product selling, which further starts processes in the model, or the making of discrete changes in the state of the system. The subgroup “Discrete_distribution_sale” enabled the consolidation of data on daily sales of products in the supermarket for a period of one year. Data on daily sales in the supermarket and on replenishment of stocks are determined via the questionnaire filled in in the supermarket. The accuracy and reliability of sampled data is cross-validated and confirmed by the supermarket manager. Due to their variability, these data (input parameters into the model) are presented through discrete probability distributions, i.e., through basic distribution parameters: the mathematical expectation of daily consumption µd and standard deviation σd. The element “Daily_sale” connects sales data with the days of the year, which is reflected in the level of stocks in the supermarket (“Inventory_S”) and allows one to determine the total sales (“Output_S”). Besides, “Output_S” is also used as a control element to check the compliance of the model results with the values collected in the real system (from the questionnaire). The “Inventory_S” element mimics the flow of products through the supermarket, distinguishes changes in condition, and allows one to determine the current quantity (condition) of products in the supermarket. Changes occur due to events that cause discrete changes in the state of the system and that are generated by the discrete change elements. Changes in “Inventory_S” occur due to the sale of products (“Daily_sale”), withdrawal of expired products (“Waste_supermarket”), and replenishment of stocks in the supermarket (“Supermarkets_order” and “Order_quantity”).
Subgroup “Supermarkets_order” (Figure 3) groups the elements that define and launch a new order to fill stocks (“Order_quantity”). Depending on the existing (current) quantity of products in the supermarket (“Inventory_S”), defined conditions for starting an order (“Order”), and rules for calculating the order quantity (defined in elements: “S” and “q”), element “q_1” determines the quantity of the order (this element uses if–then logic to define the quantity of the order that changes as a function of the state of the element “q”). “Order_quantity” is the discrete change element that triggers the ordering event by emitting a discrete change signal. This element generates a new order (defined in “q_1”) that leads to a change in the elements “Inventory_S” and “Inventory_M”. Additionally, “Order_quantity_S” is also used as control elements to check the compliance of the model results with the values collected in the real system.
Similar to the element “Inventory_S”, the “Inventory_M” element (Figure 2) mimics the flow of products through the manufacturer’s warehouse, distinguishes inventory changes, and allows for the calculation of the current inventory level. The initial stock level at the manufacturer is 2500 packages. Changes in inventory at the manufacturer occur due to delivery of products to the supermarket (“Order_quantity”) and to other customers (“Generate_ship_other”), withdrawal of expired products (“Waste_manufacturer”), and replenishment of inventories from the production process (“Production_quantity”). These events are triggered by the discrete change elements marked in Figure 2 as “Order_quantity” and “Generate_ship_other”, or contained in the subgroups “Waste_manufacturer” and “Production_quantity”. Data on the daily delivery of goods from the warehouse (to the supermarket and to other customers) and on the method of filling stocks were determined from the questionnaire filled in the manufacturer’s warehouse. The reliability of the information gathered from the questionnaire is confirmed by the warehouse manager. The total amount of product shipment from the warehouse is defined by the element “Output_M”, which is also a control element for checking the compliance of the model results with the values in the real system.
The element “Daily_ship_other_cust” enabled the consolidation of data on the daily delivery of products to other customers for a period of one year. The quantity of products delivered from the manufacturer’s warehouse to other customers is defined through the basic parameters of probability distribution: the mathematical expectation of daily delivery and standard deviation. This data is also determined via a questionnaire completed in the manufacturer’s warehouse.
Elements grouped into the subgroup “Production_quantity” (Figure 4) enabled the replenishment of the stocks at the manufacturer, which is done from the production process. When the stock level in the warehouse falls to a defined level (inventory level is entered in the element “Launch_production”), the condition for starting production (“Production”) of the quantity defined in the element “Quantity_production” is fulfilled. The total annual production is in the element “Year_production”, which is also the control element for checking the compliance of the model results with the values collected in the real system.
In order to calculate the waste in the model, three subgroups of elements are used: “Waste_supermarket”, “Waste_manufacturer”, and “Total_waste”. The quantity of expired products in the supermarket is calculated in the subgroup “Waste_supermarket” (Figure 5). This group of elements is, in accordance with Equation (2), related to the inventory level (Inventory S), i.e., to the stock filling quantity (Order_quantity) and the sales quantity (Daily_sale). Elements Quantity_waste and Life_time (follows exponential distribution with rate δ) define product shelf-life characteristics (product is perishable and inventory can be composed of units of different ages), event type, and event rate (withdrawal of a product from sale), while element Generates_waste initiates withdrawal of expired products (when the defined conditions are met). The element “W_S” accumulates the total waste generated in the supermarket.
Subgroup “Waste_manufacturer” (Figure 6) is based on the same structure of elements as for the supermarket, but with parameters (type of event, rate) related to the manufacturer.
Subgroup “Total_waste” (Figure 7), through the element “W_total”, summarizes the total waste generated in the supermarket, other customers, and producers and calculates the cost of waste.
To calculate other stock indicators in the model, three subgroups were used: “Inventory_performances_S”, “Inventory_performances_M”, and “Inventory_performances_part_SC”. Subgroup “Inventory_performances_S” (Figure 8) combines the elements for determining the indicators of stocks in the supermarket. The element “Sum_inv_S” summarizes the daily stocks for a year. The element “Daily_inv_S” calculates the average daily stocks (according to Equation (1)) whose value is conserved in “INV_S”. The element “Daily_inv_cost_S”, in accordance with Equation (3), calculates the daily cost of inventory. The values determined in this way are accumulated in “Ci_S”, which results in the annual costs of stocks in the supermarket. The stock turnover ratio in the supermarket is (according to Equation (4)) calculated in the element “Kt_S”, and the stock turnover time is determined in the element “Tt_S” (according to Equation (5)).
Subgroup “Inventory_performances_M” combines the elements for determining the stock indicators in the manufacturer’s warehouse (Figure 9). Determination of average stocks (“INV_M”), stock costs (“Ci_M”), stock turnover ratio (“Kt_M”), and turnover time (“Tt_M”) is based on the same element structure as for the supermarket but with stock parameter values at the manufacturer. Additionally, storage costs are determined here using the elements “Daily_inv_M”, which calculates average daily stocks, and “Daily_warehouse_cost_M”, which calculates daily storage costs according to Equation (6). The values thus determined are cumulated in “Cw_M”, thus obtaining the annual storage costs.
Subgroup “Inventory_performances_part_SC” includes elements for determining inventory indicators that refer only to a part of the chain, i.e., on the flow of material between the manufacturer and the supermarket (Figure 10). The same logic is used here as when determining the indicators of stocks in the supermarket and at the manufacturer, but the number of elements is slightly higher because the flow that ends in the supermarket is separated from the total flow of materials from the manufacturer (based on data taken from the completed questionnaire at the manufacturer). For example, the elements “Inv_part_SC” and “Sum_inv_M_part_SC” made it possible to separate the part intended for the supermarket from the daily stocks of the manufacturer. These stocks are summarized with the daily stocks in the supermarket for one year (“Sum_inv_chain_M_S”). The “Daily_inv_chain_M_S” element is used to calculate average daily stocks for the part of the product flow between the manufacturer and the supermarket. This value is stored in “INV_chain_M_S”.

4. Simulation Results and Discussion

This section presents and discusses the results of the previously described simulation models. Food waste generated as a result of the functioning of the described models is shown in Table 2. Food waste is shown in the absolute amount of package units (mass) and value, but also as a share in the total procurement/production of participants.
Direct comparison of the obtained results with the available data from the literature is not possible because different studies used different methodologies and reference bases. However, the results shown in Table 2 generally confirmed the outputs and assumptions from the current literature [36,37,80], indicating a significant (worrying) share of waste from dairy products (13.23%) in the total amount of the product. Accordingly, a total of 15% of perishable products are lost in retail [80], of which 6% comes from dairy products [37]. The established rates of reduction of waste from dairy products in the supermarket of 29.41% and at by producer 38.52% are partly a consequence of the high share of waste in the observed chain. Nevertheless, the obtained results showed that better matching of product supply with their demand supported by the real-time exchange of accurate information between participants led to waste reduction, thus improving the sustainability of the perishable supply chain. It may seem that the amounts of waste reduction determined in this way (45 packages/year in the supermarket, 1370 packages/year at the producer’s site and the associated packaging waste) do not significantly contribute to the sustainability of food systems; however, this refers to only one type of dairy product from one manufacturer, while the dozens of products are delivered to the supermarket in the same or similar way, pointing out that the significance of the obtained results should be understood in that context. In addition, the visibility of products that are closer to the expiration date and the warning of such events can trigger a timely price discount and improve product sales, which can further reduce waste. When the products expire, they become waste, and in addition, the resources involved in their production and logistics are consumed. Therefore, in addition to the reduction of waste from the environmental aspect, the economic implications for the business operations of supermarkets and producers must not be neglected. The ability to meet customer demand without large waste improves the sustainability of companies.
As an additional evaluation of the benefits of the proposed optimization, the simulations also determined the basic measures of inventory management efficiency such as average inventories (INV), inventory turnover ratio (Kt), and turnover time (Tt). The value of these inventory performances for the supermarket and the manufacturer and for the entire supply chain are summarized in Table 3.
By comparing the obtained results for inventory indicators in the two-stage supply chain (producer–supermarket), the effects of changes in inventory management and application of RFID technology can be summarized:
  • Stocks in the chain are reduced on average by 11.07% (20.54% in the supermarket and 8.69% at the producer);
  • The product flow time through the chain is reduced by 11%, i.e., from 11 to 10 days;
  • Inventory costs are reduced by 8.69% for the producer and 20.60% in retail;
  • Product storage costs are reduced by 8.69%.
The proposed changes in inventory management, supported by the real-time exchange of accurate information between the producers and supermarkets, reduce the number of days the products are kept in stock. As a result, other inventory performances were improved without major changes in the functioning of the observed supply chain (even the number of deliveries to the supermarket was reduced by 10% in a year, while production start-up increased by about 7%). The cost of inventories in the chain has been reduced by about 12%.
The study clearly verifies the positive effects of the RFID application on the inventory management and waste reduction in the food supply chain. The simulation results show the impact of RFID expressed as quantitative values and not just as estimates. To our knowledge there is a lack of literature that provides concrete values about the food waste obtained in real case studies, which this research provides. Therefore, this research has implications for both academics and practitioners. Academics can use the obtained results as modeling parameters for logistics, supply chain, and retail studies. For practitioners, the presented simulation results can help at identifying implementation areas with the greatest impact of RFID. The structure of the considered two-stage supply chain (producer–supermarket) enables practical correlation of the studied example and its results with most of the real case perishable products distribution systems. Therefore, the obtained results can be used as the input parameters for cost–benefit analysis of RFID implementation and therefore better estimation of ROI and the payback period in similar distribution systems. In addition, this paper can help food producers in understanding importance of collaboration between them and retailers, in order to decrease food waste in the supply chain. This research proves that reduction of food waste and related costs, as well as its environmental impact, directly depend on the level of attention given to where, why, and how much out-of-date stock occurs. In more synchronized supply chains, which use digital technologies and data sharing systems, out-of-date or obsolete stock could be reduced significantly.
However, it is important to underline that practitioners have to identify revenue enhancing opportunities of the RFID implementation in each particular distribution system, because maximizing the benefits involves not only implementation but also efficient integration of the RFID data into existing enterprise resource planning, customer relationship management, and supply chain management applications.

5. Conclusions

The development of sustainable supply chains is focused on improving economic, environmental, and social benefits. Waste reduction is one of the primary goals of the concept of sustainability, and when it comes to food, the implications are even broader. In order to reduce food waste in supply chains, various initiatives have been launched (recovery and donation of food, food waste valorization, and use for animal feed), and in this research, the focus is on waste prevention.
In this paper the effects of changes in inventory management are investigated, supported by the application of RFID and modern information and communication technologies, in relation to the amount of waste in food supply chains. Due to the potential of RFID technology for logistics and supply chains (high-speed reading, simultaneous reading of multiple objects even out of visual range, storage of large amounts of data, direct communication with the product, product traceability, etc.), it was considered useful to explore this technology as the first step towards full digitization of the process.
The effects of changes were identified in inventory management through simulation modelling. The following outcomes were obtained: waste from dairy products was reduced by 29.41% in the supermarket and by 38.52% at the producer; stocks in the supermarket were reduced by 20.54% and at the producer by 8.69%; and the number of days the products were in stock was reduced by one day. When interpreting the obtained results, one should keep in mind the fact that only one type of dairy products from one producer was observed and that dozens of products are delivered to the supermarket in the same or similar way, so that multiplied benefits can be expected (both ecologically and economically).
Because a large number of food products are manipulated in retail supply chains, many of which are perishable, any reduction in waste, time, and cost is an important business advantage. The determined stock performance has positive economic implications on the business operation of the supermarket and producer. Quantification of these effects for reference flows of goods represents the main contribution of the research and can serve as a foundation for further research in the sustainability domain.
The limitation of this research is that only one type of dairy product was analyzed and that the available data are only for the observed supermarket–producer chain. Additionally, in the context of food quality and safety, it is necessary to ensure full traceability of products starting from the source (nutrition and milking of cows) to consumption (final consumer), which means that research should be extended to the entire supply chain. Based on everything discussed, future research will include multi-echelon supply chains and the whole group of products, in order to comprehensively investigate the effects that will be achieved by full information integration of participants in the supply chain via RFID technology.

Author Contributions

Conceptualization, S.N. and M.K.; Data curation, D.M. and S.B.; Methodology, S.N., M.K., and M.M.; Supervision, S.B. and D.M.; Writing—original draft, S.N., M.K., M.M., D.M., and S.B. All authors have read and agreed to the published version of the manuscript.

Funding

This research received no external funding.

Institutional Review Board Statement

Not applicable.

Informed Consent Statement

Not applicable.

Data Availability Statement

Nor applicable.

Acknowledgments

The realization of this paper has been supported by the Serbian Ministry of Education, Science and Technological Development program through the projects no. 451-03-9/2021-14/200156: “Innovative scientific and artistic research from the FTS (activity) domain”, as well as by the Danube Transnational Programme, through the project DTP1-050-3.1: “Regional and Transport Development in the Danube-Black Sea Region towards the Transnational Multiport Gateway Region (DBS Gateway Region)”.

Conflicts of Interest

The authors declare no conflict of interest.

References

  1. Global Food Losses and Food Waste—Extent, Causes and Prevention; Food and Agriculture Organization of the United Nations: Rome, Italy, 2011; Available online: http://www.fao.org/3/i2697e/i2697e.pdf (accessed on 21 December 2020).
  2. Mendoza-Fong, J.R.; García-Alcaraz, J.L.; Macías, E.J.; Hernández, N.L.I.; Díaz-Reza, J.R.; Fernández, J.B. Role of information and communication technology in green supply chain implementation and companies’ performance. Sustainability 2018, 10, 1793. [Google Scholar] [CrossRef] [Green Version]
  3. Evangelista, R.; Guerrieri, P.; Meliciani, V. The economic impact of digital technologies in Europe. Econ. Innov. New Technol. 2014, 23, 802–824. [Google Scholar] [CrossRef]
  4. Nagy, J.; Oláh, J.; Erdei, E.; Máté, D.; Popp, J. The role and impact of industry 4.0 and the internet of things on the business strategy of the value chain—The case of Hungary. Sustainability 2018, 10, 3491. [Google Scholar] [CrossRef] [Green Version]
  5. Chae, B.K.; Olson, D.L. Business analytics for supply chain: A dynamic-capabilities framework. Int. J. Inf. Technol. Decis. Mak. 2013, 12, 9–26. [Google Scholar] [CrossRef] [Green Version]
  6. Kaipia, R.; Dukovska-Popovska, I.; Loikkanen, L. Creating sustainable fresh food supply chains through waste reduction. Int. J. Phys. Distrib. Logist. Manag. 2013, 43, 262–276. [Google Scholar] [CrossRef] [Green Version]
  7. Liljestrand, K. Logistics solution for reducing food waste. Int. J. Phys. Distrib. Logist. Manag. 2017, 47, 318–339. [Google Scholar] [CrossRef]
  8. Katajajuuri, J.-M.; Silvennoinen, K.; Hartikainen, H.; Heikkila, L.; Reinikainen, A. Food waste in the Finish food chain. J. Clean. Prod. 2014, 73, 322–329. [Google Scholar] [CrossRef]
  9. Goodman-Smith, F.; Mirosa, M.; Skeaff, S. A mixed-methods study of retail food waste in New Zealand. Food Policy 2020, 92, 101845. [Google Scholar] [CrossRef]
  10. Schneider, F.; Lebersorger, S.; Scherhaufer, S. Food waste at the food retail -statistical approach to identifying influencing factors. In Proceedings of the Fourteenth International Waste Management and Landfill Symposium, Cagliari, Italy, 30 September–4 October 2013; Abstract, 59. Full paper on CD. Cossu, R., He, P., Kjeldsen, P., Matsufuji, Y., Reinhart, D., Stegmann, R., Eds.; CISA Publisher: Padova, Italy, 2013. [Google Scholar]
  11. CSCMP. Available online: https://cscmp.org/CSCMP/Educate/SCM_Definitions_and_Glossary_of_Terms/CSCMP/Educate/SCMDefinitions_and_Glossary_of_Terms.aspx?hkey=60879588-f65f-4ab5-8c4b-6878815ef921 (accessed on 4 March 2019).
  12. Martins, C.L.; Pato, M.V. Supply chain sustainability: A tertiary literature review. J. Clean. Prod. 2019, 225, 995–1016. [Google Scholar] [CrossRef]
  13. Winkelhaus, S.; Grosse, E.H. Logistics 4.0: A systematic review towards a new logistics system. Int. J. Prod. Res. 2020, 58, 18–43. [Google Scholar] [CrossRef]
  14. Mincer, J. The color of money: Sustainability has become more than a buzzword among corporations. It has become smart business. Wall Street Journal, 6 October 2008. Available online: http://online.wsj.com/article/SB122305414262702711.html (accessed on 15 February 2021).
  15. Ansari, Z.N.; Kant, R. A state-of-art literature review reflecting 15 years of focus on sustainable supply chain management. J. Clean. Prod. 2017, 142, 2524–2543. [Google Scholar] [CrossRef]
  16. Wang, J.; Zhang, D. Study on the mechanism of logistics system sustainability. In Proceedings of the 2007 IEEE International Conference on Automation and Logistics, Jinan, China, 18–21 August 2007; pp. 2165–2169. [Google Scholar]
  17. Liu, S.; Kasturiratne, D.; Moizer, J. A hub-and-spoke model for multidimensional integration of green marketing and sustainable supply chain management. Ind. Mark. Manag. 2012, 41, 581–588. [Google Scholar] [CrossRef]
  18. Davis-Sramek, B.; Thomas, R.W.; Fugate, B.S. Integrating behavioral decision theory and sustainable supply chain management: Prioritizing economic, environmental, and social dimensions in carrier selection. J. Bus. Logist. 2018, 39, 87–100. [Google Scholar] [CrossRef]
  19. Seuring, S.; Mülle, M. From a literature review to a conceptual framework for sustainable supply chain management. J. Clean. Prod. 2008, 16, 1699–1710. [Google Scholar] [CrossRef]
  20. Tajbakhsh, A.; Hassini, E. Performance measurement of sustainable supply chains: A review and research questions. Int. J. Product. Perform. Manag. 2015, 64, 744–783. [Google Scholar] [CrossRef]
  21. United Nations. Transforming our World: The 2030 Agenda for Sustainable Development. Available online: https://sustainabledevelopment.un.org/post2015/transformingourworld (accessed on 12 December 2020).
  22. Grizzetti, B.; Pretato, U.; Lassaletta, L.; Billen, G.; Garnier, J. The contribution of food waste to global and European nitrogen pollution. Environ. Sci. Policy 2013, 33, 186–195. [Google Scholar] [CrossRef]
  23. Food Losses and Waste in the Context of Sustainable Food Systems; HLPE Report 8, June 2014. Available online: www.fao.org/cfs/cfs-hlpe (accessed on 10 December 2020).
  24. Rosenlund, J.; Nyblom, A.; Ekholm, H.M. The emergence of food waste as an issue in Swedish retail. Br. Food J. 2020, 122, 3283–3296. [Google Scholar] [CrossRef]
  25. Reducing Food Waste: How Can Retailers Help? Oliver Wyman, Marsh & McLennan Companies: New York, NY, USA, 2014; Available online: https://www.oliverwyman.com/content/dam/oliver-wyman/global/en/2014/jul/OW_Reducing_Food_Waste.pdf (accessed on 25 May 2021).
  26. Cicatiello, C.; Franco, S.; Pancino, B.; Blasi, E.; Falasconi, L. The dark side of retail food waste: Evidences from in-store data. Resour. Conserv. Recycl. 2017, 125, 273–281. [Google Scholar] [CrossRef]
  27. Giuseppe, A.; Mario, E.; Cinzia, M. Economic benefits from food recovery at the retail stage: An application to Italian food chains. Waste Manag. 2014, 34, 1306–1316. [Google Scholar] [CrossRef] [PubMed]
  28. Moraes, C.C.; Oliveira Costa, F.H.; Pereira, C.R.; Silva, A.L.; Delai, I. Retail food waste: Mapping causes and reduction practices. J. Clean. Prod. 2020, 256, 120124. [Google Scholar] [CrossRef]
  29. Duong, L.N.K.; Wood, L.C.; Wang, W.Y.C. Effects of consumer demand, product lifetime, and substitution ratio on perishable inventory management. Sustainability 2018, 10, 1559. [Google Scholar] [CrossRef] [Green Version]
  30. Lin, C.S.K.; Koutinas, A.A.; Stamatelatou, K.; Mubofu, E.B.; Matharu, A.S.; Kopsahelis, N.; Pfaltzgraff, L.A.; Clark, J.H.; Papanikolaou, S.; Kwan, T.H.; et al. Current and future trends in food waste valorization for the production of chemicals, materials and fuels: A global perspective. Biofuels Bioprod. Biorefining 2014, 8, 686–715. [Google Scholar] [CrossRef]
  31. Kummu, M.; De Moel, H.; Porkka, M.; Siebert, S.; Varis, O.; Ward, P.J. Lost food, wasted resources: Global food supply chain losses and their impacts on freshwater, cropland, and fertiliser use. Sci. Total Environ. 2012, 438, 477–489. [Google Scholar] [CrossRef] [PubMed]
  32. The Environmental Food Crisis—The Environment’s Role in Averting Future Food Crises; United Nations Environment Program (UNEP): Arendal, Norway, 2009. Available online: https://gridarendal-website-live.s3.amazonaws.com/production/documents/:s_document/221/original/FoodCrisis_lores.pdf?1486728701 (accessed on 11 December 2020).
  33. Sakoda, G.; Takayasu, H.; Takayasu, M. Data science solutions for retail strategy to reduce waste keeping high profit. Sustainability 2019, 11, 3589. [Google Scholar] [CrossRef] [Green Version]
  34. Horos, I.K.; Ruppenthal, T. Avoidance of food waste from a grocery retail store owner’s perspective. Sustainability 2021, 13, 550. [Google Scholar] [CrossRef]
  35. Eriksson, M.; Strid, I.; Hansson, P.A. Food losses in six Swedish retail stores: Wastage of fruit and vegetables in relation to quantities delivered. Resour. Conserv. Recycl. 2012, 68, 14–20. [Google Scholar] [CrossRef]
  36. Lebersorger, S.; Schneider, F. Food loss rates at the food retail, influencing factors and reasons as a basis for waste prevention measures. Waste Manag. 2014, 34, 1911–1919. [Google Scholar] [CrossRef] [PubMed]
  37. Brancoli, P.; Rousta, K.; Bolton, K. Life cycle assessment of supermarket food waste. Resour. Conserv. Recycl. 2017, 118, 39–46. [Google Scholar] [CrossRef]
  38. Bauernhansl, T. Die Vierte Industrielle Revolution—Der Weg in ein Wertschaffendes Produktionsparadigma. In Industrie 4.0 in Produktion, Automatisierung und Logistik, Anwendung Technologien Migration; Bauernhansl, T., Ten Hompel, M., Birgit Vogel-Heuser, B., Eds.; Springer Vieweg: Wiesbaden, Germany, 2014; pp. 5–35. [Google Scholar]
  39. Kache, F.; Seuring, S. Challenges and opportunities of digital information at the intersection of big data analytics and supply chain management. Int. J. Oper. Prod. Manag. 2017, 37, 10–36. [Google Scholar] [CrossRef]
  40. Tu, Y.J.; Zhou, W.; Piramuthu, S. A novel means to address RFID tag/item separation in supply chains. Decis. Support Syst. 2018, 115, 13–23. [Google Scholar] [CrossRef]
  41. VDI Nachrichten, 49. RFID Technik Fehlen Standards; Beuth Verlag: Berlin, Germany, 2004. [Google Scholar]
  42. Sarac, A.; Absi, N.; Dauzere-Peres, S. A literature review on the impact of RFID technologies on supply chain management. Int. J. Prod. Econ. 2010, 128, 77–95. [Google Scholar] [CrossRef]
  43. Shin, S.; Eksioglu, B. Effects of RFID technology on efficiency and profitability in retail supply chains. J. Appl. Bus. Res. 2014, 30, 633–646. [Google Scholar] [CrossRef] [Green Version]
  44. Hardgrave, B.C.; Waller, M.; Miller, R.; Walton, S.M. Does RFID Reduce Out of Stocks? A Preliminary Analysis; Working Paper; University of Arkansas: Fayetteville, Arkansas, 2005. [Google Scholar]
  45. Behrenbeck, K.; Küpper, J.; Magnus, K.H.; Thonemann, V. Zwischen Euphorie und Skepsis—RFID kommt, der Handlungsdruck steigt: Welche Optionen besitzen Konsumgüterhersteller und Einzelhändler? Logist. Heute 2004, 12, 54–55. [Google Scholar]
  46. Becker, J.; Vilkov, L.; Weiß, B.; Winkelmann, A. A model based approach for calculating the process driven business value of RFID investments. Int. J. Prod. Econ. 2010, 127, 358–371. [Google Scholar] [CrossRef]
  47. Lee, I.; Lee, B.-C. An investment evaluation of supply chain RFID technologies: A normative modeling approach. Int. J. Prod. Econ. 2010, 125, 313–323. [Google Scholar] [CrossRef]
  48. Nikoličić, S.; Kilibarda, M.; Atanasković, P.; Duđak, L.; Ivanišević, A. Impact of RFID technology on logistic process efficiency in retail supply chains. Promet-Traffic Transp. 2015, 27, 137–146. [Google Scholar] [CrossRef] [Green Version]
  49. Bottani, E.; Rizzi, A. Economical assessment of the impact of RFID technology and EPC system on the fast-moving consumer goods supply chain. Int. J. Prod. Econ. 2008, 112, 548–569. [Google Scholar] [CrossRef]
  50. Zhang, L.H.; Li, T.; Fan, T.J. Radio-frequency identification (RFID) adoption with inventory misplacement under retail competition. Eur. J. Oper. Res. 2018, 270, 1028–1043. [Google Scholar] [CrossRef]
  51. Ustundag, A.; Tanyas, M. The impacts of Radio Frequency Identification (RFID) technology on supply chain costs. Transp. Res. Part E 2009, 45, 29–38. [Google Scholar] [CrossRef]
  52. Bhattacharya, M.; Chu, C.-H.; Hayya, J.; Mullen, T. An exploratory study of RFID adoption in the retail sector. Oper. Manag. Res. 2010, 3, 80–89. [Google Scholar] [CrossRef]
  53. Hardgrave, B.C.; Goyal, S.; Aloysiu, J.A. Improving inventory management in the retail store: The effectiveness of RFID tagging across product categories. Oper. Manag. Res. 2011, 4, 6–13. [Google Scholar] [CrossRef]
  54. De Kok, A.G.; Van Donselaar, K.H.; Van Woensel, T. A break-even analysis of RFID technology for inventory sensitive to shrinkage. Int. J. Prod. Econ. 2008, 112, 521–531. [Google Scholar] [CrossRef]
  55. Anandhi, S.; Anitha, R.; Sureshkumar, V. IoT enabled RFID authentication and secure object tracking system for smart logistics. Wirel. Pers. Commun. 2019, 104, 543–560. [Google Scholar] [CrossRef]
  56. Grunow, M.; Piramuthu, S. RFID in highly perishable food supply chains—Remaining shelf life to supplant expiry date? Int. J. Prod. Econ. 2013, 146, 717–727. [Google Scholar] [CrossRef]
  57. Verghese, K.; Lewis, H.; Lockrey, S.; Williams, H. The Role of Packaging in Minimising Food Waste in the Supply Chain of the Future; Final Report Prepared for CHEP Australia; RMIT University, Centre for Design: Melbourne, Australia, 2019. [Google Scholar]
  58. Zmienka, E.; Staniszewski, J. Food management innovations for reducing food wastage-a systematic literature review. Management 2020, 24, 193–207. [Google Scholar] [CrossRef]
  59. Chauhan, Y. Food waste management with technological platforms: Evidence from Indian food supply chains. Sustainability 2020, 12, 8164. [Google Scholar] [CrossRef]
  60. Lee, S.; Jung, K. Exploring effective incentive design to reduce food waste: A natural experiment of policy change from community based charge to RFID based weight charge. Sustainability 2017, 9, 2046. [Google Scholar] [CrossRef] [Green Version]
  61. Karkkainen, M.; Holstrom, J. Wireless product identification: Enabler for handling efficiency, customisation and information sharing. Supply Chain Manag. Int. J. 2002, 7, 242–252. [Google Scholar] [CrossRef] [Green Version]
  62. Collins, J.D.; Worthington, W.J.; Reyes, P.M.; Romero, M. Knowledge management, supply chain technologies and firm performance. Manag. Res. Rev. 2010, 33, 947–960. [Google Scholar] [CrossRef]
  63. Maslarić, M.; Nikoličić, S.; Mirčetić, D. Logistics response to the industry 4.0: The physical internet. Open Eng. 2016, 6, 511–517. [Google Scholar] [CrossRef]
  64. Arunachalam, D.; Niraj Kumar, N.; Kawalek, J.P. Understanding big data analytics capabilities in supply chain management: Unravelling the issues, challenges and implications for practice. Transp. Res. Part E 2018, 114, 416–436. [Google Scholar] [CrossRef]
  65. Hung, W.Y.; Samsatli, N.J.; Shah, N. Object-oriented dynamic supply-chain modelling incorporated with production scheduling. Eur. J. Oper. Res. 2006, 169, 1064–1076. [Google Scholar] [CrossRef]
  66. Van der Vorst, J.G. Effective Food Supply Chains: Generating, Modelling and Evaluating Supply Chain Scenarios. Ph.D. Thesis, Wageningen University, Wageningen, The Netherlands, 2000. [Google Scholar]
  67. Chilmon, B.; Tipi, N.S. Modelling and simulation considerations for an end-to-end supply chain system. Comput. Ind. Eng. 2020, 150, 106870. [Google Scholar] [CrossRef]
  68. Hoffa-Dabrowska, P.; Grzybowska, K. Simulation modeling of the sustainable supply chain. Sustainability 2020, 12, 6007. [Google Scholar] [CrossRef]
  69. Kesaraju, V.S.; Ciarallo, F.W. Integrated simulation combining process-driven and event-driven models. J. Simul. 2012, 6, 9–20. [Google Scholar] [CrossRef]
  70. Persson, F.; Araldi, M. The development of a dynamic supply chain analysis tool—Integration of SCOR and discrete event simulation. Int. J. Prod. Econ. 2009, 121, 574–583. [Google Scholar] [CrossRef]
  71. Chopra, S. Supply Chain Management: Strategy, Planning and Operation, 7th ed.; Pearson: Boston, MA, USA, 2019. [Google Scholar]
  72. Cigolini, R.; Pero, M.; Rossi, T.; Sianesi, A. Linking supply chain configuration to supply chain performance: A discrete event simulation model. Simul. Model. Pract. Theory 2014, 40, 1–11. [Google Scholar] [CrossRef]
  73. Fedorko, G.; Molnar, V.; Honus, S.; Neradilova, H.; Kampf, A.R. The application of simulation model of a milk run to identify the occurrence of failures. Int. J. Simul. Model. 2018, 17, 444–457. [Google Scholar] [CrossRef]
  74. Jung, H.; Jeong, S. The economic effect of virtual warehouse-based inventory information sharing for sustainable supplier management. Sustainability 2018, 10, 1547. [Google Scholar] [CrossRef] [Green Version]
  75. Stefanovic, D.; Stefanovic, N.; Radenkovic, B. Supply network modelling and simulation methodology. Simul. Model. Pract. Theory 2009, 17, 743–766. [Google Scholar] [CrossRef]
  76. Yuan, Y.; Viet, N.; Behdani, B. The impact of information sharing on the performance of horizontal logistics collaboration: A simulation study in an agri-food supply chain. IFAC PapersOnLine 2019, 52, 2722–2727. [Google Scholar] [CrossRef]
  77. Yao, Y.; Dresner, M. The inventory value of information sharing, continuous replenishment, and vendor-managed inventory. Transp. Res. Part E 2008, 44, 361–378. [Google Scholar] [CrossRef]
  78. RFID—Perspectives for Germany, The State of Radio Frequency Identification—Based Applications and Their Outlook in National and International Markets; Federal Ministry of Economics and Technology: Berlin, Germany, 2007.
  79. Angerer, A. The Impact of Automatic Store Replenishment Systems on Retail. Ph.D. Thesis, The University of St. Gallen: St. Gallen, Switzerland, 2005. [Google Scholar]
  80. Ferguson, M.; Ketzenberg, M.E. Information sharing to improve retail product freshness of perishables. Prod. Oper. Manag. 2006, 15, 57–73. [Google Scholar] [CrossRef]
Figure 1. Research domain (based on [77]).
Sustainability 13 06511 g001
Figure 2. The material flow diagram (inventory model).
Sustainability 13 06511 g002
Figure 3. Subgroup “Supermarkets_order”.
Sustainability 13 06511 g003
Figure 4. Subgroup “Production_quantity”.
Sustainability 13 06511 g004
Figure 5. Subgroup “Waste_supermarket”.
Sustainability 13 06511 g005
Figure 6. Subgroup “Waste_manufacturer”.
Sustainability 13 06511 g006
Figure 7. Subgroup “Total_waste”.
Sustainability 13 06511 g007
Figure 8. Subgroup “Inventory_performances_S”.
Sustainability 13 06511 g008
Figure 9. Subgroup “Inventory_performances_M”.
Sustainability 13 06511 g009
Figure 10. Subgroup “Inventory_performances_part_SC”.
Sustainability 13 06511 g010
Table 1. Stock replenishment parameters.
As-Is State–Model 1To-Be State–Model 2
SupermarketManufacturerSupermarketManufacturer
Product unitpackagepackagepackagepackage
Replenishment policy(T, S)(Q, s)(T, ss, S)(Q, s)
Review period (T)every day except Sunday-every day except Sunday-
Initial stock level9 packages2.500 packages9 packages2.500 packages
Ordering stock level (s)-2.700 packages μ d + 1.96 · σ d 1600 packages
Maximum stock level (S)10 packages
14 packages-Friday
- μ d ( T + L T ) + 1.96 · σ d   T + L T   μ d ( T + 2 L T ) + 1.96 · σ d   T + 2 L T -
Order quantity (Q)S-state5.000 packagesS-state (condition: state ≤ ss)10× demand
Annual production-145,000 packages-143,000 packages
Table 2. The loss rate of the observed dairy products.
As-Is State–Model 1To-Be State–Model 2Food Waste Reduction
Food Waste (Package)Food Waste (EUR)Participation * Food Waste (Package)Food Waste (EUR)Participation * PackageBy Weight (%)By Value (%)
Supermarket153971.558.73108685.806.654529.4129.41
Other customers15,47298,247.2011.0813,79887,617.309.91167410.8210.82
Manufacturer355713,658.882.4521878398.081.53137038.5238.52
Total19,182112,877.6313.2316,09396,701.188.89308916.1014.33
* Participation in the overall quantity of procurement/production (%).
Table 3. Inventory performance.
Inventory PerformancesAs-Is State–Model 1To-Be State–Model 2
Part of the Chain for SupermarketTotal ManufacturerPart of the Chain for SupermarketTotal Manufacturer
ManufacturerINVM (package)40.753415.4937.213118.64
CIM (EUR)39.123279.2035.722994.19
nm *-29-31
Kt-40.75-45.35
Tt (a day)-8.81-8.05
CW (EUR)19.341620.6517.661479.79
SupermarketINVS (package)10.278.16
CIS (EUR)16.3112.95
N *287258
Kt152.96190.56
Tt (a day)2.391.91
Supply chain
Manufacturer-Supermarket
INVSM (package)51.0245.37
CISM (EUR)55.4348.68
Kt30.7934.63
Tt (a day)11.209.96
nm * = number of production starts for a year; n = number of delivery cycles to the supermarket for a year.
Publisher’s Note: MDPI stays neutral with regard to jurisdictional claims in published maps and institutional affiliations.

