
How Will the Cost Change after Transformation in Public Nature-Based Attractions? A Framework and Case Study


Abstract
1. Introduction
2. Literature Review
2.1. Resource-Based Theory
2.2. A Function Analysis
2.3. Cost Structure
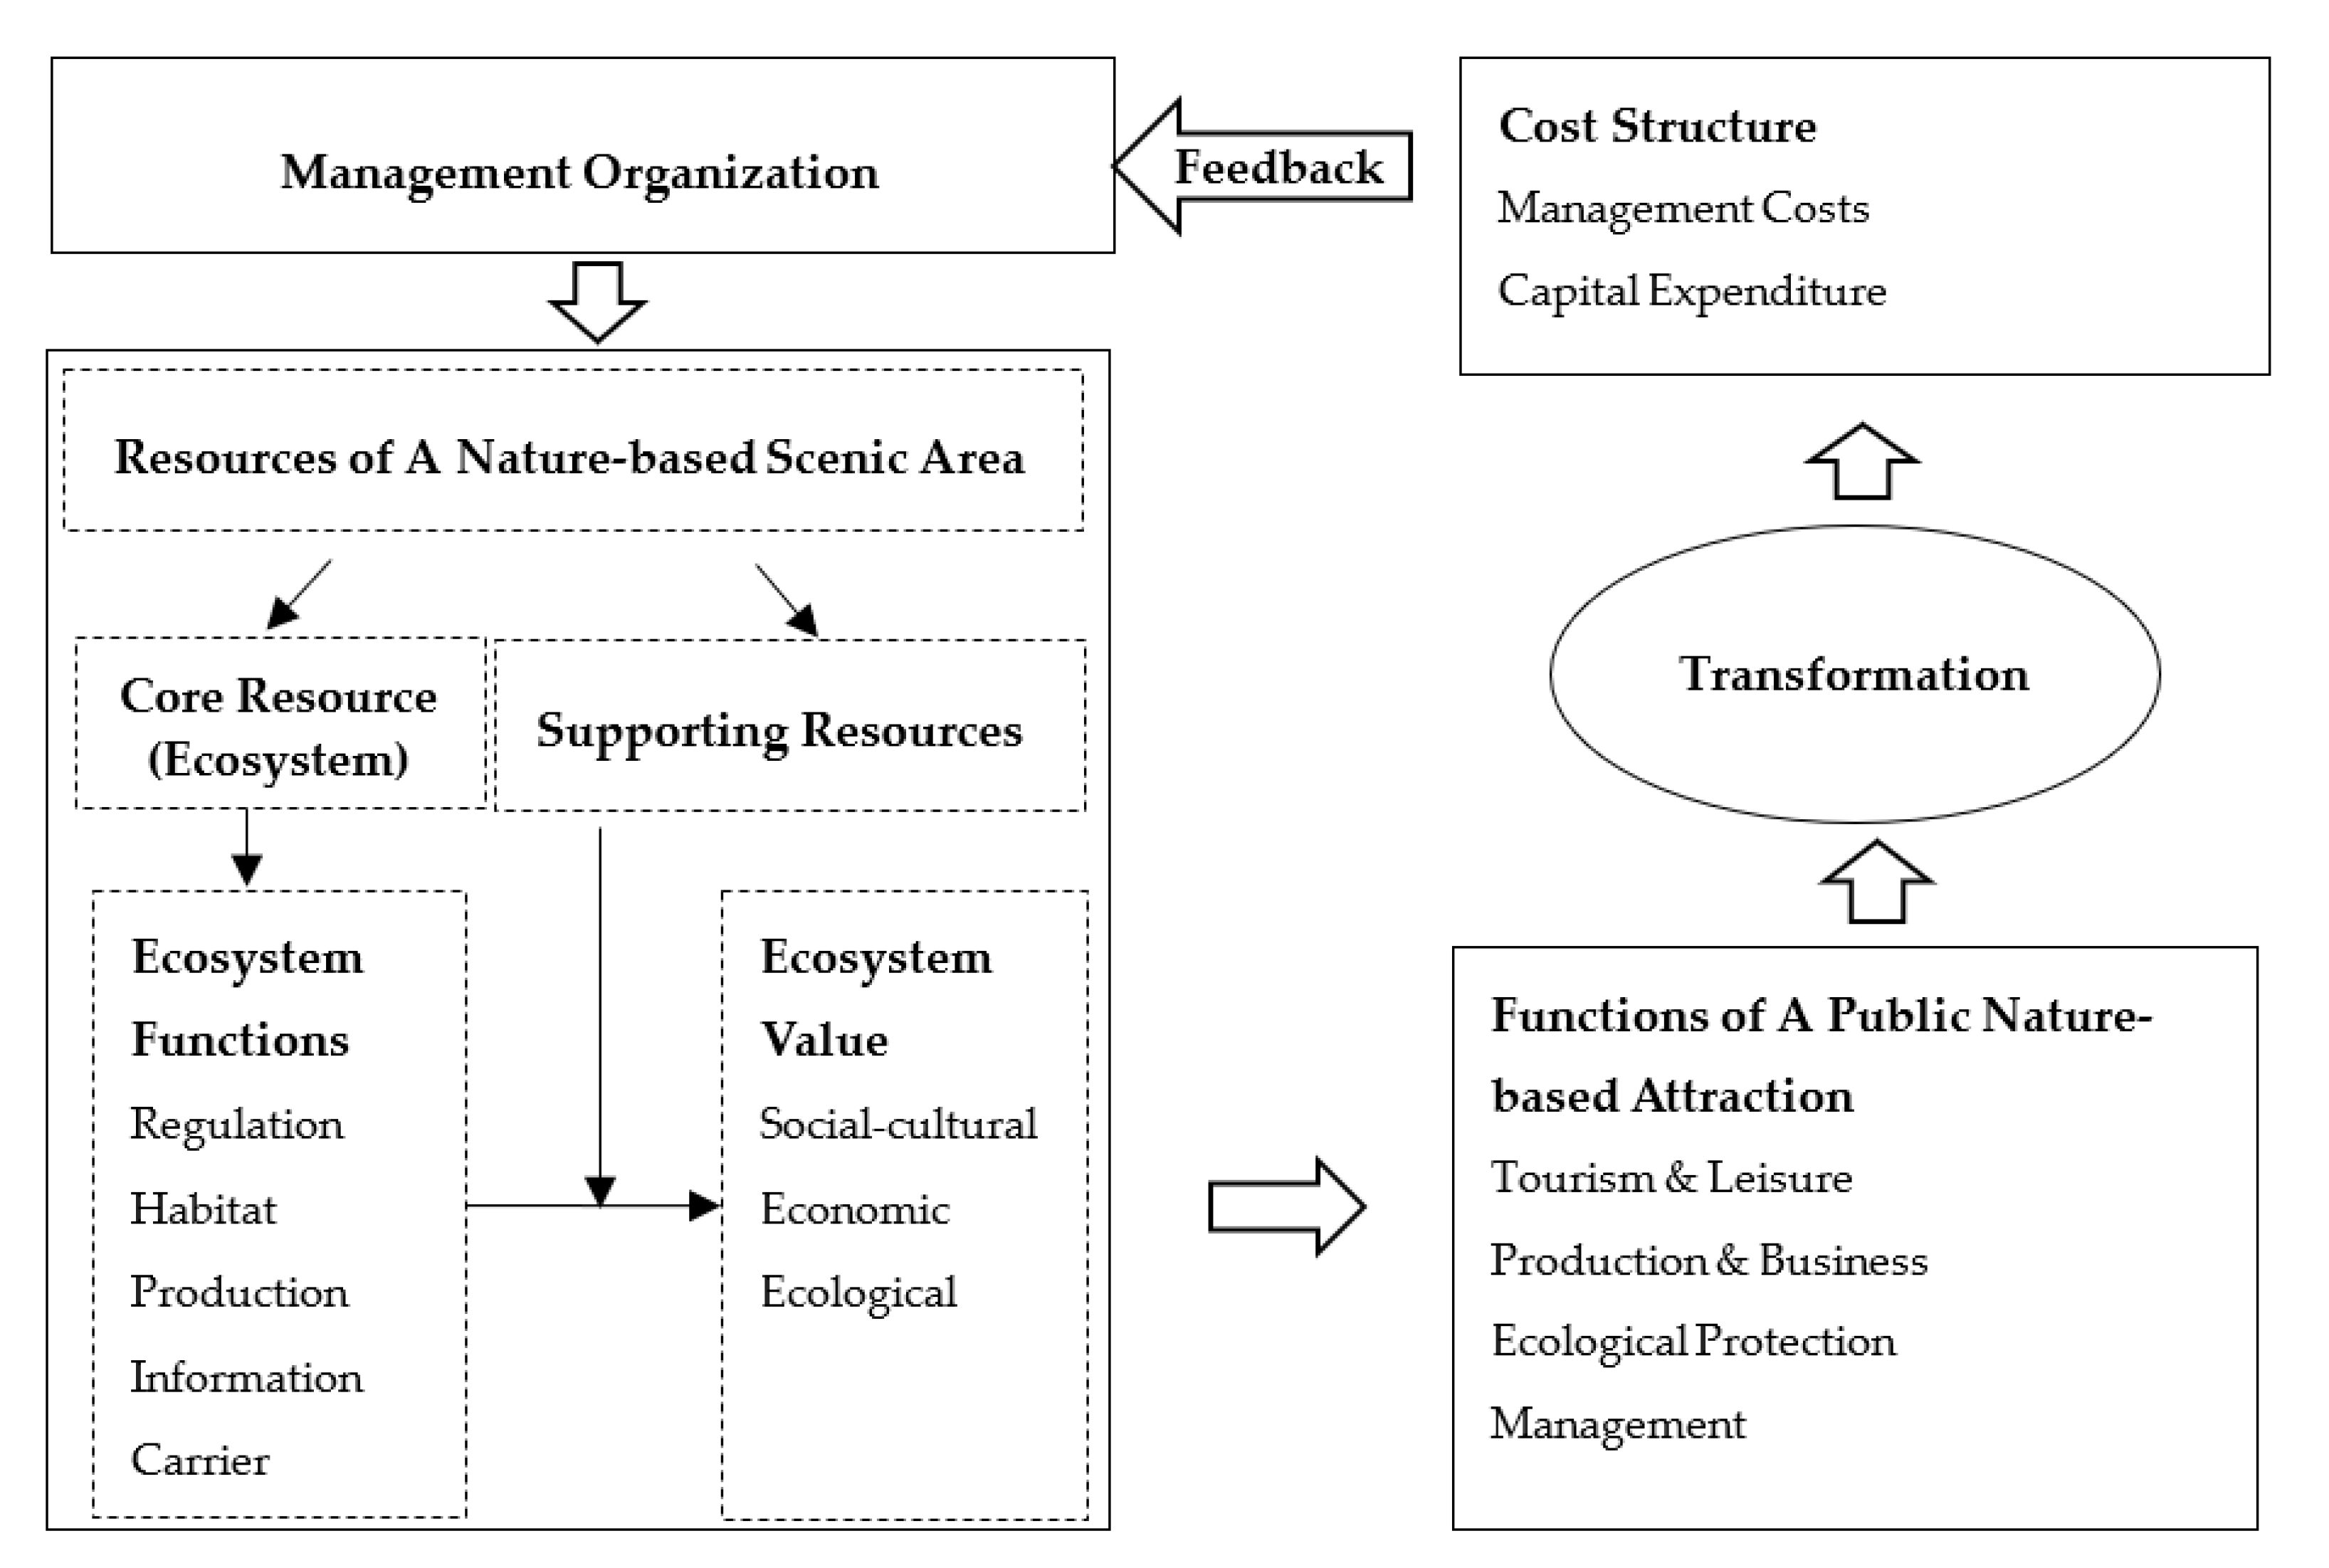
3. Research Framework
4. Methodology and Results
4.1. Methods
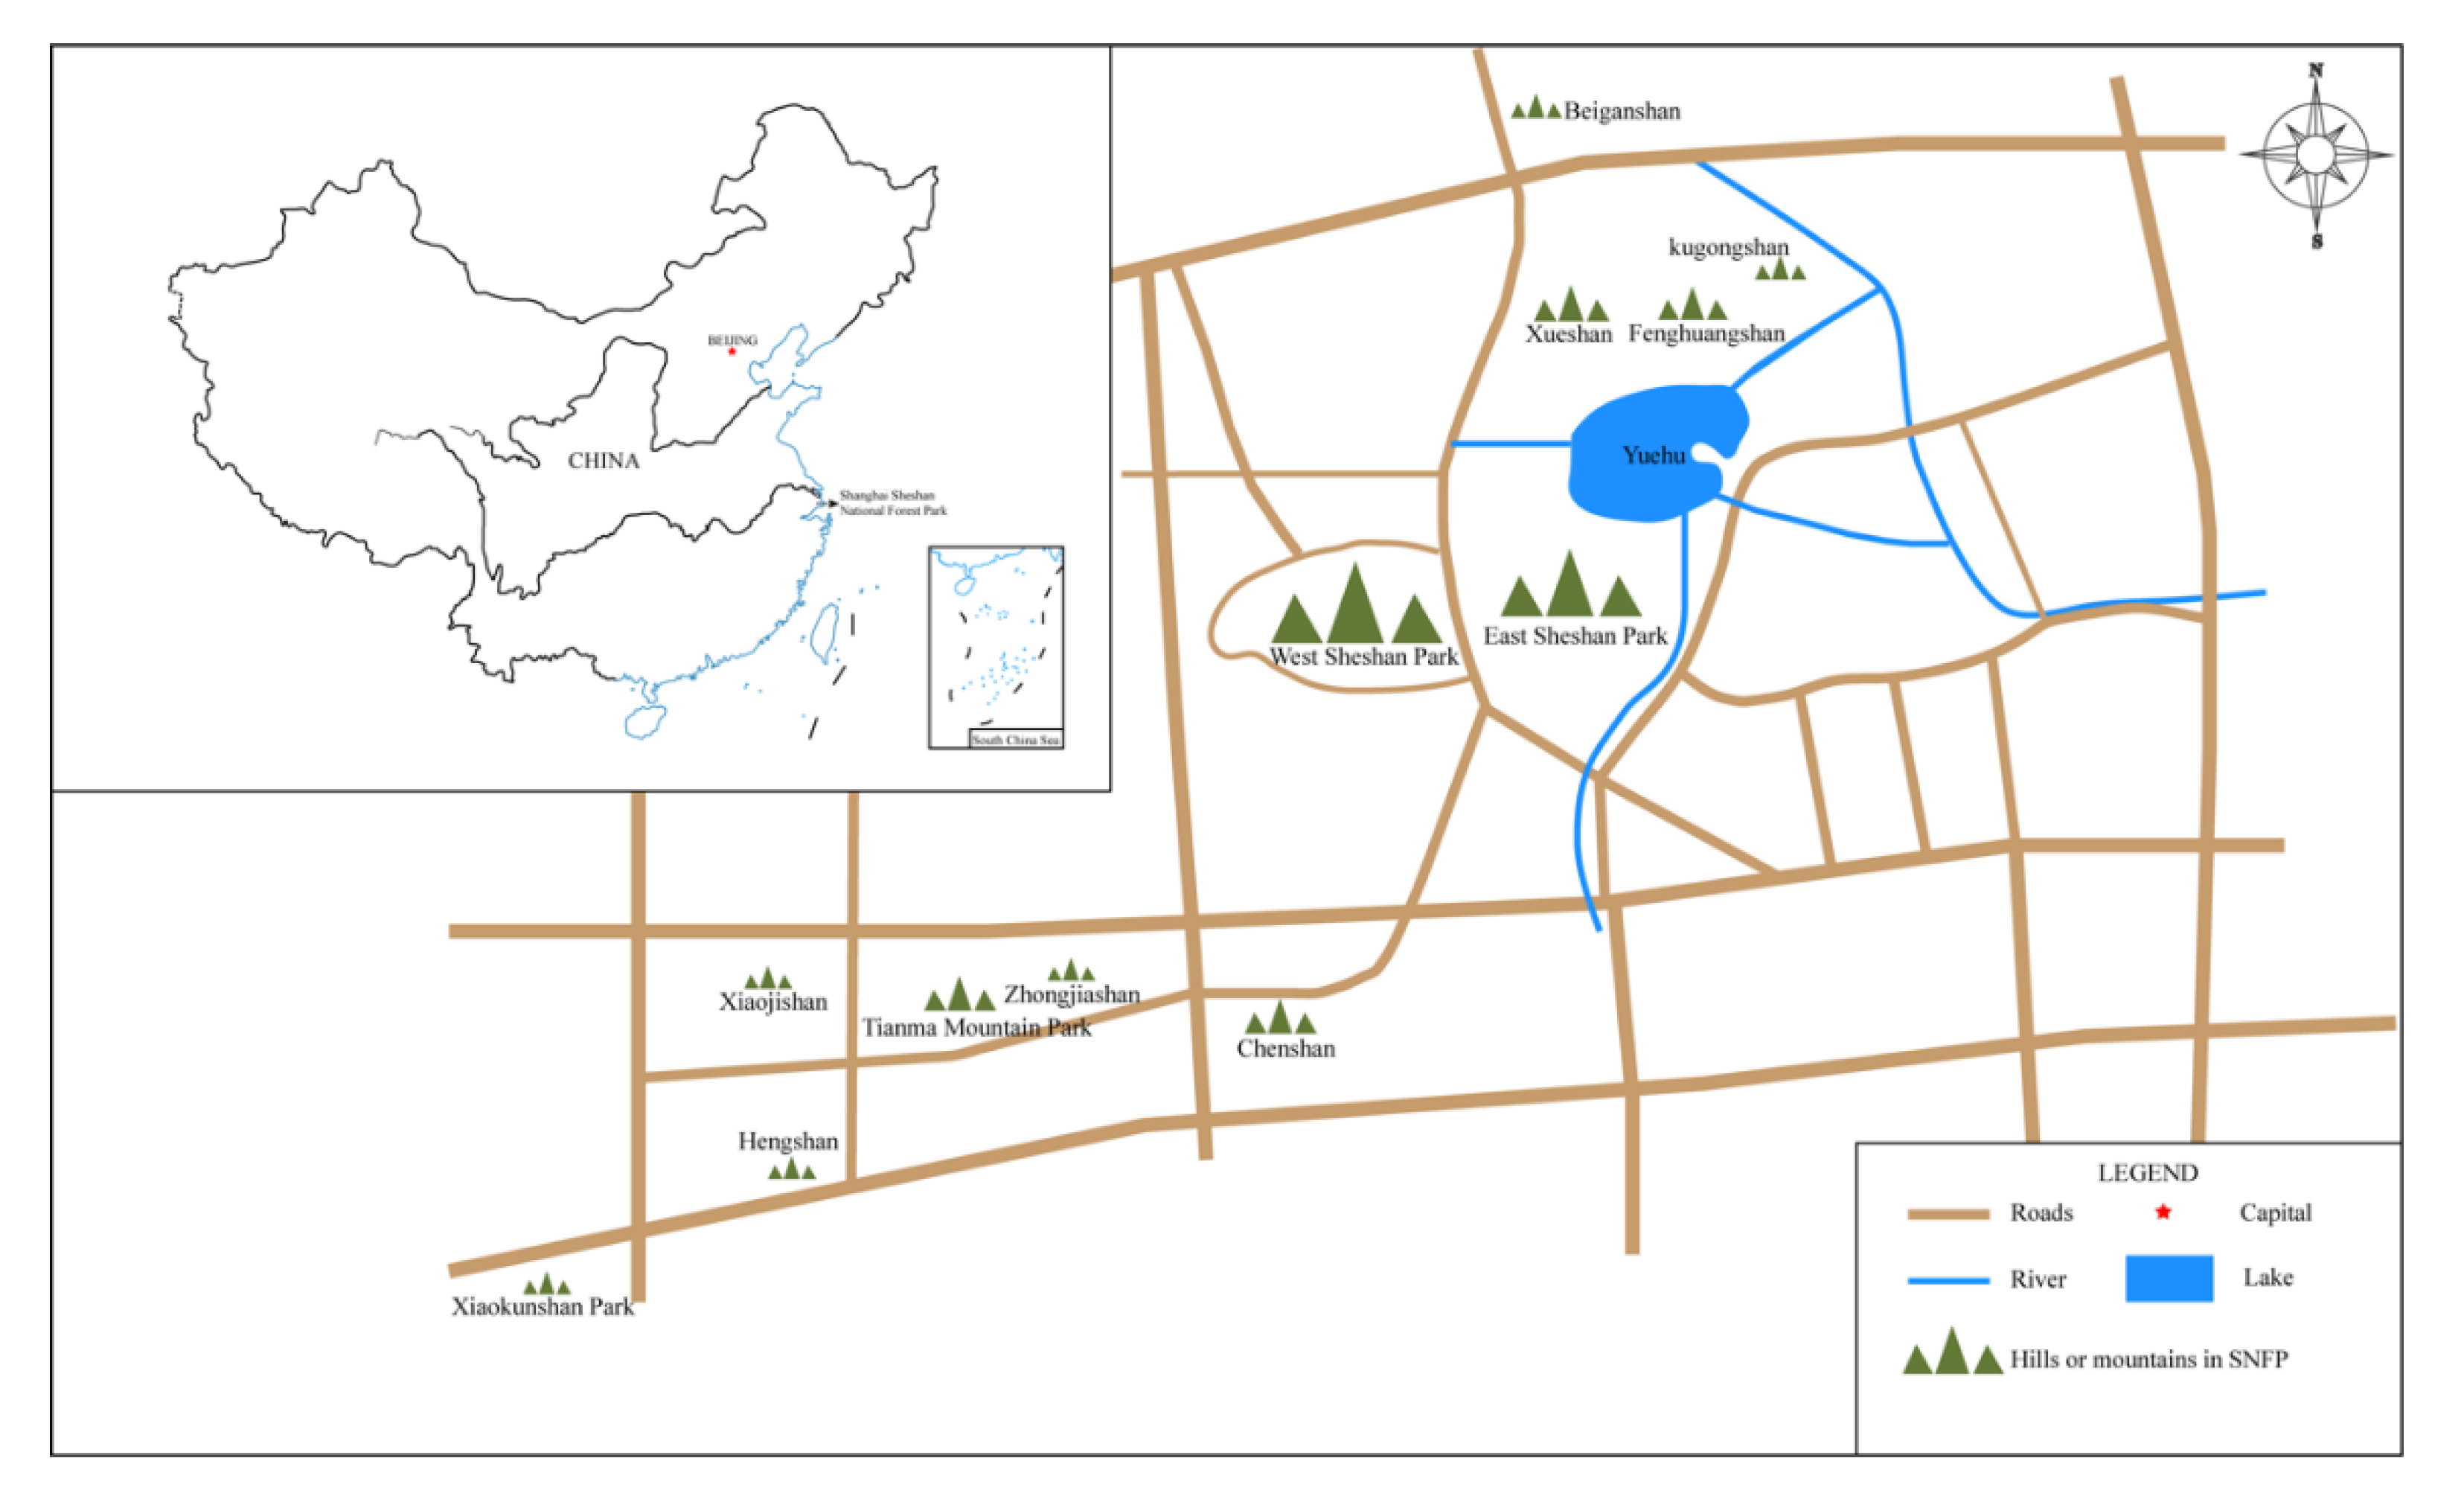
4.1.1. Study Area
4.1.2. Data Source
4.2. Results
4.2.1. Cost Structure of Each Stage in SNFP
“The era of mass tourism and self-driving tours brought huge challenges to the park. Attractiveness of the forest was limited and demand of tourist facilities decreased. The facilities also damaged the ecosystem. Since 2003 we had to close and remove the facilities and set about focusing on protection. For example, a tourism attraction named Bird Park was closed and cleared away in 2008. (This attraction) generated too much bird dung which was destructive to the soil. Also, the net built to define the range of bird activities damaged the forest undercanopy thereby had an impact on the entire ecology.”
“SNFP was selected to open for free because of its unique natural forest, known as the best in Shanghai. With the development of the local economy, more emphasis was placed by the local government on ecology and more pursuit of ecotourism than ever before. After free admission, SSFS was converted into a public institution fully funded by the local government, and our work focus is totally on the management of scenic spots, ecology protection, and fire prevention. All of these activities are for public welfare.”
“Before, the ticket was set to control the flow of visitors and cover the cost. Later, with the development of local economy, the government gradually considered that it had the ability to bear the cost and that the resource should be shared with the citizens for free. Therefore, SNFP was charged free in 2008 and 2010.”
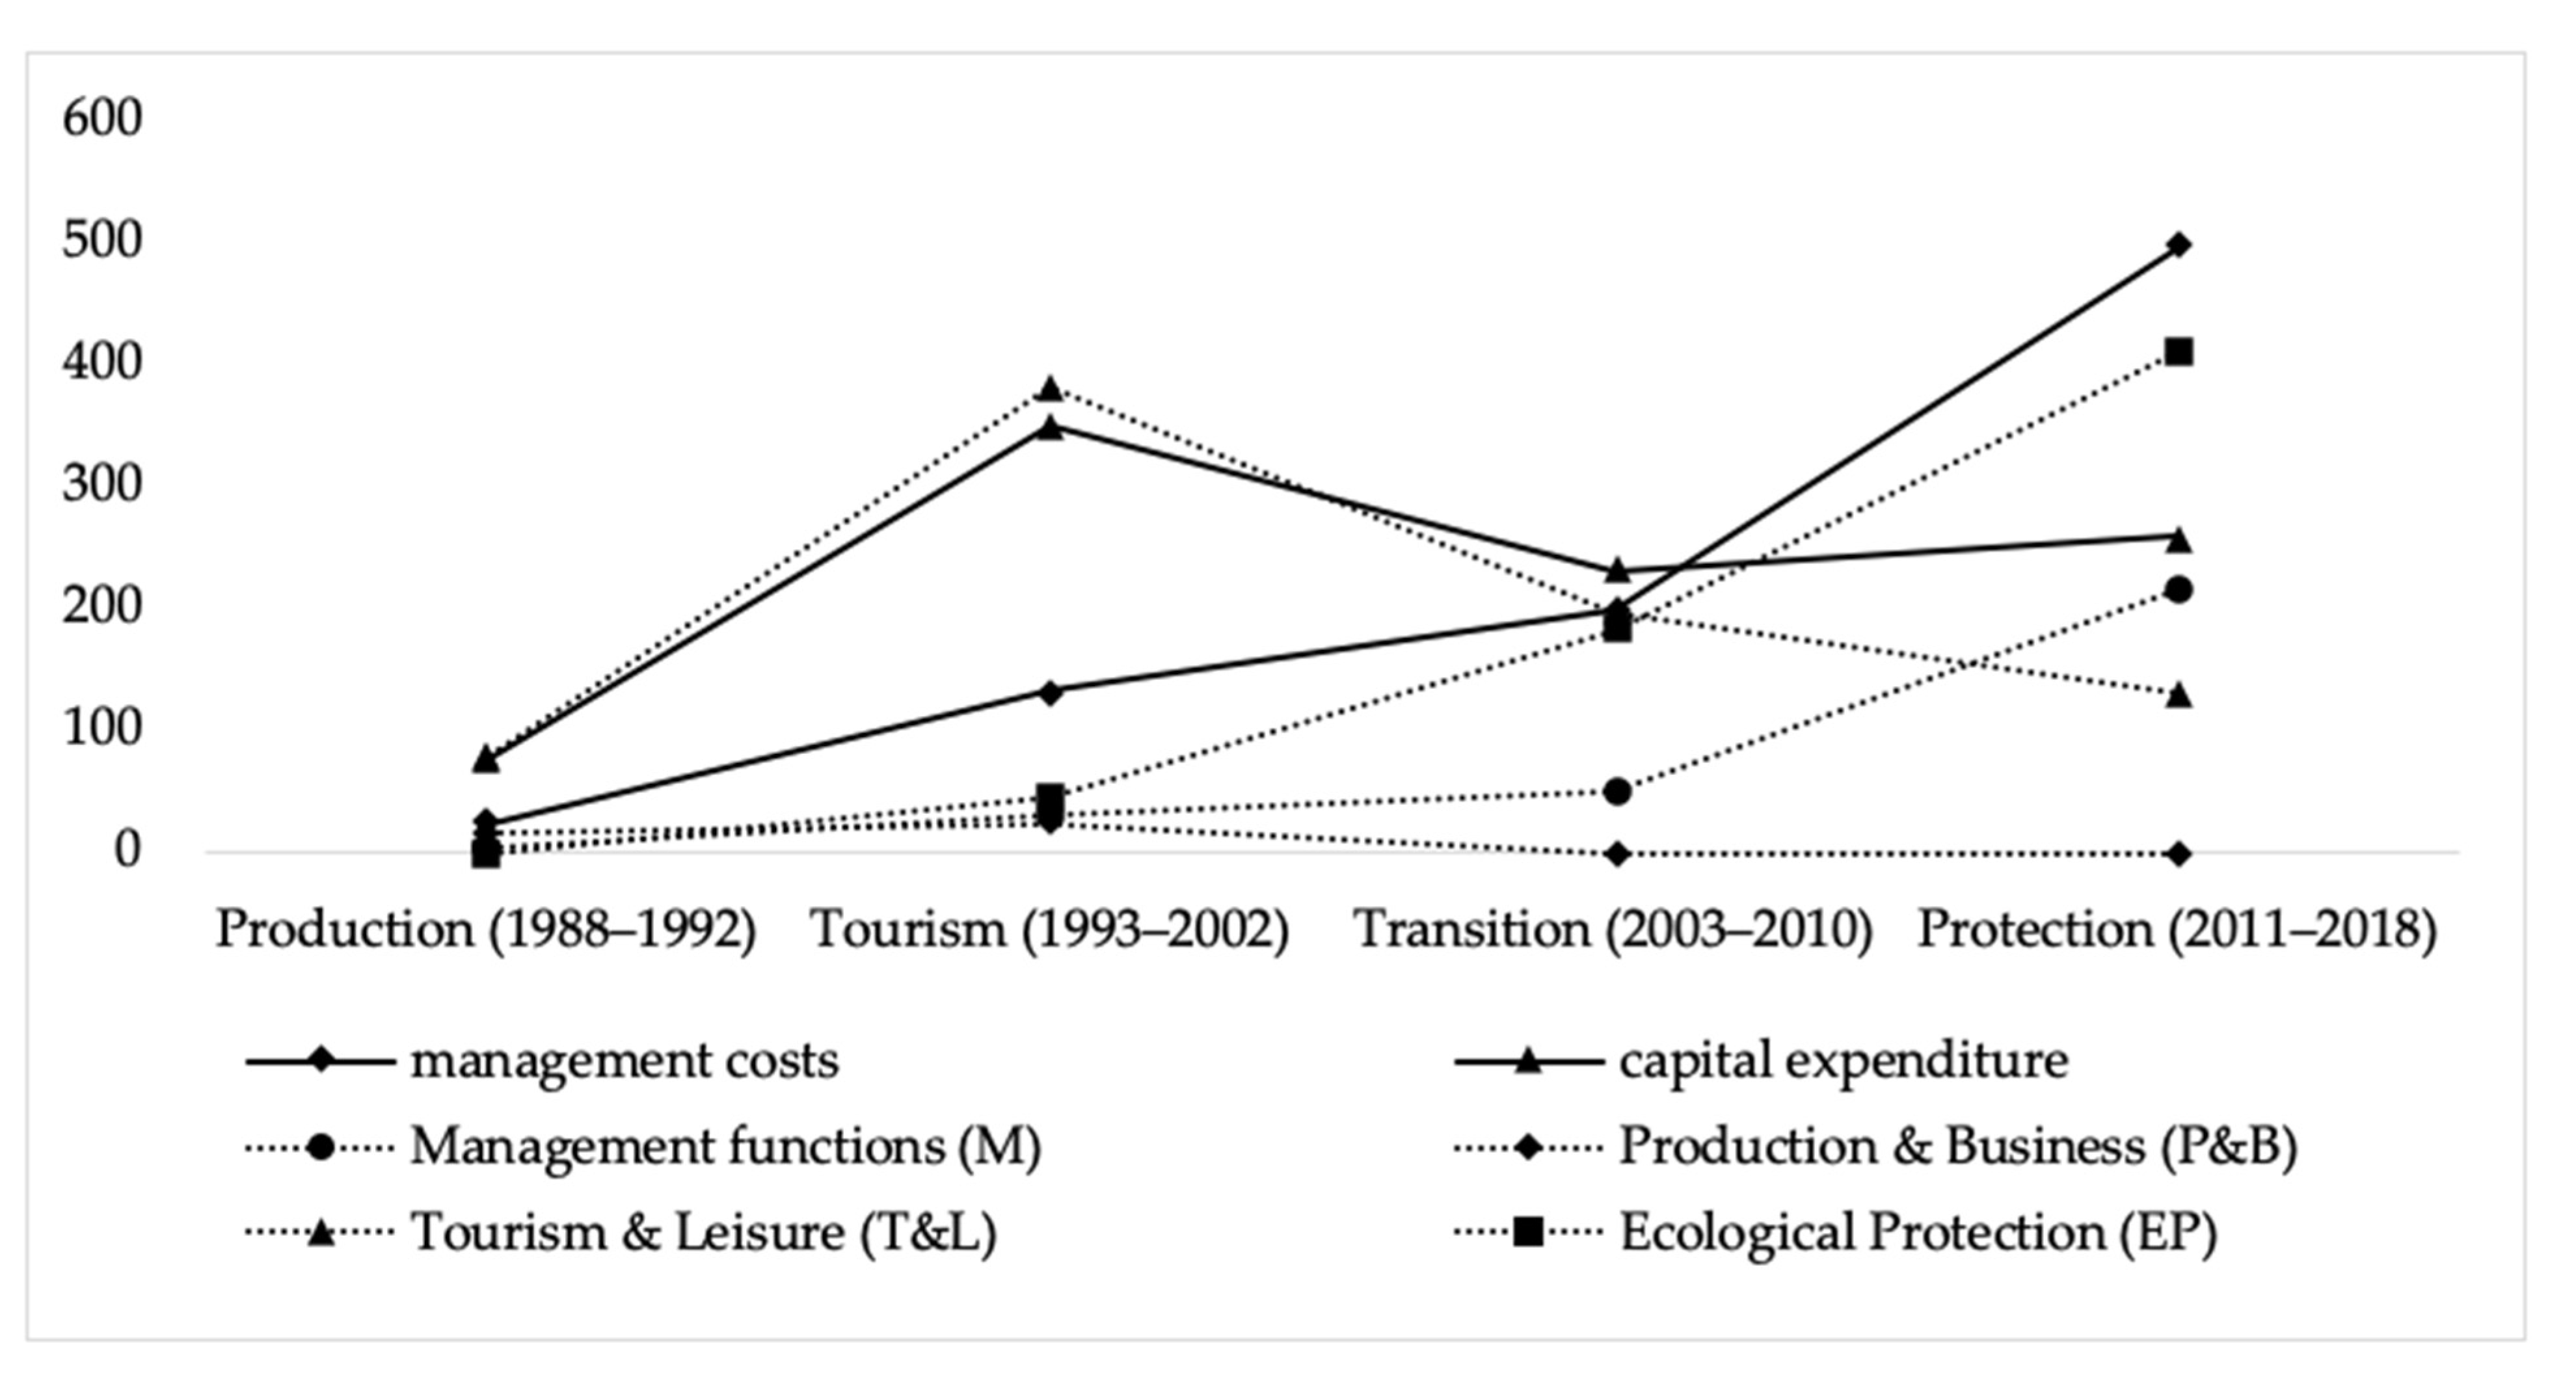
4.2.2. Evolution of Cost Structure
5. Discussion
5.1. Theoretical Contributions
5.2. Practical Implications
6. Conclusions
Author Contributions
Funding
Institutional Review Board Statement
Informed Consent Statement
Data Availability Statement
Acknowledgments
Conflicts of Interest
References
- McKercher, B. Managing heritage resources as tourism products. Asia Pac. J. Tour. Res. 2004, 9, 255–266. [Google Scholar] [CrossRef]
- Hughes, M.; Carlsen, J. The business of cultural heritage tourism: Critical success factors. J. Heritage Tour. 2010, 5, 17–32. [Google Scholar] [CrossRef]
- Banerjee, O.; Cicowiez, M.; Ochuodho, T.; Masozera, M.; Wolde, B.; Lal, P.; Dudek, S.; Alavalapati, J.R.R. Financing the sustainable management of Rwanda’s protected areas. J. Sustain. Tour. 2018, 26, 1381–1397. [Google Scholar] [CrossRef]
- Roberts, R.M.; Jones, K.W.; Seidl, A.; Ek, A.; Smith, H. Conservation finance and sustainable tourism: The acceptability of conservation fees to support the Tambopata National Reserve, Peru. J. Sustain. Tour. 2016, 25, 1353–1366. [Google Scholar] [CrossRef]
- Reynisdottir, M.; Song, H.; Agrusa, J. Willingness to pay entrance fees to natural attractions: An Icelandic case study. Tour. Manag. 2008, 29, 1076–1083. [Google Scholar] [CrossRef]
- Zou, S. National park entrance fee increase: A conceptual framework. J. Sustain. Tour. 2020, 28, 2099–2117. [Google Scholar] [CrossRef]
- Buckley, R. Pay to Play in Parks: An Australian Policy Perspective on Visitor Fees in Public Protected Areas. J. Sustain. Tour. 2003, 11, 56–73. [Google Scholar] [CrossRef]
- Li, Q.; Quan, H.; Wang, L.-E. Beneficiaries of free admission to scenic areas: A cost-benefit analysis of scenic areas for public welfare from the perspective of stakeholders. Tour. Manag. Perspect. 2020, 35. [Google Scholar] [CrossRef]
- Knapman, B.; Stoeckl, N. Recreation User Fees: An Australian Empirical Investigation. Tour. Econ. 1995, 1, 5–15. [Google Scholar] [CrossRef]
- Frazee, S.; Cowling, R.; Pressey, R.; Turpie, J.; Lindenberg, N. Estimating the costs of conserving a biodiversity hotspot: A case-study of the Cape Floristic Region, South Africa. Biol. Conserv. 2003, 112, 275–290. [Google Scholar] [CrossRef]
- Prendergast, J.R.; Quinn, R.M.; Lawton, J.H. The Gaps between Theory and Practice in Selecting Nature Reserves. Conserv. Biol. 1999, 13, 484–492. [Google Scholar] [CrossRef]
- Sun, X.H. A study on different ways of cost reimbursement between the Chinese and the American tourist attractions. Bus. Manag. J. 2014, 10, 117–127. [Google Scholar]
- Armsworth, P.R.; Cantú-Salazar, L.; Parnell, M.; Davies, Z.G.; Stoneman, R. Management costs for small protected areas and economies of scale in habitat conservation. Biol. Conserv. 2011, 144, 423–429. [Google Scholar] [CrossRef]
- Duan, Q.F.; Wu, S. A study on the characteristics of public scenic spot and its pricing costs. Price Theory Pract. 2017, 11, 91–94. [Google Scholar]
- Gao, S. On the reduction of expenses at scenic areas and simplification of price-fixing method. Tour. Trib. 2009, 24, 60–66. [Google Scholar]
- Pellinen, J. Making price decisions in tourism enterprises. Int. J. Hosp. Manag. 2003, 22, 217–235. [Google Scholar] [CrossRef]
- Zhu, X.H.; Fu, J.H. Research on Ticked Price Optimization of Tourist Attractions; Social Sciences Academic Press: Beijing, China, 2017. [Google Scholar]
- Zou, S.; Petrick, J.F. Testing the Effect of Price Framing on Nonresidents’ Perceptions of Dual Pricing in State Parks: An Application of Prospect Theory. Leis. Sci. 2019, 1–22. [Google Scholar] [CrossRef]
- Anderson, S.W. Managing Costs and Cost Structure throughout the Value Chain: Research on Strategic Cost Management; Elsevier: Amsterdam, The Netherlands, 2006; pp. 481–506. [Google Scholar]
- Holzhacker, M.; Krishnan, R.; Mahlendorf, M.D. Unraveling the Black Box of Cost Behavior: An Empirical Investigation of Risk Drivers, Managerial Resource Procurement, and Cost Elasticity. Account. Rev. 2015, 90, 2305–2335. [Google Scholar] [CrossRef]
- Aboody, D.; Levi, S.; Weiss, D. Managerial incentives, options, and cost-structure choices. Rev. Account. Stud. 2017, 23, 422–451. [Google Scholar] [CrossRef]
- Ministry of Culture and Tourism of China. Available online: https://www.mct.gov.cn/whzx/whyw/201810/t20181001_835209.htm (accessed on 1 October 2018).
- CamareroM, C.; Garrido, M.J.; Vicente, E. How cultural organizations’ size and funding influence innovation and performance: The case of museums. J. Cult. Econ. 2011, 35, 247–266. [Google Scholar] [CrossRef]
- Whitelaw, P.A.; King, B.E.; Tolkach, D. Protected areas, conservation and tourism—Financing the sustainable dream. J. Sustain. Tour. 2014, 22, 584–603. [Google Scholar] [CrossRef]
- UNWTO World Tourism Barometer, May 2020—Special Focus on the Impact of COVID-19; UNWTO: Madrid, Spain, 2020.
- Ministry of Culture and Tourism of China. Available online: https://www.mct.gov.cn/preview/special/8830/qykyal/202003/t20200330_852203.htm (accessed on 3 March 2020).
- Li, P.; Ryan, C.; Cave, J. Chinese rural tourism development: Transition in the case of Qiyunshan, Anhui, 2008–2015. Tour. Manag. 2016, 55, 240–260. [Google Scholar] [CrossRef]
- Stamboulis, Y.; Skayannis, P. Innovation strategies and technology for experience-based tourism. Tour. Manag. 2003, 24, 35–43. [Google Scholar] [CrossRef]
- Chen, Y.-S.; Wu, S.-T. An exploration of actor-network theory and social affordance for the development of a tourist attraction: A case study of a Jimmy-related theme park, Taiwan. Tour. Manag. 2021, 82, 104206. [Google Scholar] [CrossRef]
- Butler, R. The concept of a tourist area cycle of evolution: Implications for management of resources. Can. Geogr. 1980, 24, 5–12. [Google Scholar] [CrossRef]
- Zhong, L.; Deng, J.; Xiang, B. Tourism development and the tourism area life-cycle model: A case study of Zhangjiajie National Forest Park, China. Tour. Manag. 2008, 29, 841–856. [Google Scholar] [CrossRef]
- Law, J.; Singleton, V. Object Lessons. Organization 2005, 12, 331–355. [Google Scholar] [CrossRef]
- Buckley, R.; Guitart, D.; Shakeela, A. Contested surf tourism resources in the Maldives. Ann. Tour. Res. 2017, 64, 185–199. [Google Scholar] [CrossRef]
- Ahuja, G.; Katila, R. Where do resources come from? The role of idiosyncratic situations. Strat. Manag. J. 2004, 25, 887–907. [Google Scholar] [CrossRef]
- Barney, J. Firm Resources and Sustained Competitive Advantage. J. Manag. 1991, 17, 99–120. [Google Scholar] [CrossRef]
- Barney, J.B.; Ketchen, D.J.; Wright, M. The Future of Resource-Based Theory. J. Manag. 2011, 37, 1299–1315. [Google Scholar] [CrossRef]
- Sirmon, D.G.; Hitt, M.A.; Ireland, R.D.; Gilbert, B.A. Resource Orchestration to Create Competitive Advantage. J. Manag. 2011, 37, 1390–1412. [Google Scholar] [CrossRef]
- Young, G.; Smith, K.G.; Grimm, C.M.; Simon, D. Multimarket Contact and Resource Dissimilarity: A Competitive Dynamics Perspective. J. Manag. 2000, 26, 1217–1236. [Google Scholar] [CrossRef]
- Draft, R. Organization Theory and Design; West: New York, NY, USA, 1983. [Google Scholar]
- Crouch, G.; Ritchie, J. Tourism, Competitiveness, and Societal Prosperity. J. Bus. Res. 1999, 44, 137–152. [Google Scholar] [CrossRef]
- Hueting, R. The economic functions of the environment. Evaluation of environmental effects of transport. In Proceedings of the International Roundtable Organized by PTRC Education and Research Services Ltd., Hague, The Netherlands, 19–20 June 1995. [Google Scholar]
- Hueting, R.; Reijnders, L.; De Boer, B.; Lambooy, J.; Jansen, H. The concept of environmental function and its valuation. Ecol. Econ. 1998, 25, 31–35. [Google Scholar] [CrossRef]
- De Groot, R.S. Environmental functions as a unifying concept for ecology and economics. Environmentalist 1987, 7, 105–109. [Google Scholar] [CrossRef]
- De Groot, R.S. A Functional Ecosystem Evaluation Method as a Tool in Environmental Planning and Decision Making; Agricultural University: Amsterdam, The Netherlands, 1986. [Google Scholar]
- De Groot, R.S. Function-analysis and valuation as a tool to assess land use conflicts in planning for sustainable, multi-functional landscapes. Landsc. Urban Plan. 2006, 75, 175–186. [Google Scholar] [CrossRef]
- De Groot, R.S. Functions of Nature: Evaluation of Nature in Environmental Planning, Management and Decision-Making; Wolters-Noordhoff: Groningen, The Netherlands, 1992. [Google Scholar]
- De Groot, R.S.; Wilson, M.A.; Boumans, R.M.J. A typology for the classification, description and valuation of ecosystem functions, goods and services. Ecol. Econ. 2002, 41, 393–408. [Google Scholar] [CrossRef]
- Green, J.M.; Burgess, N.D.; Green, R.E.; Madoffe, S.S.; Munishi, P.K.; Nashanda, E.; Turner, R.K.; Balmford, A. Estimating management costs of protected areas: A novel approach from the Eastern Arc Mountains, Tanzania. Biol. Conserv. 2012, 150, 5–14. [Google Scholar] [CrossRef]
- Bhojraj, S.; Bloomfield, R.; Jang, Y.; Yehuda, N. Cost Structure, Operating Leverage and CDS Spreads. Account. Rev. 2020. [Google Scholar] [CrossRef]
- Kallapur, S.; Eldenburg, L. Uncertainty, Real Options, and Cost Behavior: Evidence from Washington State Hospitals. J. Account. Res. 2005, 43, 735–752. [Google Scholar] [CrossRef]
- Banker, R.D.; Byzalov, D.; Plehn-Dujowich, J.M. Demand Uncertainty and Cost Behavior. Account. Rev. 2013, 89, 839–865. [Google Scholar] [CrossRef]
- Paroutis, S.; Heracleous, L. Discourse revisited: Dimensions and employment of first-order strategy discourse during institutional adoption. Strat. Manag. J. 2013, 34, 935–956. [Google Scholar] [CrossRef]
- Yin, R.K. Case Study Research: Design and Methods, 5th ed.; Sage Publications: Los Angeles, CA, USA, 2014. [Google Scholar]
- Dickson, T.; Darcy, S.; Walker, C. A Case of Leveraging a Mega-Sport Event for a Sport Tourism Legacy: A Prospective Longitudinal Case Study of Whistler Adaptive Sports. Sustainability 2020, 13, 170. [Google Scholar] [CrossRef]
- Langley, A.; Smallman, C.; Tsoukas, H.; Van De Ven, A.H. Process Studies of Change in Organization and Management: Unveiling Temporality, Activity, and Flow. Acad. Manag. J. 2013, 56, 1–13. [Google Scholar] [CrossRef]
- Notaro, S.; Paletto, A. The economic valuation of natural hazards in mountain forests: An approach based on the replacement cost method. J. For. Econ. 2012, 18, 318–328. [Google Scholar] [CrossRef]
- Mattsson, L.; Li, C.-Z. How do Different Forest Management Practices Affect the Non-timber Value of Forests—An Economic Analysis. J. Environ. Manag. 1994, 41, 79–88. [Google Scholar] [CrossRef]
- Zou, G.Y.; Liu, M.Y.; He, J.M. One-ticket or two-part tariff? An analysis on the vertical restrictions for managing public scenic spots in China. Tour. Trib. 2015, 30, 60–71. [Google Scholar]
- Eagles, P.F. Fiscal implications of moving to tourism finance for parks: Ontario Provincial Parks. Manag. Leis. 2013, 19, 1–17. [Google Scholar] [CrossRef]
- Liu, D.J. The rise of labor cost and economic development transition. J. Lanzhou Commer. Coll. 2011, 27, 48–54. [Google Scholar]
- McCrea-Strub, A.; Zeller, D.; Sumaila, U.R.; Nelson, J.; Balmford, A.; Pauly, D. Understanding the cost of establishing marine protected areas. Mar. Policy 2011, 35, 1–9. [Google Scholar] [CrossRef]
- Emerton, L.; Bishop, J.; Thomas, L. Sustainable Financing of Protected Areas: A Global Review of Challenges and Options. In Sustainable Financing of Protected Areas: A Global Review of Challenges and Options; International Union for Conservation of Nature: Gland, Switzerland, 2006. [Google Scholar]
- Andersson, T.D.; Getz, D. Tourism as a mixed industry: Differences between private, public and not-for-profit festivals. Tour. Manag. 2009, 30, 847–856. [Google Scholar] [CrossRef]
- Perry, J.L.; Rainey, H.G. The Public-Private Distinction in Organization Theory: A Critique and Research Strategy. Acad. Manag. Rev. 1988, 13, 182–201. [Google Scholar] [CrossRef]
- Assaf, A.G.; Tsionas, M.G.; Gillen, D. Measuring firm performance: Differentiating between uncontrollable and controllable bad outputs. Tour. Manag. 2020, 80, 104107. [Google Scholar] [CrossRef]
- Hvidman, U.; Andersen, S.C. Impact of Performance Management in Public and Private Organizations. J. Public Adm. Res. Theory 2013, 24, 35–58. [Google Scholar] [CrossRef]
- Andersson, M. Assessing non-industrial private forest owners’ attitudes to risk: Do owner and property characteristics matter? J. For. Econ. 2012, 18, 3–13. [Google Scholar] [CrossRef]


| Stages | Functions | Management Costs | Capital Expenditure | Mean | |||
|---|---|---|---|---|---|---|---|
| RMB | % | RMB | % | RMB | % | ||
| Production (1988~1992) | Management (M) | 4.94 | 100 | - | - | 4.94 | 4.87 |
| Production and Business (P&B) | 12.36 | 75.00 | 4.12 | 25.00 | 16.48 | 16.24 | |
| Tourism and Leisure (T&L) | 7.42 | 9.27 | 72.62 | 90.73 | 80.04 | 78.89 | |
| Sum | 24.72 | 24.36 | 76.74 | 75.64 | 101.46 | 100 | |
| Tourism (1993~2002) | Management (M) | 31.02 | 100 | - | - | 31.02 | 6.41 |
| Production and Business (P&B) | 17.73 | 75 | 5.91 | 25.00 | 23.64 | 4.88 | |
| Tourism and Leisure (T&L) | 70.90 | 18.48 | 312.74 | 81.52 | 383.64 | 79.27 | |
| Ecological protection (EP) | 13.29 | 29.12 | 32.35 | 70.88 | 45.64 | 9.43 | |
| Sum | 132.95 | 27.47 | 351 | 72.53 | 483.95 | 100 | |
| Transition (2003~2010) | Management (M) | 49.71 | 100 | - | - | 49.71 | 11.53 |
| Tourism and Leisure (T&L) | 89.48 | 45.29 | 108.11 | 54.71 | 197.59 | 45.84 | |
| Ecological protection (EP) | 59.65 | 32.46 | 124.13 | 67.54 | 183.78 | 42.63 | |
| Sum | 198.84 | 46.13 | 232.24 | 53.87 | 431.08 | 100 | |
| Protection (2011~2018) | Management (M) | 204.93 | 94.76 | 11.34 | 5.24 | 216.27 | 28.47 |
| Tourism and Leisure (T&L) | 54.45 | 41.49 | 76.79 | 58.51 | 131.24 | 17.27 | |
| Ecological protection (EP) | 239.99 | 58.21 | 172.27 | 41.79 | 412.26 | 54.26 | |
| Sum | 499.37 | 65.73 | 260.39 | 34.27 | 759.76 | 100 | |
Publisher’s Note: MDPI stays neutral with regard to jurisdictional claims in published maps and institutional affiliations. |
© 2021 by the authors. Licensee MDPI, Basel, Switzerland. This article is an open access article distributed under the terms and conditions of the Creative Commons Attribution (CC BY) license (https://creativecommons.org/licenses/by/4.0/).
Share and Cite
Liu, J.-Y.; Li, Q.-J.; Sigley, G.; Quan, H. How Will the Cost Change after Transformation in Public Nature-Based Attractions? A Framework and Case Study. Sustainability 2021, 13, 6468. https://doi.org/10.3390/su13116468
Liu J-Y, Li Q-J, Sigley G, Quan H. How Will the Cost Change after Transformation in Public Nature-Based Attractions? A Framework and Case Study. Sustainability. 2021; 13(11):6468. https://doi.org/10.3390/su13116468
Chicago/Turabian StyleLiu, Jun-Ya, Qun-Ji Li, Gary Sigley, and Hua Quan. 2021. "How Will the Cost Change after Transformation in Public Nature-Based Attractions? A Framework and Case Study" Sustainability 13, no. 11: 6468. https://doi.org/10.3390/su13116468
APA StyleLiu, J.-Y., Li, Q.-J., Sigley, G., & Quan, H. (2021). How Will the Cost Change after Transformation in Public Nature-Based Attractions? A Framework and Case Study. Sustainability, 13(11), 6468. https://doi.org/10.3390/su13116468