
Removal of Volatile Organic Compounds by Means of a Felt-Based Living Wall Using Different Plant Species


Abstract
1. Introduction
2. Materials and Methods
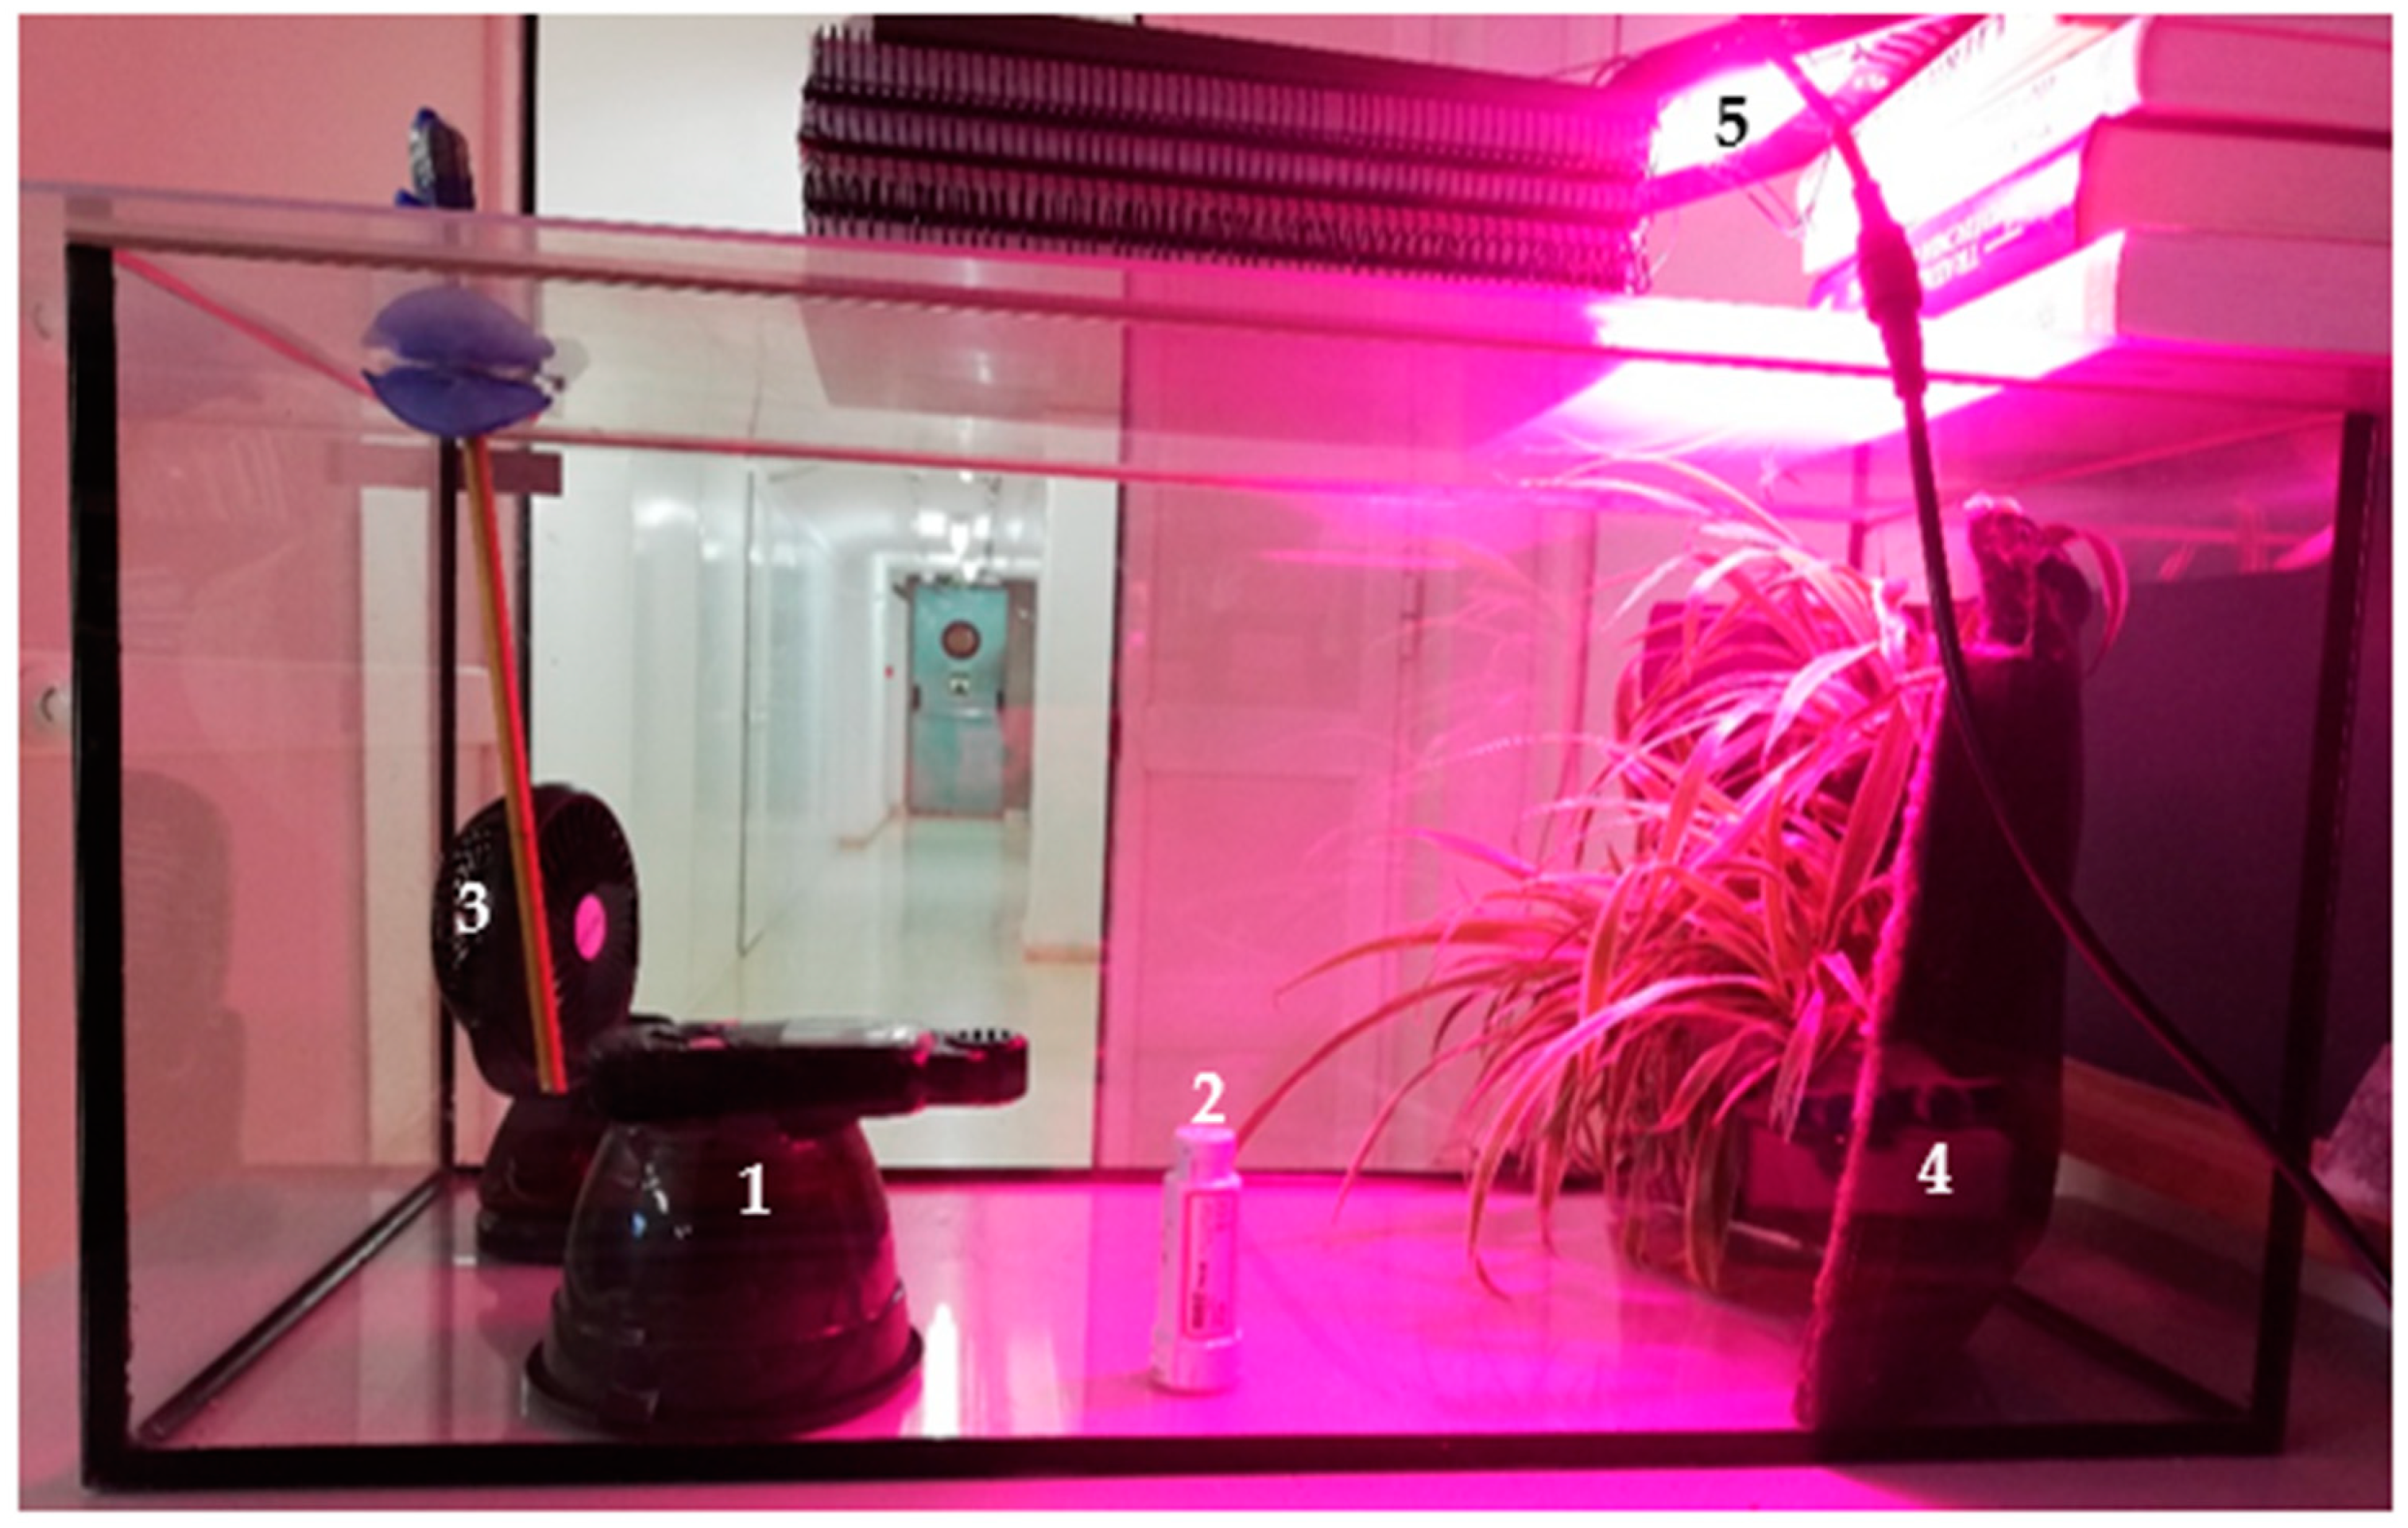
2.1. Preparations of the Tests and Environmental Conditions
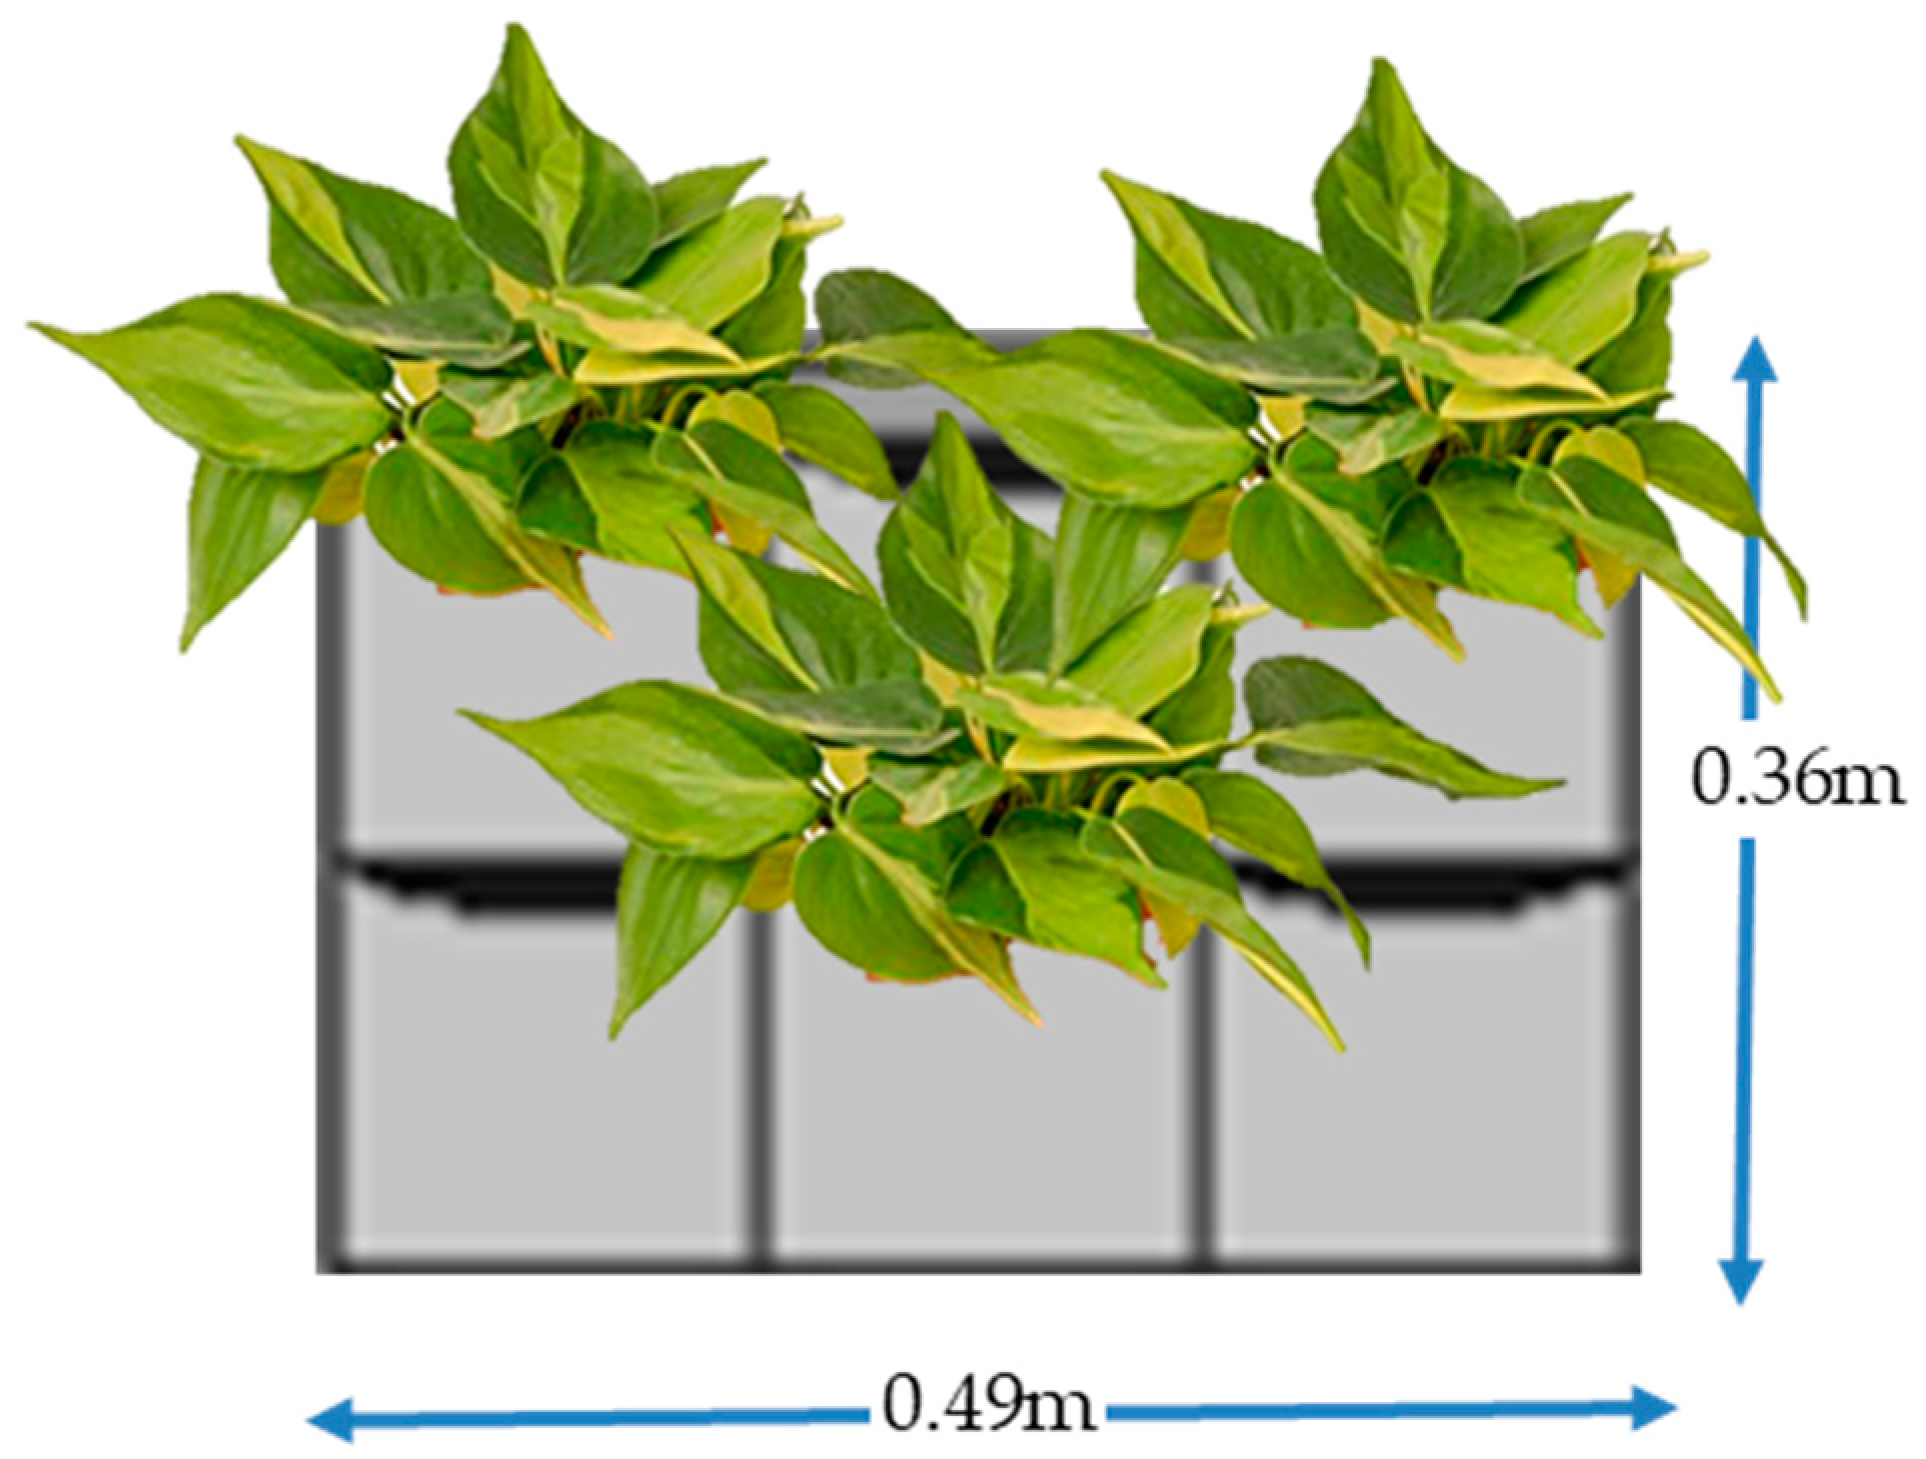
2.2. Selected Plants
- Philodendron hederaceum is an ornamental foliage climber plant commonly used in indoor environments. It has the potential to absorb harmful gases and clean the air inside buildings [24].
2.3. Test Procedure and Data Collection
2.4. Data Treatment and Statistical Analysis
3. Results
4. Discussion
5. Conclusions
Author Contributions
Funding
Institutional Review Board Statement
Informed Consent Statement
Data Availability Statement
Acknowledgments
Conflicts of Interest
References
- Langer, S.; Ramalho, O.; Derbez, M.; Ribéron, J.; Kirchner, S.; Mandin, C. Indoor environmental quality in French dwellings and building characteristics. Atmos. Environ. 2016, 128, 82–91. [Google Scholar] [CrossRef]
- Fisk, W.J. Health and productivity gains from better indoor environments and their relationship with building energy efficiency. Annu. Rev. Energy Environ. 2000, 25, 537–566. [Google Scholar] [CrossRef]
- Ole, F.P. What is IAQ? Indoor Air 2006, 16, 328–334. [Google Scholar] [CrossRef]
- Yu, C.W.F.; Kim, J.T. Photocatalytic oxidation for maintenance of indoor environmental quality. Indoor Built Environ. 2013, 22, 39–51. [Google Scholar] [CrossRef]
- Sakai, K.; Norbäck, D.; Mi, Y.; Shibata, E.; Kamijima, M.; Yamada, T.; Takeuchi, Y. A comparison of indoor air pollutants in Japan and Sweden: Formaldehyde, nitrogen dioxide, and chlorinated volatile organic compounds. Environ. Res. 2004, 94, 75–85. [Google Scholar] [CrossRef]
- Shrubsole, C.; Dimitroulopoulou, S.; Foxall, K.; Gadeberg, B.; Doutsi, A. IAQ guidelines for selected volatile organic compounds (VOCs) in the UK. Build. Environ. 2019, 165, 106382. [Google Scholar] [CrossRef]
- Rösch, C.; Kohajda, T.; Röder, S.; von Bergen, M.; Schlink, U. Relationship between sources and patterns of VOCs in indoor air. Atmos. Pollut. Res. 2014, 5, 129–137. [Google Scholar] [CrossRef]
- Park, J.S.; Ikeda, K. Variations of formaldehyde and VOC levels during 3 years in new and older homes. Indoor Air 2006, 16, 129–135. [Google Scholar] [CrossRef] [PubMed]
- Raw, G.J.; Coward, S.K.D.; Brown, V.M.; Crump, D.R. Exposure to air pollutants in English homes. J. Expo. Anal. Environ. Epidemiol. 2004, 14, 85–94. [Google Scholar] [CrossRef]
- Guo, H.; Kwok, N.H.; Cheng, H.R.; Lee, S.C.; Hung, W.T.; Li, Y.S. Formaldehyde and volatile organic compounds in Hong Kong homes: Concentrations and impact factors. Indoor Air 2009, 19, 206–217. [Google Scholar] [CrossRef]
- Salthammer, T.; Mentese, S.; Marutzky, R. Formaldehyde in the indoor environment. Chem. Rev. 2010, 110, 2536–2572. [Google Scholar] [CrossRef]
- Lai, H.K.; Kendall, M.; Ferrier, H.; Lindup, I.; Alm, S.; Hänninen, O.; Jantunen, M.; Mathys, P.; Colvile, R.; Ashmore, M.R.; et al. Personal exposures and microenvironment concentrations of PM 2.5, VOC, NO2 and CO in Oxford, UK. Atmos. Environ. 2004, 38, 6399–6410. [Google Scholar] [CrossRef]
- Srivastava, P.K.; Pandit, G.G.; Sharma, S.; Mohan Rao, A.M. Volatile organic compounds in indoor environments in Mumbai, India. Sci. Total Environ. 2000, 255, 161–168. [Google Scholar] [CrossRef]
- Torpy, F.; Clements, N.; Pollinger, M.; Dengel, A.; Mulvihill, I.; He, C.; Irga, P. Testing the single-pass VOC removal efficiency of an active green wall using methyl ethyl ketone (MEK). Air Qual. Atmos. Health 2018, 11, 163–170. [Google Scholar] [CrossRef] [PubMed]
- Gawrońska, H.; Bakera, B. Phytorremediation of particulate matter from indoor air by Chlorophytum comosum L. plants. Air Qual. Atmos. Health 2015, 8, 265–272. [Google Scholar] [CrossRef] [PubMed]
- Dela Cruz, M.; Christensen, J.H.; Thomsen, J.D.; Müller, R. Can ornamental potted plants remove volatile organic compounds from indoor air?—A review. Environ. Sci. Pollut. Res. 2014, 21, 13909–13928. [Google Scholar] [CrossRef] [PubMed]
- Kim, K.J.; Jeong, M., II; Lee, D.W.; Song, J.S.; Kim, H.D.; Yoo, E.H.; Jeong, S.J.; Han, S.W.; Kays, S.J.; Lim, Y.W.; et al. Variation in formaldehyde removal efficiency among indoor plant species. HortScience 2010, 45, 1489–1495. [Google Scholar] [CrossRef]
- Suárez-Cáceres, G.P.; Fernández-Cañero, R.; Fernández-Espinosa, A.J.; Rossini-Oliva, S.; Franco-Salas, A.; Pérez-Urrestarazu, L. Volatile organic compounds removal by means of a felt-based living wall to improve indoor air quality. Atmos. Pollut. Res. 2021, 12, 224–229. [Google Scholar] [CrossRef]
- Pérez-Urrestarazu, L.; Fernández-Cañero, R.; Franco-Salas, A.; Egea, G. Vertical Greening Systems and Sustainable Cities. J. Urban Technol. 2015, 22, 65–85. [Google Scholar] [CrossRef]
- Irga, P.J.; Pettit, T.; Irga, R.F.; Paull, N.J.; Douglas, A.N.J.; Torpy, F.R. Does plant species selection in functional active green walls influence VOC phytoremediation efficiency? Environ. Sci. Pollut. Res. 2019, 26, 12851–12858. [Google Scholar] [CrossRef]
- Pérez-Urrestarazu, L.; Fernández-Cañero, R.; Campos-Navarro, P.; Sousa-Ortega, C.; Egea, G. Assessment of perlite, expanded clay and pumice as substrates for living walls. Sci. Hortic. 2019, 254, 48–54. [Google Scholar] [CrossRef]
- Parseh, I.; Teiri, H.; Hajizadeh, Y.; Ebrahimpour, K. Phytoremediation of benzene vapors from indoor air by Schefflera arboricola and Spathiphyllum wallisii plants. Atmos. Pollut. Res. 2018, 9, 1083–1087. [Google Scholar] [CrossRef]
- Wolverton, B.; Wolverton, J. Plants and soil microorganisms: Removal of formaldehyde, xylene, and ammonia from the indoor environment. J. Miss. Acad. Sci. 1993, 38, 11–15. [Google Scholar]
- Sadhana, K.; Sudhadevi, P.K. Evaluation of susceptibility levels of different species/varieties of philodendron to air pollution. Adv. Life Sci. 2016, 5, 1834–1839. [Google Scholar]
- Keever, G.J.; Cobb, G.S.; Stephenson, J.C. Interior performance of temperate zone landscape plants. J. Environ. Hortic. 1988, 6, 84–87. [Google Scholar] [CrossRef]
- Pérez-Urrestarazu, L.; Fernández-Cañero, R.; Franco, A.; Egea, G. Influence of an active living wall on indoor temperature and humidity conditions. Ecol. Eng. 2016, 90, 120–124. [Google Scholar] [CrossRef]
- Cardoso-Meireles, J.R.; Marcílio-Cerqueira, E.M. Use of the micronucleus test on Tradescantia (Trad-MCN) to evaluate the genotoxic effects of air pollution. In Air Pollution: New Developments; Moldoveanu, A.M., Ed.; IntechOpen: Rijeka, Croatia, 2011; Volume 1, pp. 245–262. ISBN 978-953-307-527-3. [Google Scholar]
- Yang, D.S.; Pennisi, S.V.; Son, K.-C.C.; Kays, S.J. Screening indoor plants for volatile organic pollutant removal efficiency. HortScience 2009, 44, 1377–1381. [Google Scholar] [CrossRef]
- Soreanu, G.; Dixon, M.; Darlington, A. Botanical biofiltration of indoor gaseous pollutants—A mini-review. Chem. Eng. J. 2013, 229, 585–594. [Google Scholar] [CrossRef]
- Giese, M.; Bauer-Doranth, U.; Langebartels, C.; Sandermann, H., Jr. Detoxification of formaldehyde by the spider plant (Chlorophytum comosum L.) and by soybean (Glycine max L.) cell-suspension cultures. Plant Physiol. 1994, 104, 1301–1309. [Google Scholar] [CrossRef] [PubMed]
- Mølhave, L.; Clausen, G.; Berglund, B.; De Ceaurriz, J.; Kettrup, A.; Lindvall, T.; Maroni, M.; Pickering, A.C.; Risse, U.; Rothweiler, H.; et al. Total volatile organic compounds (TVOC) in indoor air quality investigations. Indoor Air 1997, 7, 225–240. [Google Scholar] [CrossRef]
- Wolverton, B.C.; Johnson, A.; Bounds, K. Interior Landscape Plants for Indoor Air Pollution Abatement; Hancock: Saint Louis, MS, USA, 1989. [Google Scholar]
- Wood, R.A.; Orwell, R.L.; Tarran, J.; Torpy, F.; Burchett, M. Potted-plant/growth media interactions and capacities for removal of volatiles from indoor air. J. Hortic. Sci. Biotechnol. 2002, 77, 120–129. [Google Scholar] [CrossRef]
- Sriprapat, W.; Thiravetyan, P. Efficacy of ornamental plants for benzene removal from contaminated air and water: Effect of plant associated bacteria. Int. Biodeterior. Biodegrad. 2016, 113, 262–268. [Google Scholar] [CrossRef]
- Sriprapat, W.; Suksabye, P.; Areephak, S.; Klantup, P.; Waraha, A.; Sawattan, A.; Thiravetyan, P. Uptake of toluene and ethylbenzene by plants: Removal of volatile indoor air contaminants. Ecotoxicol. Environ. Saf. 2014, 102, 147–151. [Google Scholar] [CrossRef] [PubMed]
- Noor, H.M.; Ahmad, H. Native ornamental potted plants for sustainable improvement of indoor air quality. Int. J. Appl. Agric. Sci. 2020, 6, 44–51. [Google Scholar] [CrossRef]
- Bandehali, S.; Miri, T.; Onyeaka, H.; Kumar, P. Current state of indoor air phytoremediation using potted plants and green walls. Atmosphere 2021, 12, 473. [Google Scholar] [CrossRef]
- Liu, Y.J.; Mu, Y.J.; Zhu, Y.G.; Ding, H.; Crystal Arens, N. Which ornamental plant species effectively remove benzene from indoor air? Atmos. Environ. 2007, 41, 650–654. [Google Scholar] [CrossRef]
- Orwell, R.L.; Wood, R.L.; Tarran, J.; Torpy, F.; Burchett, M.D. Removal of benzene by the indoor plant/substrate microcosm and implications for air quality. Water Air Soil Pollut. 2004, 157, 193–207. [Google Scholar] [CrossRef]
- Ruiz, J.; Bilbao, R.; Murillo, M.B. Adsorption of different VOC onto soil minerals from gas phase: Influence of mineral, type of VOC, and air humidity. Environ. Sci. Technol. 1998, 32, 1079–1084. [Google Scholar] [CrossRef]


| Equipment | Model | Description |
|---|---|---|
| HOBO | Pro Temp-HR U23-001 (Onset Computer Corp., Bourne, MA, USA) | Operation range: 0 to 100% RH, −40° to 70 °C. Accuracy: ±2.5% from 10% to 90% RH typical to a maximum of ±3.5% including hysteresis at 25 °C (77° F); below 10% and above 90% ± 5% typical |
| Grow lamp | A CF-UT01 LED (Panda Grow, Shenzhen, China) | Voltage: 110 V/220 V. Lamp Luminous Flux (lm): 5000 Spectrum: 560–780 nm |
| Portable fan | CAVN QY072-EU | 5000 mAh |
| Gas detector | PCE-VOC 1 (PCE Ibérica S.L., Albacete, Spain) | Operation range TVOC: 0.00 to 9.99 mg/m3 Accuracy TVOC: ±5% of full scale |
| Leaf area meter | LI-3100 (Li-Cor, NE, USA) | Resolution: 1 mm × 1 mm Accuracy: 10 cm2 (+1%); 5 cm2 (+2%); 1 cm2 (+5%); 0.5 cm2 (+7%). Precision was determined at the 99% level with irregular-shaped complex objects. |
| Precision balance | D-6200 CB (I.C.T, S.L., La Rioja, Spain) | Weighing capacity: 6200 g Accuracy: 0.1 g |
| Plant Parameters | S. wallisii | P. hederaceum | F. pumila | T. pallida | C. comosum |
|---|---|---|---|---|---|
| Fresh weight (g) | 545.30 | 103.50 | 61.60 | 355.10 | 162.10 |
| Aerial part | 351.10 | 74.90 | 36.70 | 336.70 | 97.30 |
| Roots | 194.20 | 28.60 | 24.90 | 18.40 | 64.80 |
| Dry weight (g) | 72.60 | 12.80 | 14.30 | 23.00 | 11.90 |
| Aerial part | 44.30 | 9.50 | 9.30 | 21.00 | 6.60 |
| Roots | 28.30 | 3.30 | 5.00 | 2.00 | 5.30 |
| % Water | 86.69 | 87.63 | 76.79 | 93.52 | 92.66 |
| Aerial part | 87.38 | 87.32 | 74.66 | 93.76 | 93.22 |
| Roots | 85.43 | 88.46 | 79.92 | 89.13 | 91.82 |
| Fresh weight per plant (g) | 181.77 ± 34.75 | 17.25 ± 10.83 | 10.27 ± 1.42 | 59.18 ± 17.26 | 27.02 ± 4.31 |
| Total leaf area (cm2) | 6306.70 | 729.60 | 1418.40 | 2931.40 | 1904.30 |
| Mean area per leaf (cm2) | 18.33 | 18.71 | 31.52 | 16.75 | 9.24 |
| Total number of leaves | 344 | 39 | 45 | 175 | 206 |
| Contaminant | 0.25 h (mg/m3) | 1 h (mg/m3) | 5 h (mg/m3) | 24 h (mg/m3) | 48 h (mg/m3) | 72 h (mg/m3) |
|---|---|---|---|---|---|---|
| n-hexane | 3.14 ± 0.05 | 3.19 ± 0.07 | 3.13 ± 0.01 | 3.35 ± 0.60 | 3.30 ± 0.67 | 3.34 ± 0.61 |
| formaldehyde | 1.96 ± 0.49 | 2.46 ± 0.52 | 2.69 ± 0.84 | 3.59 ± 0.33 | 3.69 ± 0.47 | 3.69 ± 0.47 |
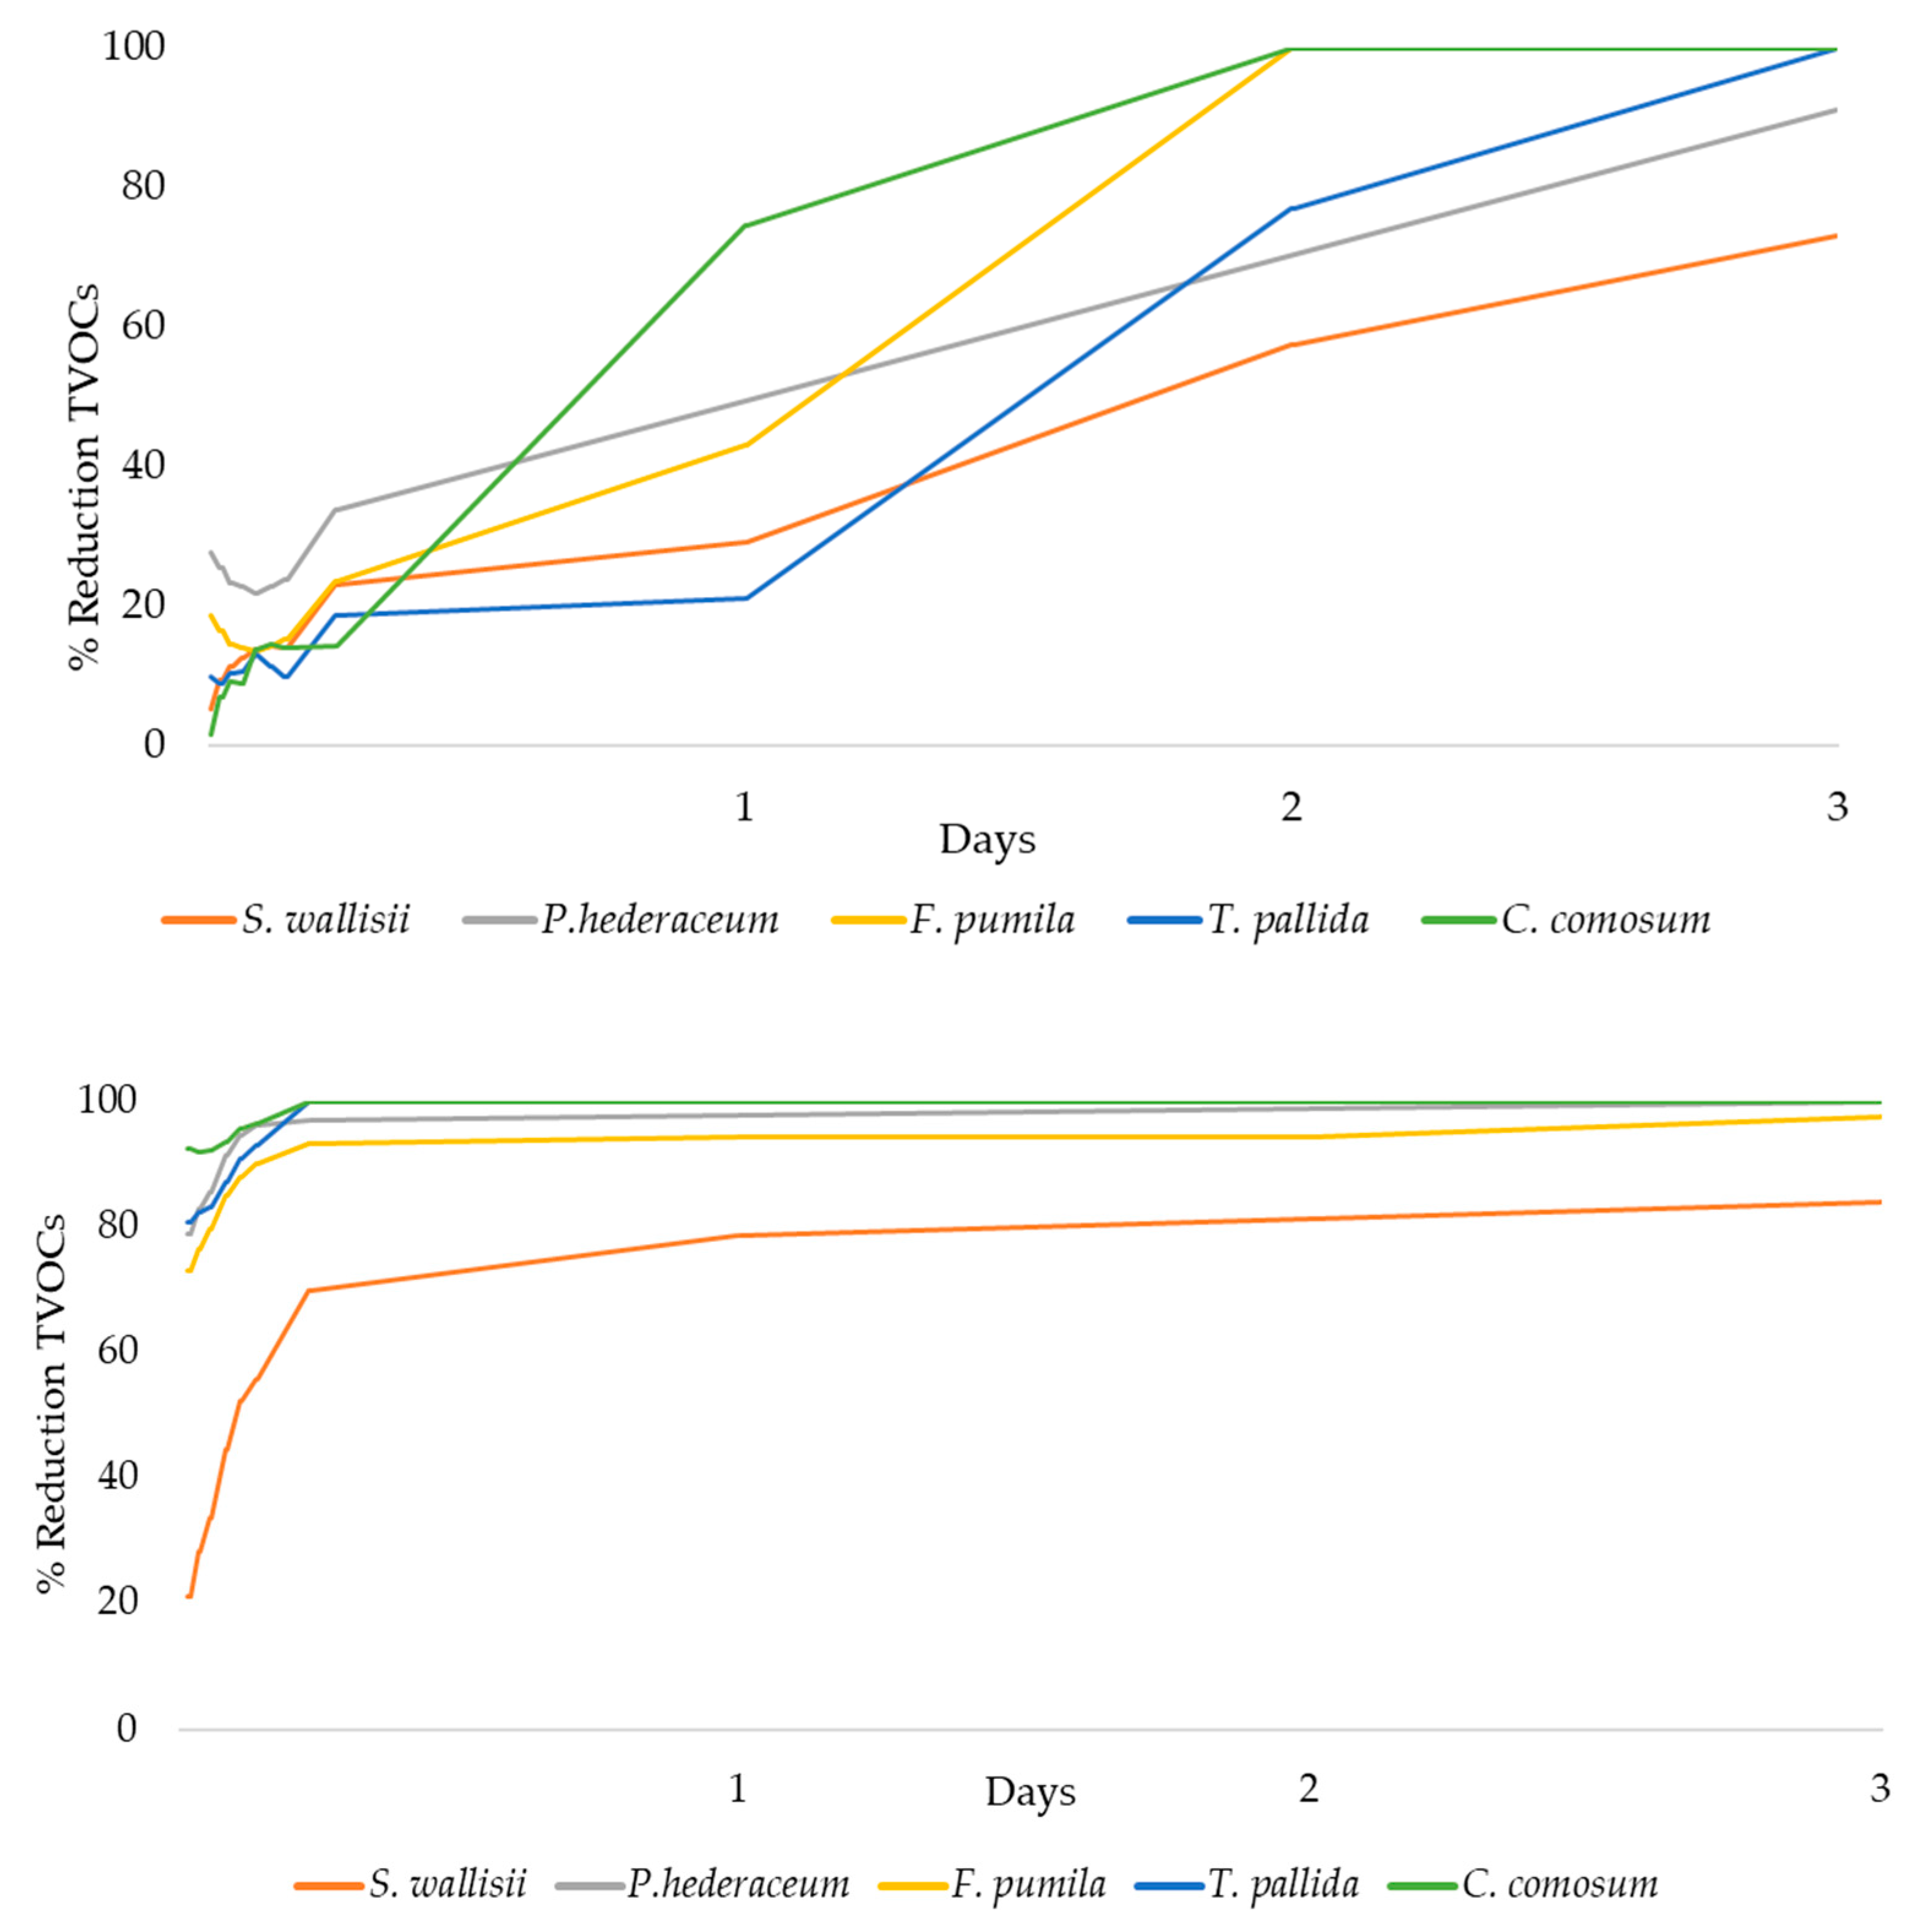
| Contaminant | Species | %R0.25 | %R1 | %R5 | %R24 | %R48 | % R72 |
|---|---|---|---|---|---|---|---|
| n-hexane | S. wallisii | 11 ± 3.6 b | 14 ± 4.1 a | 23 ± 3.2 | 29 ± 2.2 b | 57 ± 18.6 b | 73 ± 24.0 b |
| P. hederaceum | 23 ± 10.7 ab | 24 ± 10.9 ab | 34 ± 15.7 | - | - | 91 ± 11.2 ab | |
| F. pumila | 15 ± 10.9 b | 15 ± 10.8 a | 24 ± 9.6 | 43 ± 25.1 a | 100 ± 0.0 a | 100 ± 0.0 a | |
| T. pallida | 10 ± 36.8 a | 10 ± 30.2 b | 19 ± 39.5 | 21 ± 21.5 b | 77 ± 32.6 ab | 100 ± 0.0 a | |
| C. comosum | 9 ± 15.4 ab | 14 ± 17.4 ab | 14 ± 16.7 | 65 ± 0.5 a | 100 ± 0.0 a | 100 ± 0.0 a | |
| formaldehyde | S. wallisii | 28 ± 7.9 b | 56 ± 10.3 b | 70 ± 8.4 b | 79 ± 4.6 b | 81 ± 4.4 b | 84 ± 4.4 b |
| P. hederaceum | 83 ± 3.1 a | 96 ± 3.6 a | 97 ± 2.9 a | - | - | 100 ± 0.0 a | |
| F. pumila | 76 ± 10.0 a | 90 ± 3.8 a | 93 ± 3.6 a | 94 ± 6.1 a | 94 ± 6.1 a | 98 ± 2.7 a | |
| T. pallida | 82 ± 13.4 a | 93 ± 5.8 a | 100 ± 0.0 a | 100 ± 0.0 a | 100 ± 0.0 a | 100 ± 0.0 a | |
| C. comosum | 92 ± 0.9 a | 96 ± 0.3 a | 100 ± 0.0 a | 100 ± 0.0 a | 100 ± 0.0 a | 100 ± 0.0 a |
Publisher’s Note: MDPI stays neutral with regard to jurisdictional claims in published maps and institutional affiliations. |
© 2021 by the authors. Licensee MDPI, Basel, Switzerland. This article is an open access article distributed under the terms and conditions of the Creative Commons Attribution (CC BY) license (https://creativecommons.org/licenses/by/4.0/).
Share and Cite
Suárez-Cáceres, G.P.; Pérez-Urrestarazu, L. Removal of Volatile Organic Compounds by Means of a Felt-Based Living Wall Using Different Plant Species. Sustainability 2021, 13, 6393. https://doi.org/10.3390/su13116393
Suárez-Cáceres GP, Pérez-Urrestarazu L. Removal of Volatile Organic Compounds by Means of a Felt-Based Living Wall Using Different Plant Species. Sustainability. 2021; 13(11):6393. https://doi.org/10.3390/su13116393
Chicago/Turabian StyleSuárez-Cáceres, Gina Patricia, and Luis Pérez-Urrestarazu. 2021. "Removal of Volatile Organic Compounds by Means of a Felt-Based Living Wall Using Different Plant Species" Sustainability 13, no. 11: 6393. https://doi.org/10.3390/su13116393
APA StyleSuárez-Cáceres, G. P., & Pérez-Urrestarazu, L. (2021). Removal of Volatile Organic Compounds by Means of a Felt-Based Living Wall Using Different Plant Species. Sustainability, 13(11), 6393. https://doi.org/10.3390/su13116393