Article

Effects of the COVID-19 Pandemic on Tourist Risk Perceptions—The Case Study of Porto

by
Hélder da Silva Lopes
1,2,*,
Paula C. Remoaldo
1,
Vitor Ribeiro
1,3 and
Javier Martín-Vide
2
1
Lab2PT—Landscape, Heritage and Territory Laboratory, Department of Geography, Institute of Social Sciences, University of Minho, 4710-057 Braga, Portugal
2
IdRA—Climatology Group, Department of Geography, University of Barcelona, 08001 Barcelona, Spain
3
Department of Teacher Training, ESE de Paula Frassinetti, 4000-225 Porto, Portugal
*
Author to whom correspondence should be addressed.
Sustainability 2021, 13(11), 6399; https://doi.org/10.3390/su13116399
Submission received: 5 May 2021 / Revised: 27 May 2021 / Accepted: 2 June 2021 / Published: 4 June 2021
(This article belongs to the Special Issue Sustainable Tourism Strategies in Pandemic Contexts)

Abstract

:
The COVID-19 pandemic outbreak (in early 2020) has dictated significant changes in society and territories by anticipating trends, changing priorities, and creating challenges, which are manifested in the territories. These are influenced by the levels of economic, cultural, and social restructuring, in the measures implemented by public administration or in attempts to redefine strategies for tourism destinations. This paper examines the perceptions and behaviors of tourists before and during COVID-19 in the municipality of Porto, the main area of the Porto Metropolitan Area, in Portugal. Research was based on the application of a questionnaire survey, probing the sensitivity of tourists to the crisis in the decision-making of daily routines, as well as future travel plans in the presence of a serious health concern. A total of 417 surveys were collected in the summers of 2019 and 2020. In addition to descriptive statistics, this paper also includes the results of the analysis of explanatory factors, being a reference for future studies. There were significant changes in the use of public space and the way tourist visits are handled, namely: (i) the concentration of visiting time (shorter visit than usual in certain tourist profiles); (ii) spatially limited visiting areas; and (iii) the ability to attract standard tourists from certain countries where tighter lockdown rules were imposed. Main implications of this study are reflected in the challenges that are imposed on the local agenda, where traditional problems are added to the responsibilities in crisis management and the ability to establish a third order of intervention in tourism.

1. Introduction

The COVID-19 pandemic has impacted the territories’ ability to receive visitors for tourism and leisure. This brings about changes in economic, cultural, and social restructuring, in the measures implemented by public administration or in the (re)definition of strategies for tourism destinations. On the other hand, COVID-19 is proving to be more damaging to the tourism and hospitality sector than World War II [1,2].
In economic terms, the European Commission (EC) estimates a 6.8% drop in Gross Domestic Product (GDP) growth in the Eurozone for 2020 [3]. The Organization for Economic Cooperation and Development (OECD) [4] predicted, in the beginning of 2021 that, for example, the pandemic situation will slow the global growth of the tourism sector, with a loss of 80% in international tourism, which is expected to take a few years to recover. The World Tourism Organization (UNWTO) announced the 2020 pandemic negative impacts in the tourism industry with a decrease of 74% in international tourism [5].
Part of this decrease in tourism activity is due to the significant reduction in global travel in response to the COVID-19 pandemic [6,7,8,9]. As the number of COVID-19 cases increases globally, in any of the pandemic peak evolution phases, countries begin to restrict international travel from countries experiencing such an increase [9,10,11].
This trend reverses the results of the last decade on urban tourism. In spite of all economic benefits and the renewal of central urban areas, there was an increase in relevant social and environmental frictions, resulting from the unbridled growth of tourism activity in cities. The debate was about how cities deal with the excess of tourism (overtourism), considering the contestation of residents, the processes of gentrification, or the need for greater territorial equity in the distribution of benefits [12,13,14,15,16,17,18]. The growth of urban tourism and international travel based on short stays (city break segment) was associated with an increase in the sector’s carbon footprint. The pandemic crisis is an opportunity to reflect on tourism policies and redefine the paths to be developed in order to achieve tourism sustainability [2,19,20,21,22,23,24,25].
The coronavirus pandemic has significantly reconfigured life in the city—the relationship between work and home, security and protection in transport (both public and private) and, above all, the enjoyment of public space and realization of leisure activities [26,27,28,29]. The impacts of COVID-19 are notoriously negative in the urban segment and are mainly geographically differentiated [28,30].
COVID-19 came to exacerbate the relevance of Protection Motivation Theory (PMT) and the perception of tourism risk. PMT is based on individuals’ coping with threats generated by a motivation to protect themselves from perceived health threats [31,32,33]. This theory is widely used in tourism literature [33,34,35,36,37,38,39,40] and comprises, in essence, threat/risk assessment—nature, relevance, and consequences that may derive from it [32,35,41,42,43].
This assessment involves defining behavioral alternatives and responses to avoid the threat and its effects [32]. Risk identification is still not a consensual concept in the academic field and in tourism literature, as it is strongly dependent on many factors [44,45,46]. The most consensual definition is related to the perception that tourists have about “the probability that an action may expose them to danger that can influence travel decisions if the perceived danger is deemed to be beyond an acceptable” [47] (pp. 383–384). Among the main risks, physical, psychological, social, financial, and health risks are identified [40,48,49,50,51]. These types of risks can result from conditions as diverse as terrorism, political instability, natural disasters, and epidemics or pandemics contexts [52].
The perception of risk is the result of the integration of two types of interpretations, objective and subjective. Their definitions are quite varied, but it is understood in the purpose of this investigation that, in broader terms, risk will be nothing more than the distinction between interpretations resulting from the real context (physical characteristics, which are visible—objective dimension) and the tourist’s psychological and behavioral dimension (subjective dimension), which depend on a multitude of conditions that may contribute to more or less fearful behaviors during the visits [52].
However, the perception of risk is differentiated for two reasons:
(1)
the tourist experience—experiences in different destinations, make tourists more carefree in face of any potential risks [51,53,54,55]. People tend to protect themselves more when faced with unknown situations. These conclusions are similar to those found by Lepp and Gibson [53]. The authors indicated that tourists with tourism experience tend to perceive less the risks.
(2)
the knowledge and familiarity of risk—the degree of interest in risk increases with knowledge about the attributes and profile that specifically characterize a destination [46,56].
During the COVID-19 pandemic (a public health emergency crisis), the familiarity and knowledge about health risks have been recognized through the media channels (namely television) and scientific publications on the subject during the 12 months after the start of the pandemic in China [35,57]. However, considering the few studies carried out and the successive lockdowns and closures of borders between countries, its effect on the tourist experience is still unknown.
In this investigation, we chose to use a subjective assessment of uncertainty, namely of the concerns and irreversible impacts that may arise from exposure to risk [52,58]. Some studies found significant differences due to the sociodemographic characteristics of tourists [7,59]. For example, Turnšek et al. [59] found, in a sample of 428 respondents collected on-line between 17 March and 11 April 2020, in Slovenia, that female individuals perceive risk more than male individuals during the trip. Neuburger and Eggar [7] identified in the DACH Region (Germany, Austria, and Switzerland) an increase in risk perception in March 2020 with a sample of 1370 tourists, subdivided in 2 phases, in March 2020. In a study developed between January and February of 2020 on Wuhan (the probable epicenter of COVID-19), respondents who have never visited Wuhan or were the least connected to Wuhan had higher levels of risk perception when compared to those who already knew the destination prior to the COVID-19 crisis [56].
The complex nature of risk perception highlights the need to consider new studies that analyze the sense of security during the stay in tourist destinations during pandemic contexts. The analysis of the geographic distribution of tourists is also essential, in view of the areas that continue to attract tourists. We can reveal that the research carried out in Porto is innovative because studies that apply and compare the perspective of tourists before and after COVID-19, through the application of the methodology via non-web (on site), are unknown. In addition, it is the first study that uses the geographical perspective to assess the movement of tourists in the local, regional, and national context of the visit and to compare how the perception of risk influences intra and interurban travel.
This study focuses on an estimation of urban tourism visitation numbers before and during the COVID-19 pandemic in the city of Porto and in one of the main bustling areas —Avenida dos Aliados (Aliados Avenue) and Praça da Liberdade (Liberdade Square). The main objectives of the research are: (i) to evaluate the capacity of intra and inter-destination visitation in the summer of 2019 (pre-pandemic period) and in the summer of 2020 (pandemic period); and (ii) tourists’ risk perception linked to COVID-19 (depending on nationality, perception of security during COVID-19, or the characteristics associated with the tour package).
This paper is organized as follows. After this Introduction, in Section 2, materials and methods underlying the study are presented. The main results of the investigation are presented in Section 3. The discussion is presented in Section 4. Finally, the main conclusions are identified in Section 5.

2. Material and Methods
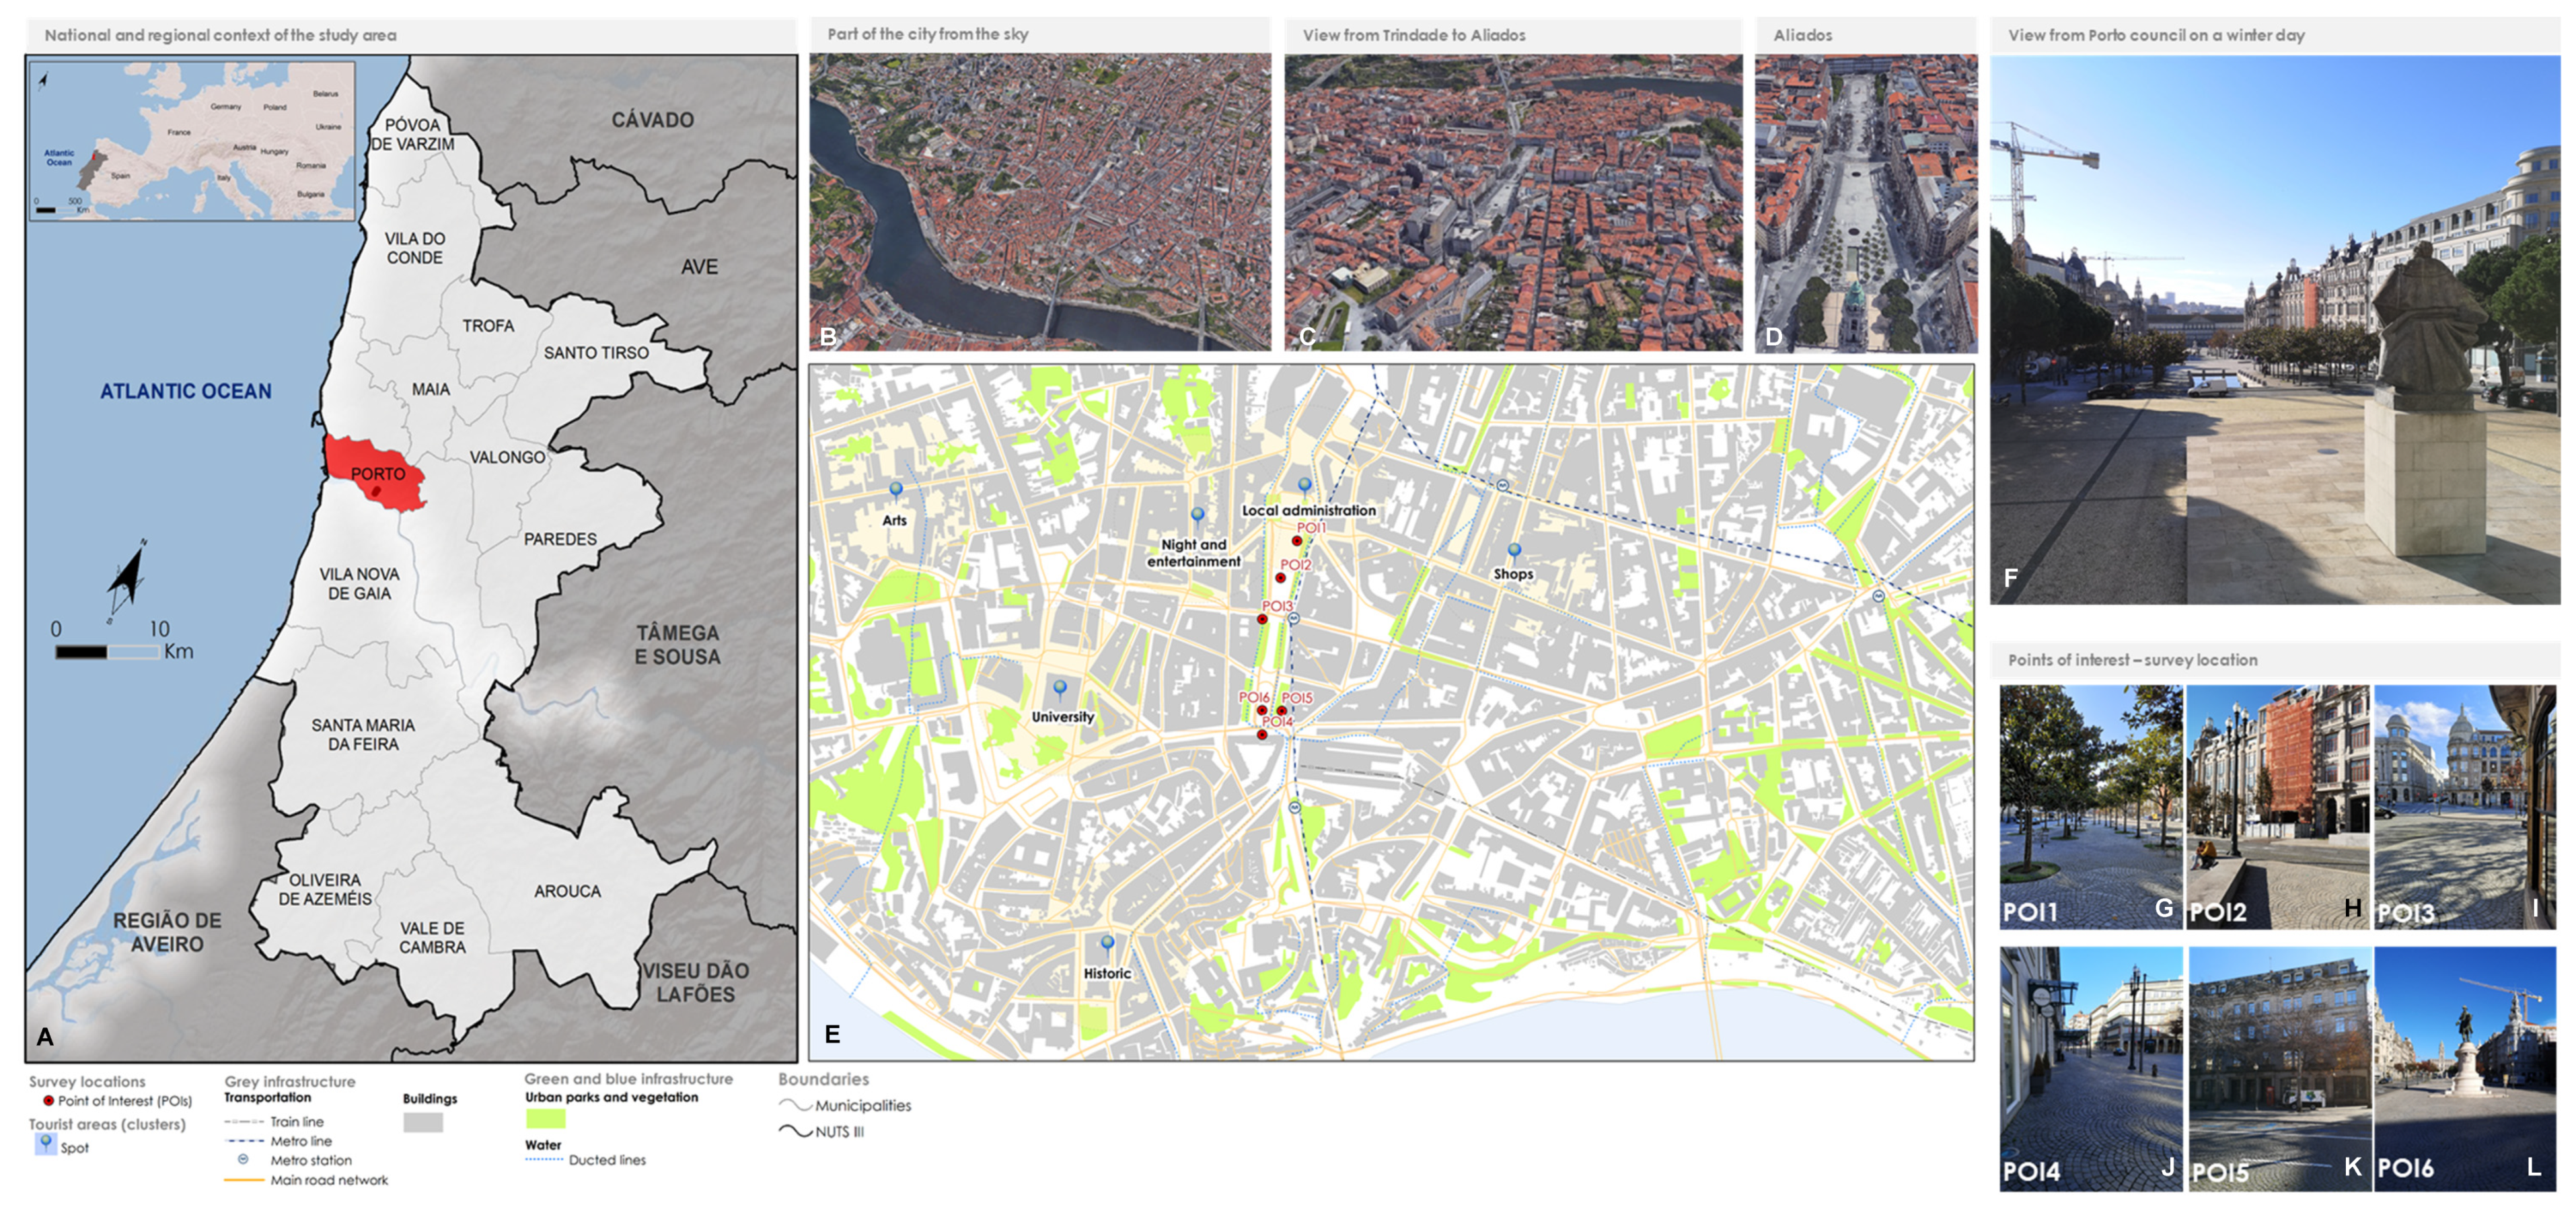
2.1. Study Area

Porto is the second largest Portuguese municipality and, by 2019, it was estimated to have 216,606 inhabitants (2.1% of the population in the country) [60] (Figure 1).
It has a privileged geographical location along the coast, with the Atlantic Ocean to the west, being bordered in the south by the Douro River. It is installed on a small slope platform, facing the Atlantic Ocean, with an altimetric amplitude of 160 m [61,62,63,64].
Current conditions have earned international recognition through awards that guarantee the quality of Portuguese tourism, with the increasing attractiveness of certain geographic areas with particular emphasis on the city of Porto (e.g., European Best Destination, 2012, 2014, and 2017).
Part of these results was evident in the suggested numbers of tourism statistics provided by Turismo do Porto e Norte, the entity responsible for tourism management in the northern region of mainland Portugal. It should be noted that, between 2015 and 2019, a significant part of the tourists who visit the municipality of Porto are of Portuguese nationality (27.0%), with those of foreign origin making up 73.0%, of which 14.0% are Spanish, 9.0% French, and 7.0% Brazilian. During the analysis period, there was a 12.0% reduction in the number of national tourists, from 33.0% in 2015 to 21.0% in 2019. This means that a significant part of Porto’s county tourist contracting has become very popular.
The markets with the highest growth between 2015 and 2019 in Porto are Brazil and Germany. In 2017, foreign tourists concentrated their visit period in the summer months, contributing to the seasonality of the tourism sector. It should be noted that among the demand markets for the destination Porto, the national market is the one that presents a more uniform distribution throughout the year, contrary to what happens with the Spanish market, which shows strong pressure in the tourist market in the month of August (17.0% of guests and 20.0% of overnight stays in this period).
The city of Porto, as it is known today, has physical, economic, and social characteristics that make it very close to the definition of ‘Historic Touristic City’ [65,66], in need of restructuring in face of the post-COVID-19 period. It is expected that the next report for the municipality will identify the same trend as the one verified at national and regional levels. In fact, the decrease in the number of guests in NUTS I Portugal and NUTS II Norte was of 61.0% and 56.0%, respectively [67].
The data from the Portuguese Civil Aviation Authority identifies the variations in the number of passengers by Airport in Portugal. A consecutive analysis for the period between the 1st quarter of 2019 and the 1st quarter of 2021 makes it possible to identify the effects generated by the pandemic during the lockdowns and the recovery that it was able to generate in air traffic during the summer of 2020 (Figure 2).
In fact, in contrast to the international scene, good security practices and the identification of Portugal as a safe destination led to positive passenger variations between the summers of 2019 and 2020 in the order of 11.3% for Porto and 7.1% for Portugal.
Despite this, it should be noted that Portugal remained on the blacklist of British air corridors until 22 August 2020, which resulted in the loss of one of the most important tourist markets. In addition, the framework of restrictive measures was in force during the summer of 2020 with the opening of borders to all countries of the European Union and in the Schengen area, to countries with positive epidemiological assessment in direct connections to Portugal and, in other cases, for passengers who tested negative for COVID-19. Regarding land borders, they were only opened on 1 July 2020, allowing the arrival of Spanish tourists to the municipality of Porto (a relevant market in the city-break segment).

2.2. Questionnaire Design
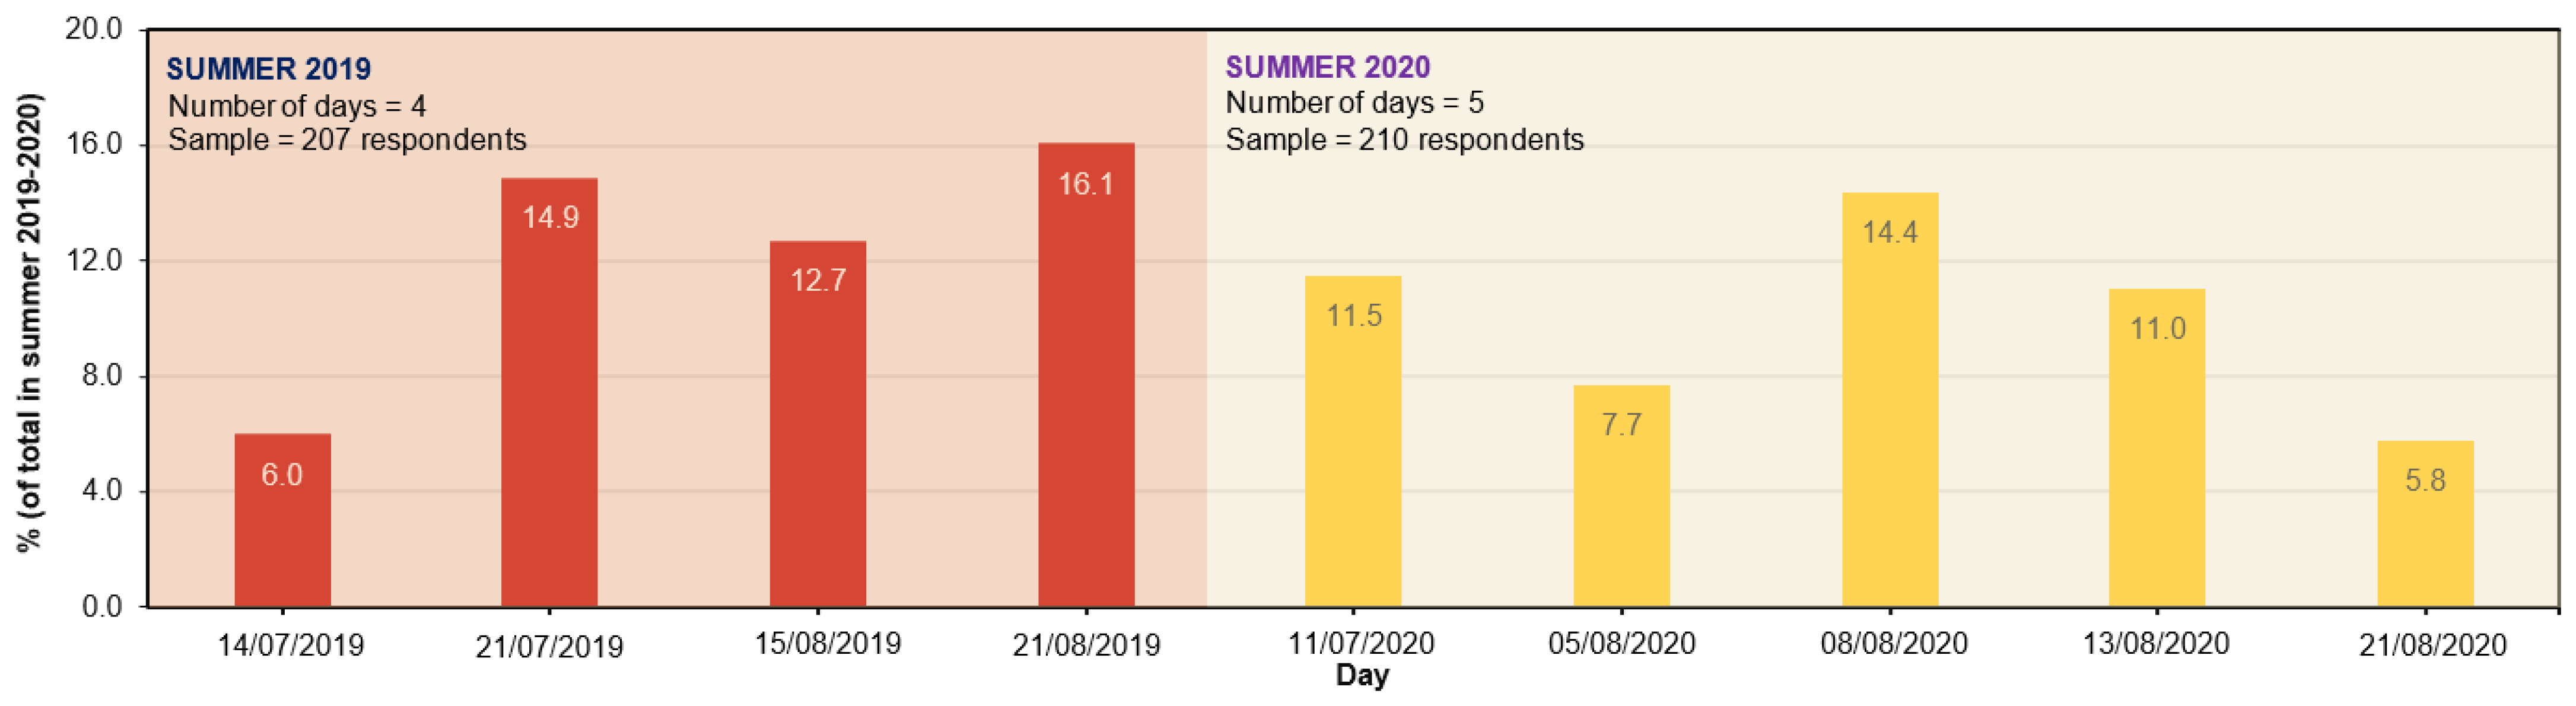
The questionnaire design was based on the multidisciplinary perspective of several areas that are working towards a similar objective (e.g., tourism, geography, medicine, psychology, architecture, and urbanism).
The questionnaire was structured in four sections (A–D), with a total of 30 questions, subdivided into sub-items. We chose to use closed questions and only one open question (optional) (cf. Appendix A). The first goal of this questionnaire was to evaluate the outdoor thermal comfort conditions that tourists experience and their perception of the urban environment and compare the answers obtained (through the climatic comfort perception) with the instantaneous values of physical parameters.
It presents a conventional structure, with questions starting from a general to a particular scope (top-down structure). The first part of the questionnaire seeks to assess the travel experience in the Porto Metropolitan Area, namely the respondent’s origin, the places visited, the duration of the visit, or the number of people who accompanied the respondent during the visit. The second part seeks to gauge the weather/climate experience in Porto. The third part of the questionnaire is the personal characterization of individuals, while the last part aims to include some information about COVID-19, namely the fears that tourists have while making the visit.
The initial questionnaire was designed in April 2019. Changes to the application instrument were made in May 2020. For the validation of the designed constructs, the opinions of eight experts in the fields of tourism management, health, and geography were considered. Thirteen items were created in 2020. The face validity of the questionnaire was confirmed in May 2019 and an additional group with 13 items related to COVID-19 was added the second time it was applied. This group includes questions about the use of a mask; about whether to consider the COVID-free destination (Portugal and Porto, in particular) and 11 items to assess the experience in public spaces (e.g., the number of daily cases, airy and wide spaces, information about COVID-19, and a more particular question, if tourists feel safe).
It was decided that questions related to COVID-19 (Group D) were to be analyzed in this paper. This group of questions seeks to identify certain patterns that could influence the ability to visit. When it came to the questions that aimed to analyze the consequences of microclimate patterns in the urban areas of the municipality of Porto, the topic related to the COVID-19 pandemic was introduced to gauge the behavior of tourists during the summer of 2020. The respondents were asked about the extent to which they agreed or disagreed with the items using a 5-point Likert scale for all items about risk perceptions related to COVID-19.

2.3. Sample

The first step in developing the sample design consists of specifying the research’s ‘target population/universe’ and the ‘subject’ under consideration [68,69]. In other words, the group of people that the researchers aim to inquire and whatever it is they seek to know must be determined, as well as the perception of individual members of a population or household [68,70,71]. The age limit for participation in the study was defined as equal to or above 15, as to include only individuals in a potentially active age or whose remuneration results from the exercise of a profession. Another reason intrinsic to this choice is that the respondents are mature enough to answer this type of questionnaire.
Once the target population has been defined, it is impossible to survey all individuals who visit Porto in the period defined for carrying out the present study, for financial reasons and time constraints. Therefore, it is necessary to select a sample from the universe to participate in the study. An ideal sampling base can be defined when the sample represents all tourists’ perspectives on Porto and if they are aged 15 or over [67]. The sample was of a convenient nature and was collected at random as the questionnaire was applied to the tourists of the city of Porto.
In the present investigation, the decision on the sample size was related to the following factors: (i) the number of visitors/guests; (ii) the best solution in terms of time and cost necessary to carry out the investigation; and (iii) the existence of pleasant climatic conditions that allow the tourists to enjoy the open air—namely the absence of precipitation [68,72]. A sample was selected with a margin of error of 0.5% and a confidence level of 95.0%.
A total of 417 tourists’ answers obtained in the summers of 2019 and 2020 were considered for analysis in the present paper. The sociodemographic patterns of the tourists surveyed in our sample do not differ significantly from those used in other investigations carried out in the study area [73,74,75].

2.4. Survey Application

The questionnaire was applied in Avenida dos Aliados (Aliados Avenue) and Praça da Liberdade (Liberdade Square), one of the busiest areas of the city of Porto, at six points that cross the main arteries connecting to other touristic areas in the city. Note that the surrounding areas are associated with tourist spots of great interest: night and entertainment, shopping and leisure, and public administration areas (cf. Figure 1).
The questionnaire took, on average, 10 min to answer, and the part dedicated to COVID-19 was estimated to take 2 min. The pre-test was conducted on 6 July 2019 (Saturday), between 10:30 a.m. and 4:00 p.m. GTM + 00. Ten questionnaires were carried out.
The survey was carried out in person in the center of Porto in both periods, in the summers of 2019 and 2020. As microclimate measurements were made synchronously, the collaboration of one or two people was always counted on for the application of the questionnaire. A total of 207 (49.6%) questionnaires were applied between 14 July 2019 and 21 August 2019 in the pre-pandemic phase, and 210 (50.4%) between 11 July 2020 and 21 August 2020. The questionnaires were always applied on time, between 10:00 and 18:00 (Figure 3). In 2020, one extra day was necessary to obtain a sample comparable (in size) to that of the summer of 2019.

2.5. Data Analysis and Procedures

All questions and answers of the investigation were code inserted and evaluated using the statistical package SPSS (Statistical Package for the Social Sciences) and ArcGIS 10.8 cartographical tools. Various statistical techniques were tested to analyze the quantitative data collected through the questionnaire.
Additionally, the reliability of the questionnaire was confirmed by calculating Cronbach’s alpha in a study. The alpha coefficients for the ‘risk perceptions for COVID-19′ constructs were 0.76. All of them were high acceptable rates.
The values of skewness and kurtosis of items did not identify any serious violations of normality. All the coefficients were below ±2.
The techniques used in this investigation were overall descriptive statistics (frequency, proportion, mean, asymmetry, kurtosis), a Chi-squared test to compare the difference between respondents in the summers of 2019 and 2020, and T-tests and ANOVA to determine the differences between several sociodemographic and geographic levels of visit. All statistical analyses are in accordance with the 95% confidence threshold (p < 0.05). In addition, a location in the geographic database was associated with each response and the profile of each tourist was related with the places of visit in the city of Porto, in the NUTS III Porto Metropolitan Area and Portugal.

3. Results

3.1. Sample Demographics
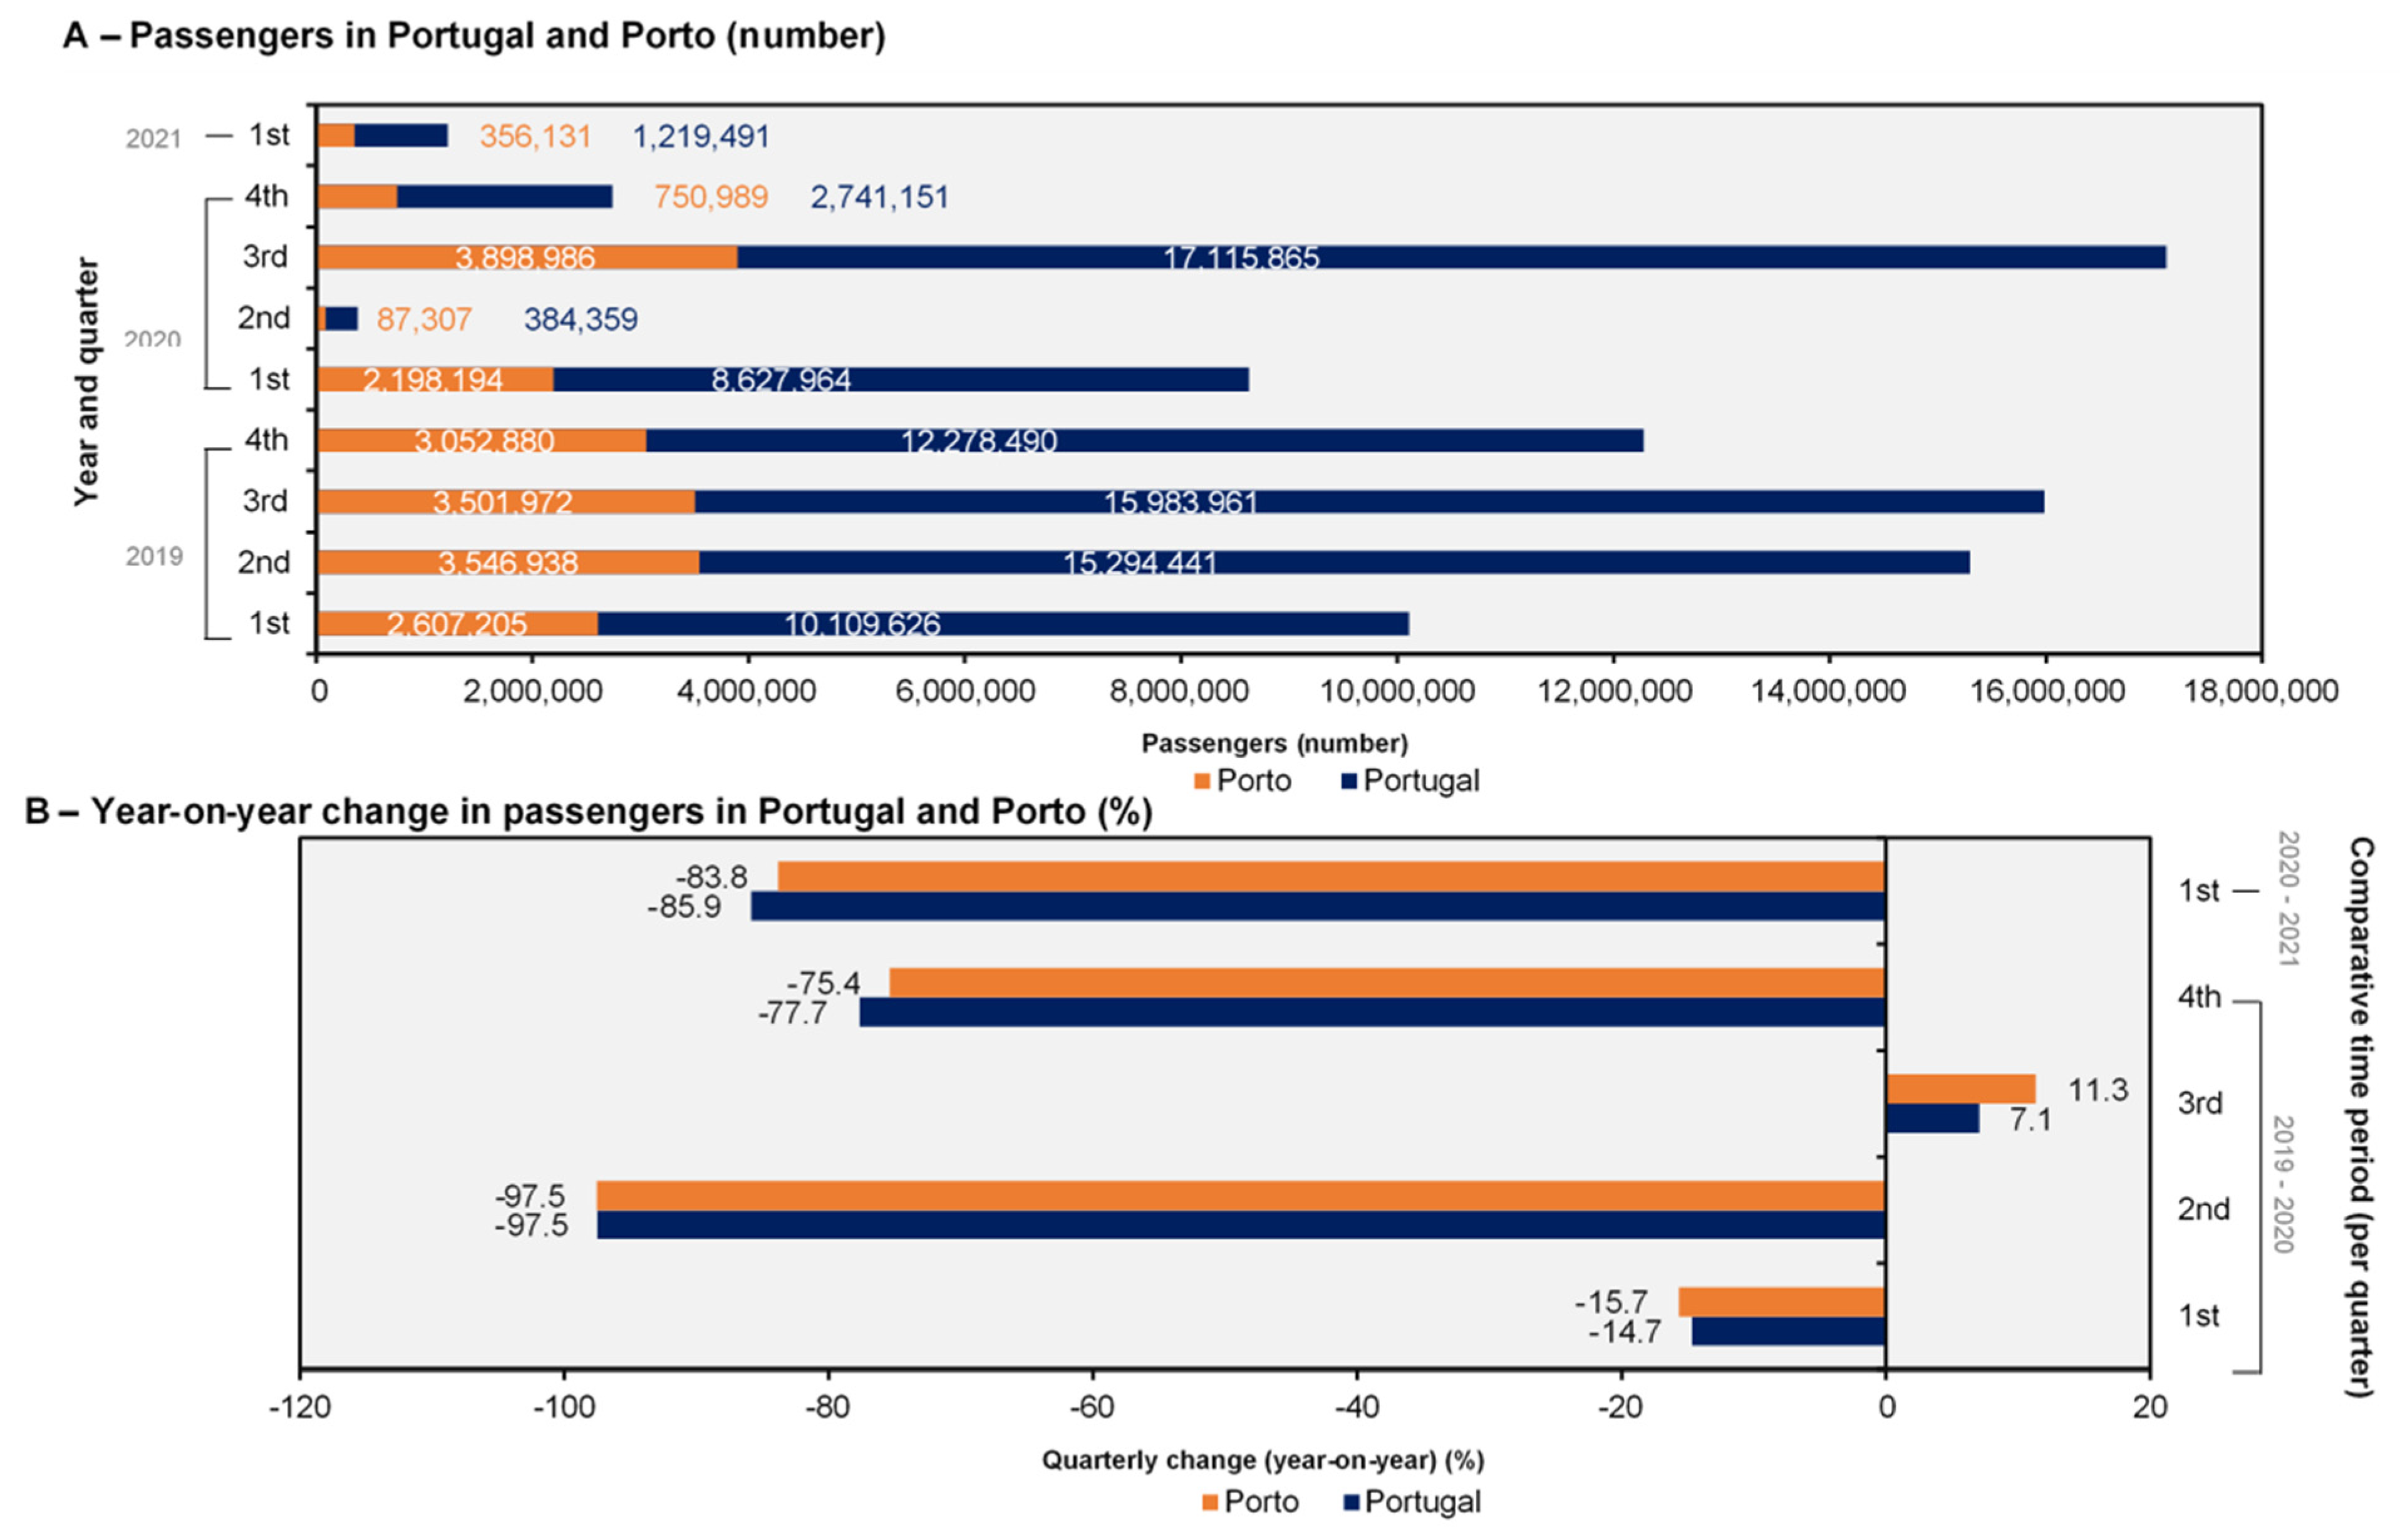
The sociodemographic characteristics of the respondents are shown in Table 1.
It is relevant to note that the basic sociodemographic characteristics of men and women were very similar (men = 49.4%; female = 50.6%). The results were also analogous to those found in other studies carried out in previous years for the same geographic area [73,74,75].
From a total of 563 surveys collected, 417 were selected based on two criteria: season data survey and COVID-19 period. The distribution of visitors by age varied between 15 and 24 (10.1%) and those 65 and over (3.1%), with the majority being in the age group between 25–44 (68.8%). A high proportion of respondents planned the trip one to five months before its completion (44.6%) and the duration of the visit was between two and three days (48.9%), with an emphasis on city break tourists already identified in previous studies having as destination Porto [73,74,75]. Many respondents came from a European country (78.4%), namely in the summer of 2020 (89.1%), which shows the consequences of the lockdowns which several countries were subjected to. The profile of respondents in terms of education is associated with secondary education and undergraduate degree (75.5%).
The Chi-squared test was used to compare the sociodemographic characteristics between the two periods: before and during the COVID-19 pandemic. The results revealed that the sociodemographic characteristics of the study sample were affected by the pandemic in two of the variables (p-value < 0.001). In other words, if in most variables, respondents from 2019 and 2020 showed homogeneous patterns, the same did not happen with the variables ‘travel group size’ and ‘country of origin’.
Several reasons can be pointed out for this behavior. We note the following factors:
(1)
many of the countries did not allow tourists to leave to visit Portugal, and when tourists did, they forced them into lockdown after returning to their country of origin;
(2)
there was a generalized perception of risk, which reduced the number of trips on a large scale and in large groups, in addition to the generalized reduction in tourist excursions in this period. In this regard, the number of tourists traveling alone decreased from 17.9% to 7.6%, whereas the number of tourists who traveled as a couple or with family (usually the closest family, including children) increased.

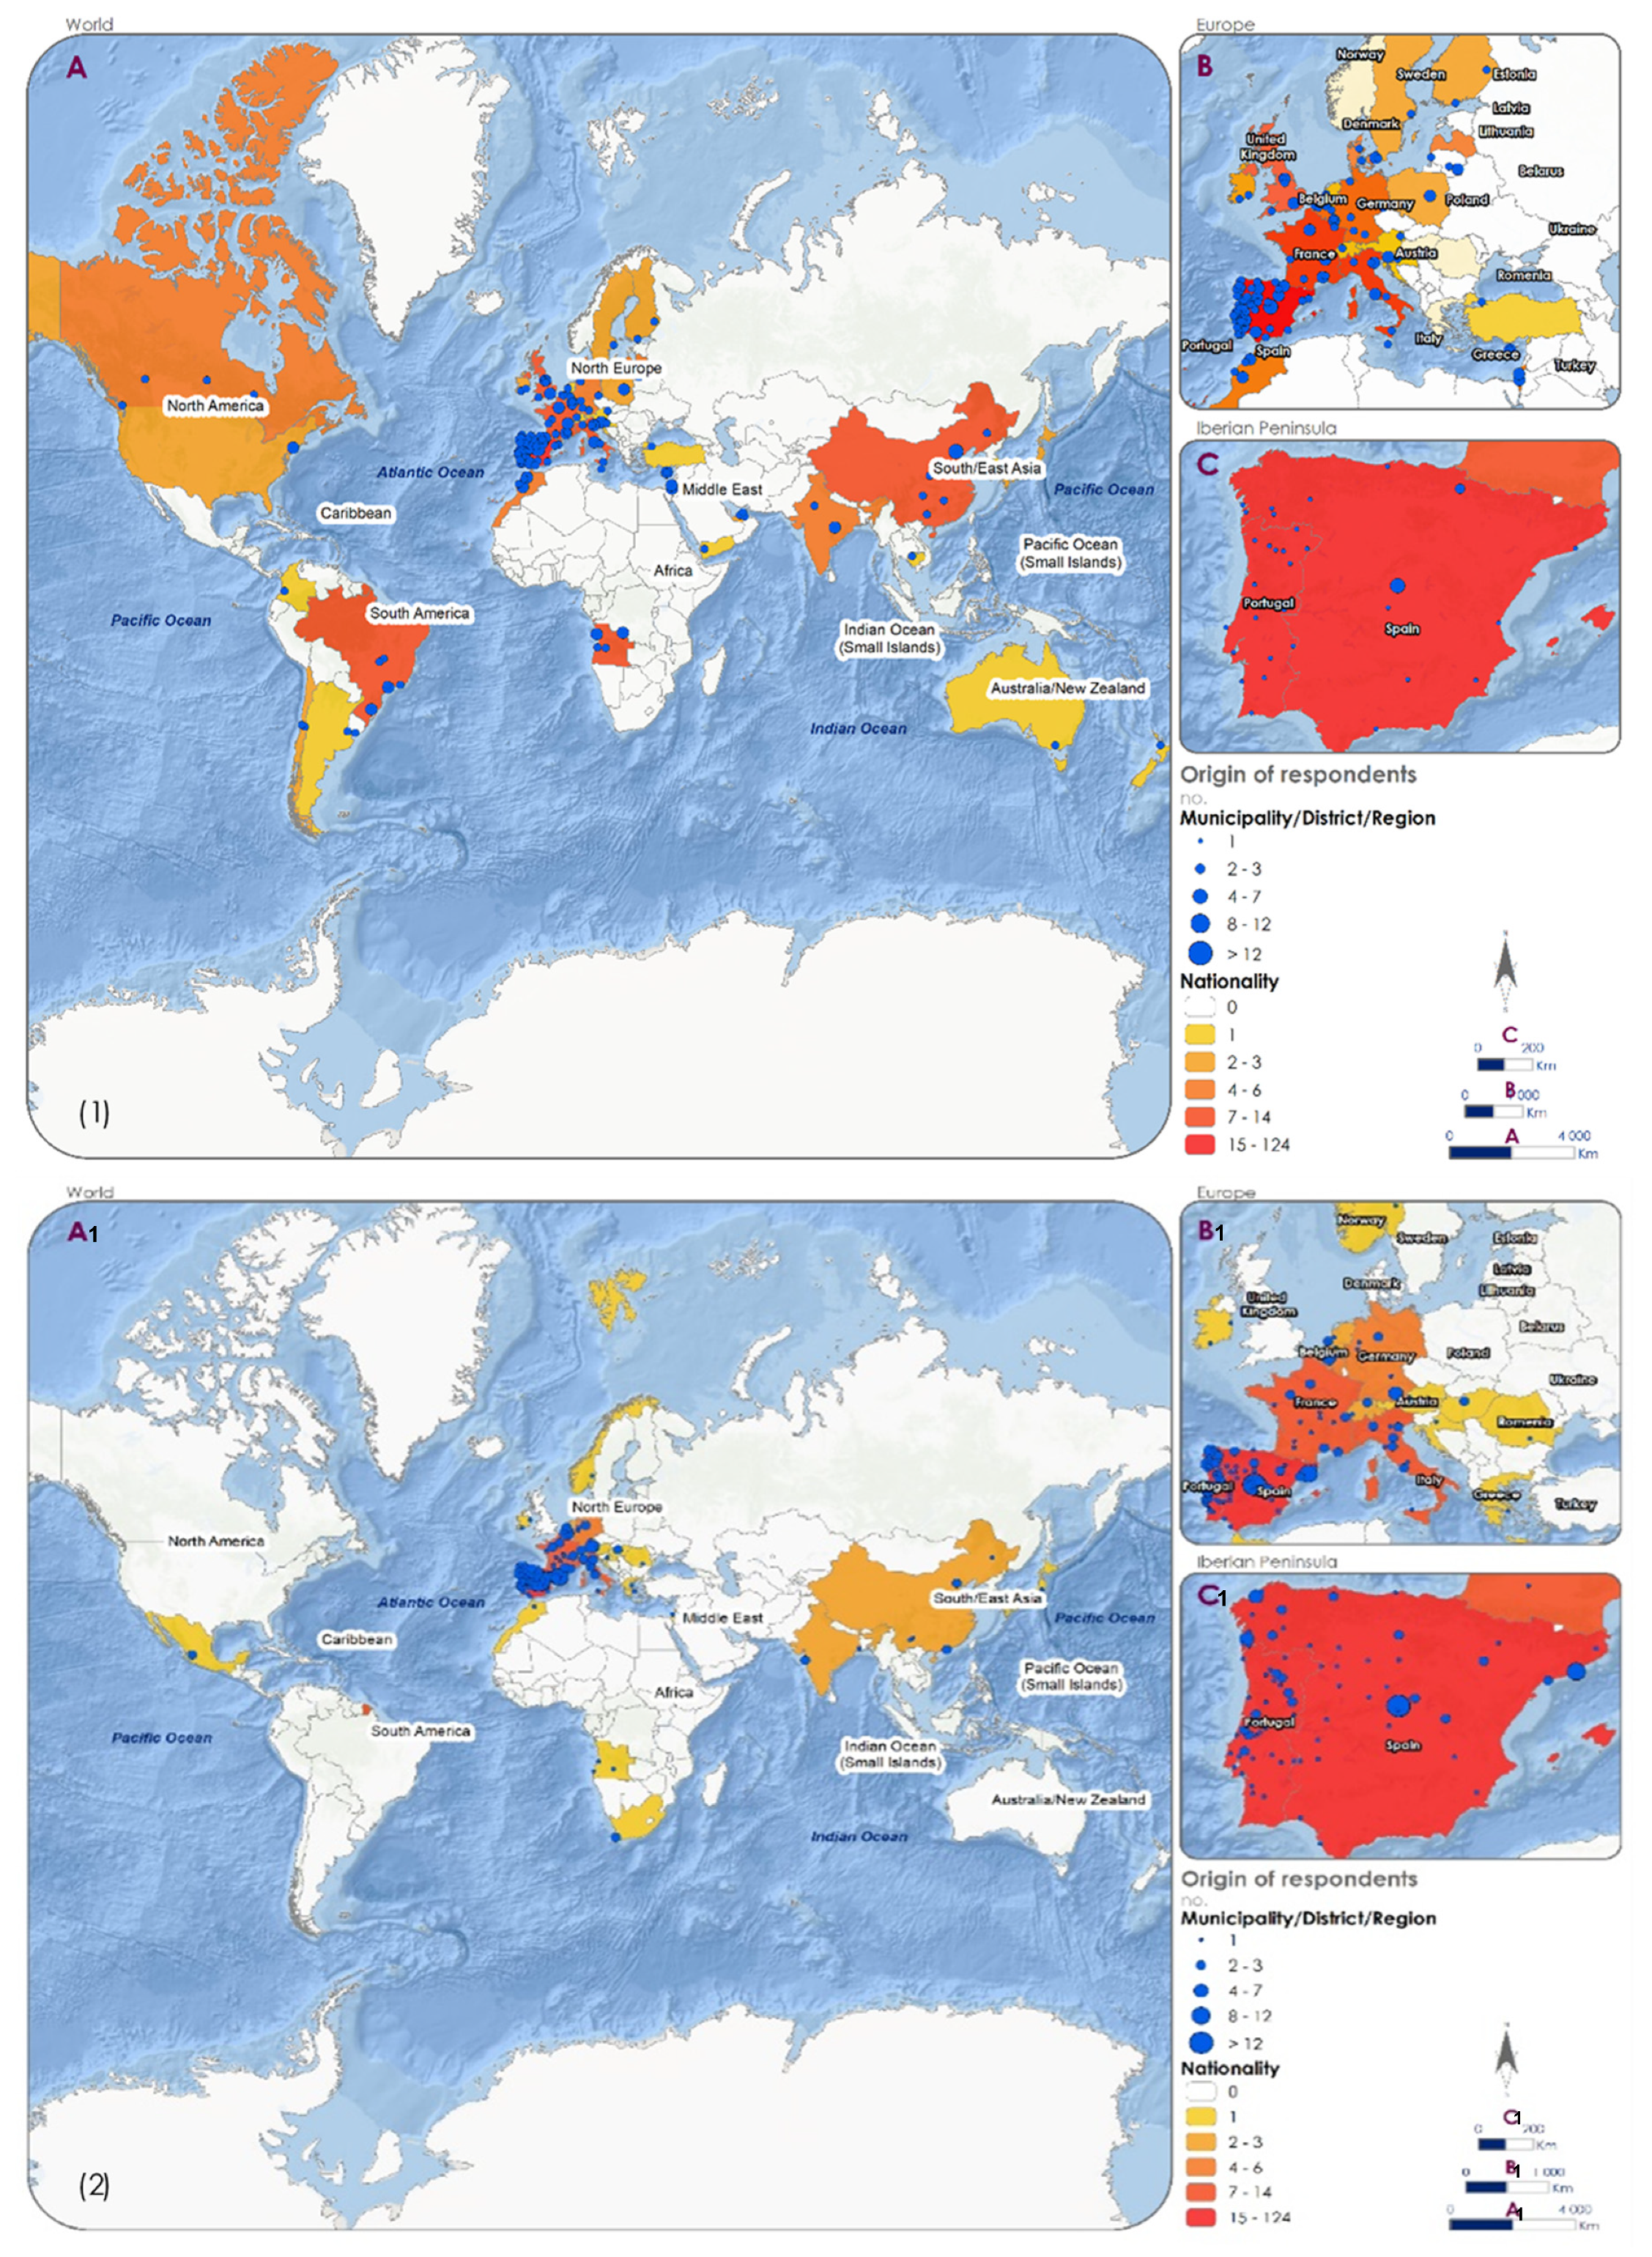
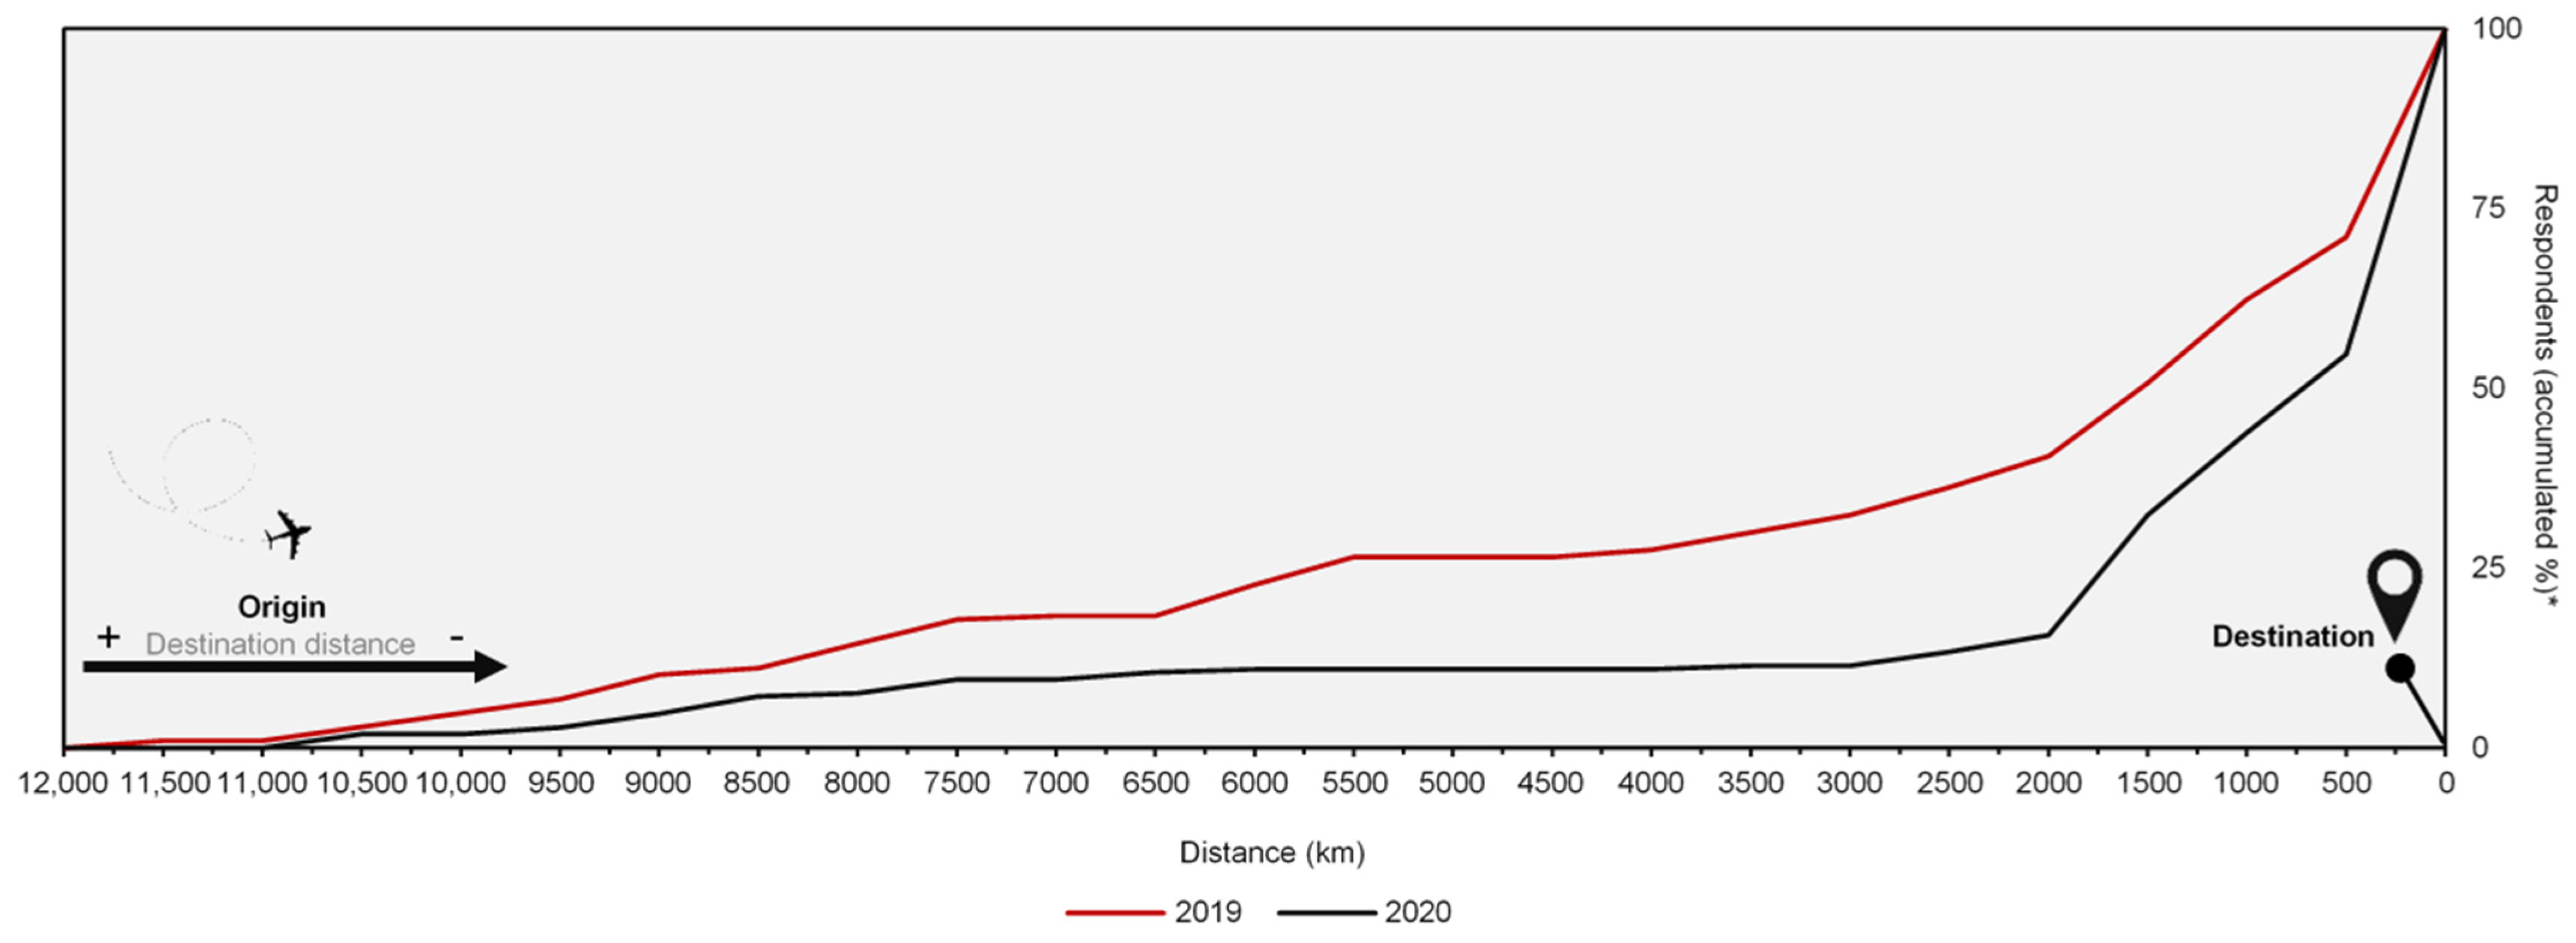
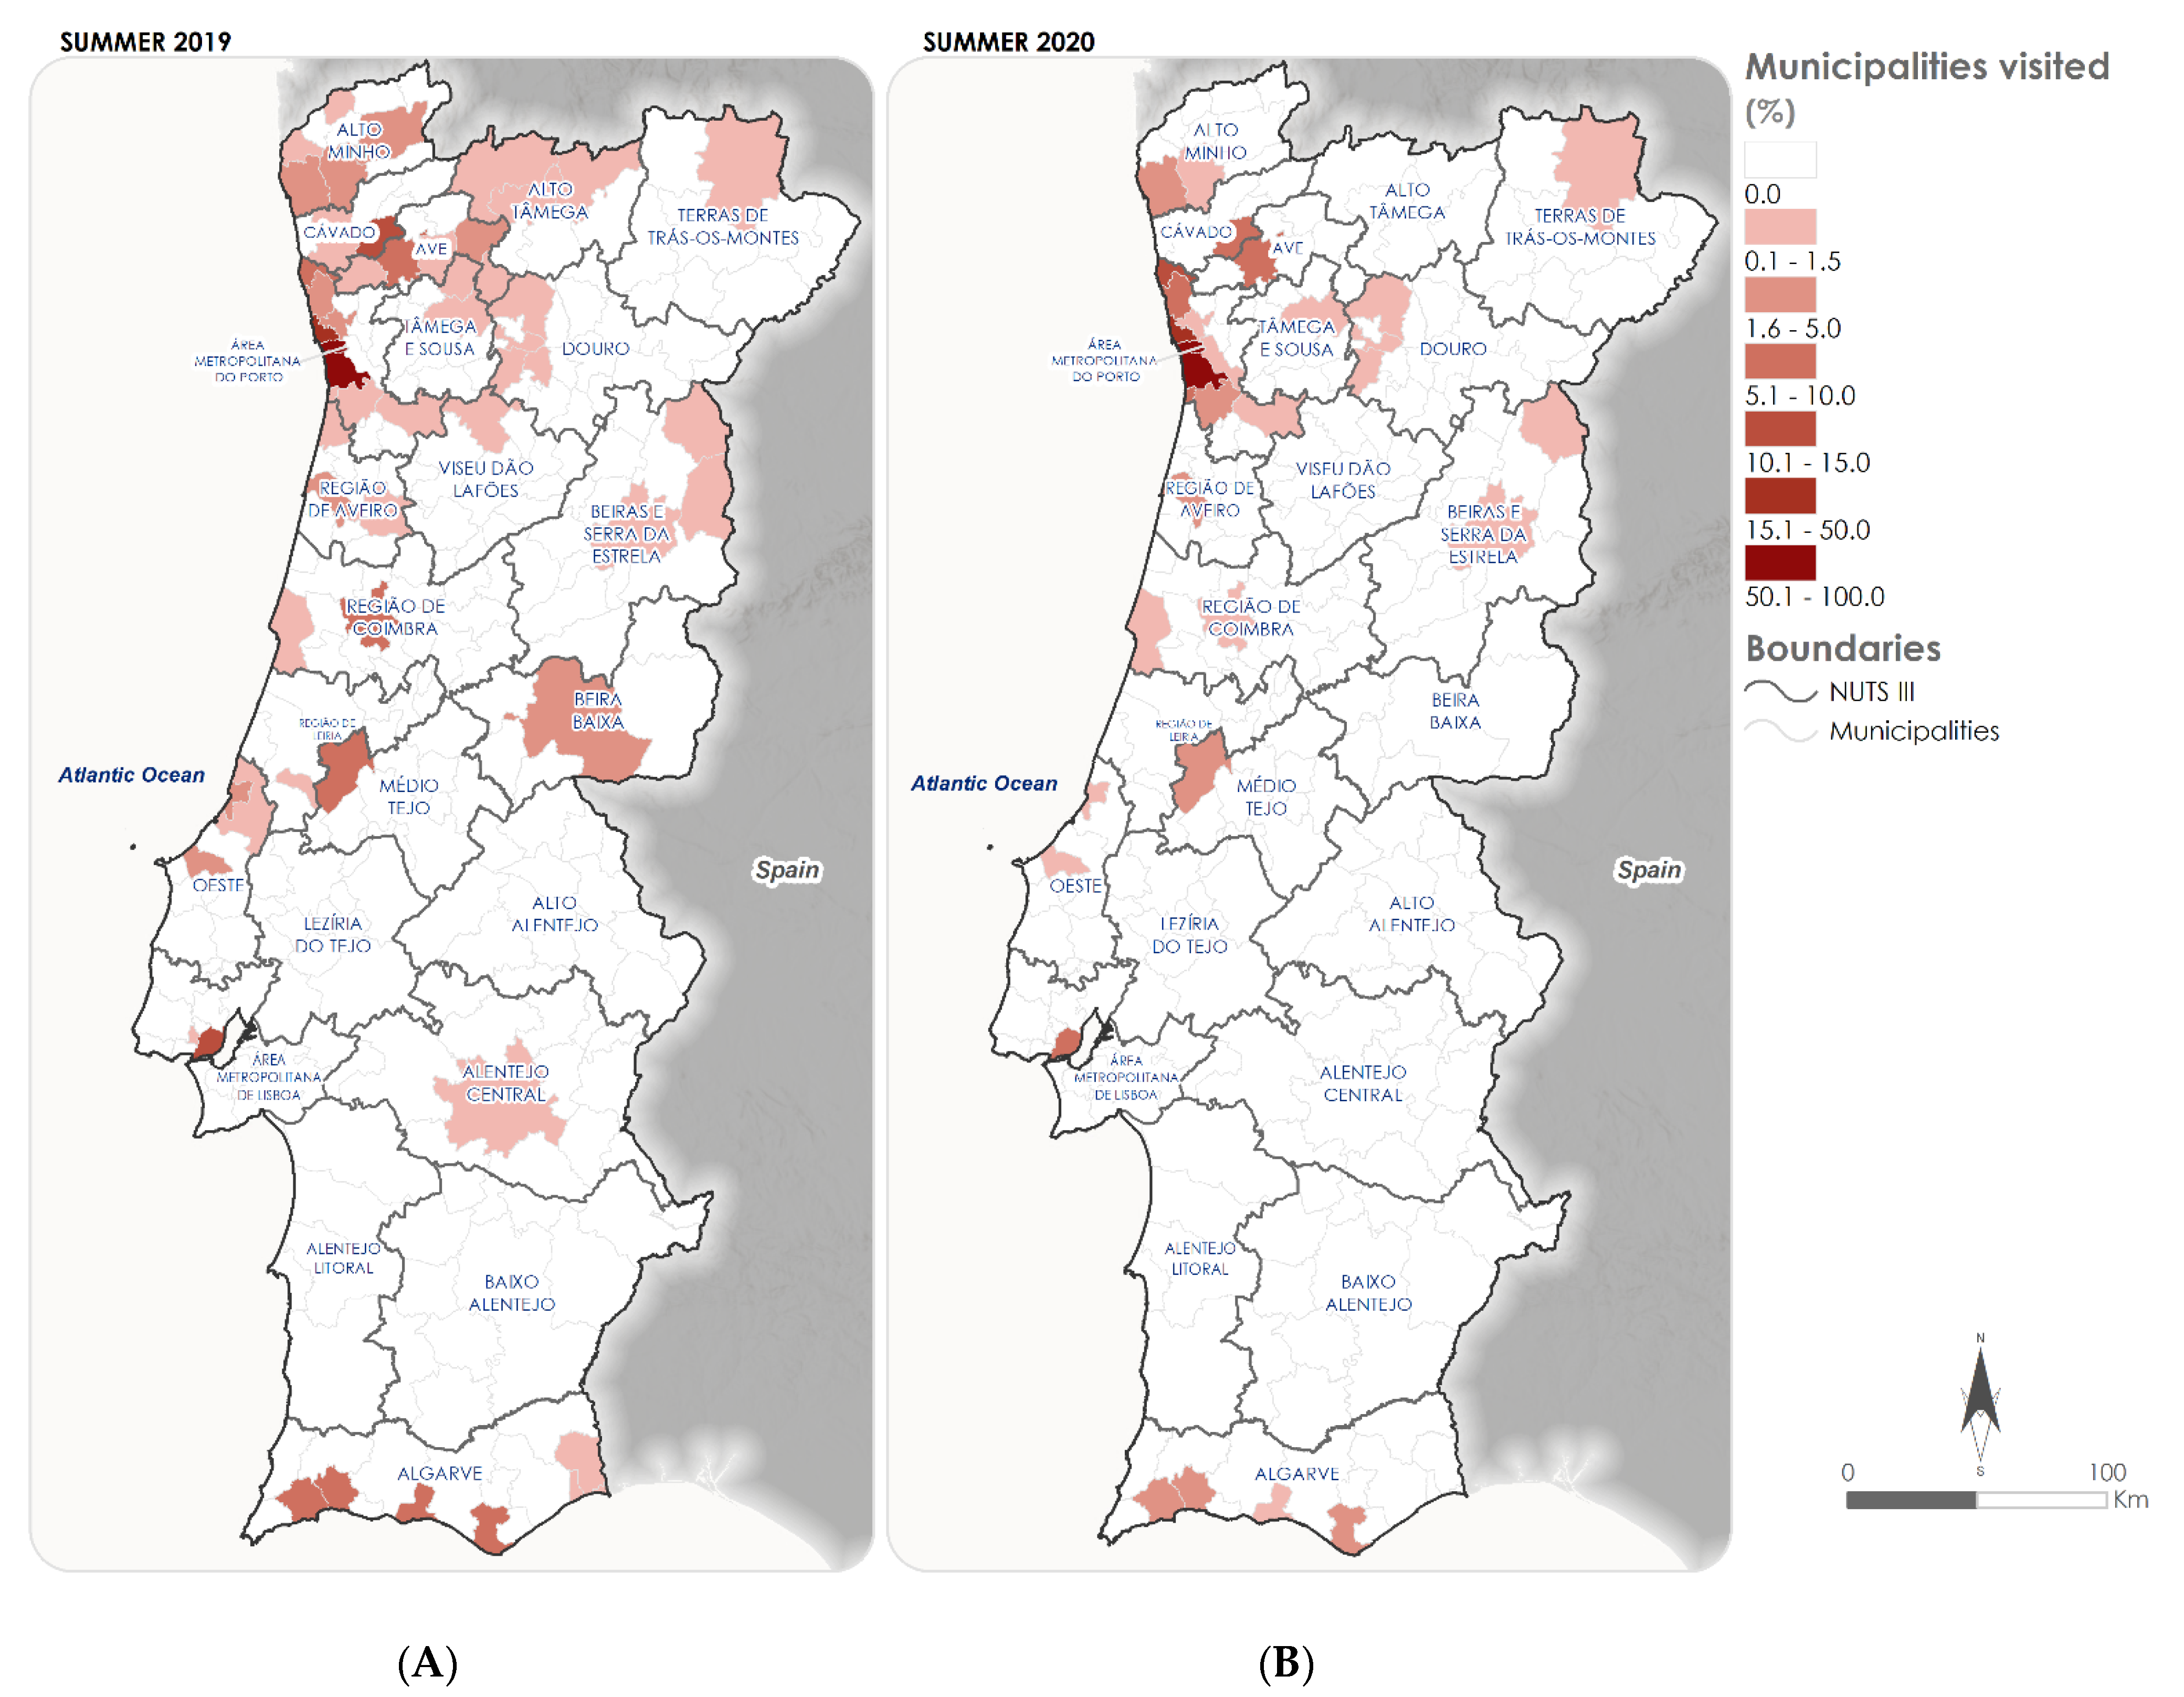
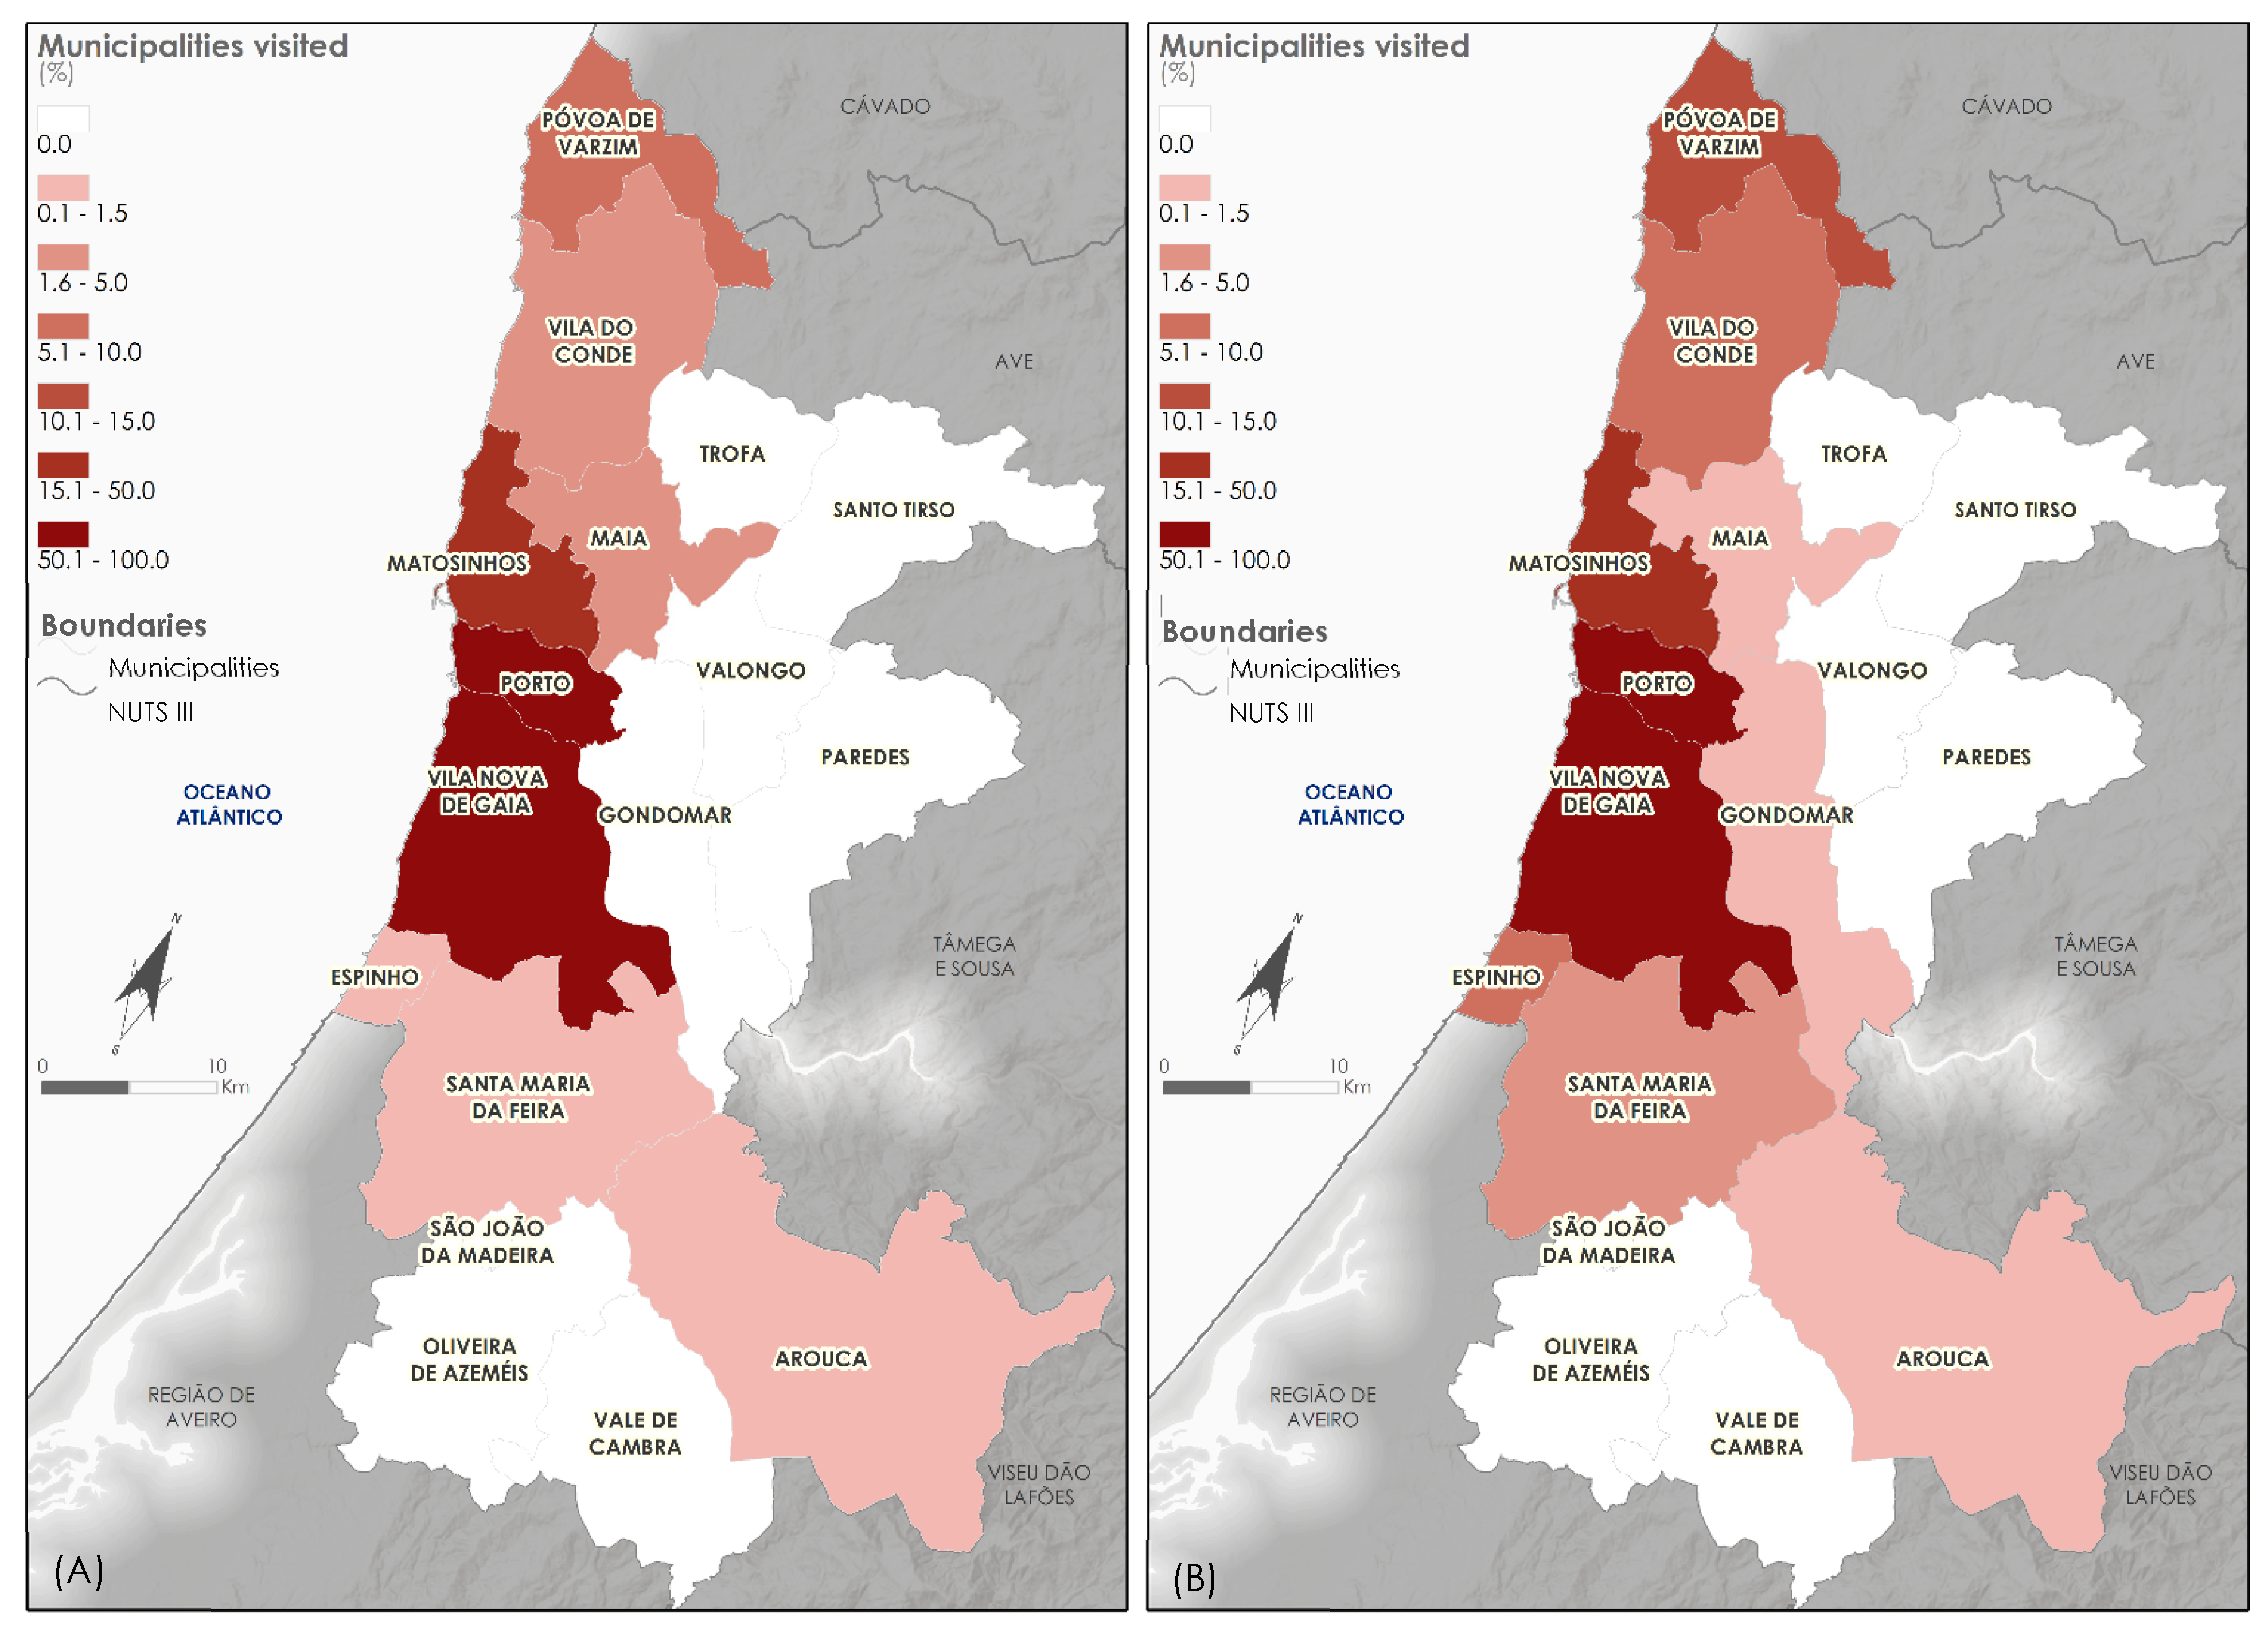
3.2. Geographic Context of Visitation—Tourist Origin and Places Visited in Porto

Some of the main consequences of the change in visitation patterns during the pandemic are related to the origin of tourists (Figure 4), as well as to the decisions made during the visit.
In the case of the visits made in the summer of 2020, there was a significant reduction in respondents from most countries in the world, namely the American continent. Additionally, the absence of tourists from Northern Europe, namely visitors from Sweden and the United Kingdom, was noted. In 2020, there was a predominance of tourists from southern Europe, with an increase of Spanish tourists who chose Porto to spend a few days. The number of individuals who made long-distance journeys decreased in 2020. As a result of the questionnaire applied, the findings show that in 2020, 84.3% of respondents had not traveled more than 2000 km to visit Porto. By contrast, in 2019, only 59.4% of respondents had traveled less than 2000 km away. No significant differences were found between male and female respondents when it came to the distances covered. However, respondents who made longer routes to travel to Porto also spent more days in the city (79.2% of tourists that stayed more than 7 days in the municipality covered more than 7000 km) (Figure 5).
Besides the place of origin of tourists, also the visitation areas have markedly changed during that period (Figure 3).
In the summer of 2020, tourist travel was limited to a much smaller portion of the territory.
In general terms, two characteristics can be pointed out (Figure 6):
(1)
most tourists visited other large or medium-sized cities in addition to Porto (namely Greater Porto, Lisbon, and Algarve and some district capitals);
(2)
tourists took the opportunity to get to know the municipalities bordering Porto (around Porto).
In this regard, it is worth noting that part of this trend can be attributed to two factors:
(i)
the visit pattern associated to the major destinations in Portugal; and
(ii)
the opportunity generated in rural areas as these are considered safer places and with lower possibility of diffusion of COVID-19 infection.
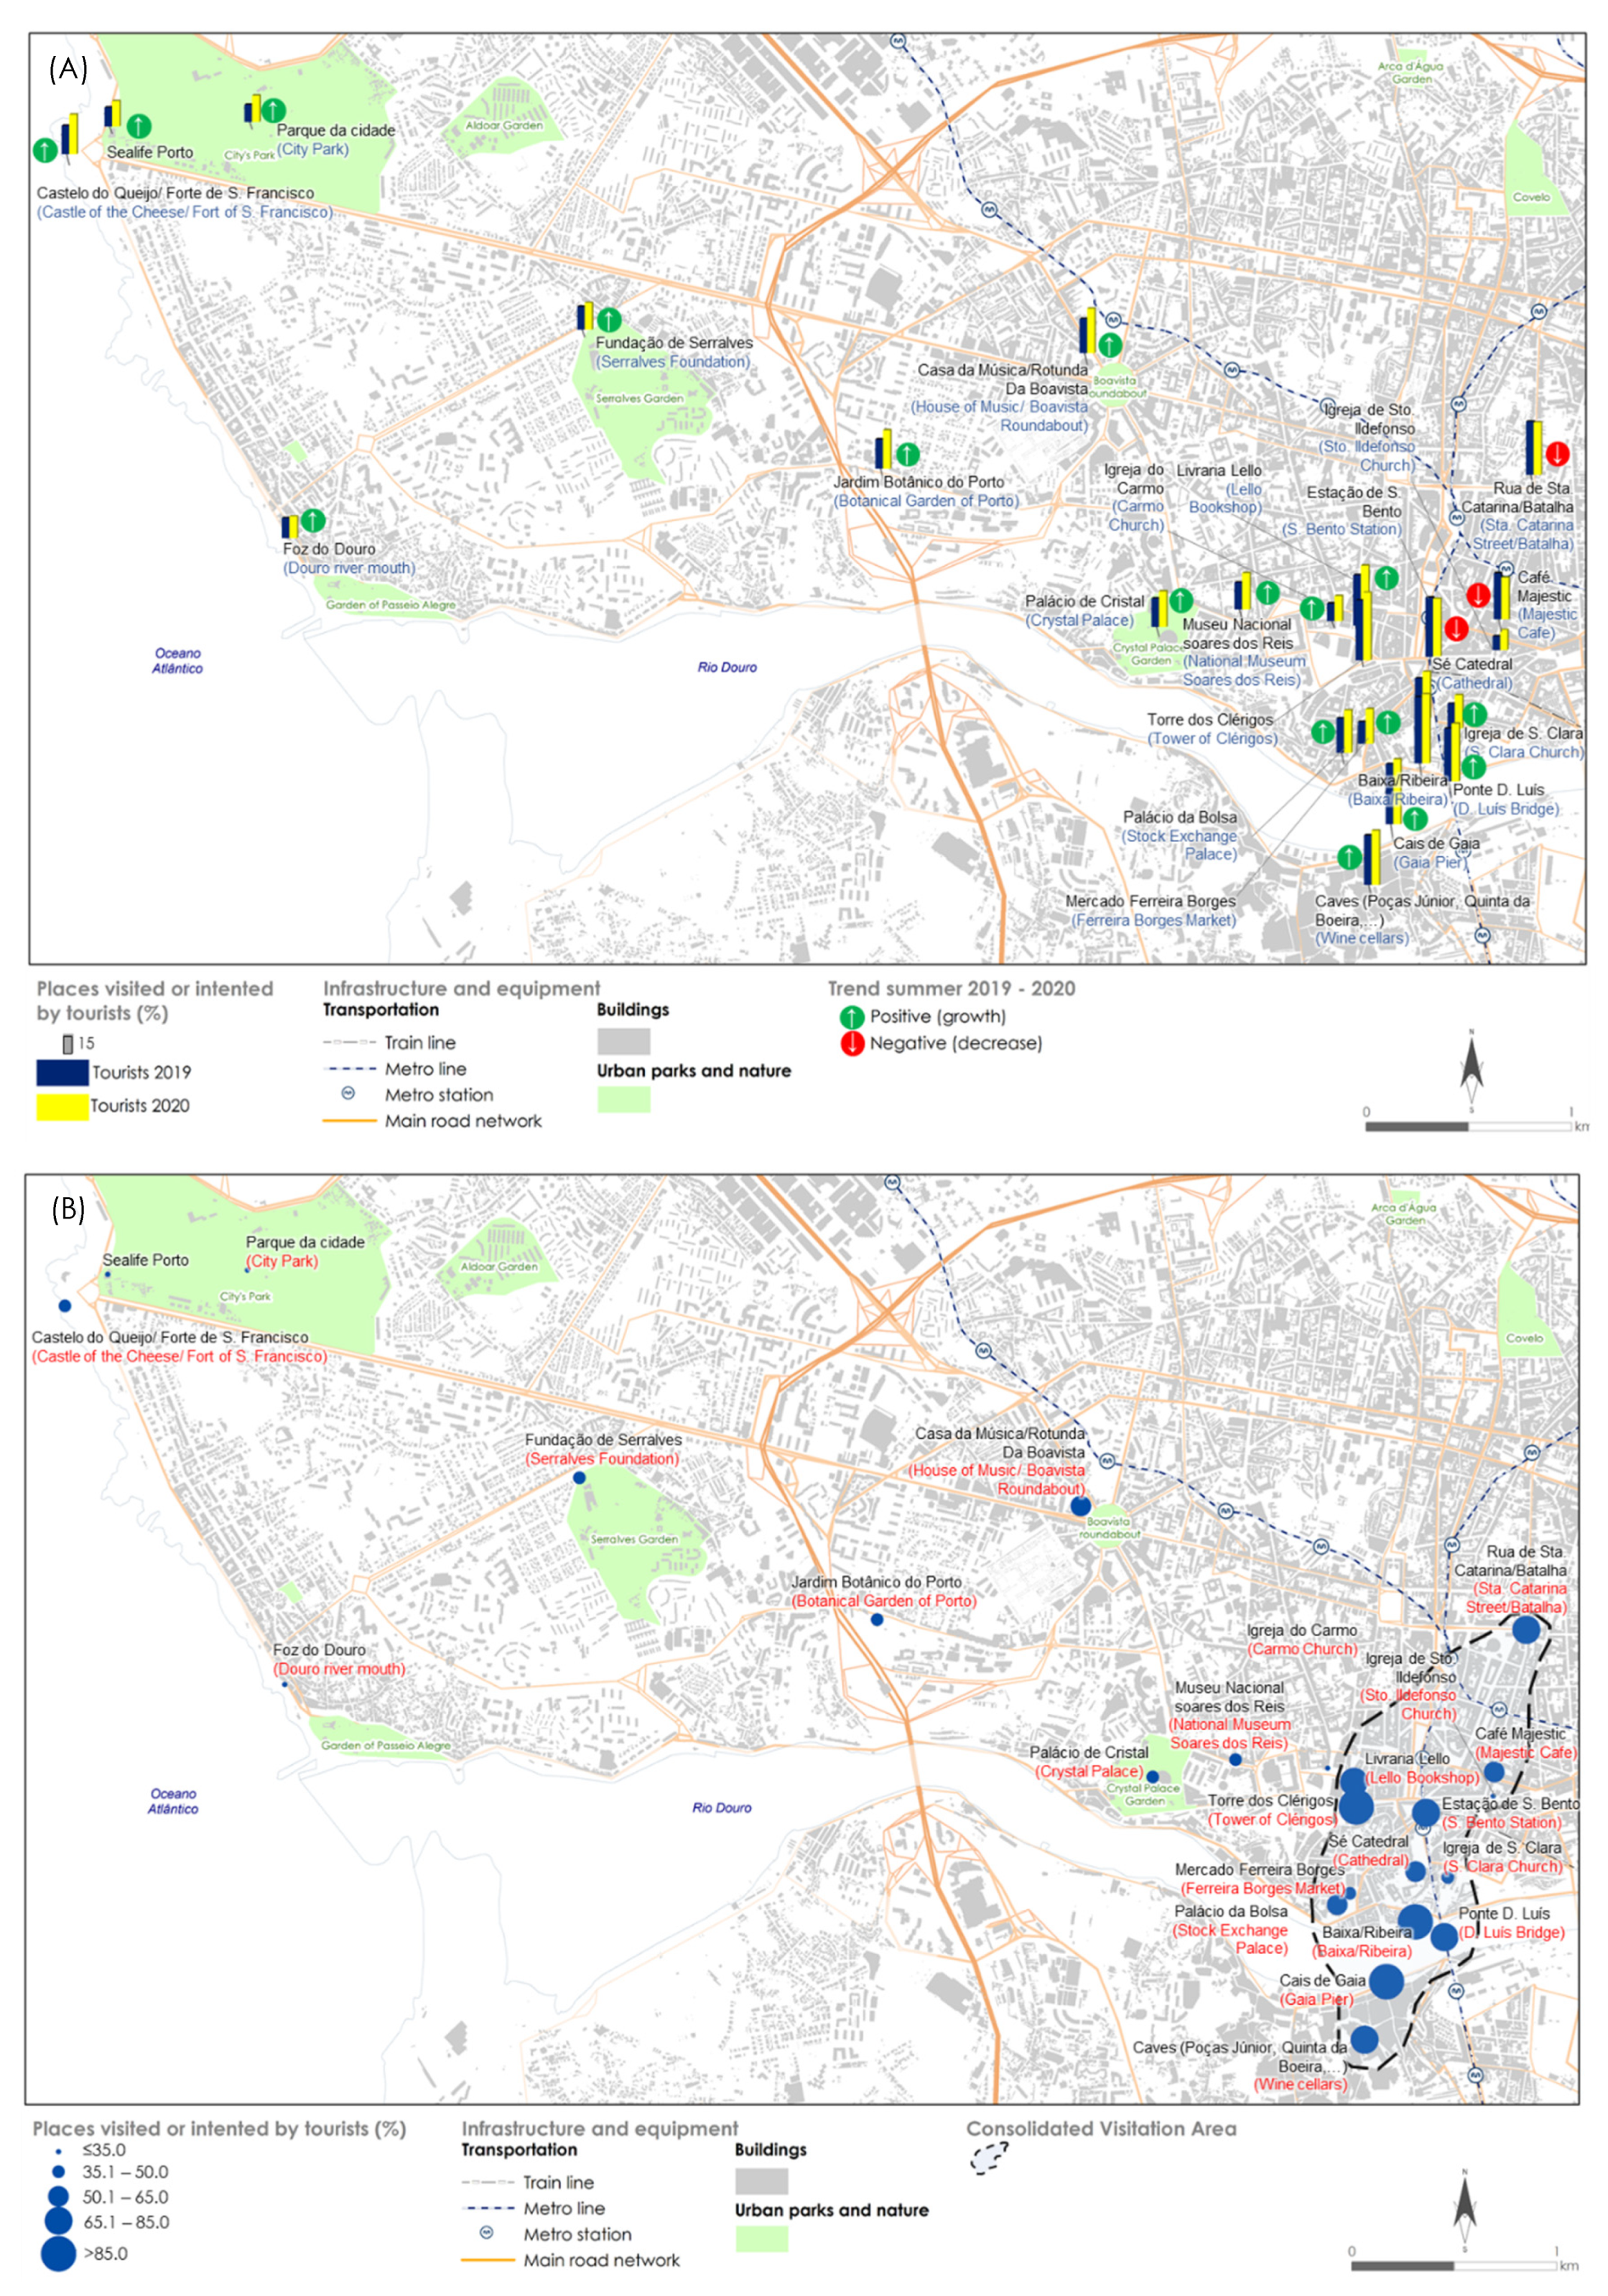
Even so, it was found that when respondents visited Porto (both in 2019 and 2020), they also took the opportunity to visit the municipalities of Braga, Lisbon, Guimarães, Faro, and Ourém, which helped rank them among the 10 most visited municipalities in this period.
A notable increase in the NUTS III Área Metropolitana do Porto (Porto Metropolitan Area) is evident. Further, 69% of respondents only visited the municipality of Porto or another municipality in the NUTS III Área Metropolitana do Porto (Figure 7). The municipality of Vila Nova de Gaia, located south of the municipality of Porto (after the Douro River) is the second most visited municipality by respondents in 2019 and 2020 (over 50% in both years).
Despite everything, tourists who made longer trips were predisposed to visit more places in Portugal, although they limited their travels to large cities. In addition, all tourists whose place of origin is more than 7000 km away, visited at least one more municipality, either in 2019 or 2020. However, if in 2019, 73.3% of respondents who were more than 2500 km from home visited another municipality, in 2020, 85.7% of respondents at a similar distance from their place of origin visited Porto and another municipality in mainland Portugal.
Although it is not possible to define major changes in intraurban visit patterns (Figure 8A,B), it is factual that the tendency to visit (or at least intend to visit) also changed slightly between the summer seasons of 2019 and 2020 (Figure 8B). This result is visible by the number of people who were in each of the places during the summer of 2020, when compared to 2019.
Regarding the places visited between 2019 and 2020, it is worth mentioning two facts:
(1)
the identification of a central area—consolidated—that presented levels of intention to visit by tourists in any of the two years. This behavior is connected with the level of product maturity and the consolidated offer associated with these resources and/or attributes;
(2)
the identification of some tourist areas, whose structures would not be able to receive the same number of tourists in the year 2019 and in the year 2020. The reduction is much higher when it comes to locations respondents associate with the presence of many people.
In any case, inherent to the feeling of security and the perception of risk, significant differences are found both regarding the sociodemographic characteristics, and the respondent’s interest in visiting other geographical areas.

3.3. Risk Perceived by Tourists in Porto

The perception of risk linked to the COVID-19 pandemic during stays has never taken on such an interest in scientific literature as in the years 2020–2021 [7,46,52,56]. Indeed, most tourists have adopted a neutral position regarding the parameters considered for the assessment of risk perception in space public during the COVID-19 period—summer 2020 (Table 2) in the city of Porto.
Apart from that, most respondents considered that they did not feel very safe out in the streets (2.95). The attributes most valued by respondents in relation to the perception of risk at the destination are related to the certification of hotels and their level of adequacy to tourism practice (3.62).
The perceived levels of risk are very different between national tourists vs. foreign tourists and European tourists vs. non-European tourists (Table 3).
Scores between national and foreign tourists demonstrated differences in five of the eleven variables (R2, R4, R7, R8, and R11), which indicates a greater degree of security on the part of national tourists (probably because they are in a familiar context). European tourists and non-European respondents showed significant differences in relation to the concern with the use of a mask in public places and in the adjustment of signs in view of the needs in public space and areas dedicated to tourism (with mean differences in scores of 0.5 and 0.4 between Europeans and non-Europeans for each variable, respectively).
In the summer of 2020, American respondents’ view tended to be of a higher level of risk for most variables (Figure 8). European respondents felt more secure during their visit. Still, in the (global) security assessment, respondents from Africa maintained a more positive view of the destination.
Most tourists surveyed in Porto in 2020 came from Spain (33.8%), Portugal (20.5%), France (8.6%), and Italy (7.6%). Despite the geographical proximity to Portugal and the fact they are all located in Southern Europe, their perception of risk differed quite a lot. The Portuguese once again expressed a lower sense of risk, while French respondents were among the most reluctant towards risk regarding vulnerability to COVID-19 (Figure 9). It must be noticed that Portugal handled the first wave of COVID-19 very well, compared, for instance, to Spain. Portuguese tourists had more positive scores for their perception of the destination in six of the 11 items comparing to Spanish tourists, allowing, moreover, to have a more positive overall opinion—average of items of 3.1 for Spain and 3.4 for Portugal. In addition, during the stay in public spaces in the city of Porto, the respondents of Portuguese nationality felt safer than those of Spanish nationality (3.2 and 3.0, respectively).
Any positive or negative perceptions about the risk of becoming infected with COVID-19 in the destination were influenced by respondents’ perspective on the country and the municipality of Porto. Respondents considered Porto to be a safe place concerning COVID-19 (COVID-free destination—84.3%). The opinions were much more positive than the considerations regarding Portugal as a whole. Nevertheless, 41.9% of respondents considered that Portugal was not a COVID-free destination. In this respect, it was the variables R2 and R11 that most contributed to frictions between the respondents’ opinions regarding Porto as a destination (Table 4). In the case of Portugal, the opinion was mostly unanimous, despite significant differences between those who considered Portugal to be an ‘adjusted to COVID-19 destination’ based on the wearing of masks.
The fact that tourists consider the destination Porto and Portugal safe has partly determined the trips made in the national territory by the respondents and the differences regarding risk considerations among those who visited other municipalities in the NUTS III Área Metropolitana do Porto, as well as those who visited other destinations in Portugal (Table 5). Opinions were mostly unanimous in relation to the visit to other municipalities in the NUTS III Área Metropolitana do Porto. Even so, respondents who visited other municipalities in the country showed significant differences in responses compared to those who visited only the municipality of Porto.
The most negative perspectives on risk on the part of respondents can present a positive relationship with the planning of the trip. In fact, respondents who planned the trip earlier had lower average scores for all variables. These differences were accentuated in five of the variables (p < 0.05—Table 6).

4. Discussion

Scientific evidence shows that the changes in the tourism sector resulting from COVID-19 will be quite irregular in space and time [2,6], in the short and medium terms. During the summer of 2020, there were substantial changes to the visitation profile by the respondents to Porto. First, the closure of borders between countries lasted for three months and at the date of the first inquiries (on 9 July 2021), it had only been a few days since the reestablishment of land borders with Spain (on 1 July 2021). Several countries have maintained air corridors restricted to the national territory (with harmful consequences on tourism activity), with the British case being the most significant one due to the imposition of a ‘traffic light’ system. From the point of view of the results, it is important to mention that these changes in the visited areas of the destination Porto are a direct consequence of the profile of tourists who were able to visit the country and the sense of fear that became widespread among them.
It should be noted that during the summer of 2020, the number of tourists in the city of Porto was much lower, a fact not yet reflected in the surveys. Even so, it is noted that, in addition to the extra day needed to reach the sample volume of the previous year, a greater interpellation by the inquirer was necessary to be able to count on the respondent’s participation. In a study carried out in Austria [76], there was a reduction in the use of public transport due to the feeling of generalized fear. The same is true for the city of Porto. The reality becomes more complex when the number of tourists is reduced, with the profile of tourists also very different. In our investigation, one of the direct consequences is associated with the use of private transport in the trips made, contributing to the increase of tourists of Spanish nationality in relation to the other markets.
Part of the changes in tourism is caused by this situation, with rural areas benefiting most from the fragility of urban destinations. These changes are more visible in the city-break segment.
In Porto, responding tourists tended to reduce travel during their stay in Portugal. When it came to the trips, they were made in coastal municipalities or when traveling to rural areas. There were also trips to big cities [Lisbon (the capital), Braga (Best European Destination in 2021), and Guimarães (cradle of the Portuguese nationality and with a historic center certified by UNESCO in 2001)], or areas known as Sea and Sun destinations (Faro and Albufeira). This did not always mean that tourists felt safe from COVID-19.
Even if during the summer of 2020 (period of the survey), Portugal recorded a small number of cases of COVID-19, it is certain that tourists mentioned feeling a little insecure or showed a neutral position regarding COVID-19. In fact, the perception of risk was a little more significant the longer the period between booking and traveling, as well as the greater the distance-time (origin of respondents) in traveling to enjoy the trip and/or tour package purchased for the destination Porto.
Despite this, the results obtained must be observed as subjective, considering that this is an analysis limited to a set of days and to some tourists who were questioned during their stay in Porto. In addition, during the year 2020, there was the fact that fewer people were available to respond since they were somehow reacting to COVID-19. In addition, it was not possible to consider the opinion of other tourists who canceled their trip to this destination, for personal reasons or for constraints associated with the flights.

5. Conclusions

In the last 100 years, the world has seen several outbreaks of viruses with different levels of infection and mortality rates [2,77,78]. In fact, infectious diseases have played a fundamental role in the selection of sectoral policies for many decades, with important repercussions on communities and local and regional economies [79]. COVID-19 adds to these problems the significant impacts on the tourism sector, making it crucial to reconfigure the recovery practices of the tourism sector, while the pandemic persists.
In response to these problems generated by COVID-19 and the long-term solutions to this health crisis, a ‘new normal’ emerges that recognizes the surfacing of other tensions, with urgent resolution needs in the tourism sector. Tourism destinations are already seeking to articulate more resilient measures packages in the face of COVID-19’s new impactful reality, although they are often centered on specific and disintegrated solutions.
This study presented a geographic analysis as the main reflex of the evolution of the logics of displacement during the pandemic, both inside the city and when traveling to other geographic areas. It is essential, given the results obtained in the study, that cities invest in recovery scenarios based on multiple variables of vulnerability (sociodemographic, economic, and environmental).
Based on our investigation, and aiming to point out some strategic solutions, we leave here the following observations.
(1)
Promptness in the short-term reconfiguration of the strategy aimed at cities in the last decades based on mass tourism. It is essential to prioritize options based on the carrying capacity (less tourists) and based on shorter stays, the use of less means of transport (namely the plane—valuing domestic tourism) and the valorization of pre-existing resources and attributes in urban context.
(2)
Design models of action based on solutions to climate crisis. The pace of growth in the tourism sector reveals enormous environmental pressure on the planet [80], and it is now essential to define the priorities for action, based on balanced development or economic growth in the medium to long term. Among some of the most pressing interventions to reach sustainable development is the adoption of environmental codes to enter tourism destinations, in addition to accounting for the carbon footprint.
(3)
Define concrete plans for the restoration of the tourism sector in the short term. This intervention must start on a national scale (namely with the introduction of economic replacement measures for the entry of tourists already vaccinated against COVID-19 or the application of a guiding document for the recovery of the economic activity of tourism), but also at a local level, namely with the readjustment of planning instruments, the clear identification of areas of tourist decline during the COVID-19 period and of those which deserve special attention in a post-pandemic ‘new normal’.
(4)
Establish living areas in the city—small bubbles of green areas, which allow the connection between residents and tourists, but whose structures are spaced out to reduce concentrations. At an international level, it was proven during the first lockdown period and post-lockdown that the problems were aggravated as access to leisure areas and green spaces in cities were partially blocked and/or limited only to residents [27,76].
(5)
Establish links between different tourist segments, through promotion, dissemination, and marketing by regional and local entities. The solution may be to create visiting passports with a focus on the tourist profile—to allow for different experiences to be lived, but with greater control over the footprint at the destination and the maintenance of safety conditions in eventual health crises.
Regardless of any solutions to be implemented, it is essential that the defined guidelines are properly articulated given the complementarity between agents of the same geographical level and the subsidiarity in a bottom-up approach—national strategy, regional plans, and local rules and regulations. The transformations that may occur must be based on an institutional innovation matrix, which allows tourist destinations to emerge from the crisis and to solve the issues of environmental, economic, and social sustainability [81,82].

Future Research Directions

Research challenges and trends are fundamental for the redesign of the thematic guidelines developed within the scope of the various fields of science associated with the COVID-19 pandemic. In tourism studies, this research highlights the need to consider new paths oriented to intra and inter-destination visitation. Tourism practices can be revisited and redefined through resilience, collaboration, and co-creation [25].
For this, in terms of guidelines for urban tourism practices, this research highlights several research challenges:
(1)
Identifying the key market trends in the post-pandemic tourism and more recurring basis. The study presented should also be carried out in other seasons of the year and in other phases of evolution of COVID-19, although this is not always viable in person.
(2)
Contributing with a prospective online study seeking to ask potential tourists about the desire to return a destination or the risk assessment after visiting certain destinations.
(3)
Analyzing the level of importance of socio-demographic, economic, and political-sectorial factors to trigger recovery actions. Each city/municipality/region can examine the essential determinants to cope with the consequences of the options and the obstacles caused in the tourism sector in the short, medium, and long term.
It seems clear that when it comes to tourism and the adaptation to pandemic contexts, there is always room for studies which allow to rethink solutions and guide the paths of tourism activity and territory planning in a broader view of intervention.

Author Contributions

Conceptualization, H.d.S.L., P.C.R., V.R. and J.M.-V.; methodology, H.d.S.L., P.C.R., V.R. and J.M.-V.; software, H.d.S.L., P.C.R., V.R. and J.M.-V.; validation, H.d.S.L., P.C.R., V.R. and J.M.-V.; formal analysis, H.d.S.L., P.C.R., V.R. and J.M.-V.; investigation, H.d.S.L., P.C.R., V.R. and J.M.-V.; resources, H.d.S.L., P.C.R., V.R. and J.M.-V.; data curation, H.d.S.L., P.C.R., V.R. and J.M.-V.; writing—original draft preparation, H.d.S.L., P.C.R., V.R. and J.M.-V.; writing—review and editing, H.d.S.L., P.C.R., V.R. and J.M.-V.; visualization, H.d.S.L., P.C.R., V.R. and J.M.-V.; supervision, H.d.S.L., P.C.R., V.R. and J.M.-V.; project administration, H.d.S.L., P.C.R., V.R. and J.M.-V.; funding acquisition, H.d.S.L., P.C.R., V.R. and J.M.-V. All authors have read and agreed to the published version of the manuscript.

Funding

This research was funded by FCT Portugal, grant number SFRH/BD/129153/2017 and Lab2PT—Landscapes, Heritage and Territory Laboratory—AUR/04509 and FCT through national funds and when applicable of the FEDER co-financing, in the aim/under the scope of the new-partnership agreement PT2020 and COMPETE2020– POCI 01 0145 FEDER 007528.

Institutional Review Board Statement

Ethical review and approval were waived for this study. The project ‘The influence of Climate and Urban Morphology in the Porto Metropolitan Area on Tourism Activity: Perceptions and Simulation of Bioclimatic Comfort’ was approved in September 2017 (funded by FCT Portugal, grant number SFRH/BD/129153/2017 and approved at University of Minho with reference ICS-120/2017). The University of Minho began to demand the approval of projects by the ethics committee in 2018 (deliberation CEUMinho-2/2018, December 2018). This project was not covered by the deliberation. Therefore, ethics committee approval was not required.

Informed Consent Statement

Informed consent was obtained from all subjects involved in the study.

Data Availability Statement

The data presented in this study are available on request from the corresponding author by reasonable request.

Conflicts of Interest

The authors declare no conflict of interest.

Appendix A

Sustainability 13 06399 i001
Sustainability 13 06399 i002
Sustainability 13 06399 i003
Sustainability 13 06399 i004
Sustainability 13 06399 i005

References

  1. Davahli, M.R.; Karwowski, W.; Sonmez, S.; Apostolopoulos, Y. The hospitality industry in the face of the COVID-19 pandemic: Current topics and research methods. Int. J. Environ. Res. Public Health 2020, 17, 7366. [Google Scholar] [CrossRef] [PubMed]
  2. Gössling, S.; Scott, D.; Hall, C.M. Pandemics, tourism and global change: A rapid assessment of COVID-19. J. Sustain. Tour. 2020. [Google Scholar] [CrossRef]
  3. EC Economic Performance and Forecasts. Available online: https://ec.europa.eu/info/business-economy-euro/economic-performance-and-forecasts_en (accessed on 11 February 2021).
  4. OECD OECD Policy Responses to Coronavirus (COVID-19): Rebuilding Tourism for the Future: COVID-19 Policy Response and Recovery. Available online: http://www.oecd.org/coronavirus/policy-responses/rebuilding-tourism-for-the-future-covid-19-policy-responses-and-recovery-bced9859/ (accessed on 11 February 2021).
  5. UNWTO 2020: Worst Year in Tourism History with 1 Billion Fewer International Arrivals. Available online: https://www.unwto.org/news/2020-worst-year-in-tourism-history-with-1-billion-fewer-international-arrivals (accessed on 11 February 2021).
  6. Hall, C.M.; Scott, D.; Gössling, S. Pandemics, transformations and tourism: Be careful what you wish for. Tour. Geogr. 2020, 1–22. [Google Scholar]
  7. Neuburger, L.; Egger, R. Travel risk perception and travel behaviour during the COVID-19 pandemic 2020: A case study of the DACH region. Curr. Issues Tour. 2020, 1–14. [Google Scholar] [CrossRef]
  8. De Vos, J. The effect of COVID-19 and subsequent social distancing on travel behavior. Transp. Res. Interdiscip. Perspect. 2020, 5, 100121. [Google Scholar] [CrossRef]
  9. Quilty, B.J.; Diamond, C.; Liu, Y.; Gibbs, H.; Russell, T.W.; Jarvis, C.I.; Prem, K.; Pearson, C.A.B.; Clifford, S.; Flasche, S. The effect of inter-city travel restrictions on geographical spread of COVID-19: Evidence from Wuhan, China. BMC Med. 2020. [Google Scholar] [CrossRef]
  10. Falk, M.T.; Hagsten, E. The unwanted free rider: Covid-19. Curr. Issues Tour. 2020, 1–6. [Google Scholar] [CrossRef]
  11. Borkowski, P.; Jażdżewska-Gutta, M.; Szmelter-Jarosz, A. Lockdowned: Everyday mobility changes in response to COVID-19. J. Transp. Geogr. 2021, 90, 102906. [Google Scholar] [CrossRef]
  12. Brito-Henriques, E. Arruinamento e regeneração do espaço edifìcado na metrópole do século XXI: o caso de Lisboa. EURE 2017. [Google Scholar] [CrossRef] [Green Version]
  13. Cocola-Gant, A. Tourism gentrification. In Handbook of Gentrification Studies; Edward Elgar Publishing: Cheltenham, UK, 2018. [Google Scholar]
  14. Rigolon, A.; Németh, J. “We’re not in the business of housing”: Environmental gentrification and the nonprofitization of green infrastructure projects. Cities 2018, 81, 71–80. [Google Scholar] [CrossRef]
  15. López-Gay, A.; Cocola-Gant, A.; Russo, A.P. Urban tourism and population change: Gentrification in the age of mobilities. Popul. Space Place 2020, 27, e2380. [Google Scholar] [CrossRef]
  16. Cocola-Gant, A.; Lopez-Gay, A. Transnational gentrification, tourism and the formation of ‘foreign only’enclaves in Barcelona. Urban Stud. 2020, 57, 3025–3043. [Google Scholar] [CrossRef]
  17. Almeida-García, F.; Cortés-Macías, R.; Parzych, K. Tourism Impacts, Tourism-Phobia and Gentrification in Historic Centers: The Cases of Málaga (Spain) and Gdansk (Poland). Sustainability 2021, 13, 408. [Google Scholar] [CrossRef]
  18. González-Pérez, J.M. The dispute over tourist cities. Tourism gentrification in the historic Centre of Palma (Majorca, Spain). Tour. Geogr. 2019, 22, 171–191. [Google Scholar] [CrossRef]
  19. Sheller, M. Reconstructing tourism in the Caribbean: Connecting pandemic recovery, climate resilience and sustainable tourism through mobility justice. J. Sustain. Tour. 2020. [Google Scholar] [CrossRef]
  20. Couto, G.; Castanho, R.A.; Pimentel, P.; Carvalho, C.; Sousa, Á.; Santos, C. The impacts of COVID-19 crisis over the tourism expectations of the Azores archipelago residents. Sustainability 2020, 12, 7612. [Google Scholar] [CrossRef]
  21. Haywood, K.M. A post COVID-19 future-tourism re-imagined and re-enabled. Tour. Geogr. 2020, 22, 599–609. [Google Scholar] [CrossRef]
  22. Jones, P.; Comfort, D. The COVID-19 crisis, tourism and sustainable development. Athens J. Tour. 2020, 7, 75–86. [Google Scholar] [CrossRef]
  23. Higgins-Desbiolles, F. The “war over tourism”: Challenges to sustainable tourism in the tourism academy after COVID-19. J. Sustain. Tour. 2020, 29, 551–569. [Google Scholar] [CrossRef]
  24. Galvani, A.; Lew, A.A.; Perez, M.S. COVID-19 is expanding global consciousness and the sustainability of travel and tourism. Tour. Geogr. 2020, 22, 567–576. [Google Scholar] [CrossRef]
  25. Persson-Fischer, U.; Liu, S. The Impact of a Global Crisis on Areas and Topics of Tourism Research. Sustainability 2021, 13, 906. [Google Scholar] [CrossRef]
  26. Ghosh, S. Asymmetric impact of COVID-19 induced uncertainty on inbound Chinese tourists in Australia: Insights from nonlinear ARDL model. Quant. Financ. Econ. 2020. [Google Scholar] [CrossRef]
  27. Sharifi, A.; Khavarian-Garmsir, A.R. The COVID-19 pandemic: Impacts on cities and major lessons for urban planning, design, and management. Sci. Total Environ. 2020, 749, 142391. [Google Scholar] [CrossRef]
  28. Pasquinelli, C.; Trunfio, M.; Bellini, N.; Rossi, S. Sustainability in Overtouristified Cities? A Social Media Insight into Italian Branding Responses to Covid-19 Crisis. Sustainability 2021, 13, 1848. [Google Scholar] [CrossRef]
  29. Jeon, C.-Y.; Yang, H.-W. The structural changes of a local tourism network: Comparison of before and after COVID-19. Curr. Issues Tour. 2021, 1–15. [Google Scholar] [CrossRef]
  30. Napierała, T.; Leśniewska-Napierała, K.; Burski, R. Impact of geographic distribution of COVID-19 cases on hotels’ performances: Case of Polish cities. Sustainability 2020, 12, 4697. [Google Scholar] [CrossRef]
  31. Kowalski, R.M.; Black, K.J. Protection Motivation and the COVID-19 Virus. Health Commun. 2021, 36, 15–22. [Google Scholar] [CrossRef] [PubMed]
  32. Rogers, R.W. A Protection Motivation Theory of Fear Appeals and Attitude Change1. J. Psychol. 1975, 91, 93–114. [Google Scholar] [CrossRef] [PubMed]
  33. Itani, O.S.; Hollebeek, L.D. Light at the end of the tunnel: Visitors’ virtual reality (versus in-person) attraction site tour-related behavioral intentions during and post-COVID-19. Tour. Manag. 2021, 84, 104290. [Google Scholar] [CrossRef]
  34. Bhati, A.S.; Mohammadi, Z.; Agarwal, M.; Kamble, Z.; Donough-Tan, G. Motivating or manipulating: The influence of health-protective behaviour and media engagement on post-COVID-19 travel. Curr. Issues Tour. 2020, 1–5. [Google Scholar] [CrossRef]
  35. Zheng, D.; Luo, Q.; Ritchie, B.W. Afraid to travel after COVID-19? Self-protection, coping and resilience against pandemic ‘travel fear’. Tour. Manag. 2021, 83, 104261. [Google Scholar] [CrossRef]
  36. Das, S.S.; Tiwari, A.K. Understanding international and domestic travel intention of Indian travellers during COVID-19 using a Bayesian approach. Tour. Recreat. Res. 2020, 1–17. [Google Scholar] [CrossRef]
  37. Wang, J.; Liu-Lastres, B.; Ritchie, B.W.; Mills, D.J. Travellers’ self-protections against health risks: An application of the full Protection Motivation Theory. Ann. Tour. Res. 2019, 78, 102743. [Google Scholar] [CrossRef]
  38. Tapsuwan, S.; Rongrongmuang, W. Climate change perception of the dive tourism industry in Koh Tao island, Thailand. J. Outdoor Recreat. Tour. 2015. [Google Scholar] [CrossRef]
  39. Badu-Baiden, F.; Adu-Boahen, E.A.; Otoo, F.E. Tourists’ response to harassment: A study of international tourists to Ghana. Anatolia 2016, 27, 468–479. [Google Scholar] [CrossRef]
  40. Chen, H.; Huang, X.; Li, Z. A content analysis of Chinese news coverage on COVID-19 and tourism. Curr. Issues Tour. 2020, 1–8. [Google Scholar] [CrossRef]
  41. Rippetoe, P.A.; Rogers, R.W. Effects of components of protection-motivation theory on adaptive and maladaptive coping with a health threat. J. Pers. Soc. Psychol. 1987, 52, 596. [Google Scholar] [CrossRef]
  42. Maddux, J.E.; Rogers, R.W. Protection motivation and self-efficacy: A revised theory of fear appeals and attitude change. J. Exp. Soc. Psychol. 1983, 19, 469–479. [Google Scholar] [CrossRef]
  43. Norman, P.; Boer, H.; Seydel, E.R. Protection motivation theory. Predict. Health Behav. 2005, 81, 126. [Google Scholar]
  44. Yang, C.L.; Nair, V. Risk perception study in tourism: Are we really measuring perceived risk? Procedia Soc. Behav. Sci. 2014, 144, 322–327. [Google Scholar] [CrossRef] [Green Version]
  45. Korstanje, M.E. Why risk why now? Conceptual problems around the risk perception in tourism industry. Rev. Bras. Pesqui. Em Tur. 2011, 5, 4–22. [Google Scholar] [CrossRef]
  46. Zhu, H.; Deng, F. How to influence rural tourism intention by risk knowledge during COVID-19 Containment in China: Mediating role of risk perception and attitude. Int. J. Environ. Res. Public Health 2020, 17, 3514. [Google Scholar] [CrossRef]
  47. Chew, E.Y.T.; Jahari, S.A. Destination image as a mediator between perceived risks and revisit intention: A case of post-disaster Japan. Tour. Manag. 2014, 40, 382–393. [Google Scholar] [CrossRef]
  48. Moutinho, L. Consumer behaviour in tourism. Eur. J. Mark. 1987, 21, 5–44. [Google Scholar] [CrossRef]
  49. Roehl, W.S.; Fesenmaier, D.R. Risk perceptions and pleasure travel: An exploratory analysis. J. Travel Res. 1992, 30, 17–26. [Google Scholar] [CrossRef]
  50. Dolnicar, S. Understanding barriers to leisure travel: Tourist fears as a marketing basis. J. Vacat. Mark. 2005, 11, 197–208. [Google Scholar] [CrossRef] [Green Version]
  51. Çetinsöz, B.C.; Ege, Z. Impacts of perceived risks on tourists’ revisit intentions. Anatolia 2013, 24, 173–187. [Google Scholar] [CrossRef]
  52. Bae, S.Y.; Chang, P.-J. The effect of coronavirus disease-19 (COVID-19) risk perception on behavioural intention towards ‘untact’ tourism in South Korea during the first wave of the pandemic (March 2020). Curr. Issues Tour. 2020, 1–19. [Google Scholar] [CrossRef]
  53. Lepp, A.; Gibson, H. Sensation seeking and tourism: Tourist role, perception of risk and destination choice. Tour. Manag. 2008, 29, 740–750. [Google Scholar] [CrossRef]
  54. Sönmez, S.F.; Graefe, A.R. Determining future travel behavior from past travel experience and perceptions of risk and safety. J. Travel Res. 1998, 37, 171–177. [Google Scholar] [CrossRef]
  55. Floyd, M.F.; Gibson, H.; Pennington-Gray, L.; Thapa, B. The effect of risk perceptions on intentions to travel in the aftermath of September 11, 2001. J. Travel Tour. Mark. 2004, 15, 19–38. [Google Scholar] [CrossRef]
  56. Zhan, L.; Zeng, X.; Morrison, A.M.; Liang, H.; Coca-Stefaniak, J.A. A risk perception scale for travel to a crisis epicentre: Visiting Wuhan after COVID-19. Curr. Issues Tour. 2020, 1–18. [Google Scholar] [CrossRef]
  57. Hysa, B.; Karasek, A.; Zdonek, I. Social Media Usage by Different Generations as a Tool for Sustainable Tourism Marketing in Society 5.0 Idea. Sustainability 2021, 13, 1018. [Google Scholar] [CrossRef]
  58. Chien, P.M.; Sharifpour, M.; Ritchie, B.W.; Watson, B. Travelers’ health risk perceptions and protective behavior: A psychological approach. J. Travel Res. 2017, 56, 744–759. [Google Scholar] [CrossRef]
  59. Turnšek, M.; Brumen, B.; Rangus, M.; Gorenak, M.; Mekinc, J.; Štuhec, T.L. Perceived threat of COVID-19 and future travel avoidance: Results from an early convenient sample in Slovenia. Acad. Tur. Innov. J. 2020, 13, 3–19. [Google Scholar] [CrossRef]
  60. INE População Residente (N.o) Por Local de Residência (NUTS—2013), Sexo e Grupo Etário. Available online: https://www.ine.pt/xportal/xmain?xpid=INE&xpgid=ine_indicadores&contecto=pi&indOcorrCod=0008273&selTab=tab0 (accessed on 11 February 2021).
  61. Gomes, A.; Teixeira, J.; Fernandes, I. Geomorfologia. In Geografia do Porto; Rio Fernandes, J., Ed.; Book Cover Publisher: Porto, Portugal, 2020; pp. 14–25. [Google Scholar]
  62. Soares, L.; Bateira, C. Geomorphology in a World Cultural Heritage Site: The City of Porto. In Landscapes and Landforms of Portugal; Springer: Berlin, Germany, 2020; pp. 281–293. [Google Scholar]
  63. Custódio, D.; Cerqueira, M.; Alves, C.; Nunes, T.; Pio, C.; Esteves, V.; Frosini, D.; Lucarelli, F.; Querol, X. A one-year record of carbonaceous components and major ions in aerosols from an urban kerbside location in Oporto, Portugal. Sci. Total Environ. 2016, 562, 822–833. [Google Scholar] [CrossRef] [PubMed]
  64. Madureira, H.; Andresen, T.; Monteiro, A. Green structure and planning evolution in Porto. Urban For. Urban Green. 2011, 10, 141–149. [Google Scholar] [CrossRef]
  65. Ashworth, G.J.; Tunbridge, J.E. The Tourist-Historic City; Routledge: London, UK, 2000; ISBN 1136355804. [Google Scholar]
  66. Gusman, I.; Chamusca, P.; Fernandes, J.; Pinto, J. Culture and Tourism in Porto City Centre: Conflicts and (Im) Possible Solutions. Sustainability 2019, 11, 5701. [Google Scholar] [CrossRef] [Green Version]
  67. INE Inquérito à Permanência de Hóspedes na Hotelaria e Outros—Março 2021—Dados Preliminares. Available online: https://www.ine.pt/xportal/xmain?xpid=INE&xpgid=ine_indicadores&indOcorrCod=0009812&contexto=bd&selTab=tab2 (accessed on 7 April 2021).
  68. Silva Lopes, H.; Remoaldo, P.; Ribeiro, V. Residents’ perceptions of tourism activity in a rural North-Eastern Portuguese community: A cluster analysis. Bull. Geogr. Socio Econ. Ser. 2019. [Google Scholar] [CrossRef] [Green Version]
  69. Silva Lopes, H. O Turismo Como Alavanca do Desenvolvimento de Áreas Rurais: O Caso de Estudo do Município de Boticas. Ph.D. Thesis, Universidade do Minho, Braga, Portugal, 2016. [Google Scholar]
  70. Sekaran, U.; Bougie, R. Research Methods for Business: A Skill Building Approach; John Wiley & Sons: Hoboken, NJ, USA, 2016; ISBN 1119165555. [Google Scholar]
  71. Remoaldo, P.; Freitas, I.; Matos, O.; Lopes, H.; Silva, S.; Sánchez Fernández, M.D.; Cadima Ribeiro, J.; Ribeiro, V. The Planning of Tourism on Rural Areas: The Stakeholders’ Perceptions of the Boticas Municipality (Northeastern Portugal). Eur. Countrys. 2017. [Google Scholar] [CrossRef] [Green Version]
  72. Gebremedhin, T.G.; Tweeten, L.G. Research Methods and Communication in the Social Sciences; Westport, C., Ed.; ABC-CLIO: Santa Barbara, CA, USA, 1994; ISBN 0275949303. [Google Scholar]
  73. Ramires, A.; Brandao, F.; Sousa, A.C. Motivation-based cluster analysis of international tourists visiting a World Heritage City: The case of Porto, Portugal. J. Destin. Mark. Manag. 2018, 8, 49–60. [Google Scholar] [CrossRef]
  74. Almeida, F.; Silva, O.; Amoedo, N. Urban tourist motivations in the city of Porto. Ottoman J. Tour. Manag. Res. 2019, 4, 445–462. [Google Scholar] [CrossRef]
  75. de Freitas, I.V.; Sousa, C.; Marques, J.; Ribeiro, S.; Yasar, S.; Pires, H. Tourism in Porto’s Historic Centre: Analysing Risks and Safeguarding of the Landscape. In Proceedings of the 2nd International Conference on Tourism Research, Porto, Portugal, 14–15 March 2019; p. 345. [Google Scholar]
  76. Jiricka-Pürrer, A.; Brandenburg, C.; Pröbstl-Haider, U. City tourism pre-and post-covid-19 pandemic–Messages to take home for climate change adaptation and mitigation? J. Outdoor Recreat. Tour. 2020, 31, 100329. [Google Scholar] [CrossRef]
  77. Petersen, E.; Koopmans, M.; Go, U.; Hamer, D.H.; Petrosillo, N.; Castelli, F.; Storgaard, M.; Al Khalili, S.; Simonsen, L. Comparing SARS-CoV-2 with SARS-CoV and influenza pandemics. Lancet Infect. Dis. 2020, 20, e238–e244. [Google Scholar] [CrossRef]
  78. Khan, M.; Adil, S.F.; Alkhathlan, H.Z.; Tahir, M.N.; Saif, S.; Khan, M.; Khan, S.T. COVID-19: A Global Challenge with Old History, Epidemiology and Progress So Far. Molecules 2021, 26, 39. [Google Scholar] [CrossRef] [PubMed]
  79. Wolfe, N.D.; Dunavan, C.P.; Diamond, J. Origins of major human infectious diseases. Nature 2007, 447, 279–283. [Google Scholar] [CrossRef] [PubMed]
  80. Gössling, S.; Peeters, P. Assessing tourism’s global environmental impact 1900–2050. J. Sustain. Tour. 2015, 23, 639–659. [Google Scholar] [CrossRef]
  81. Brouder, P. Reset redux: Possible evolutionary pathways towards the transformation of tourism in a COVID-19 world. Tour. Geogr. 2020, 22, 484–490. [Google Scholar] [CrossRef]
  82. Romagosa, F. The COVID-19 crisis: Opportunities for sustainable and proximity tourism. Tour. Geogr. 2020, 22, 690–694. [Google Scholar] [CrossRef]
Figure 1. Study area—Aliados and Praça da Liberdade. (A) National and regional context; (BD) View from Google Earth; (E) Location of study area; (F) Photo by the authors at the City Council (21 December 2020); (GL) Photos taken by the authors of the present paper in survey locations—Point of Interest (POI). Source: Own elaboration.
Sustainability 13 06399 g001
Figure 2. Passengers in Porto between 1st quarter of 2019 and 1st quarter of 2021. (A) Passengers in Portugal and Porto (no.) and (B) Year-on-year change in passengers in Portugal and Porto (%). Source: Own elaboration based on data from the Portuguese Civil Aviation Authority.
Sustainability 13 06399 g002
Figure 3. Questionnaire application days. Source: Own elaboration.
Sustainability 13 06399 g003
Figure 4. Origin of respondents in the summers of 2019 (1) and 2020 (2). (A) From World; (B) From Europe; (C) From Iberian Peninsula. Source: Own elaboration.
Sustainability 13 06399 g004
Figure 5. Respondents’ origin by distance 1 (in km) to the center of the municipality of Porto (accumulated %). Source: Own elaboration. * accumulated %—was calculated based on the percentage of respondents that were added as they came closer to the destination. 1 The linear distance (in km) was considered.
Sustainability 13 06399 g005
Figure 6. Municipalities visited by Porto respondents in the summer of 2019 (A) and 2020 (B) in Continental Portugal. Source: Own elaboration.
Sustainability 13 06399 g006
Figure 7. Municipalities visited by respondents in the summers of 2019 (A) and 2020 (B) in NUTS III Área Metropolitana do Porto (Porto Metropolitan Area). Source: Own elaboration.
Sustainability 13 06399 g007
Figure 8. Places visited in intraurban context for respondents in the summers of 2019 and 2020. (A) Places visited in both summers (%); (B) Difference between places visited or intended to be visited by tourists in the summers of 2019 and 2020 (%). Source: Own elaboration.
Sustainability 13 06399 g008
Figure 9. Risk perception of the countries with the most respondents in Porto in the summer of 2020. Source: Own elaboration. Note: A 5-point Likert scale—1 = very poor and 5 = very good—was used. 0 corresponds to Don’t know.
Sustainability 13 06399 g009
Table 1. Socio-demographic characteristics of the respondents.
VariablesSummer 2019Summer 2020TotalChi-Squaredp-Value
(n = 207)(n = 210)(n = 417)
N%N%N%
Gender
Male10751.79947.120649.40.8630.353
Female10048.311152.921150.6
Age
15–242210.6209.54210.17.8650.164
25–4414670.514167.128768.8
45–64311544217518
65 or more83.952.4133.1
Country of residence
Portugal3516.94320.57818.731.1250.000 ***
Other European country10550.714468.624959.7
Other Continent6732.323119021.6
Education
Basic (Less than 6 years)73.431.4102.44.3580.36
Basic (7th–9th year)209.7167.6368.6
High School (10th–12th year)7033.86430.513432.1
Graduate8139.110047.618143.4
Postgraduate29142712.95613.4
Trip planning
More than 1 year before73.483.8153.67.8750.344
Between 12 and 6 months before157.283.8235.5
Between 5 and 2 months before6120.47334.813432.1
1 month before2110.13114.85212.5
15 days before29143114.86014.4
A week before4019.33315.77317.5
The day before the trip3416.42612.46014.4
Duration of visit
1 day (visitor)29142712.95613.45.2850.383
2–3 days9847.310650.520448.9
4–6 days6129.54722.410825.9
7–14 days178.22712.94410.6
15 and more days2131.451.2
Travel group size
Alone3717.9167.65312.724.0780.000 ***
2 people5526.65928.111427.3
3 or 4 people 6631.99344.315938.1
Between 5 and 7 people4119.82210.56315.1
Between 8 and 11 people73.4167.6235.5
> 11 people10.541.951.2
*** p < 0.001 Source: Own elaboration.
Table 2. Risk perception of COVID-19 during the visit to the city of Porto in 2020.
ItemsMean 1Minimum 1Maximum 1Standard Deviation (S.D.)AsymmetryKurtosis
R1. Use of a mask in public places.3.181250.8160.349−0.309
R2. Certification of hotels in relation to clean-safe practices in response to COVID-19.3.619250.676−0.113−0.135
R3. Spaces for restaurants, supermarkets, and large and airy stores.3.300250.5950.3350.157
R4. Minimum distance between people at attractions and tourism support sites.3.410250.950−0.025−0.948
R5. Number of daily COVID-19 cases3.386250.7380.256−0.153
R6. COVID-19 signage adjusted to the needs in the public space and areas dedicated to tourism.3.319250.6830.223−0.011
R7. Tours (guided) with security conditions adjusted to the current period.3.3429250.6080.172−0.108
R8. Adequate hygiene conditions in visiting places and tourist facilities.3.419250.6150.6860.073
R9. Information on the procedures to be carried out at the place of stay, since entering Francisco Sá Carneiro Airport.3.129150.756−0.084−0.590
R10. Transport infrastructures with the necessary security conditions in response to COVID-19.3.219250.7120.4580.313
R11. On the street I feel safe.2.952240.6320.037−0.477
1 A 5-point Likert scale—1 = very poor and 5 = very good—was used. 0 corresponds to Don’t know. Source: Own elaboration.
Table 3. Differences in the perception of risk to COVID-19 between national tourists vs. foreign tourists and European tourists vs. non-Europeans, during visits to the city of Porto in the summer of 2020.
ItemsNational vs. ForeignEuropean 2 vs. Non-European
NationalForeignT-Testp-ValueEuropeanNon-EuropeanT-Testp-Value
Mean 1S.D.Mean 1S.D.Mean 1S.D.Mean 1S.D.
R13.190.8283.140.774−0.3730.7103.240.8022.740.8102.7970.006 **
R23.880.6623.550.6652.9310.004 **3.630.6793.570.6620.4040.687
R33.350.4823.290.6220.6020.5483.320.5903.130.6261.4510.148
R43.720.8823.330.9532.4380.016 *3.410.9423.431.037−0.1350.893
R53.470.6673.370.7550.7910.4303.400.7363.300.7650.5600.576
R63.300.6383.320.697−0.1790.8583.360.6852.960.5623.1930.003 **
R73.510.5933.300.6062.0560.041 *3.360.6183.220.5181.0490.296
R83.670.7473.350.5612.6340.011 *3.420.6213.390.5830.2290.819
R93.120.7933.130.749−0.1190.9053.130.7513.130.815−0.0120.990
R103.400.6953.170.7111.8310.0683.230.7303.130.5480.6320.528
R113.210.5592.890.6353.0470.003 **2.960.6382.910.5960.3160.753
1 A 5-point Likert scale—1 = very poor and 5 = very good—was used. 0 corresponds to Don’t know. 2 European tourists include national tourists. * p < 0.05; ** p < 0.01. S.D.—Standard Deviation. Source: Own elaboration.
Table 4. Differences in the perception of risk to COVID-19 among those who consider the city of Porto and Portugal a COVID-free destination.
ItemsPorto Is a COVID-Free DestinationPortugal Is a COVID-Free Destination
YesNoT-Testp-ValueYesNoT-Testp-Value
Mean 1S.D.Mean 1S.D. Mean 1S.D.Mean 1S.D.
R13.190.8383.120.6960.4570.6483.300.8203.020.7882.4300.016 *
R23.640.6943.520.5660.9610.3373.670.7323.550.5851.3420.181
R33.350.5853.030.5852.8820.006 **3.340.6273.240.5471.2990.196
R43.440.9163.241.1190.9600.2723.430.9783.390.9150.2990.765
R53.400.7013.300.9180.5820.5633.410.6653.350.8310.5370.592
R63.320.6423.300.8830.1180.9073.290.6743.360.698−0.8020.423
R73.360.6253.240.5021.2010.2353.360.6563.320.5370.5150.607
R83.440.6193.330.5950.8710.3853.430.6923.400.4920.4490.654
R93.150.7473.030.8100.8120.4173.130.7603.130.7550.0580.954
R103.260.6913.000.7911.9380.0543.180.7503.270.656−0.9280.355
R113.000.6402.700.5292.5610.011 *3.020.5452.860.7301.6580.099
1 A 5-point Likert scale—1 = very poor and 5 = very good—was used. 0 corresponds to Don’t know. * p < 0.05; ** p < 0.01. Source: Own elaboration.
Table 5. Differences in perceived risk to COVID-19 among those who visited vs. those who have not visited other municipalities within and outside the NUTS III Área Metropolitana do Porto.
ItemsVisited Other Municipalities within NUTS III Área Metropolitana do PortoVisited Other Municipalities Outside NUTS III Área Metropolitana do Porto
YesNoT-Testp-ValueYesNoT-Testp-Value
Mean 1S.D.Mean 1S.D.Mean 1S.D.Mean 1S.D.
R13.250.8353.030.7551.8400.0682.950.8373.280.788−2.7430.007 **
R23.590.6713.690.687−0.9710.3333.570.6843.640.674−0.7140.476
R33.260.6333.390.492−1.4640.1453.120.5733.380.590−2.9350.004 **
R43.380.9913.480.854−0.7550.4513.280.9103.470.965−1.3560.176
R53.380.7063.410.811−0.2660.7903.200.7333.470.727−2.4720.014
R63.320.6743.310.7100.0920.9273.000.6373.460.656−4.8120.000 ***
R73.290.6013.450.615−1.7480.0823.260.5093.380.646−1.4220.157
R83.420.6423.410.5550.1990.8423.310.5573.470.635−1.8560.066
R93.080.7843.230.684−1.3450.1803.030.7493.170.758−1.2570.210
R103.210.7423.250.642−0.4160.6783.060.6823.290.716−2.1660.031 *
R112.900.5843.080.719−1.7710.0792.890.6872.980.606−0.8790.382
1 A 5-point Likert scale—1 = very poor and 5 = very good—was used. 0 corresponds to Don’t know. * p < 0.05; ** p < 0.01; *** p < 0.001. S.D.—Standard Deviation. Source: Own elaboration.
Table 6. Differences in perceived risk to COVID-19 based on the trip planning.
ItemsTrip PlanningANOVA Fp-Value
More Than 1 Year BeforeBetween 12 and 6 MonthsBetween 5 and 3 Months2 Months Before1 Month Before15 DaysA Week BeforeOne Day Before
Mean 1S.D.Mean 1S.D.Mean 1S.D.Mean 1S.D.Mean 1S.D.Mean 1S.D.Mean 1S.D.Mean 1S.D.
R12.630.7442.630.5183.190.7733.260.7733.100.7463.100.8313.450.9383.270.8271.8180.085
R23.250.4634.131.1263.400.6273.450.6753.740.6823.770.6693.730.6263.650.5622.4830.018 *
R32.880.6413.130.6413.190.5943.100.4733.480.7693.420.5023.390.5563.420.5042.3810.023 *
R43.001.1953.880.8353.380.9093.290.7833.480.9963.390.8823.211.0833.770.9511.3430.232
R53.251.0353.001.0693.260.6653.550.7683.740.8153.260.5753.300.5853.380.7522.0270.053
R62.750.8862.880.9913.190.5943.290.6433.650.7553.290.6433.420.5613.380.6372.8190.008 *
R73.500.5353.000.7563.290.6363.290.7393.480.6773.390.4953.210.4853.500.5101.2640.270
R82.880.6413.500.7563.450.6703.480.5703.480.6773.350.4863.480.6193.350.5621.1910.309
R92.500.9262.380.5183.120.5503.030.7523.160.9693.130.7183.360.7423.350.6292.9490.006 *
R102.880.8353.130.6413.290.7423.130.8463.130.5623.130.6193.180.5843.620.8041.7600.097
R112.630.5183.000.5352.930.6402.610.6673.060.5743.130.6703.030.5853.040.5992.3230.027 *
1 A 5-point Likert scale—1 = very poor and 5 = very good—was used. 0 corresponds to Don’t know. * p < 0.05. S.D.—Standard Deviation. Source: Own elaboration.
Publisher’s Note: MDPI stays neutral with regard to jurisdictional claims in published maps and institutional affiliations.

