Abstract
This paper addresses the effects of long-term climate change on retrofit actions on a school building located in a Mediterranean climate. Dynamic energy simulations were performed using Termolog EpiX 11, first with conventional climate data and then with future year climate data exported from the CCWorldWeatherGen computational software. To date, many incentive actions are promoted for school renovations, but are these measures effective in preventing the discomfort that will be found due to overheating generated by climate change? Today, one of the main objectives in retrofit measures is the achievement of ZEB (Zero Energy Building) performance. Achieving this target requires first and foremost a high-performance envelope. This study evaluates the impact of retrofit strategies mostly applied to the school building envelope, over the years, considering three different time horizons, until 2080. Thermal performance indices and indoor operative temperature under free-floating were evaluated. The results highlight that, with a changing climate, it is no longer possible to assume a constant static condition to evaluate retrofit actions, but it is necessary to develop a predictive mathematical model that considers the design variability for future years. There is an urgent necessity to ensure both the safety and comfort of buildings while also anticipating future variations in climate.
1. Introduction
Human activities, agriculture, animal husbandry, deforestation, and the combustion of fossil fuels produce huge amounts of greenhouse gases, causing the global warming phenomenon [1]. In recent decades, climate change has led to multiple effects on natural and human systems on all continents, worsening living conditions. Climate change cannot be solved quickly, but its effects can be mitigated. Changes must be made in important sectors, such as transportation, industry, agriculture, waste management, energy, and construction. The urban environment makes a significant contribution to climate change [2,3], buildings represent an important share of the total energy consumption, responsible for 40% of the overall energy consumption in the European Union [4]. Most of the building sector has poor energy performance, for this reason, one of the main challenges of the European policy is the definition of strategies and measures to promote the reduction of energy consumption in the built environment.
1.1. Impact of the Climate Change on Buildings
Long-term changes in external climate are expected to substantially impact the building energy requirements [5], and therefore, the building energy performance model will be shifted in the future [6]. Due to climate change, buildings may suffer from overheating problems and may no longer guarantee the necessary comfort and productivity, especially in warm and hot climates. The authors of [7] highlighted the overheating risk also in a building located in a cold climate, also after the improvement of the envelope. Under climate change, the energy consumption will rise for cooling and fall for heating [8]. There is an urgent necessity to ensure both the safety and comfort of buildings while also anticipating future variations in climate. It is essential to design buildings that are increasingly resilient to future extreme events and capable of being cooled with minimal energy expenditure. This increase in temperature leads to a review of the energy efficiency measures commonly used in the building stock up to now. It is expected that there is a significant increase in the cooling consumption of existing buildings, especially for hyper-insulated buildings. First and foremost, one of the actions that can be done to ensure the good behavior of the building is to optimize the design of the envelope, considering the climate in which the building is located, with an eye to the potential overheating due to climate change.
1.2. The Role of Zero Energy Buildings under Climate Change
The crucial point is to evaluate the effectiveness of measures applied today to reach Zero Energy Building (ZEB) performances, even under climate change.
There are several and continuously evolving definitions of the ZEB concept [9], and several studies outline this progress [10,11]. Overall, designing a ZEB means designing a building with very high energy performance, adequate comfort, and air quality [12]. To reduce the energy consumption, it is necessary to decrease the energy demand through the thermal insulation of the envelope, using an efficient system, and generating energy from renewable sources. In the winter period, heat absorption should be maximized through adequate insulation of the envelope, while in the summer period, it should be limited through the installation of shading, which will reduce thermal dispersions of the entire building. In the long term under climate change, the increase of energy needed to cover the summer demand, depending on the type of building and the type of thermal insulation of the shell of the structures, may not be offset by the corresponding decrease in winter demand; thus, leading to an increase in the overall energy consumption with a consequent increase of the gas emissions due to the building sector. To reduce the energy demand, several factors need to be considered, such as the performance of the building envelope, the efficiency of the systems, and the behavior of the occupants. Given the progressive global warming, evaluating whether an energy-optimized building with current climate conditions will remain optimized in the future is the goal of many studies [13,14]. A potential pathway for adaptation and mitigation of the impact of climate change on total building energy demands is outlined by [15], through the development of a multi-objective optimization approach.
This study aims to evaluate the measures most commonly applied to public school buildings. Although the final goal of retrofit actions is to achieve the ZEB target, which includes evaluation of the entire building consisting of envelope-facilities-renewables, this study highlights the most common retrofit actions that are only applied to the building envelope. Optimizing the envelope is a priority step if the contribution of the air conditioning systems is to be minimized. The comfort inside the building is evaluated by monitoring the operative temperature in a free-floating regime, considering the system off, and then, evaluating only the impact of retrofit actions on the envelope and how these trends change over the years.
1.3. The Italian Building Stock
The analysis of the Italian building stock in 2011 shows a number of 14,515,795 buildings on the national territory, of which non-residential buildings account for about 11% of the total. Non-residential buildings are grouped according to their functions: productive, commercial, services, tourist/receptive, and managerial/tertiary [16]. In 2019, the number of non-residential buildings shows an increase of 0.1% compared to the year 2018 [17]. In 2018, the energy consumption of the non-residential building sector is increased by 6% over the previous year to approximately 19.3 Mtep. From 1990 to 2018, the consumption has more than doubled. The sources used for energy production are represented by electricity with 42% and natural gas with 37.5% [18]. In 2019, there are approximately 50,658 school-use locations nationwide of which 32.6% are dedicated to nursery school, 36.5% to primary school, 17.8% to middle school, and 13.1% to secondary school, most schools are concentrated in the South [19]. The school buildings present on the Italian territory have advanced average age, 38% were built before 1963, 39% from 1964 to 1983, 21% from 1984 to 2004, and only 2% after 2004. Most of the buildings were built with deficiencies in the load-bearing structures in the systems, with the use of poor materials, and in periods when there was no particular attention to environmental sustainability and energy efficiency. Despite renovations, most schools do not meet the standard requirements relating to the thermal envelope and are not equipped with heating, ventilation, and air conditioning. Of fundamental importance is reducing their energy demand. The heating of school premises is responsible for more than 80% of the heating and cooling consumption in colder climates. Inefficient systems such as radiators for heat distribution and gas/oil boilers are often used. In warmer climates, it is the cooling that accounts for most of the consumption [20]. The consumption due to cooling is negligible compared to heating because there are very few buildings equipped with such a system. Some strategies to reduce energy consumption in schools have been studied in [21]. To reduce the energy demand for cooling and heating, simple renovations can be done, such as insulating roofs, walls, floors, installing double or triple glazing, or installing external solar shading and/or screening. A large part of energy consumption in Italy is caused by poor maintenance and renovation of school buildings [22]. In addition, the current pandemic of SARS-CoV-2 has highlighted numerous deficits in buildings and the need has emerged to adequately ventilate indoor spaces [23,24], especially schools that, unlike other non-residential buildings, had to remain open even at crucial times of the spread of the virus, despite their worst indoor environmental conditions [25]. Here, to the problem of overheating and, therefore, the need to increase the capacity of the cooling system, is added the need to further increase the loads through the installation of forced ventilation systems, worsening electricity demands.
1.4. The Aim of This Study
This study highlights three important issues:
- Climate change;
- Poor condition of school buildings;
- Evaluation of the effectiveness of retrofit measures on schools under climate change.
Several studies have been conducted on the evaluation of the design of new buildings and residential buildings under climate change [26,27,28]. This study starts by covering the gap in evaluating the effectiveness of the most common retrofit actions implemented today on the envelope. It focuses on school buildings, which, as previously stated, play a fundamental role, both considering their spread on the territory and considering the state of degradation in which they fall. To date, many incentive actions are promoted for their redevelopment, but which of these measures are effective in preventing the discomfort that will be found due to overheating generated by climate change?
In this context, this study proposes the evaluation of a school building located in Lecce, Southeastern Italy, in a Mediterranean climate. The school is chosen as a representative of the area for its construction properties. This study highlights, through dynamic energy simulations, the response of the envelope to the variation of external climatic conditions under climate change. A first analysis has been carried out considering the building in its actual condition, the simulation has been performed using the conventional climatic data. Like many buildings of the period and built in the same area, the building chosen as a case study is in very poor condition and therefore needs renovation to raise its energy performance. This study proposes the evaluation of the most commonly applied measures for public schools. The focus is on the efficiency of the building envelope, both opaque and transparent. The thermal behavior of the building is evaluated by considering the building before and after renovation, for different time horizons, up to 2080. For this purpose, the indoor operative temperature in a free-floating regime and the thermal performance indices were evaluated.
2. Italian Policy Framework
In line with European legislation, the aim of the Italian regulations is the definition of a long-term strategy for the renovation of the Italian building stock.
The Legislative Decree n. 28/2011 [29] defines the tools, mechanisms, incentives, and institutional, financial, and legal framework, necessary to achieve the objectives up to 2020, on the promotion of the use of energy from renewable sources.
The Ministerial Decree 26/06/2015 [30] introduces the methodologies for calculating energy performance and defines the prescriptions and minimum requirements for buildings.
The Legislative Decree n. 48/2020 [31] implements the Directive 2018/844 [32] on energy performance in buildings, introduces novelties on energy efficiency and performance of buildings, considering local and external climatic conditions, trying to optimize the cost-benefit ratio.
To determine the verifications to be respected according to the Italian national regulations, it is necessary to evaluate the areas of application and the specific intended use of the building.
In accordance with the Ministerial Decree 26/06/2015 [30], the areas of application concern the type of intervention to be carried out, namely:
- New construction;
- Demolition-reconstruction;
- Extension of existing buildings with a new system;
- Extension of existing buildings with the system extension;
- Major renovations of first-level;
- Major renovations of second-level;
- Energy requalification of the envelope;
- New system installation;
- System renovation;
- Generator replacement.
Regarding the proposed case study, it is a school (intended use), and the planned intervention is a major renovation of second-level (area of application), as it affects the building envelope with an incidence greater than 25% of the total gross dispersive surface of the building and does not involve the winter and/or summer air conditioning system.
For this type of intervention among the limit values to be respected, there is the verification of the global average coefficient (H’T), defined as:
where Htr,adj is the global coefficient of heat exchange by transmission of the envelope [33]. Ak is the surface of the k-th component (opaque or transparent) of the envelope.
Table 1 shows the limit values of the global average coefficient (H’T), which are linked to the climatic zone (according to the national regulation, Italy is divided into six climatic zones ranging from A to F) and the ratio between the dispersive surface and the volume (S/V). The school is located in climate zone C (the limit values are highlighted in bold).

Table 1.
Limit values of H’T [30].
For major renovations of second-level, the stationary thermal transmittance (U) limit values must be met. The structures to be verified are those subject to intervention and delimiting the air-conditioned volume towards the external and non-air-conditioned environments. For windows, the transmittance value is calculated including frames, and not considering the shading component. Table 2 shows the transmittance limit values to be applied when carrying out major renovations of second-level. In bold is highlighted the climate zone C (climate area of the school location).
Table 2.
Transmittance limit values (Ulimits) for existing buildings.
As can be seen, the transmittance limit values tend to decrease over the years. To obtain lower values, it is necessary to increase the thickness of the insulation or to use insulation materials with increasingly lower thermal conductivity values.
For windows, legislation requires the use of better-performing windows and therefore lowers the transmittance value to be met. In addition, it is necessary to verify that windows delimiting the air-conditioned volume towards the outside with orientation from East to West, passing through South have a solar transmission factor value less than or equal to 0.35.
About the roof structures of buildings, it is mandatory to verify the effectiveness of the use of materials with high solar reflectance for roofing (assuming a solar reflectance value not less than 0.65 for flat roofs, and 0.30 for pitched roofs) or the application of passive climate control technologies.
In case of intervention concerning opaque structures delimiting the air-conditioned volume towards the outside, hygrometric tests need to be carried out according to UNI EN ISO 13788 [34].
An Italian fund for the school buildings is the Legislative Decree n. 104 of 2013 [35], it provides for multi-year contributions for interventions of renovation and energy efficiency. In addition, the project [36] is a program for smart, sustainable, and inclusive growth of schools, running from 2014 to 2020. It provides 3 billion euros for programming extended to all regions of Italy to achieve the EU 2020 targets. Considering the issues of environmental sustainability and climate change, the project promotes a greener and more competitive economy in the interventions of redevelopment and energy efficiency of schools whose realization provides particular attention on eco-friendly materials and construction techniques with low impact on climate change.
3. Methodology
The study involves the analysis of an existing school located in Lecce, a city in Southeastern Italy. Thermal simulations conducted in the Termolog EpiX 11 software [37] showed the poor condition of the school in its current condition. Therefore, the most common interventions on the building envelope were tested. Initially, evaluations were conducted considering conventional climate data, provided for building energy certification. Subsequently, future climate data for the years 2020, 2050, and 2080 were exported from the CCWorldWeatherGen calculation software [38,39,40] and imported into Termolog EpiX 11 to evaluate the impact of climate change on the building. Climate change simulations were performed both considering the building in its current state (pre-intervention) and considering the updated building (post-intervention). Energy performance indices and indoor operative temperature were monitored to evaluate the building performance.
3.1. The Energy Assessment Tool
Termolog EpiX 11 is a modular energy software widely used in Italy for the calculation of the energy performance of the buildings and to perform dynamic hourly energy simulations. It is recognized and certified by the Italian Thermo-technical Committee (CTI) [41].
The first step in the energy modeling process is to define the geographic data of the building, the characteristics of the intervention, the date of construction, and the intended use (also defining if it is a public building or a building for public use). Then, the thermal zones are set, with the possibility of dividing them into the various rooms that make up the building. Subsequently, the various opaque and transparent components that make up the building are configured, setting the stratigraphic materials for each of them, defining their thermal and hygrometric characteristics.
The hourly dynamic engine allows to perform the hourly energy balance and determines the real response of the building to the climate and internal conditions, according to the procedure given in EN ISO 52016:2018 [42]. With the hourly method, it is possible to evaluate the temperature, in a transient regime and on an hourly basis, of each room in the building. This is possible by solving a system of equations that describe the heat exchanges occurring through the envelope between the interior and exterior environments. Because the equations are solved in matrix form, each building component is modeled in a series of nodes (which constitute the thermal capacities and resistances of each element). In this way, it is possible to calculate the hourly energy balance of the building, which allows the internal temperatures of the rooms to be derived based on the time of the year.
The dynamic time engine of Termolog Epix 11 uses conventional climate data provided by national regulations. For the Italian legislation, the reference standard for conventional climatic data is UNI 10349-1:2016 [43], which supplies the climatic data required for the design and verification of the energy and thermo-hygrometric performance of buildings, including technical systems for summer and winter air conditioning. These data are representative of the average climatic conditions for the verification of energy and thermo-hygrometric performances. The database for updating UNI 10349 was established in accordance with UNI EN ISO 15927-4 [44]. For the conventional year, the temperature, relative humidity, solar irradiance, and wind speed values are given on an hourly basis.
Additional data can be imported in Termolog Epix 11 using the CSV or EPW (Energy Plus Weather) format for locations around the world and any year. In this study, data for the years 2020, 2050, and 2080 were generated by the CCWorldWeatherGen calculation software [45].
The CCWorldWeatherGen calculation software allows the calculation of climate data over a wide time interval using the morphing procedure and the input data provided by EnergyPlus. The morphing procedure combines recorded climate data with climate models, producing time series containing the weather conditions of future climate scenarios, incorporating the A2 scenario of IPCC greenhouse gas emissions. The method, therefore, has the objective of “scaling” the data belonging to the climate model in proportion to the recorded data, returning the spatial and temporal data necessary for the simulations to be carried out on the buildings. The technique described results in a faithful expression of the climatic evolution, and this can be seen by comparing the degree days calculated from the morphed meteorological series with the degree days calculated directly from the climate model since in both cases a consistent reduction is shown between them. This method permits to simulate the future climate at a given location with high accuracy and then to examine the consequences for the energy performances of buildings.
3.2. The Climate of Lecce
This study involves the analysis of a school located in Lecce, a city in the southeast of Italy. Lecce belongs to the climate zone C of the Italian climate classification; it is a typical Mediterranean climate, alternating mild winters, hot springs, scorching summers, and hot autumns, rainfall is almost always below 500 mm. In this zone, the design indoor temperature of a building is 26 °C during the cooling period, which runs from March 31 to November 15, and 20 °C during the heating period, which runs from November 15 to March 31 [46]. By an international classification, such as the Köppen climate classification [47,48], Lecce is classified as Csa, Hot-summer Mediterranean climate. In summer, buildings in hot climates are affected by overheating phenomena, which negatively influence people’s comfort and health [49]. Climate change leads to a slight decrease in wind speed and, at the same time, an increase in outdoor air temperature, specific humidity, and direct incident solar radiation.
The case study is a secondary school, and like other Italian schools, it is closed from 1st July to 31st August for summer vacations. Figure 1 shows the yearly and hourly trends of the external temperatures in the city of Lecce under climate changes. The period highlighted in pink is relative to the summer closure of the school (from 1st July to 31st August). The blue line is referred to the conventional climatic data provided by Termolog Epix 11 following the UNI 10349, the orange, grey, and yellow lines are relative to the years 2020, 2050, 2080 and are exported by the CCWorldWeatherGen calculation software.
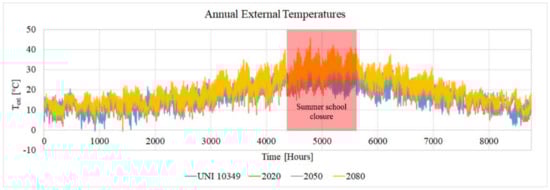
Figure 1.
Yearly and hourly trends of the external temperatures in the city of Lecce under climate changes.
Figure 2 points out the trend of the monthly and hourly trends of the external temperatures from 1st to 30th June under climate change. The aim is to highlight the highest peak that can be reached during any of the open periods, and how much this can be aggravated by global warming caused by climate change.
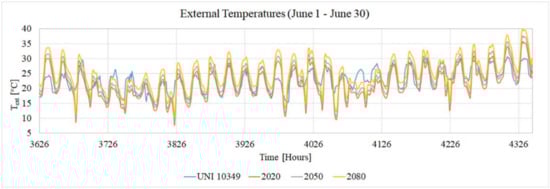
Figure 2.
Monthly and hourly trends of the external temperatures (from 1st to 30th June) in the city of Lecce under climate changes.
Similarly, Figure 3 highlights the trends in external temperatures during one of the coldest months of the year (from 1st to 28th February). The aim is to highlight the lowest peak that can be reached.
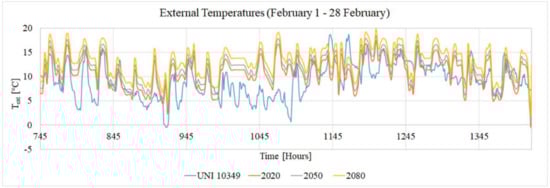
Figure 3.
Monthly and hourly trends of the external temperatures (from 1st to 28th February) in the city of Lecce under climate changes.
3.3. The School in the Pre-Intervention Phase
The chosen school can be considered as representative of a series of schools realized in the same area for materials, distribution, and constructive typology. Like many local schools, it has had little maintenance over the years and therefore needs renovation to raise its energy performance.
The building was constructed in the 1980s. Its main facade is oriented towards the south. The gross heated volume of the building is 17,003.90 m3 and the dispersive surface is 10,415 m2, with an S/V of 0.61. The interior height of each floor is 2.70 m. The building (Figure 4) is designed to accommodate 197 students, and it has three floors distributed as follows:
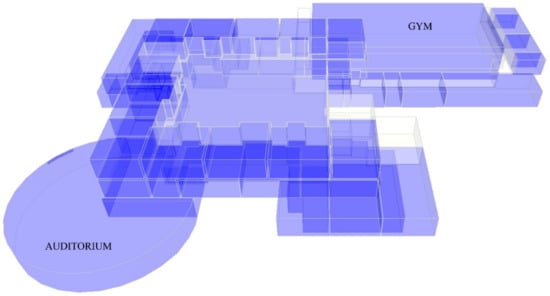
Figure 4.
Spatial distribution of the school.
- Ground floor for the secretary’s office, presidency, teachers’ room, library archive and 2 bathrooms, auditorium, gym (composed by a locker room for teachers, 4 locker rooms for students, a medical room, an office for the sports center and an apartment for the custodian);
- First floor where there are 8 classrooms, school canteen, art, and computer lab and 2 bathrooms;
- Second floor featuring 11 classrooms and 2 bathrooms.
Table 3 shows the geometric data of all the thermal zones of the school.
Table 3.
Geometric data of the school building.
The structural frame consists of reinforced concrete beams and pillars. The external walls are characterized by a double layer of tuff with air space, of variable thickness. The internal walls have different thicknesses and are made of a single layer of tuff. The roof and floors are made of reinforced concrete with a thickness of about 35–40 cm. The window frames are made of wood with single glazing without shutters.
The existing system currently consists of a floor-standing boiler with a capacity of 84 kW, complete with a 35–91 kW atmospheric burner, connected to a 1500-L storage boiler; the system is complete with all safety and control accessories. This system is not working, and all the components are obsolete and in a mediocre state of maintenance; therefore, the total removal of the whole system and the installation of new equipment is expected. There is no mechanical ventilation system, so the air exchange is natural and manual. Envelope and system characteristics are summarized in Table 4.
Table 4.
Pre-intervention phase: envelope and system characteristics of the school.
3.4. The School in the Post-Intervention Phase
Once the initial state of the school was analyzed, minimal improvements were proposed, among those that are generally suggested in the redevelopment of schools [50]. For public schools, the interventions chosen by designers are usually low-invasive, technically efficient, and cost-effective. Generally, the interventions proposed on the envelope concern the addition of a layer of insulation to the opaque components and the replacement of better-performing windows and doors. In addition, since the school is in a warm climate, the addition of shading systems is highly suggested.
In accordance with what is stated in Section 2 of this paper, the intervention proposed for the school is classified as major renovations of second-level, as it affects the building envelope with an incidence greater than 25% of the total gross dispersive surface of the building and does not involve the winter and/or summer air conditioning system. The measures applied to the opaque envelope are shown in Table 5. The refurbishment measures are not applied to the air conditioning systems, because the main objective of this study is to evaluate the behavior of the building envelope after retrofit actions, and over the years.
Table 5.
Post-intervention phase: opaque envelope characteristics of the school.
The improvement was made through the addition of an insulating layer of varying thickness on all dispersive opaque structures, to verify the Italian limit values referred to 1 January 2021 (shown in Table 2). The insulating material chosen is expanded polystyrene, which is currently the cheapest with good thermal conductivity, compared to other insulating materials available on the market.
Table 5 shows the stratigraphy of the opaque envelope and the thermal properties of each construction material, in terms of thickness (d), thermal conductivity (λ), density (ρ), specific heat capacity (C). The final characteristics of each building opaque component are calculated, in accordance with the UNI EN ISO 13786 [51], in terms of the total thickness (dtot), time phase shift (ΔT), internal (K11) and external (K22) heat capacity, steady (U), and dynamic thermal transmittance (Y12). The construction materials added to the original structures are outlined in green.
Heat loss to the ground can be calculated according to EN ISO 13370 [52] in a detailed or simplified manner. As reported in [53], thermal losses due to thermal bridges are not considered in the simplified method. The ground floor U-value reported in Table 5 of 0.636 W/m2K is relative to the simplified method, and the relative transmittance limit is 0.844 W/m2K, thus it is verified. Once the structure is implemented in the whole-building model, the detailed method is activated and the ground floor with all thermal bridges, ground features, floor structural type, and burial depth is considered. When contextualized, and the detailed method is activated, the U-value results in 0.233 W/m2K, and the limit value is 0.38 W/m2K (as for the external floors in Table 2), then, it is verified again.
In general, the windowed part of buildings represents one of the most critical points for dispersion but also a cause of overheating [54]. In its initial state, the building had glazing elements in very poor condition and with very high transmittance values. The authors proposed the replacement of all windows, with new ones characterized by transmittance values (Uw) lower than the limits imposed by law. Single glazing has been replaced with Low-e double glazing (4-14-4) with an argon cavity. The new frames are made of hardwood. As for the mobile screens, dark-colored, opaque roller blinds have been added on the outer side, with manual screening control. Table 6 shows the main thermophysical characteristics of the transparent elements.
Table 6.
Window characteristics.
4. Results and Discussions
The building has been modeled in Termolog Epix 11, both pre- and post-intervention, first considering conventional climate data (UNI 10349) and then importing climate data for the years 2020, 2050, 2080 processed by the CCWorldWeatherGen software. The results are plotted in terms of energy performance indices, winter and summer heat loads, and indoor operating temperature.
4.1. Energy Performance Indices
The useful thermal performance index was evaluated both for heating (EPH,nd) and cooling (EPC,nd). These parameters are closely dependent on the thermal insulation of the envelope (opaque and transparent). The useful thermal performance indices are evaluated both for the pre- and post-intervention phases. They are calculated considering the conventional climate data (UNI 10349) and the future climate data for the years 2020, 2050, and 2080 (generated by the CCWorldWeatherGen software). Table 7 and Figure 5 show the useful thermal performance indices over the climate change calculated for the entire school building. The percentage variation represents the percentage difference for 2020, 2050, and 2080 compared to the conventional year (UNI 10349).
Table 7.
Useful thermal performance indices over the climate change.
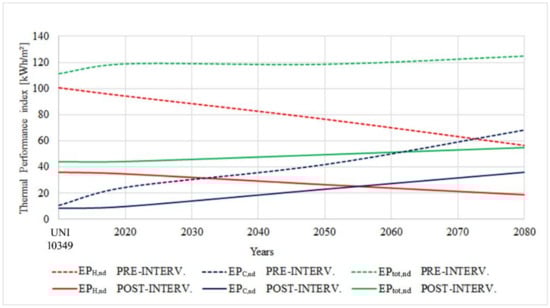
Figure 5.
Trend of useful thermal performance indices over the years.
A change in the energy demand in the pre- and post-intervention phases is evident from Figure 5. In both conditions, over the years, there is a strong reduction in the heating demand of the building and an increase in the thermal energy demand for summer air conditioning. Thus, due to climate change, the building will suffer from overheating problems and consequently see a significant increase in its cooling consumption.
As regards the useful thermal performance index for heating (EPH,nd), the percentage variation between 2080 and conventional climate data is equal to −43.80% for pre-intervention, and −47.14% for post-intervention, while for cooling (EPC,nd), the percentage variation is equal to 532.31% for pre-intervention and 328.76% for post-intervention.
The requalification measures have led to an improvement of the indices, much more incisive on heating (EPH,nd) than on cooling (EPC,nd). The question is whether this type of intervention will help the building in case of overheating caused by climate change. In fact, from the analysis of the trends, it is evident that EPH,nd decreases and EPC,nd increases significantly over the years, leading to an increase of the EPtot,nd, both pre- and post- intervention.
4.2. Internal Temperature Operative
The definition of the operative temperature (TOP) is introduced by UNI 10375 [55]. The operative temperature depends on the indoor air temperature and on the surface temperatures of the thermal zone, from which the average radiant temperature is derived. These parameters can be calculated according to UNI EN ISO 52016 [42] in a dynamic regime with hourly steps and in a free-floating regime, with the system switched off.
Figure 6 shows the annual and hourly operative temperature trends for each thermal zone of the school in the pre-intervention phase. The trends are plotted for the conventional year (UNI 10349) and the years 2020, 2050, and 2080. Figure 7 shows the same yearly and hourly trends plotted for the post-intervention phase. The pink box indicates the period of summer closure of the school in July and August.
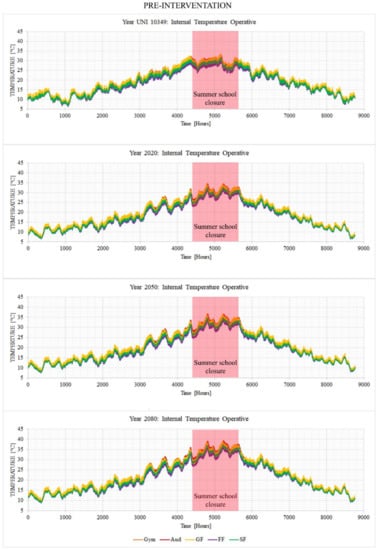
Figure 6.
Pre-intervention: yearly and hourly trends of internal temperature operative over the years.
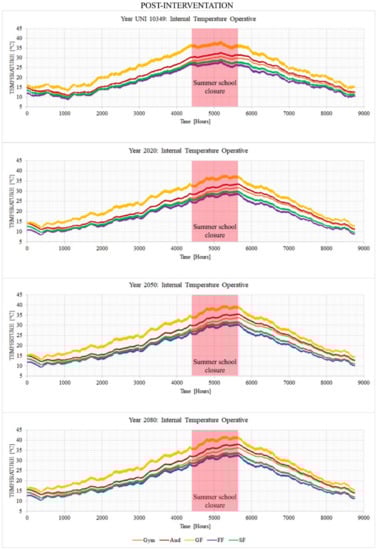
Figure 7.
Post-intervention: yearly and hourly trends of internal temperature operative over the years.
In both cases, it is evident that the operative temperature inside the building increases over the years. It is very interesting to note that the trends in the pre-intervention phase (Figure 6) are much more oscillating than those in the post-intervention phase (Figure 7). This means that the improvement measures applied to the envelope attenuate the temperature fluctuations in the building.
Moreover, in the pre-intervention phase, an almost similar behavior is evident for all thermal zones of the building, while, in the post-intervention phase, a differentiation of trends is evident, especially in the hottest part of the year.
The ground floor differs significantly from the other floors, becoming much warmer, especially in the summer months.
Table A1 and Table A2 show the maximum, minimum, and average operative temperature values for each month of the year as the years change. Table A1 is for the pre-intervention phase, Table A2 for the post-intervention phase. Values are highlighted with a color scale ranging from blue (for the lowest temperature values) to red (for the highest ones). The months of July and August are written in red to indicate that the school is closed for summer vacation, and these are also the months when the internal operative temperatures reach their highest peaks. Considering that the school is closed during these months, the highest TOP peaks are reached in June.
As for the maximum values of TOP, the month of June was observed. The conventional climate data present higher temperatures than 2020 for all thermal zones.
Regarding the ground floor, the intervention has led to a significant increase in peak temperatures in June, resulting in an actual worsening of summer overheating. In fact, in the pre-intervention phase, in June 2020, the maximum temperature is 31.9 °C which reaches 35.6 °C in 2080; in the post-intervention phase, in June 2020, the maximum temperature is 33.9 °C and, in 2080, it is 36.9 °C. Although the retrofit measures worsen the summer aspect, they improve the winter aspect. In fact, in the pre-intervention phase, a minimum temperature of 8.3 °C is reached in February 2020 and 10.8 °C in 2080; in the post-intervention phase, a minimum temperature of 13.8 °C is reached in February 2020 and 16.1 °C in February 2080.
As for the other thermal zones, the improved interventions positively affect the summer aspect, the maximum peak is attenuated by about 3 degrees. Although less impactful, it is evident that the post-intervention shows an increase greater than 1 °C of the minimum TOP value.
Figure 8 and Figure 9 highlight the percentage value of hours when the temperature (T) is: less than 20 °C (the heating system will be on), between 20 °C and 26 °C (optimal condition), less than 20 °C (the heating system will be on). The calculation is carried out considering the school is open year-round (8760 h). Figure 8 highlights these ranges up to 2080 in the pre-intervention phase. Figure 9 is related to the post-intervention phase.
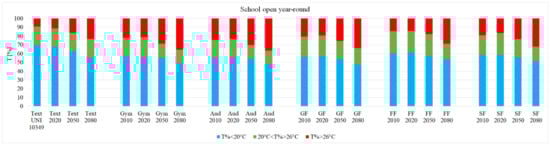
Figure 8.
Pre-intervention: temperature ranges of the school always open, over the years.
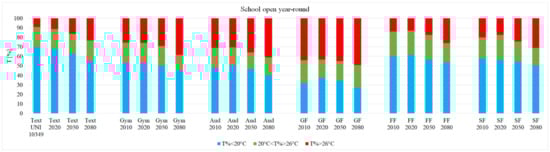
Figure 9.
Post-intervention: temperature ranges of the school always open, over the years.
Analyzing the pre-intervention (Figure 8), the ranges are very similar for all thermal zones of the building. Post-intervention analysis shows that the ground floor (GF), the gymnasium (Gym), and the auditorium (Aud) suffer more from overheating, while their behavior in the winter season has certainly improved. From the comparison of the operative internal temperatures with the external ones, it is evident that the hours in which the internal temperatures are higher than the external ones prevail, in a more marked way, in the post-intervention phase and this becomes worse and worse as the years go on. These results are obtained after insulating the school envelope as the regulations suggest. While there are benefits in the winter, there are negatives in the summer, especially as temperatures tend to rise over the years. One of the critical issues that emerges is whether it has been correct to make, over the years, the transmittance limit values increasingly restrictive, thus leading buildings to have increasingly higher thicknesses of insulation.
5. Conclusions
International efforts are being made to reduce energy consumption by buildings to combat the impending climate change. Expectations for zero-energy buildings are high, which is why so many measures are being taken to encourage the design of new high-performance buildings and the renovation of existing buildings. It is known that climate change will lead in the coming years to a sharp rise in temperatures, and therefore, the need to combat overheating inside buildings. Regulations have imposed limits that must be met to achieve the ZEB target. The best known are those imposed on stationary thermal transmittance. Over the years and gradually, these limits have become increasingly stringent, leading to the construction of more and more thermally insulated buildings. In fact, low transmittance values are achievable by inserting high thicknesses of insulation or high-performance insulation with very low thermal conductivity, or both. Having super-insulated buildings can lead to increasing problems under climate change. Today many investments are being made to reach the ZEB target, but what is the point if the building will no longer be ZEB within 50 years. Especially, when the expenses are not yet amortized, it will be necessary to make further interventions to improve the internal comfort. Buildings thus become much warmer than the external environment and the situation worsens considerably over the years. This study focuses on retrofit actions applied to an existing school located in a Mediterranean climate. The school in the pre-intervention phase is in a situation of degradation and low maintenance. It has been chosen as representative of several schools in the area, both for construction technology and building materials. The proposed interventions are the most usual ones that are carried out in the renovation of schools. Following the Italian regulation, the intervention proposed for the school is classified as major renovations of second-level, as it affects the building envelope with an incidence greater than 25% of the total gross dispersive surface of the building and does not involve the winter and/or summer air conditioning system. The refurbishment measures are not applied to the air conditioning systems, because the main objective of this study is to evaluate the behavior of the building envelope after retrofit actions, and over the years.
The building was modeled in the Termolog Epix 11 software. Conventional climate data were used at first, and then, climate data up to 2080 exported from the CCWorldWeatherGen computational software were implemented. The results were plotted for both the pre- and post-intervention phases up to 2080. The thermal performance indices and internal operative temperature for each thermal zone of the school were analyzed on an annual and hourly basis.
The results show that discomfort increases over the years, even in the post-intervention phase. Overheating leads to the need to implement cooling systems, as well as mechanical ventilation, which due to the pandemic is becoming increasingly important to ensure healthy indoor air. This will lead to a shift towards an increased electricity supply with significant potential implications for energy and environmental policy at national and international levels. This study provides a broad overview of what could happen in the coming years. One of the future developments could be the extension of the study to the whole world for a global assessment of the measures activated.
The case study showed that the indoor operative temperature will increase in the future, the heating thermal performance index will decrease, in contrast to the cooling thermal performance index that will increase, leading to an increase in the annual total demand of the building.
Therefore, future goals that should be pursued in the field of building energy efficiency research should include the development of a dynamic predictive model of climate change to be provided to designers to ensure retrofit actions capable of ensuring comfort within buildings for a longer time, while mitigating the effects of climate change.
Funding
This research received no external funding.
Institutional Review Board Statement
Not applicable.
Informed Consent Statement
Not applicable.
Data Availability Statement
Not applicable.
Acknowledgments
I would like to thank Paolo Maria Congedo and Dalila Lezzi from the Department of Engineering for Innovation, University of Salento (Italy) for their helpful comments and their support for the development of this study.
Conflicts of Interest
The author declares no conflict of interest.
Appendix A
Table A1.
Pre-intervention: maximum, minimum, and average TOP values.
Table A1.
Pre-intervention: maximum, minimum, and average TOP values.
| Pre-Intervention | |||||||||||||||
|---|---|---|---|---|---|---|---|---|---|---|---|---|---|---|---|
| Ground Floor—TOP [°C] | First Floor—TOP [°C] | Second Floor—TOP [°C] | Gym—TOP [°C] | Auditorium—TOP [°C] | |||||||||||
| Month/Year | Max | Min | Avg | Max | Min | Avg | Max | Min | Avg | Max | Min | Avg | Max | Min | Avg |
| 01/UNI10375 | 15.9 | 8.1 | 11.9 | 14.3 | 8.3 | 11.1 | 14.3 | 8.7 | 11.3 | 14.3 | 9.2 | 11.2 | 14.7 | 9.2 | 11.6 |
| 02/UNI10375 | 15.6 | 6.2 | 10.8 | 13.7 | 6.2 | 10.0 | 14.0 | 6.6 | 10.3 | 13.9 | 6.9 | 10.3 | 14.7 | 7.1 | 10.7 |
| 03/UNI10375 | 19.0 | 9.0 | 13.6 | 16.7 | 9.2 | 12.6 | 17.5 | 9.7 | 13.2 | 16.8 | 9.7 | 13.1 | 18.4 | 9.9 | 13.9 |
| 04/UNI10375 | 21.4 | 13.4 | 17.1 | 18.5 | 13.1 | 15.9 | 19.7 | 13.5 | 16.7 | 19.2 | 14.2 | 17.0 | 20.7 | 14.4 | 17.8 |
| 05/UNI10375 | 25.9 | 16.0 | 21.4 | 23.2 | 15.6 | 20.0 | 24.7 | 16.3 | 21.1 | 24.1 | 17.1 | 21.4 | 26.1 | 17.3 | 22.5 |
| 06/UNI10375 | 32.4 | 20.7 | 26.4 | 29.3 | 20.3 | 24.5 | 30.6 | 21.1 | 25.6 | 30.7 | 22.3 | 26.3 | 32.2 | 22.4 | 27.2 |
| 07/UNI10375 | 32.4 | 24.1 | 28.7 | 29.4 | 23.5 | 27.1 | 30.7 | 24.7 | 28.4 | 31.0 | 26.4 | 29.3 | 32.4 | 26.3 | 30.2 |
| 08/UNI10375 | 33.4 | 23.9 | 27.9 | 30.3 | 23.5 | 26.3 | 31.5 | 24.5 | 27.5 | 31.6 | 25.9 | 28.3 | 33.0 | 26.1 | 29.0 |
| 09/UNI10375 | 29.3 | 19.4 | 23.8 | 26.6 | 18.9 | 22.4 | 27.7 | 19.9 | 23.3 | 27.4 | 20.8 | 23.7 | 28.7 | 20.7 | 24.3 |
| 10/UNI10375 | 25.8 | 15.8 | 19.7 | 23.6 | 15.2 | 18.7 | 24.2 | 15.6 | 19.2 | 23.8 | 16.1 | 19.4 | 25.0 | 15.9 | 19.9 |
| 11/UNI10375 | 20.4 | 12.8 | 16.5 | 18.4 | 12.4 | 15.6 | 18.7 | 12.8 | 15.8 | 18.6 | 13.4 | 16.0 | 19.3 | 13.0 | 16.4 |
| 12/UNI10375 | 16.5 | 7.3 | 11.9 | 14.3 | 7.3 | 11.1 | 14.7 | 7.8 | 11.4 | 14.2 | 7.9 | 11.3 | 14.9 | 8.1 | 11.7 |
| 01/2020 | 14.4 | 6.6 | 10.6 | 12.7 | 6.4 | 9.7 | 12.7 | 6.6 | 9.8 | 12.8 | 7.0 | 9.9 | 13.2 | 6.9 | 10.1 |
| 02/2020 | 15.6 | 8.3 | 12.1 | 13.6 | 8.1 | 11.1 | 13.8 | 8.5 | 11.3 | 13.8 | 9.2 | 11.6 | 14.4 | 9 | 11.8 |
| 03/2020 | 17.9 | 10.2 | 14.0 | 15.5 | 9.6 | 12.7 | 16.0 | 10.2 | 13.2 | 16.1 | 10.9 | 13.6 | 16.7 | 10.6 | 14 |
| 04/2020 | 20.7 | 13.2 | 16.9 | 17.9 | 12.8 | 15.4 | 18.6 | 13.6 | 16.2 | 18.8 | 14.6 | 16.8 | 19.8 | 14.5 | 17.3 |
| 05/2020 | 27.8 | 15.7 | 21.2 | 24.9 | 15.1 | 19.6 | 26.1 | 15.6 | 20.6 | 26.6 | 16.6 | 21.4 | 27.7 | 16.4 | 22.1 |
| 06/2020 | 31.9 | 19.3 | 24.7 | 28.9 | 18.6 | 23.0 | 30.0 | 19.8 | 24.2 | 30.7 | 21.3 | 25.3 | 31.7 | 21.2 | 25.8 |
| 07/2020 | 34.7 | 23.2 | 28.6 | 31.6 | 22.7 | 27.0 | 32.6 | 24.2 | 28.2 | 33.4 | 25.9 | 29.5 | 34.4 | 26 | 30.1 |
| 08/2020 | 34.5 | 23.5 | 29.9 | 31.7 | 22.9 | 28.3 | 32.7 | 24.1 | 29.4 | 33.5 | 25.6 | 30.7 | 34.4 | 25.5 | 31 |
| 09/2020 | 29.4 | 20.6 | 24.7 | 26.4 | 20.3 | 23.2 | 26.9 | 21.1 | 24.0 | 27.6 | 22.4 | 25.0 | 28.4 | 22.4 | 25.2 |
| 10/2020 | 24.4 | 14.5 | 19.8 | 22.2 | 14.4 | 18.6 | 23.0 | 14.7 | 19.1 | 23.5 | 15.7 | 19.8 | 24 | 15.5 | 19.9 |
| 11/2020 | 19.3 | 10.9 | 14.8 | 17.4 | 10.8 | 13.9 | 17.5 | 10.9 | 14.0 | 17.7 | 11.4 | 14.5 | 18.1 | 11.3 | 14.5 |
| 12/2020 | 15.8 | 6.7 | 11.5 | 14.1 | 6.4 | 10.7 | 14.0 | 6.6 | 10.8 | 14.1 | 6.9 | 11.0 | 14.5 | 6.6 | 11 |
| 01/2050 | 15.6 | 7.6 | 11.8 | 13.8 | 7.4 | 10.8 | 13.8 | 7.6 | 10.9 | 13.9 | 8.1 | 11.1 | 14.3 | 8.0 | 11.2 |
| 02/2050 | 16.6 | 9.4 | 13.2 | 14.7 | 9.2 | 12.1 | 14.8 | 9.5 | 12.4 | 14.9 | 10.2 | 12.7 | 15.4 | 10.0 | 12.9 |
| 03/2050 | 18.7 | 11.0 | 14.8 | 16.4 | 10.4 | 13.5 | 16.8 | 11 | 14.1 | 17.0 | 11.7 | 14.4 | 17.6 | 11.5 | 14.8 |
| 04/2050 | 21.5 | 14.1 | 17.7 | 18.8 | 13.6 | 16.2 | 19.4 | 14.5 | 17 | 19.7 | 15.5 | 17.7 | 20.7 | 15.4 | 18.2 |
| 05/2050 | 28.6 | 16.5 | 22.0 | 25.7 | 15.9 | 20.4 | 26.9 | 16.4 | 21.4 | 27.5 | 17.4 | 22.3 | 28.5 | 17.2 | 22.9 |
| 06/2050 | 33.5 | 20.6 | 26.0 | 30.6 | 19.9 | 24.4 | 31.7 | 21.1 | 25.6 | 32.4 | 22.7 | 26.8 | 33.5 | 22.7 | 27.3 |
| 07/2050 | 36.8 | 24.9 | 30.5 | 33.7 | 24.5 | 28.9 | 34.8 | 25.9 | 30.2 | 35.6 | 27.8 | 31.6 | 36.6 | 27.9 | 32.1 |
| 08/2050 | 36.6 | 25.3 | 31.9 | 33.8 | 24.7 | 30.3 | 34.8 | 25.9 | 31.4 | 35.7 | 27.6 | 32.8 | 36.6 | 27.4 | 33.1 |
| 09/2050 | 30.9 | 22.0 | 26.2 | 27.9 | 21.8 | 24.7 | 28.4 | 22.6 | 25.5 | 29.2 | 23.9 | 26.5 | 30.0 | 23.9 | 26.8 |
| 10/2050 | 25.7 | 15.6 | 20.9 | 23.6 | 15.4 | 19.7 | 24.4 | 15.8 | 20.2 | 24.9 | 16.8 | 20.9 | 25.4 | 16.6 | 21.0 |
| 11/2050 | 20.6 | 12.2 | 16.1 | 18.7 | 12.0 | 15.1 | 18.8 | 12.1 | 15.3 | 19.0 | 12.7 | 15.7 | 19.4 | 12.4 | 15.7 |
| 12/2050 | 17.1 | 8.3 | 13.0 | 15.4 | 7.9 | 12.1 | 15.3 | 8.2 | 12.2 | 15.5 | 8.5 | 12.5 | 15.9 | 8.2 | 12.5 |
| 01/2080 | 16.8 | 9.0 | 13.0 | 15.0 | 8.7 | 12.1 | 15.0 | 8.9 | 12.1 | 15.2 | 9.4 | 12.4 | 15.5 | 9.4 | 12.5 |
| 02/2080 | 17.9 | 10.8 | 14.5 | 16.0 | 10.5 | 13.4 | 16.1 | 10.8 | 13.7 | 16.2 | 11.6 | 14.0 | 16.8 | 11.4 | 14.2 |
| 03/2080 | 20.0 | 12.2 | 16.1 | 17.6 | 11.6 | 14.8 | 18.1 | 12.2 | 15.3 | 18.3 | 13.0 | 15.7 | 18.9 | 12.7 | 16.1 |
| 04/2080 | 23.0 | 15.5 | 19.1 | 20.2 | 15.0 | 17.6 | 20.9 | 15.9 | 18.4 | 21.1 | 16.9 | 19.1 | 22.2 | 16.8 | 19.6 |
| 05/2080 | 30.4 | 18.1 | 23.6 | 27.5 | 17.5 | 22.1 | 28.8 | 18.0 | 23.1 | 29.4 | 19.1 | 24.1 | 30.5 | 18.9 | 24.7 |
| 06/2080 | 35.6 | 22.5 | 28.0 | 32.7 | 21.8 | 26.3 | 33.9 | 23.1 | 27.6 | 34.7 | 24.7 | 28.9 | 35.8 | 24.7 | 29.5 |
| 07/2080 | 39.0 | 27.0 | 32.7 | 35.9 | 26.6 | 31.1 | 37.1 | 28.1 | 32.4 | 38.0 | 30.0 | 33.9 | 39.0 | 30.1 | 34.5 |
| 08/2080 | 39.0 | 27.7 | 34.3 | 36.3 | 27.1 | 32.7 | 37.3 | 28.3 | 33.9 | 38.3 | 30.1 | 35.4 | 39.2 | 29.9 | 35.7 |
| 09/2080 | 33.2 | 24.3 | 28.5 | 30.2 | 24.0 | 27.0 | 30.7 | 24.8 | 27.8 | 31.5 | 26.3 | 28.9 | 32.3 | 26.2 | 29.1 |
| 10/2080 | 27.9 | 17.4 | 22.9 | 25.8 | 17.2 | 21.6 | 26.6 | 17.6 | 22.2 | 27.2 | 18.8 | 23.0 | 27.7 | 18.5 | 23.1 |
| 11/2080 | 22.2 | 13.7 | 17.7 | 20.2 | 13.5 | 16.6 | 20.4 | 13.6 | 16.8 | 20.7 | 14.2 | 17.3 | 21.0 | 14.0 | 17.3 |
| 12/2080 | 18.4 | 9.5 | 14.3 | 16.7 | 9.1 | 13.3 | 16.6 | 9.4 | 13.4 | 16.8 | 9.7 | 13.8 | 17.2 | 9.5 | 13.8 |
The color scale ranges from blue (lowest temperature values) to red (highest temperature values).
Table A2.
Post-intervention: maximum, minimum, and average TOP values.
Table A2.
Post-intervention: maximum, minimum, and average TOP values.
| Post-Intervention | |||||||||||||||
|---|---|---|---|---|---|---|---|---|---|---|---|---|---|---|---|
| Ground Floor—TOP [°C] | First Floor—TOP [°C] | Second Floor—TOP [°C] | Gym—TOP [°C] | Auditorium—TOP [°C] | |||||||||||
| Month/Year | Max | Min | Avg | Max | Min | Avg | Max | Min | Avg | Max | Min | Avg | Max | Min | Avg |
| 01/UNI10375 | 16.9 | 14.1 | 15.3 | 12.5 | 10.1 | 11.1 | 13.7 | 10.7 | 12 | 14.7 | 11.8 | 13 | 14.8 | 12.3 | 13.4 |
| 02/UNI10375 | 16.6 | 12.9 | 14.9 | 11.6 | 8.5 | 10.2 | 11.8 | 9.4 | 10.7 | 12.1 | 10.1 | 11.2 | 12.7 | 10.7 | 11.9 |
| 03/UNI10375 | 21 | 15 | 17.9 | 14.5 | 10.6 | 12.4 | 14.8 | 10.9 | 12.7 | 14.4 | 11.2 | 12.5 | 15.8 | 12 | 13.7 |
| 04/UNI10375 | 25.3 | 19.5 | 22.6 | 17.5 | 13.6 | 15.7 | 18.1 | 14 | 16.2 | 17.9 | 14.1 | 16.2 | 19.5 | 15.4 | 17.6 |
| 05/UNI10375 | 30.6 | 23.7 | 27.5 | 21.9 | 16.5 | 19.6 | 22.9 | 17.2 | 20.3 | 22.8 | 17.6 | 20.3 | 24.7 | 19.1 | 22.1 |
| 06/UNI10375 | 36.7 | 29.3 | 32.5 | 26.9 | 21.2 | 23.6 | 27.6 | 22.2 | 24.5 | 28.2 | 22.5 | 24.9 | 30.2 | 24.4 | 26.9 |
| 07/UNI10375 | 38.1 | 34.7 | 36.4 | 27.8 | 25.4 | 26.6 | 28.9 | 26.7 | 27.8 | 30.5 | 28 | 29.2 | 32.4 | 29.9 | 31 |
| 08/UNI10375 | 38.6 | 34.4 | 36.2 | 28.3 | 24.9 | 26.4 | 29.4 | 26.8 | 27.9 | 31.1 | 29.2 | 30 | 32.9 | 30.7 | 31.6 |
| 09/UNI10375 | 36 | 28.7 | 32.1 | 25.9 | 21 | 23.1 | 27.5 | 22.5 | 24.8 | 29.6 | 24.9 | 27 | 31.2 | 26 | 28.4 |
| 10/UNI10375 | 30.2 | 23 | 26.2 | 21.9 | 16.7 | 19 | 23.2 | 17.9 | 20.3 | 25 | 19.9 | 22.5 | 26.3 | 20.7 | 23.4 |
| 11/UNI10375 | 24.1 | 19.8 | 21.6 | 17.7 | 14.4 | 15.7 | 18.6 | 15.2 | 16.6 | 20.1 | 16.5 | 18.1 | 21 | 17.4 | 19 |
| 12/UNI10375 | 20.5 | 14 | 16.9 | 14.8 | 9.6 | 11.9 | 15.5 | 10.7 | 12.8 | 16.6 | 11.8 | 14 | 17.5 | 12.4 | 14.6 |
| 01/2020 | 14.8 | 12.2 | 13.6 | 11.1 | 8.4 | 9.9 | 12.9 | 9.7 | 10.9 | 14.2 | 11.0 | 12.1 | 14.2 | 11.2 | 12.3 |
| 02/2020 | 16.9 | 13.8 | 15.3 | 12.1 | 9.7 | 10.8 | 12.2 | 10.2 | 11.2 | 12.3 | 11.0 | 11.6 | 13.3 | 11.6 | 12.4 |
| 03/2020 | 20.4 | 15.9 | 18.4 | 14.2 | 11.2 | 12.9 | 14.6 | 11.6 | 13.3 | 14.4 | 12.0 | 13.4 | 15.6 | 12.8 | 14.5 |
| 04/2020 | 24.2 | 19.6 | 22.3 | 17.0 | 13.7 | 15.7 | 17.9 | 14.1 | 16.2 | 17.4 | 14.2 | 16.1 | 19.0 | 15.4 | 17.5 |
| 05/2020 | 29.8 | 22.8 | 26.0 | 22.2 | 16.2 | 18.9 | 23 | 17.1 | 19.6 | 22.9 | 17.2 | 19.7 | 24.8 | 18.7 | 21.3 |
| 06/2020 | 33.9 | 28.7 | 30.7 | 25.5 | 21.2 | 22.7 | 26.4 | 22.3 | 23.8 | 26.8 | 22.7 | 24.3 | 28.9 | 24.5 | 26.1 |
| 07/2020 | 37.1 | 31.9 | 34.7 | 28.2 | 23.9 | 26.2 | 29.2 | 25.3 | 27.3 | 30.2 | 26.4 | 28.3 | 32.3 | 28.2 | 30.3 |
| 08/2020 | 37.9 | 33.9 | 36.5 | 29.1 | 25.7 | 28.0 | 30.2 | 27.5 | 29.2 | 31.9 | 29.8 | 31.1 | 33.7 | 31.5 | 32.8 |
| 09/2020 | 34.8 | 29.4 | 32.0 | 26.2 | 21.9 | 23.8 | 28 | 23.4 | 25.5 | 30.1 | 26.1 | 28.0 | 31.7 | 27.1 | 29.2 |
| 10/2020 | 30.5 | 22.3 | 26.4 | 22.5 | 16.2 | 19.4 | 23.9 | 17.7 | 20.8 | 26.2 | 20.2 | 23.2 | 27.3 | 20.8 | 24.0 |
| 11/2020 | 23.0 | 16.2 | 19.9 | 16.7 | 11.7 | 14.4 | 18 | 12.7 | 15.6 | 20.2 | 14.7 | 17.7 | 20.8 | 15.1 | 18.2 |
| 12/2020 | 16.9 | 12.5 | 15.3 | 12.2 | 8.7 | 11.0 | 13.1 | 9.5 | 11.7 | 14.8 | 10.9 | 13.2 | 15.3 | 11.3 | 13.6 |
| 01/2050 | 16.0 | 13.2 | 14.7 | 12.1 | 9.3 | 10.8 | 13.8 | 10.6 | 11.8 | 15.1 | 12 | 13.1 | 15.1 | 12.2 | 13.3 |
| 02/2050 | 18.0 | 14.9 | 16.4 | 13 | 10.7 | 11.8 | 13.1 | 11.1 | 12.1 | 13.4 | 12.1 | 12.7 | 14.3 | 12.7 | 13.4 |
| 03/2050 | 21.3 | 17.0 | 19.3 | 14.9 | 12 | 13.7 | 15.4 | 12.4 | 14.1 | 15.3 | 13 | 14.3 | 16.5 | 13.9 | 15.4 |
| 04/2050 | 25.0 | 20.4 | 23.1 | 17.7 | 14.4 | 16.4 | 18.6 | 14.9 | 17 | 18.3 | 15.1 | 17 | 19.9 | 16.3 | 18.4 |
| 05/2050 | 30.6 | 23.6 | 26.8 | 22.9 | 16.9 | 19.6 | 23.7 | 17.8 | 20.3 | 23.8 | 18.1 | 20.6 | 25.6 | 19.6 | 22.2 |
| 06/2050 | 35.1 | 29.5 | 31.8 | 26.7 | 22.2 | 23.8 | 27.6 | 23 | 24.8 | 28.2 | 23.6 | 25.5 | 30.2 | 25.3 | 27.3 |
| 07/2050 | 38.9 | 33.3 | 36.3 | 29.9 | 25.3 | 27.7 | 30.9 | 26.6 | 28.8 | 32.1 | 27.8 | 30.1 | 34.2 | 29.7 | 32.0 |
| 08/2050 | 39.8 | 35.8 | 38.4 | 30.8 | 27.4 | 29.7 | 31.9 | 29.2 | 31 | 33.9 | 31.7 | 33.1 | 35.7 | 33.6 | 34.9 |
| 09/2050 | 36.6 | 30.9 | 33.5 | 27.8 | 23.2 | 25.2 | 29.7 | 24.7 | 27 | 32.1 | 27.7 | 29.7 | 33.7 | 28.7 | 31.0 |
| 10/2050 | 31.8 | 23.5 | 27.6 | 23.8 | 17.2 | 20.4 | 25.2 | 18.7 | 21.9 | 27.8 | 21.4 | 24.6 | 28.9 | 22.0 | 25.4 |
| 11/2050 | 24.2 | 17.5 | 21.2 | 17.7 | 12.7 | 15.5 | 19 | 13.8 | 16.6 | 21.4 | 16 | 18.9 | 22.0 | 16.4 | 19.5 |
| 12/2050 | 18.3 | 14.1 | 16.8 | 13.3 | 10 | 12.2 | 14.2 | 10.8 | 12.9 | 16.1 | 12.4 | 14.6 | 16.6 | 12.8 | 15.0 |
| 01/2080 | 17 | 14.4 | 15.9 | 13.0 | 10.4 | 11.9 | 14.4 | 11.6 | 12.7 | 15.7 | 13.1 | 14.1 | 15.8 | 13.3 | 14.4 |
| 02/2080 | 19.3 | 16.1 | 17.7 | 14.1 | 11.8 | 12.9 | 14.2 | 12.2 | 13.2 | 14.7 | 13.3 | 13.9 | 15.7 | 13.9 | 14.7 |
| 03/2080 | 22.6 | 18.3 | 20.6 | 16.0 | 13.2 | 14.8 | 16.5 | 13.6 | 15.2 | 16.6 | 14.3 | 15.6 | 17.8 | 15.2 | 16.7 |
| 04/2080 | 26.3 | 21.7 | 24.4 | 18.9 | 15.5 | 17.5 | 19.8 | 16 | 18.2 | 19.7 | 16.4 | 18.3 | 21.3 | 17.6 | 19.8 |
| 05/2080 | 32.1 | 25.1 | 28.3 | 24.5 | 18.2 | 21.0 | 25.2 | 19.1 | 21.8 | 25.5 | 19.5 | 22.1 | 27.4 | 21 | 23.8 |
| 06/2080 | 36.9 | 31.1 | 33.5 | 28.3 | 23.8 | 25.4 | 29.3 | 24.6 | 26.5 | 30.2 | 25.3 | 27.3 | 32.3 | 27.1 | 29.2 |
| 07/2080 | 41 | 35.2 | 38.3 | 31.8 | 27.0 | 29.5 | 32.8 | 28.3 | 30.6 | 34.3 | 29.9 | 32.2 | 36.5 | 31.8 | 34.2 |
| 08/2080 | 42 | 38 | 40.7 | 32.9 | 29.5 | 31.8 | 34 | 31.3 | 33 | 36.4 | 34 | 35.5 | 38.2 | 35.8 | 37.3 |
| 09/2080 | 38.9 | 33.1 | 35.8 | 29.9 | 25.2 | 27.3 | 31.8 | 26.7 | 29 | 34.6 | 30 | 32.1 | 36.1 | 31.1 | 33.4 |
| 10/2080 | 34.1 | 25.5 | 29.6 | 25.7 | 18.9 | 22.2 | 27.2 | 20.4 | 23.7 | 30.1 | 23.5 | 26.7 | 31.2 | 24.1 | 27.6 |
| 11/2080 | 26.1 | 19.1 | 22.9 | 19.3 | 14.1 | 16.9 | 20.7 | 15.2 | 18.1 | 23.4 | 17.6 | 20.8 | 24.1 | 18 | 21.3 |
| 12/2080 | 19.8 | 15.3 | 18.1 | 14.6 | 11.1 | 13.4 | 15.6 | 11.9 | 14.1 | 17.8 | 13.8 | 16 | 18.2 | 14.1 | 16.5 |
The color scale ranges from blue (lowest temperature values) to red (highest temperature values).
References
- Baglivo, C.; Mazzeo, D.; Panico, S.; Bonuso, S.; Matera, N.; Congedo, P.M.; Oliveti, G. Complete greenhouse dynamic simulation tool to assess the crop thermal well-being and energy needs. Appl. Therm. Eng. 2020, 179, 115698. [Google Scholar] [CrossRef]
- Baglivo, C.; Congedo, P.M. Implementation hypothesis of the Apulia ITACA Protocol at district level—Part I: The model. Sustain. Cities Soc. 2021, 102931. [Google Scholar] [CrossRef]
- Congedo, P.M.; Baglivo, C.; Toscano, A.M. Implementation hypothesis of the Apulia ITACA Protocol at district level—Part II: The case study. Sustain. Cities Soc. 2021, 70, 102927. [Google Scholar] [CrossRef]
- Brussels, 14.10.2020 COM(2020) 662 Final. Communication from the Commission to the European Parliament, the Council, the European Economic and Social Committee and the Committee of the Regions. A Renovation Wave for Europe-Greening Our Buildings, Creating Jobs, Improving Lives. Available online: https://www.buildup.eu/sites/default/files/content/eu_renovation_wave_strategy.pdf (accessed on 21 January 2021).
- Berardi, U.; Jafarpur, P. Assessing the impact of climate change on building heating and cooling energy demand in Canada. Renew. Sustain. Energy Rev. 2020, 121, 109681. [Google Scholar] [CrossRef]
- Tootkaboni, M.P.; Ballarini, I.; Zinzi, M.; Corrado, V. A comparative analysis of different future weather data for building energy performance simulation. Climate 2021, 9, 37. [Google Scholar] [CrossRef]
- Tettey, U.Y.A.; Gustavsson, L. Energy savings and overheating risk of deep energy renovation of a multi-storey residential building in a cold climate under climate change. Energy 2020, 202, 117578. [Google Scholar] [CrossRef]
- Pérez-Andreu, V.; Aparicio-Fernandez, C.; Martínez-Ibernón, A.; Vivancos, J.L. Impact of climate change on heating and cooling energy demand in a residential building in a Mediterranean climate. Energy 2018, 165, 63–74. [Google Scholar] [CrossRef]
- Liu, Z.; Zhou, Q.; Tian, Z.; He, B.; Jin, G. A comprehensive analysis on definitions, development, and policies of nearly zero energy buildings in China. Renew. Sustain. Energy Rev. 2019, 114, 109314. [Google Scholar] [CrossRef]
- Lin, Y.; Zhong, S.; Yang, W.; Hao, X.; Li, C. Towards zero-energy buildings in China: A systematic literature review. J. Clean. Prod. 2020, 276, 123297. [Google Scholar] [CrossRef]
- Panagiotidou, M.; Fuller, R.J. Progress in ZEBs—A review of definitions, policies and construction activity. Energy Policy 2013, 62, 196–206. [Google Scholar] [CrossRef]
- Al-Saadi, S.N.; Shaaban, A.K. Zero energy building (ZEB) in a cooling dominated climate of Oman: Design and energy performance analysis. Renew. Sustain. Energy Rev. 2019, 112, 299–316. [Google Scholar] [CrossRef]
- Bamdad, K.; Cholette, M.E.; Omrani, S.; Bell, J. Future energy-optimised buildings—Addressing the impact of climate change on buildings. Energy Build. 2021, 231, 110610. [Google Scholar] [CrossRef]
- De Wilde, P.; Coley, D. The implications of a changing climate for buildings. Build. Environ. 2012, 55, 1–7. [Google Scholar] [CrossRef]
- Nguyen, A.T.; Rockwood, D.; Doan, M.K.; Le, T.K.D. Performance assessment of contemporary energy-optimized office buildings under the impact of climate change. J. Build. Eng. 2021, 35, 102089. [Google Scholar] [CrossRef]
- Italian National Institute of Statistics, Costruzioni, ISTAT. 2015. Available online: https://www.istat.it/it/files//2015/12/C18.pdf (accessed on 21 January 2021).
- Italian National Institute of Statistics, Costruzioni, ISTAT. 2020. Available online: https://www.istat.it/it/files//2020/12/C18.pdf (accessed on 21 January 2021).
- ENEA. Rapporto Annuale Sull’efficienza Energetica. October 2020. Available online: https://www.enea.it/it/seguici/pubblicazioni/pdf-volumi/2020/raee-2020.pdf (accessed on 11 February 2021).
- Miur, Focus “Principali Dati Della Scuola—Avvio Anno Scolastico 2020/2021”. September 2020. Available online: https://www.miur.gov.it/documents/20182/2512903/Principali+dati+della+scuola+-+avvio+anno+scolastico+2020-2021.pdf/a317b7bb-0acc-d8ea-a739-1d58b07d5727?version=1.0&t=1601039493765 (accessed on 11 February 2021).
- European Commision, 2016. European Commision, EU Strategy on Heating and Cooling. February 2016. Available online: https://ec.europa.eu/energy/sites/ener/files/documents/1_EN_ACT_part1_v14.pdf (accessed on 11 February 2021).
- Citterio, M.; Fasano, G. Indagine Sui Consumi Degli Edifici Pubblici (Direzionale e Scuole) e Potenzialità Degli Interventi di Efficienza Energetica, ENEA, Report RSE/2009/165. Available online: https://www.enea.it/it/Ricerca_sviluppo/documenti/ricerca-di-sistema-elettrico/condizionamento/rse165.pdf (accessed on 21 January 2021).
- Bonomolo, M.; Baglivo, C.; Bianco, G.; Congedo, P.M.; Beccali, M. Cost optimal analysis of lighting retrofit scenarios in educational buildings in Italy. Energy Procedia 2017, 126, 171–178. [Google Scholar] [CrossRef]
- Amoatey, P.; Omidvarborna, H.; Baawain, M.S.; Al-Mamun, A. Impact of building ventilation systems and habitual indoor incense burning on SARS-CoV-2 virus transmissions in Middle Eastern countries. Sci. Total Environ. 2020, 733, 139356. [Google Scholar] [CrossRef]
- Noorimotlagh, Z.; Jaafarzadeh, N.; Martínez, S.S.; Mirzaee, S.A. A systematic review of possible airborne transmission of the COVID-19 virus (SARS-CoV-2) in the indoor air environment. Environ. Res. 2021, 193, 110612. [Google Scholar] [CrossRef]
- Villanueva, F.; Notario, A.; Cabañas, B.; Martín, P.; Salgado, S.; Gabriel, M.F. Assessment of CO2 and aerosol (PM2.5, PM10, UFP) concentrations during the reopening of schools in the COVID-19 pandemic: The case of a metropolitan area in Central-Southern Spain. Environ. Res. 2021, 197, 111092. [Google Scholar] [CrossRef]
- Ismail, F.H.; Shahrestani, M.; Vahdati, M.; Boyd, P.; Donyavi, S. Climate change and the energy performance of buildings in the future—A case study for prefabricated buildings in the UK. J. Build. Eng. 2021, 39, 102285. [Google Scholar] [CrossRef]
- Zou, Y.; Xiang, K.; Zhan, Q.; Li, Z. A simulation-based method to predict the life cycle energy performance of residential buildings in different climate zones of China. Build. Environ. 2021, 193, 107663. [Google Scholar] [CrossRef]
- Da Guarda, E.L.A.; Domingos, R.M.A.; Jorge, S.H.M.; Durante, L.C.; Sanches, J.C.M.; Leão, M.; Callejas, I.J.A. The influence of climate change on renewable energy systems designed to achieve zero energy buildings in the present: A case study in the Brazilian Savannah. Sustain. Cities Soc. 2020, 52, 101843. [Google Scholar] [CrossRef]
- Italian Republic. Legislative Decree 3 March 2011, no. 28 “Attuazione Della Direttiva 2009/28/CE Sulla Promozione Dell’uso Dell’energia da Fonti Rinnovabili […]”. OJ of the Italian Republic; 28 March 2011 (in Italian). Available online: https://www.minambiente.it/sites/default/files/dlgs_03_03_2011_28.pdf (accessed on 11 February 2021).
- Decree 26 June 2015—Applicazione delle Metodologie di Calcolo delle Prestazioni Energetiche e Definizione delle Prescrizioni e dei Requisiti Minimi Degli Edifici. Available online: https://www.mise.gov.it/index.php/it/normativa/decreti-interministeriali/2032966-decreto-interministeriale-26-giugno-2015-applicazione-delle-metodologie-di-calcolo-delle-prestazioni-energetiche-e-definizione-delle-prescrizioni-e-dei-requisiti-minimi-degli-edifici (accessed on 11 February 2021).
- Legislative Decree No. 48 of 10 June 2020, of the European Parliament and of the Council of 30 May 2018, Amending Directive 2010/31/EU on the Energy Performance of Buildings and Directive 2012/27/EU on Energy Efficiency. Available online: https://www.gazzettaufficiale.it/eli/id/2020/06/10/20G00066/sg (accessed on 11 February 2021).
- Directive 2018/844, 2018. Directive 2018/844 of the European Parliament and of the Council of 30 May 2018 Amending Directive 2010/31/EU on the Energy Performance of Buildings and Directive 2012/27/EU on Energy Efficiency; Official Journal of the European Union: Brussels, Belgum, 2018.
- Italian Organisation for Stardardisation (UNI). UNI/TS 11300-1:2014—Energy Performance of Buildings Part 1: Evaluation of Energy need for Space Heating and Cooling; Italian Organisation for Stardardisation (UNI): Milan, Italy, 2014. [Google Scholar]
- European Norm EN ISO 13788. Hygrothermal Performance of Building Components and Building Elements, Internal Surface Temperature to Avoid Critical Surface Humidity and Interstitial Condensation—Calculation Methods; Italian Organisation for Stardardisation (UNI): Milan, Italy, 2013. [Google Scholar]
- Decree-Law—12 September 2013, n.104: Misure Urgenti in Materia di Istruzione, Università e Ricerca; Official Gazette: Rome, Italy, 2013.
- Miur, Per la Scuola Competenze e Ambienti per L’apprendimento—Programmazione 2014–2020. 2014. Available online: https://www.miur.gov.it/documents/20182/881790/ponkit_brochure_2017.pdf/72a2c343-3c24-4a98-8924-a6e5a23a1aa7 (accessed on 11 February 2021).
- Fregonara, E.; Verso, V.R.M.L.; Lisa, M.; Callegari, G. Retrofit Scenarios and Economic Sustainability. A Case-study in the Italian Context. Energy Procedia 2017, 111, 245–255. [Google Scholar] [CrossRef]
- Rey-Hernández, J.M.; Yousif, C.; Gatt, D.; Velasco-Gómez, E.; José-Alonso, J.S.; Rey-Martínez, F.J. Modelling the long-term effect of climate change on a zero energy and carbon dioxide building through energy efficiency and renewables. Energy Build. 2018, 174, 85–96. [Google Scholar] [CrossRef]
- Jentsch, M.F.; James, P.A.B.; Bourikas, L.; Bahaj, A.S. Transforming existing weather data for worldwide locations to enable energy and building performance simulation under future climates. Renew. Energy 2013, 55, 514–524. [Google Scholar] [CrossRef]
- Moazami, A.; Carlucci, S.; Geving, S. Critical Analysis of Software Tools Aimed at Generating Future Weather Files with a view to their use in Building Performance Simulation. Energy Procedia 2017, 132, 640–645. [Google Scholar] [CrossRef]
- Congedo, P.M.; Baglivo, C.; Centonze, G. Walls comparative evaluation for the thermal performance improvement of low-rise residential buildings in warm Mediterranean climate. J. Build. Eng. 2020, 28, 101059. [Google Scholar] [CrossRef]
- European Committee for Standardization (CEN). EN ISO 52016-1:2018, Energy Performance of Buildings—Energy Needs for Heating and Cooling, Internal Temperatures and Sensible and Latent Loads; European Committee for Standardization, CEN: Brussels, Belgium, 2018. [Google Scholar]
- Italian Organisation for Stardardisation (UNI). UNI 10349: 2016, Heating and Cooling of Buildings—Climatic Data; Italian Organisation for Stardardisation (UNI): Milan, Italy, 2016. [Google Scholar]
- European Committee for Standardization (CEN). EN ISO 15927-4:2005—Hygrothermal Performance of Buildings—Calculation and Presentation of Climatic Data—Part 4: Hourly Data for Assessing the Annual Energy Use for Heating and Cooling; European Committee for Standardization (CEN): Brussels, Belgium, 2005. [Google Scholar]
- University of Southampton, CCWeatherGen: Climate Change Weather File Generator for the UK. Available online: https://energy.soton.ac.uk/ccweathergen-climate-change-weather-file-generator-for-the-uk/ (accessed on 11 June 2020).
- Comitato Termotecnico Italiano—CTI. UNI 10339—Air Conditioning Systems for Thermal Comfort in Buildings—General, Classification and Requirements—Offer; Order and Supply Specifications Italy: Rome, Italy, 2005. [Google Scholar]
- Chen, D.; Chen, H.W. Using the Köppen classification to quantify climate variation and change: An example for 1901–2010. Environ. Dev. 2013, 6, 69–79. [Google Scholar] [CrossRef]
- Arnfield, A.J. Köppen Climate Classification, Encyclopædia Britannica, Encyclopædia Britannica, Inc. 2020. Available online: https://www.britannica.com/science/Koppen-climate-classification (accessed on 11 February 2021).
- Gamero-Salinas, J.C.; Monge-Barrio, A.; Sánchez-Ostiz, A. Overheating risk assessment of different dwellings during the hottest season of a warm tropical climate. Build. Environ. 2020, 171, 106664. [Google Scholar] [CrossRef]
- Congedo, P.M.; D’Agostino, D.; Baglivo, C.; Tornese, G. Ilaria Zacà Efficient Solutions and Cost-Optimal Analysis for Existing School Buildings. Energies 2016, 9, 851. [Google Scholar] [CrossRef]
- EN ISO 13786:2017—Thermal Performance of Building Components—Dynamic Thermal Characteristics—Calculation Methods; European Committee for Standardization: Brussels, Belgium, 2017.
- EN ISO 13370:2017—Thermal Performance of Buildings—Heat Transfer Via the Ground—Calculation Methods; International Standard Organisation: Geneva, Switzerland, 2017.
- Baglivo, C.; Congedo, P.M.; Sassi, V. Numerical dataset of slab-on-ground floor for buildings in warm climate from a multi-criteria analysis. Data Brief 2018, 20, 269–276. [Google Scholar] [CrossRef]
- Malvoni, M.; Baglivo, C.; Congedo, P.M.; Laforgia, D. CFD modeling to evaluate the thermal performances of window frames in accordance with the ISO 10077. Energy 2016, 111, 430–438. [Google Scholar] [CrossRef]
- UNI 10375:2011. Calculation Method of the Indoor Temperature of a Room in the Warm Period; Italian Organisation for Stardardisation (UNI): Milan, Italy, 2011. [Google Scholar]
Publisher’s Note: MDPI stays neutral with regard to jurisdictional claims in published maps and institutional affiliations. |
© 2021 by the author. Licensee MDPI, Basel, Switzerland. This article is an open access article distributed under the terms and conditions of the Creative Commons Attribution (CC BY) license (https://creativecommons.org/licenses/by/4.0/).