Article

A Cluster Analysis Approach to Profile Men and Women’s Volley Positions in Professional Tennis Matches (Doubles)

by
Rafael Martínez-Gallego
1,
Jesús Ramón-Llin
2,* and
Miguel Crespo
3
1
Department of Sport and Physical Education, University of Valencia, 46010 Valencia, Spain
2
Department of Teaching of Music, Visual and Corporal Expression, University of Valencia, 46021 Valencia, Spain
3
Integrity and Development Department, International Tennis Federation, London SW15 5XZ, UK
*
Author to whom correspondence should be addressed.
Sustainability 2021, 13(11), 6370; https://doi.org/10.3390/su13116370
Submission received: 2 May 2021 / Revised: 28 May 2021 / Accepted: 1 June 2021 / Published: 3 June 2021

Abstract

:
(1) Background: Tennis ball tracking technology allows the aquirement of novel and reliable data about several performance indicators, such as volley positions. This information is key to understand match dynamics in doubles tennis and to better help preparing players for the demands they will face in match play. As such, the purpose of this study was to describe and compare the different types of volley positions in men’s and women’s doubles professional tennis. (2) Methods: Ball tracking data were collected for 46 women (Billie Jean King Cup) and 96 men’s doubles matches (Davis Cup). The variables used were the distance to the net, the distance to the centre of the court and the height of the impact. A K-Means cluster analysis was used to identify in each subsample different profiles of volley locations. (3) Results: The inferential analysis revealed differences in men’s (distance to the net η2 = 0.72, distance to the centre of the court η2 = 0.77 and impact height η2 = 0.63) and women’s subsamples (distance to the net η2 = 0.48, distance to the centre of the court η2 = 0.52 and impact height η2 = 0.51). (4) Conclusions: The results allowed the suggestion of a higher variability in men’s matches, as there were seven different clusters identified, and only four in women’s.

1. Introduction

Recent advances in sport technology are allowing scientists to collect large amounts of data about competitions and, consequently, to also prepare the athletes using these data-based insights. There are some examples of profiling the athletes’ features and the competition demands in basketball [1], tennis [2] and other sports that clearly serve this purpose. Unfortunately, the specific case of doubles in tennis remains quite unexplored, despite the fact that this sport configures a very unique opportunity to better understand the complexity of small groups at the levels of intra and inter-player coordination to perform in such time–space conditions. The use of the Hawk-Eye, the most widely used tracking system in tennis, in the two most important team competitions, the Davis Cup and the Billie Jean King Cup (former Fed Cup), provides a unique opportunity to delve into doubles tennis.
The tactics of the doubles game are generally more complex than those of singles. The fact that the matches are played by four players instead of two implies that the decision-making process during the game requires inter-player coordination, thus increasing its complexity [3]. Therefore, players should adjust the positions, movements and shots used, which in turn increases the number of tactical options as compared to the singles game [4]. The coaching literature has emphasised the fact that doubles play requires better perceptual skills than the singles game since, in addition to watching the ball, it is important to be aware not only of the positions of the opponents but also of the position of the partner [5]. Furthermore, coordination and communication dynamics with the partner play a fundamental role for the success of the team [6,7,8,9]. On the other hand, the doubles game has a different scoring system. Professional doubles matches are played to the best of two tie-break sets and a “match tie-break”, and the “no-ad” rule is applied (when reaching deuce, the winning pair of the next point is the winner of the game). These differences in the scoring system mean that the structure of doubles matches is substantially different from that of singles [10].
In recent years, the game of doubles has changed considerably. The increase in ball speed has increased the difficulty of the net game. However, despite the difficulty, the game in this area of the court is still of vital importance in doubles tennis. Practitioners consider that volleys and overheads, the usual shots played in this zone, have a higher percentage of effectiveness than shots from the back of the court [11]. In fact, at the start of the points, the doubles formations most used by both the serving and the receiving teams include a player in the net [12].
Despite the great differences with singles tennis, there is a lack of empirical examination of the main characteristics of the doubles game. This is most compelling when it comes to analysing the strategy and tactics of the doubles game. While coaching texts have commonly described common doubles tactics [13,14,15,16,17,18], research on doubles performance has primarily focused on the coordination [6] and interpersonal communication dynamics [7,8,9] of the doubles teams. Few studies have examined the technical and/or tactical features of the doubles game. Carboch et al. [12] and Kočíb et al. [4] analysed serve formations, Carboch and Kočíb [19] and Martínez-Gallego et al. [20] compared the serve efficiency between male and female teams, Martínez-Gallego et al. [10] focused their research on the game structure and point ending characteristics, and Martínez-Gallego et al. [3] analysed the influence of teams’ experience on the time structure of the doubles game. In addition, despite the importance of volleys, they have received little attention from previous research as compared to other shots such as serves or groundstrokes, both in singles and doubles. To the knowledge of the authors, this is the first study that explores the positions of professional male and female doubles teams when volleying using Big Hawk-Eye Data.
In recent years, one of the most important advances in evaluating the technical and tactical performance of tennis players has been the use of tracking systems. These systems analyse the images obtained through a network of cameras that capture images in two or three dimensions and allow the calculation of different kinematic and positional variables for both the players and the ball. Although there are various tracking systems that have been used in tennis match-analysis [21,22], the most widely used tracking system is the Hawk-Eye, since it is used in more than 80 professional tournaments as the electronic line calling (Hawk-Eye Innovations). Ball tracking assists officials and players by providing replays of the ball bounce and also allows statistical and cinematic data to be shown during television broadcasts. The high level of precision and the large amount of data recorded through this system offer a wide range of opportunities for research [23]. Previous studies that have used this system have focused on analysing the differences between the technical, tactical and movement characteristics between male and female players [24], the differences between professional and junior players in selected aspects of the game [25], and the importance of the service [20,23,26].
Thus far, no study has used tracking systems to investigate the characteristics of volleys in doubles tennis. That is why the objective of this study was to analyse and compare the different profiles of volley positions in men’s and women’s professional doubles tennis using ball tracking technology. It was hypothesised that, for both men and women, the highest percentages of volleys would occur close to the net, away from the centre of the court, and at heights close to one metre. In addition, it was also hypothesised that in men’s doubles, a greater number of volley types would be found than in women’s doubles.

2. Materials and Methods

2.1. Sample

The study sample consisted of a total of 24,982 volleys played on doubles matches. A total of 6126 were from Billie Jean King Cup matches (n = 46) and 18,856 corresponded to Davis Cup matches (n = 96). All the matches were part of qualifying draw ties played on hard courts between 2010 and 2019.

2.2. Data Analysis

The data for this study were obtained through the Hawk-Eye system. This system, which has been validated in previous research [24,27], consists of ten cameras that record at a frequency of 50 to 60 Hz. It allows the tracking of coordinates of the ball and the players during the points in four dimensions (time and Cartesian dimensional coordinates). From this information, the system allows the calculation of different kinematic and descriptive variables (for example, the position where the ball is hit by the player). The data obtained through the Hawk-Eye system were imported to RStudio v. 1.3.959 for Mac, where the data were standardised to adjust the mean values of the different variables, subdivided to obtain the two sub-samples and filtered to eliminate outliers. Specifically, the distance to the net (DNET), distance to the centre of the court (DCEN) and impact height (Hgt) coordinates (Figure 1) were selected for all volleys played.

2.3. Statistical Analysis

The RStudio v. 1.3.959 for Mac was used to carry out the statistical analysis. A K-Means cluster analysis was conducted. Clustering is a technique used to find and classify k groups of data (clusters). Thus, the elements that share similar characteristics will be together in the same group, separated from the other groups with which they do not share characteristics. To find out if the data are similar or different, the K-Means algorithm uses the distance between the data. Observations that are similar will have a smaller distance between them. In general, the Euclidean distance is used as a measure, although other functions can also be used [28]. This and other clustering methods have been used previously in performance analysis in sport [29,30] and, specifically, in tennis [25]. K-Means needs as input the number of groups in which the sample is going to be segmented. From this number k of clusters, the algorithm first places k random points (centroids). Then, it assigns to any of those points all the samples with the smallest distances. To estimate this number of groups or clusters, the gap statistic method was used. This method compares the change in within-cluster dispersion with that expected under an appropriate reference null distribution [31]. To check the suitability of the clusters obtained, and the differences between each of them, an inferential analysis was carried out. A MANOVA test was used to check the differences between clusters. The level of significance was established at a value of 0.05 or less. Subsequently, to perform pairwise comparisons, the T-test was used with the Bonferroni correction. For all comparisons, the size of the effect was calculated using eta-squared. Small effect values were considered 0.01–0.06, moderate effect values were considered 0.06–0.14 and large effect values were considered ≥0.14 [32].

3. Results

3.1. Davis Cup

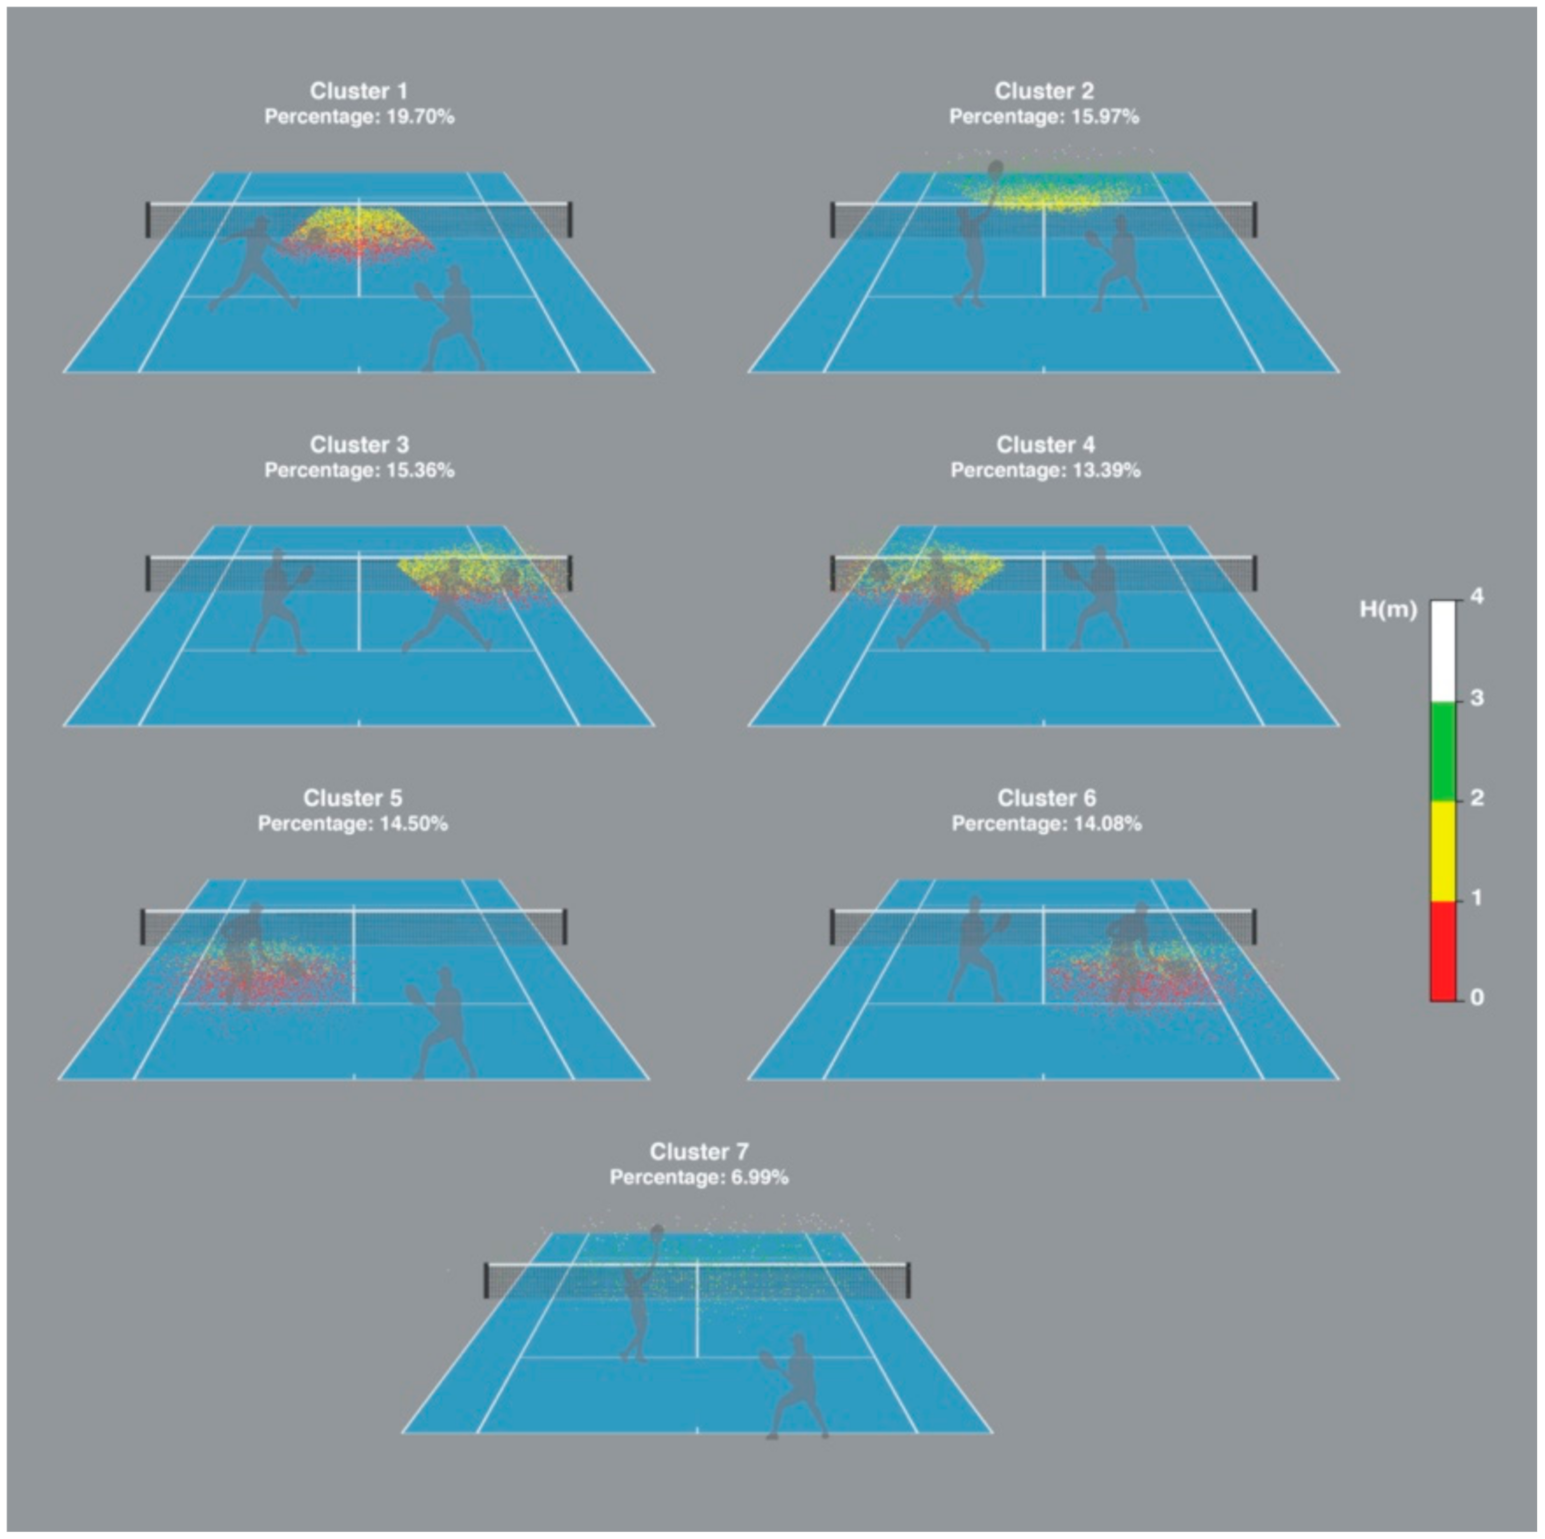
The gap method was used to identify the optimal number of clusters. A model of seven clusters was suggested by the abovementioned method. Therefore, a K-Means cluster analysis was performed to create and describe seven maximal different groups of volley positions (Figure 2). The means and standard deviations (SD) from the men’s volley location variables according to the cluster solutions are presented in Table 1. The inferential analysis revealed statistically significant differences for the DNET (p < 0.01; η2 = 0.72), DCEN (p < 0.01; η2 = 0.77) and Hgt (p < 0.01; η2 = 0.63). Two-paired comparisons showed differences between all the clusters for the DNET. For the DCEN, the differences were not significant between Clusters 2 and 7. In the case of Hgt, the differences were non-significant between Clusters 5 and 6, and between Clusters 3 and 4.
Cluster 1 volleys were played relatively close to the net, close to the centre of the court and at a height similar to the net height. Volleys in Cluster 2 were high volleys and overheads played very close to the net and relatively close to the centre of the court. The volleys grouped in Cluster 3 were played close to the net, on the right side of the court and at a medium height. Cluster 4 groups the volleys that were played at a similar height on the right side of the court and slightly further from the net than those of Cluster 3. Regarding the volleys grouped in Cluster 5, these were played relatively far from the net, on the left side of the court and, for the most part, below the net height. Cluster 6 groups the volleys that were played at a similar height on the right side of the court and slightly closer to the net than those of Cluster 5. Finally, the volleys in Cluster 7 were high volleys or overhead smashes hit at a distance relatively far from the net.
The number of volleys in each cluster represents the frequency of the different types of volleys. The most common type of volley in men’s tennis doubles was the volleys of Cluster 1, while volleys in Cluster 7 were the least frequent. As it can be seen in Figure 2, as expected, there is a large variability in the types of volleys that occurred during the Davis Cup matches. However, contrary to what was hypothesised, the most frequent types of volleys occurred near the centre of the court at different heights.

3.2. Billie Jean King Cup

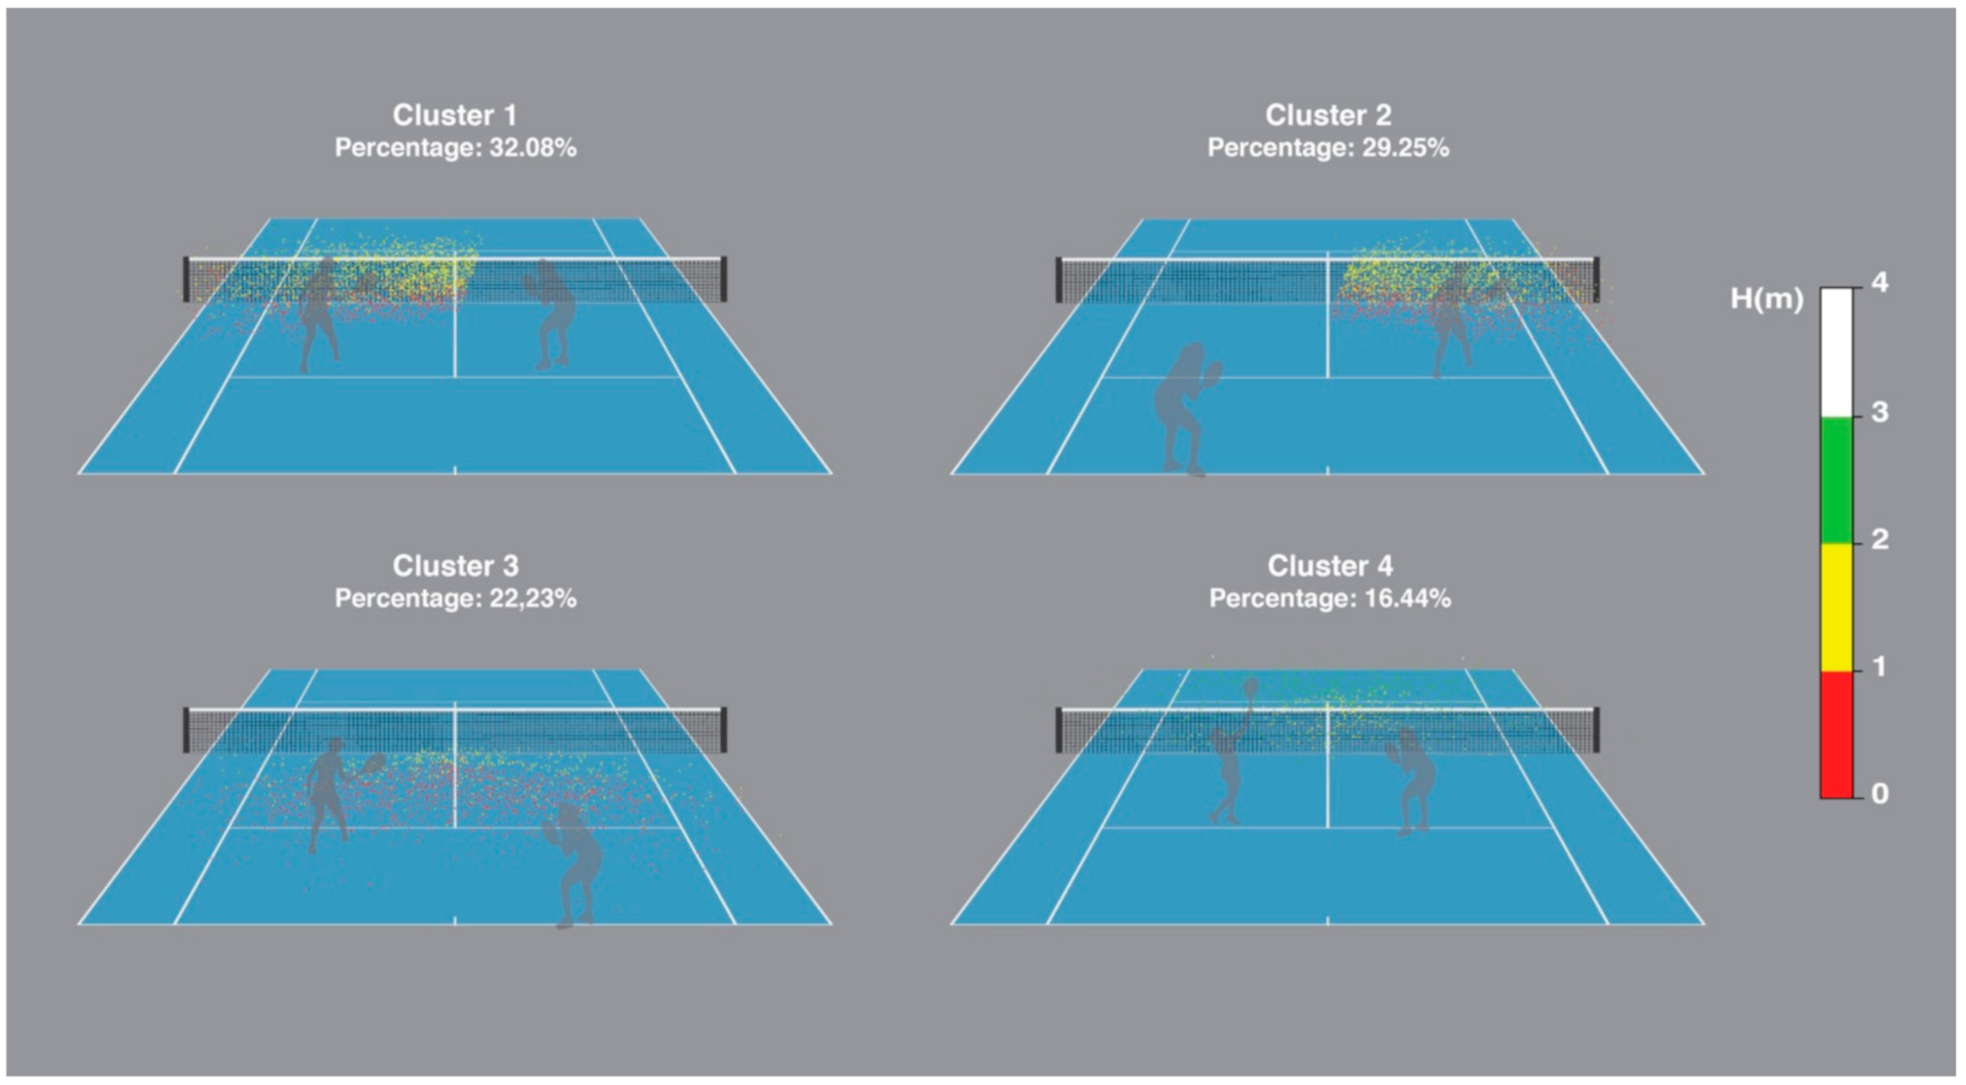
As in the men’s doubles game, the gap method was used to identify the optimal number of clusters. A model of four clusters was suggested by the abovementioned method. Therefore, a K-Means cluster analysis was performed to create and describe four maximal different groups of volley positions (Figure 3). The means and standard deviations (SD) from the women’s volley location variables according to the cluster solutions are presented in Table 2. The inferential analysis revealed statistically significant differences for the DNET (p < 0.01; η2 = 0.48), DCEN (p < 0.01; η2 = 0.52) and H (p < 0.01; η2 = 0.51). Two-paired comparisons showed differences between all the clusters for the DNET, DCEN and Hgt.
The volleys in Cluster 1 were played close to the net, on the left side of the court and at a medium height. Cluster 2 groups the volleys played at a similar height on the right side of the court and slightly further from the net than those of Cluster 1. Cluster 3 volleys are those played relatively far and, in the majority of the cases, below the net height. Finally, the volleys in Cluster 4 were overheads and high volleys, played close to the net and relatively close to the centre of the court.
Regarding the frequency of the different types of volleys, the most common type of volley in women’s tennis doubles was the volleys of Cluster 1, while volleys in Cluster 4 were the least frequent. As it can be seen in Figure 3, as hypothesised, the variety in volley types in Billie Jean King Cup matches was less than in Davis Cup matches. In this case, as expected, more volleys away from the centre of the court did occur.

4. Discussion

This study was the first to provide a classification of volley types played in Davis Cup and Billie Jean King Cup (former Fed Cup) doubles tennis matches, based on the position where they were hit. The DNET, the DCEN, and the Hgt of the impact allowed us to discriminate and group the different types of volleys, both in the men’s and in the women’s matches. In the case of the Davis Cup, seven different volley types were found, and in the case of the Billie Jean King Cup, four types were identified. The groupings obtained in the matches of both the Davis Cup and the Billie Jean King Cup presented clear differences depending on the position parameters. These positional differences are obviously very related to various specific tactical aspects of each category.

4.1. Davis Cup

As it has been observed in the results, the clusters that grouped a greater number of volleys and, therefore, presented a higher frequency were Cluster 1 and Cluster 2. The volleys of these clusters, as it was hypothesised, were played close to the net, but contrary to what was hypothesised, they were played close to the centre of the court. One of the most important aspects when players are at the net, especially in situations where they have the initiative of the point, is to be as close to the net as possible [5]. Therefore, it seems reasonable that these two clusters are the most frequent ones. On the other hand, one of the tactics most used by doubles teams when the opponents are at the net is to play in between the players. This has several advantages—on the one hand, this area is considered by the coaching literature as one of the weakest in any doubles team as it demands efficient teamwork and communication regarding which member of the team will take the volley [8]. In addition, the net is lower at the centre, so it is easier to play a low ball which forces the opponents to volley up, which is one of the key objectives when the opposing team is at the net [15]. It is then logical that the volleys in Cluster 1 showed such a high frequency. However, the volleys in Cluster 2 are played at a greater height and, therefore, are easier to play and are probably the most effective. These types of volleys are played following a high ball hit by the opposing team in an emergency situation. The player usually poaches and hits the high volley in the centre of the court. Furthermore, in recent years, one of the most frequent formations of the serving team is the “I” formation, in which the server’s partner is at the net and very close to the centre of the court [12,15]. This position facilitates that, following a good service, the receiver is forced to return to the centre of the court and the player who is at the net can play this type of high volley.
The volleys in Clusters 3 and 4 are also volleys played close to the net, which confirms the importance of this positioning whenever the situation permits [5]. However, unlike previous volleys, these volleys are played far from the centre of the court. The classic formation, in which the net player stands on the opposite side to his partner, is the most frequent in the return situation, and also, together with the “I” formation, in the service situation [4]. This means that both at the beginning and during the points, at least one player of the team is at the net and far from the centre. This is the scenario in which this type of volley occurs more frequently [16].
Regarding the volleys in Clusters 5 and 6, although they were also played far from the centre of the court, the distance to the net was greater and the height was lower than in Clusters 3 and 4. These positions are typical of the approach volleys, in which players volley when they are transitioning through mid-court, from the back of the court to the net [17]. These types of volleys are often played when players use the serve and volley strategy. The great distance from the net and the low impact height of this type of volley can be a consequence of the increase in the speed of the game and the improvement of the return of serve [15], which makes the execution of these shots extremely difficult. Probably, these are the main reasons why the volley serve strategy, although still frequent, is less used in recent years [11].
Finally, the volleys in Cluster 7 were the least frequent. These shots were played at a great height and at a relatively far distance from the net as compared to the other volleys. These high volleys and overhead smashes usually occur when the opposing team plays a lob. The low frequency of this type of shot may indicate that, although the lob is one of the traditionally recommended strategies to pass to the players at the net [5], its use is infrequent and, when it is played, it is hit with great efficiency, preventing net players from hitting the ball before the bounce.

4.2. Billie Jean King Cup

As hypothesised, fewer clusters were obtained in Billie Jean King Cup doubles matches as compared to the Davis Cup doubles matches. This indicates that there is less variety in volley types in women’s doubles tennis. The fact that women more often choose to stay on the baseline [33] explains that there are fewer net play situations and, therefore, less likelihood of different situations occurring. In addition, previous studies have also found that female teams implement less tactical variants in their game than males [12], which also produces less variety in terms of hitting positions.
The most frequent volleys were those that were grouped in Clusters 1 and 2, which are characterised by being played far from the centre of the court and close to the net. This is a clear difference with respect to the male doubles teams, in which the most frequent volleys were played near the centre of the court. In this case, it seems that the lower speeds of movement of the female players as compared to their male counterparts [24] produce fewer situations in which the players have options to poach efficiently and, therefore, play the volley in areas close to the centre of the court. In addition, these results also justify those found in previous studies in which it was shown that the predominant formation in female teams was the classic one, where the net player is placed in a position that allows her to cover her side of the court (Carboch et al. 2014).
The volleys in Cluster 3 are characterised by being played at low height, far from the net, and near to the centre of the court. This is also a clear difference with respect to the male teams, in which this type of low volley and playing far from the net were grouped in two different clusters, one on each side of the court. The fact that female teams choose to play serve and volley tactics less frequently than male teams [12] may explain why these volleys are not played far from the centre of the court. In addition, since in women’s doubles there are less poaching movements at the net than in the men’s game, teams at the baseline may choose to direct their groundstrokes more to the centre of the court before approaching the net, which will allow them to play with less risks and make it difficult for the volley player to open angles [5].
Finally, the volleys grouped in Cluster 4 were those hit at a great height and at a medium distance from the net. As noted above, these high volleys and overhead shots often occur when the opposing team plays a lob. As it happens in men’s doubles tennis, the low frequency of this type of volley seems to indicate that in women’s doubles tennis the lob is not used frequently to pass the team at the net and, when it is used, it is played very effectively, preventing the net players from hitting the ball before the bounce. This scenario has been extensively described in the coaching literature [34].
From a practical application perspective, these novel and significant findings are extremely important, as for the first time the different types of volleys in doubles tennis have been classified according to the position in which they are executed. Moreover, the differences between men and women have considerable implications for the coaching practice, as notable differences have been found with a clear relationship with the tactics employed. Depending on the characteristics of each player or team, coaches should consider the classification proposed in this article to develop game strategies and plan their training specifically for doubles tennis.

4.3. Limitations of the Study

The analysis carried out in this research focused only on the position in which the volleys were executed. However, this position was not related to other relevant performance indicators for the doubles game, such as the result of the shots or several kinematic variables such as the speed of the players before hitting or the speed of the ball. These indicators are considered to be relevant for the doubles game by practitioners [35]. In future research, these variables could be analysed together, which would provide for a deeper understanding of the tactics employed by the doubles teams at the net. In order to study this, it would be necessary for the database provided by the “Hawk-Eye” system for doubles to be set up to record the position and kinematic variables of the four players. On the other hand, the smaller number of women’s matches that have been accessed has caused a considerable difference in the sample of volleys between both genders.

5. Conclusions

By using ball tracking data, this study profiled men and women’s volley positions in professional doubles tennis matches. A greater variety of volleys was found in the men’s doubles game than in the women’s. Additionally, in men’s doubles, more types of volleys were executed close to the centre of the court, while in the women’s game more volleys were played on the sides of the court. Finally, it was also found that men played a greater number of volleys higher and closer to the net than women. From a tactical point of view, the results obtained in this study indicate that male teams, in general, play at the net more often than women teams, they use the “serve and volley” strategy more often than their female counterparts, and they poach at the net more regularly and play more volleys with the intention of closing the point than the female teams. These original and significant findings not only reinforce the need for specific training, but also identify novel information to be used in practice design by coaching staff. From a methodological perspective, the approach used in this study can be useful for the analysis of other key performance indicators in tennis or other sports.

Author Contributions

The three authors contributed in the same way in all the sections. All authors have read and agreed to the published version of the manuscript.

Funding

This work was supported by the International Tennis Federation (Project: “Notational analysis in doubles tennis”).

Acknowledgments

The authors wish to acknowledge the contributions of the International Tennis Federation’s Development Department. The authors would like to thank Jaime Sampaio for his selfless advice and collaboration.

Conflicts of Interest

The authors declare no conflict of interest.

References

  1. Zhang, S.; Lorenzo, A.; Gómez, M.A.; Mateus, N.; Gonçalves, B.; Sampaio, J. Clustering performances in the NBA according to players’ anthropometric attributes and playing experience. J. Sports Sci. 2018, 36, 2511–2520. [Google Scholar] [CrossRef]
  2. Cui, Y.; Gómez, M.Á.; Gonçalves, B.; Sampaio, J. Clustering tennis players’ anthropometric and individual features helps to reveal performance fingerprints. Eur. J. Sport Sci. 2019, 19, 1032–1044. [Google Scholar] [CrossRef] [PubMed]
  3. Martínez-Gallego, R.; Vives, F.; Guzmán, J.F.; Ramón-Llin, J.; Crespo, M. Time structure in men’s professional doubles tennis: Does team experience allow finishing the points faster? Int. J. Perf. Anal. Sport 2021, 1–10. [Google Scholar] [CrossRef]
  4. Kočíb, T.; Carboch, J.; Cabela, M.; Kresta, J. Tactics in tennis doubles: Analysis of the formations used by the serving and receiving teams. Int. J. Phys. Educ. Fit. Sports 2020, 9, 45–50. [Google Scholar] [CrossRef]
  5. Crespo, M.; Miley, D. Advanced Coaches Manual; International Tennis Federation: London, UK, 1997. [Google Scholar]
  6. Blickensderfer, E.L.; Reynolds, R.; Salas, E.; Cannon-Bowers, J.A. Shared expectations and implicit coordination in tennis doubles teams. J. Appl. Sport Psychol. 2010, 22, 486–499. [Google Scholar] [CrossRef]
  7. Lausic, D.; Tennebaum, G.; Eccles, D.; Jeong, A.; Johnson, T. Intrateam communication and performance in doubles tennis. Res. Q. Exerc. Sport 2009, 80, 281–290. [Google Scholar] [CrossRef]
  8. Lausic, D.; Razon, S.; Tenenbaum, G. Nonverbal sensitivity, verbal communication, and team coordination in tennis doubles. Int. J. Sport Exerc. Psychol. 2014, 13, 398–414. [Google Scholar] [CrossRef]
  9. Garay Plaza, J.O.; Hernández Mendo, A. Análisis de la calidad del dato en el tenis de dobles. Rev. Psicol. Deporte 2006, 15, 279–294. [Google Scholar]
  10. Martiínez-Gallego, R.; Crespo, M.; Ramón-Llin, J.; Micó, S.; Guzmán, J.F. Men’s doubles professional tennis on hard courts: Game structure and point ending characteristics. J. Hum. Sport Exerc. 2020, 15, 633–642. [Google Scholar] [CrossRef]
  11. Black, W.; Van de Braam, M. The modern game of doubles: A tactical perspective. Coach Sport Sci. Rev. 2012, 56, 13–15. [Google Scholar]
  12. Carboch, J.; Kocib, T.; Pechacova, M. Analysis of tactical variants in men’s and women’s tennis doubles on the international level. Asian J. Sci. Tech. 2014, 5, 204–207. [Google Scholar]
  13. Brabenec, J. Improving Your Tennis: Double Your Fun by Playing Smart Doubles; Tenisall Inc.: Vancouver, BC, Canada, 1997. [Google Scholar]
  14. Braden, V.; Burns, B. Laugh and Win at Doubles; Little, Brown C.: Boston, MA, USA, 1996. [Google Scholar]
  15. Cayer, L. Doubles Tennis Tactics; Human Kinetics: Champaign, IL, USA, 2004. [Google Scholar]
  16. Perlstein, S. Winning Doubles; The Lyons Press: New York, NY, USA, 1995. [Google Scholar]
  17. Singleton, S. Intelligent Doubles; Betterway Publ.: Crozet, VA, USA, 1989. [Google Scholar]
  18. Talbert, W.F.; Old, B.S. The Game of Doubles in Tennis; Gollancz: London, UK, 1957. [Google Scholar]
  19. Carboch, J.; Kočíb, T. A comparison of service efficiency between players of male and female doubles at professional tennis tournaments. Auc Kinanthropol. 2016, 51, 56–62. [Google Scholar] [CrossRef] [Green Version]
  20. Martínez-Gallego, R.; Crespo, M.; Jiménez, J. Analysis of the differences in serve effectiveness between Billie Jean King Cup (former Fed Cup) and Davis Cup doubles tennis matches. Int. J. Sports Sci. Coach 2021. [Google Scholar] [CrossRef]
  21. Martínez-Gallego, R.; Guzmán, J.F.; James, N.; Pers, J.; Ramón-Llin, J.; Vuckovic, G. Movement characteristics of elite tennis players on hard courts with respect to the direction of ground strokes. J. Sports Sci. Med. 2013, 12, 275. [Google Scholar] [PubMed]
  22. Martínez-Gallego, R.; Guzmán, J.F.; Crespo, M.; Ramón-Llin, J.; Vučković, G. Technical, tactical and movement analysis of men's professional tennis on hard courts. J. Sports Med. Phys. Fitness 2018, 59, 50–56. [Google Scholar] [CrossRef]
  23. Mecheri, S.; Rioult, F.; Mantel, B.; Kauffmann, F.; Benguigui, N. The serve impact in tennis: First large-scale study of big Hawk-Eye data. Statistical Analysis and Data Mining. ASA Data Sci. J. 2016, 9, 310–325. [Google Scholar] [CrossRef]
  24. Reid, M.; Morgan, S.; Whiteside, D. Matchplay characteristics of Grand Slam tennis: Implications for training and conditioning. J. Sports Sci. 2016, 34, 1791–1798. [Google Scholar] [CrossRef]
  25. Kovalchik, S.; Reid, M. Comparing matchplay characteristics and physical demands of junior and professional tennis athletes in the era of Big Data. J. Sports Sci. Med. 2017, 16, 489–497. [Google Scholar] [PubMed]
  26. Whiteside, D.; Reid, M. Spatial characteristics of professional tennis serves with implications for serving aces: A machine learning approach. J. Sports Sci. 2016, 35, 648–654. [Google Scholar] [CrossRef]
  27. Hawk-Eye Innovations. Hawk-Eye’s Accuracy and Reliability: Electronic Line Calling [Pamphlet]; Hawk-Eye Innovations: Basingstoke, UK, 2015. [Google Scholar]
  28. Hartigan, J.A.; Wong, M.A. Algorithm AS 136: A K-Means Clustering Algorithm. J. Appl. Stat. 1979, 28, 100. [Google Scholar] [CrossRef]
  29. Sampaio, J.; McGarry, T.; Calleja-González, J.; Jiménez Sáiz, S.; Schelling i del Alcázar, X.; Balciunas, M. Exploring Game Performance in the National Basketball Association Using Player Tracking Data. PLoS ONE 2015, 10, e0132894. [Google Scholar] [CrossRef] [PubMed] [Green Version]
  30. Sampaio, J.; Lago, C.; Casais, L.; Leite, N. Effects of starting score-line, game location, and quality of opposition in basketball quarter score. Eur. J. Sport Sci. 2010, 10, 391–396. [Google Scholar] [CrossRef]
  31. Tibshirani, R.; Walther, G.; Hastie, T. Estimating the number of clusters in a data set via the gap statistic. J. R. Stat. Soc. Ser. D Stat. Ser. B 2001, 63, 411–423. [Google Scholar] [CrossRef]
  32. Cohen, J. Statistical Power Analysis for the Behavioral Sciences; Lawrence Earlbaum Associates: New York, NY, USA, 1988. [Google Scholar]
  33. Antoun, R. Women’s Tennis Tactics; Human Kinetics: Champaign, IL, USA, 2007. [Google Scholar]
  34. Blaskower, P. The Art of Doubles: Winning Tennis Strategies and Drills; Krause Publications: Wisconsin, WI, USA, 2007. [Google Scholar]
  35. Breznik, K. Revealing the best doubles teams and players in tennis history. Int. J. Perf. Anal. Sport 2015, 15, 1213–1226. [Google Scholar] [CrossRef]
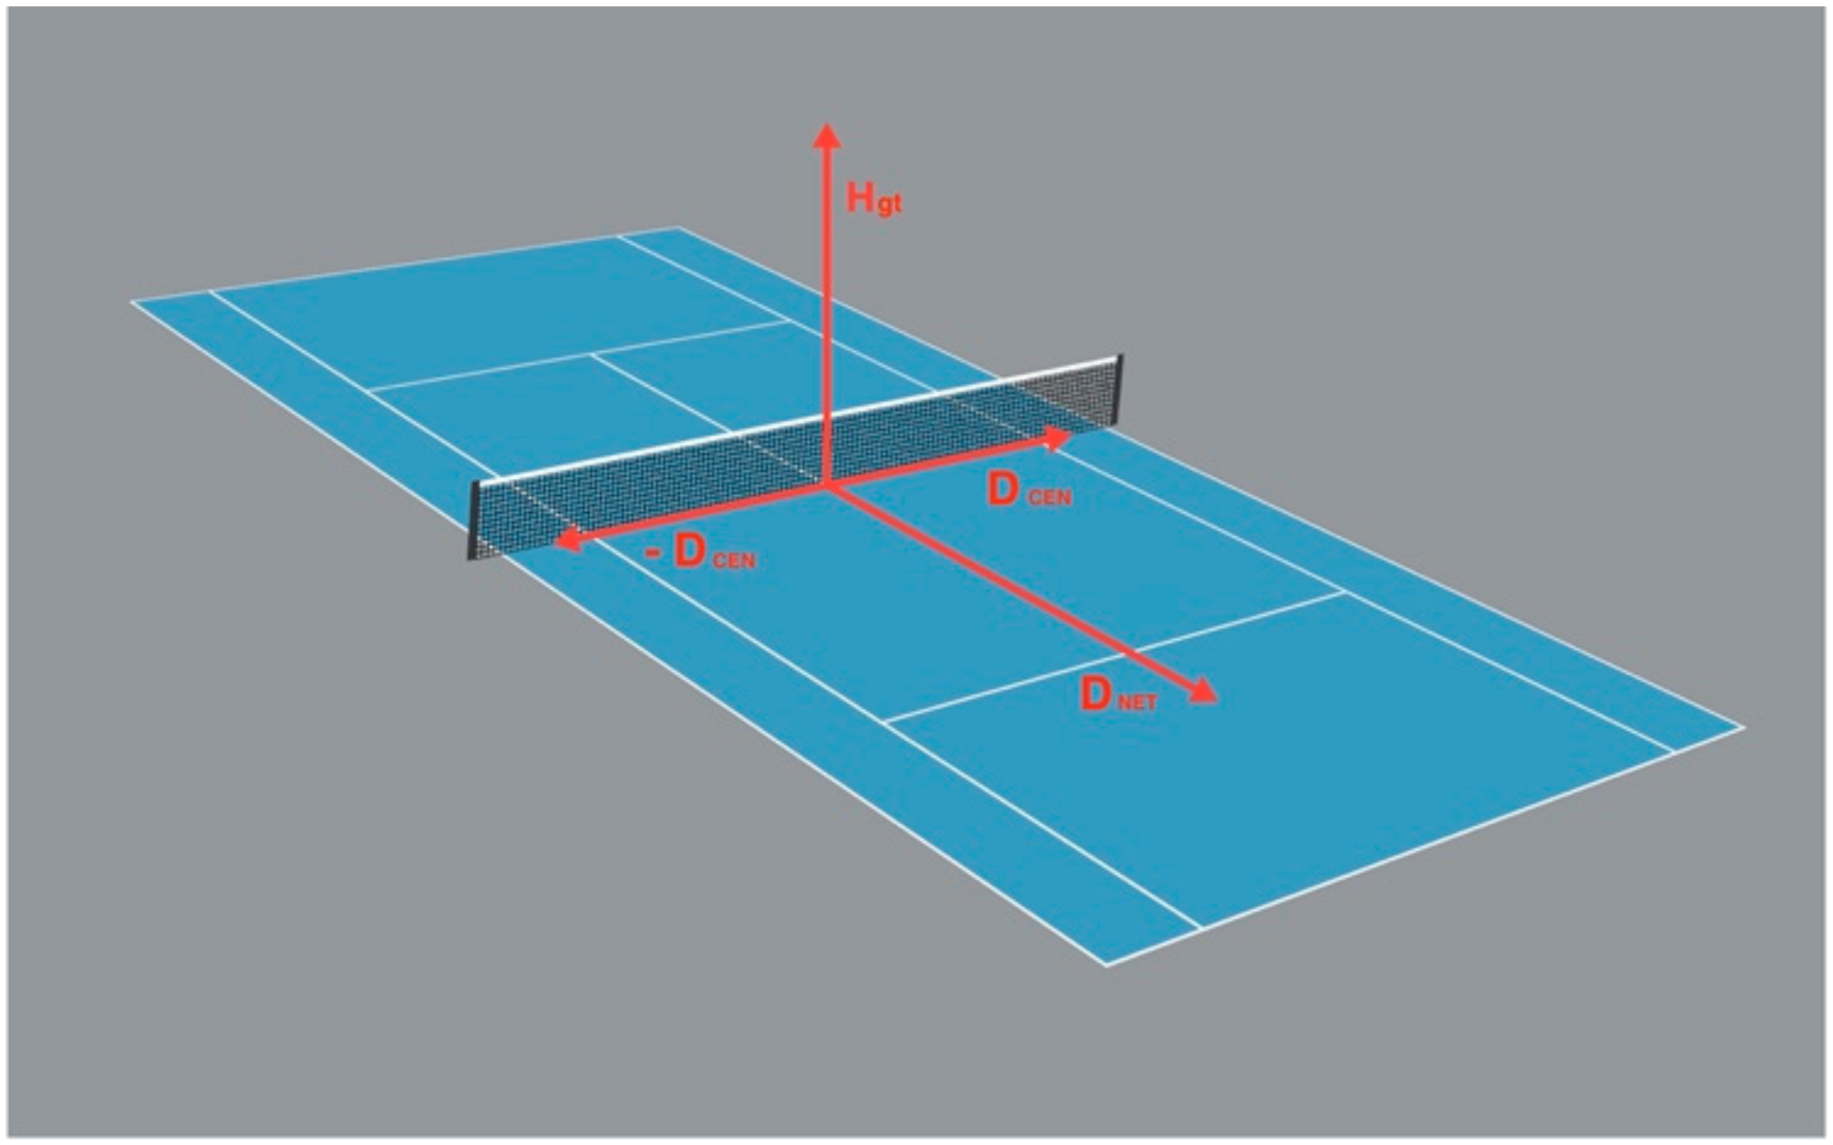
Figure 1. Distance to the net (DNET), distance to the centre of the court (DCEN) and impact height (Hgt).
Sustainability 13 06370 g001
Figure 2. Men’s volley locations grouped by clusters.
Sustainability 13 06370 g002
Figure 3. Women’s volley locations grouped by clusters.
Sustainability 13 06370 g003
Table 1. Men’s volley location variables according to the cluster solutions.
Cluster
1234567
Mean (SD)Mean (SD)Mean (SD)Mean (SD)Mean (SD)Mean (SD)Mean (SD)pη2
DNET (m)3.13 (1.08) *1.70 (0.83) *2.71 (1.01) *2.81 (1.06) *6.33 (1.03) *6.18 (1.08) *5.80 (1.59) *<0.010.72
DCEN (m)−0.04 (0.84) *0.22 (1.31) ^2.85 (0.96) *−2.86 (0.98) *−2.23 (1.08) *2.44 (1.08) *0.28 (2.04) ^<0.010.77
Hgt (m)1.03 (0.28) *1.97 (0.39) *1.25 (0.34) $1.29 (0.36) $0.73 (0.38) +0.74 (0.39) +2.54 (0.41) *<0.010.63
* Significant differences between all the clusters (p < 0.01); ^ Non-significant differences between Cluster 2 and Cluster 7; + Non-significant differences between Cluster 5 and Cluster 6; $ Non-significant differences between Cluster 3 and Cluster 4.
Table 2. Women’s volley location variables according to the cluster solutions.
Cluster
1234
Mean (SD)Mean (SD)Mean (SD)Mean (SD)pη2
DNET2.65 (1.02) *2.90 (1.07) *6.13 (1.38) *4.10 (2.96) *<0.010.48
DCEN−1.65 (1.38) *2.25 (1.25) *0.05 (2.00) *0.29 (1.79) *<0.010.52
Hgt1.27 (0.37) *1.19 (0.36) *0.80 (0.42) *2.28 (0.31) *<0.010.51
* Significant differences between all the clusters (p< 0.01).
Publisher’s Note: MDPI stays neutral with regard to jurisdictional claims in published maps and institutional affiliations.