Review

A Systematic Review Comparing Urban Flood Management Practices in India to China’s Sponge City Program

1
State Key Laboratory of Hydroscience and Hydraulic Engineering, Tsinghua University, Beijing 100084, China
2
State Key Joint Laboratory of Environmental Simulation and Pollution Control, School of Environment, Tsinghua University, Beijing 100084, China
3
Department of Civil Engineering, Indian Institute of Technology (BHU), Varanasi 221005, Uttar Pradesh, India
*
Author to whom correspondence should be addressed.
Sustainability 2021, 13(11), 6346; https://doi.org/10.3390/su13116346
Submission received: 10 April 2021 / Revised: 17 May 2021 / Accepted: 31 May 2021 / Published: 3 June 2021
(This article belongs to the Section Environmental Sustainability and Applications)

Abstract

:
India and China are among the two most populous countries in the world that concomitantly incur substantial flood-related losses, and both countries are also experiencing rapid urbanization. This study was conducted to trace the major urban flooding cases in these countries between 2014 and 2020 and probe into their existing flood mitigation policies with special focus on China’s Sponge City Program (SCP). A systematic review using preferred reporting items for systematic review and meta-analysis protocols (PRISMA) was conducted. Results showed that both these countries experienced comparable challenges in terms of the need for localized low impact development (LID) planning given their extensive geographically induced diversities. Improved inter-governmental and inter-agential coordination, new avenues of funding involving public and private enterprises with accommodations to source local products and services to boost local economies, improved practical and technical understanding for working professionals and improved community acceptance and participation are also recommended. It is concluded that India should try to focus on holistic urban water resilience as China does with its Sponge City Program and that China should take a cue from India’s contractual and tender-based private service sourcing methods to tide over its financial setbacks in order to achieve its ambitious targets for 2030.

1. Introduction

One third of the earth’s area is susceptible to flooding affecting 82% of the world’s humans [1]. Globally 104 billion USD per year is spent on flood damage and related losses [2] with 95% of all extreme event-related deaths occurring in developing countries [3]. Floods are the most frequent natural disasters affecting urban areas worldwide and their effects are exacerbated in developing countries due to socioeconomic disparities, poorly developed infrastructure, unplanned change in land-use patterns, changing climatic conditions, inadequate flood mitigation systems and heightened speeds of urbanization [3,4].
Currently, 55% of the global population lives in cities and this number is predicted to reach 68% by 2050 according to a UN estimate, with most of these migrations touted to occur in Asian and African countries [5]. This kind of migration tends to lead to unsustainable urban expansion resulting in flash floods from precipitation that are further accentuated by climate change and other influencing factors. Flooding is caused by a synergic effect of rainfall, drainage capacities and urbanization because urbanization not only increases runoff due to increased imperviousness, but also lowers infiltration through seepage to groundwater tables [6].
The International Panel on Climate Change (IPCC) stated that Asia will continue to be affected by floods in the future. Overall, 52% of Indians are predicted to live in cities by 2050 and, as per IPCC reports, the area and intensity of flooding events are expected to increase in the country [5]. Even though there has not been an increase in the annual mean rainfall received in India, the number of flooding events are observed to be on a constant rise [7]. China incurs an annual cost amounting to 1% of its annual gross domestic product (GDP) due to floods [8] with yearly floods occurring in Beijing, Shanghai, Tianjin, Chongqing, Guangzhou, Shenzhen, Wuhan, Nanjing, Hangzhou, Changsha, Shijiazhuang and Shenyang [9]. China experiences the highest socioeconomic losses due to flooding followed by the United States of America and India, which also impedes global supply chains given the market dominance of these countries [2].
This study aims to trace the major urban flood cases between 2014 to 2020 in Indian and Chinese cities and explore their policies and management strategies related to urban flooding with special focus on China’s Sponge City Program. This comparative analysis compile information on how these policies can be improved in their respective countries and investigates the suitability of implementing sponge city policies and LID elements in handling urban floods while aiming for holistic urban water management. The authors have identified major bottlenecks in the countries’ respective flood mitigation practices and suggestions for future action are included.

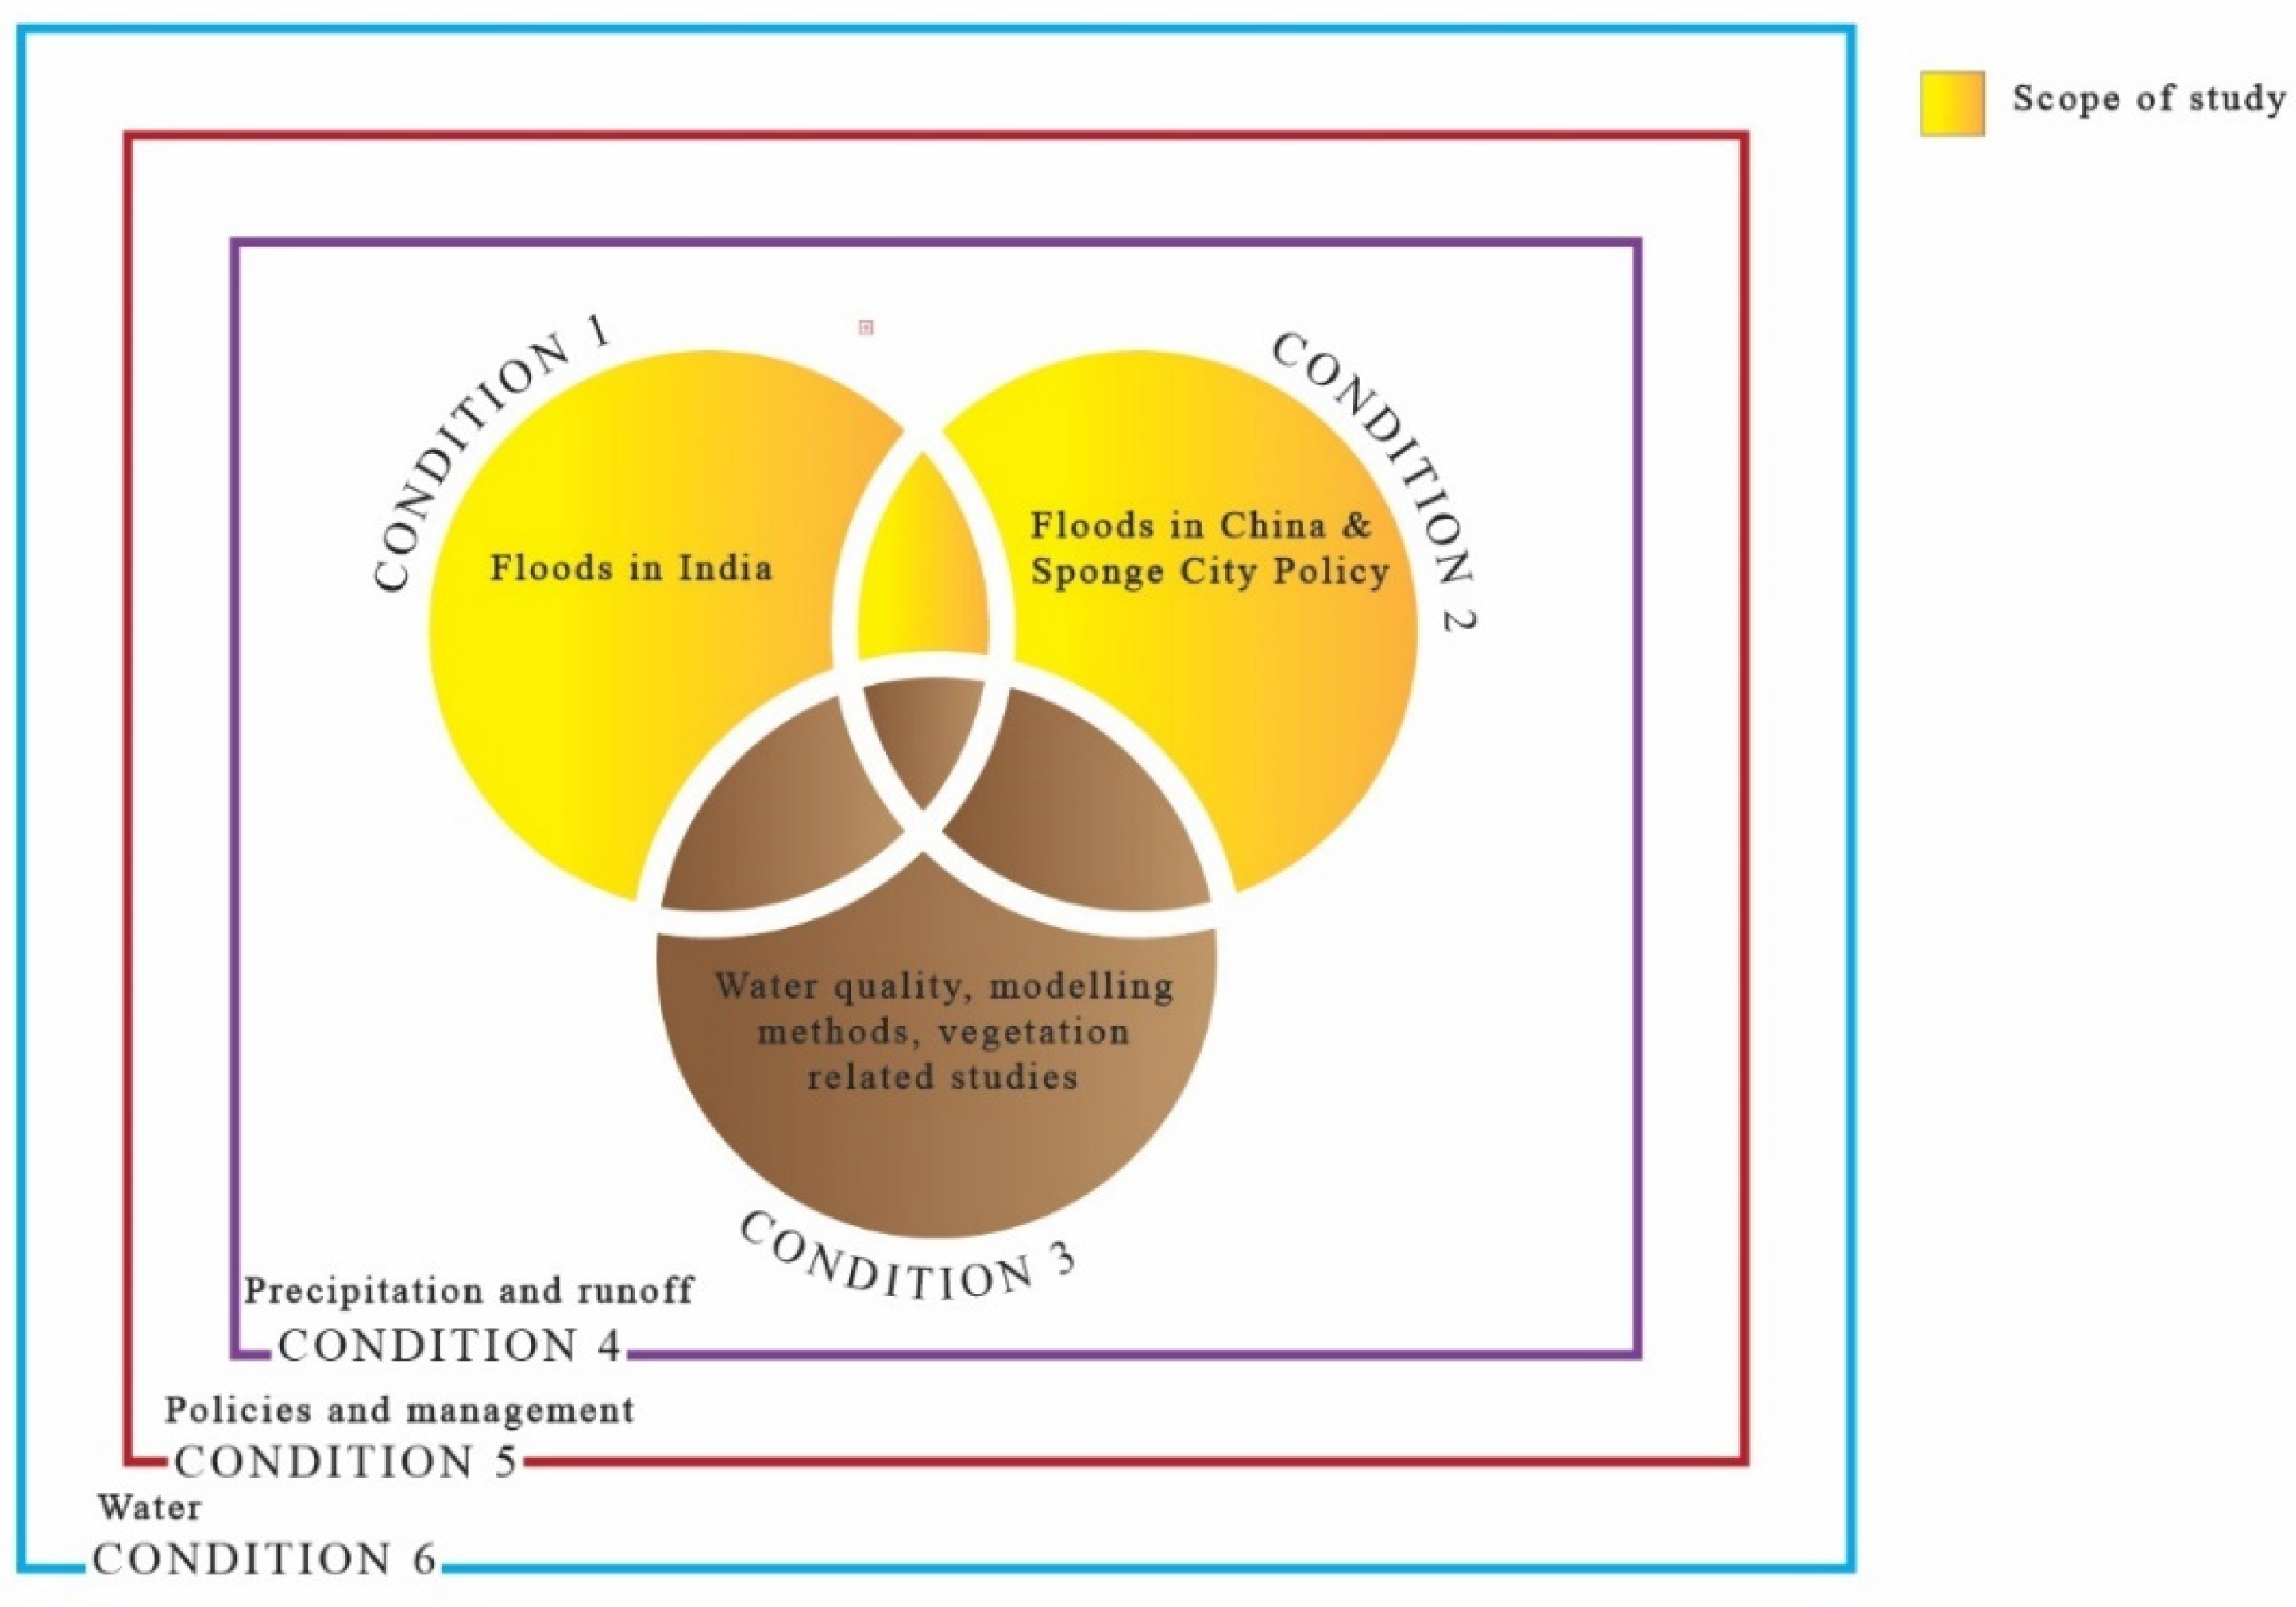
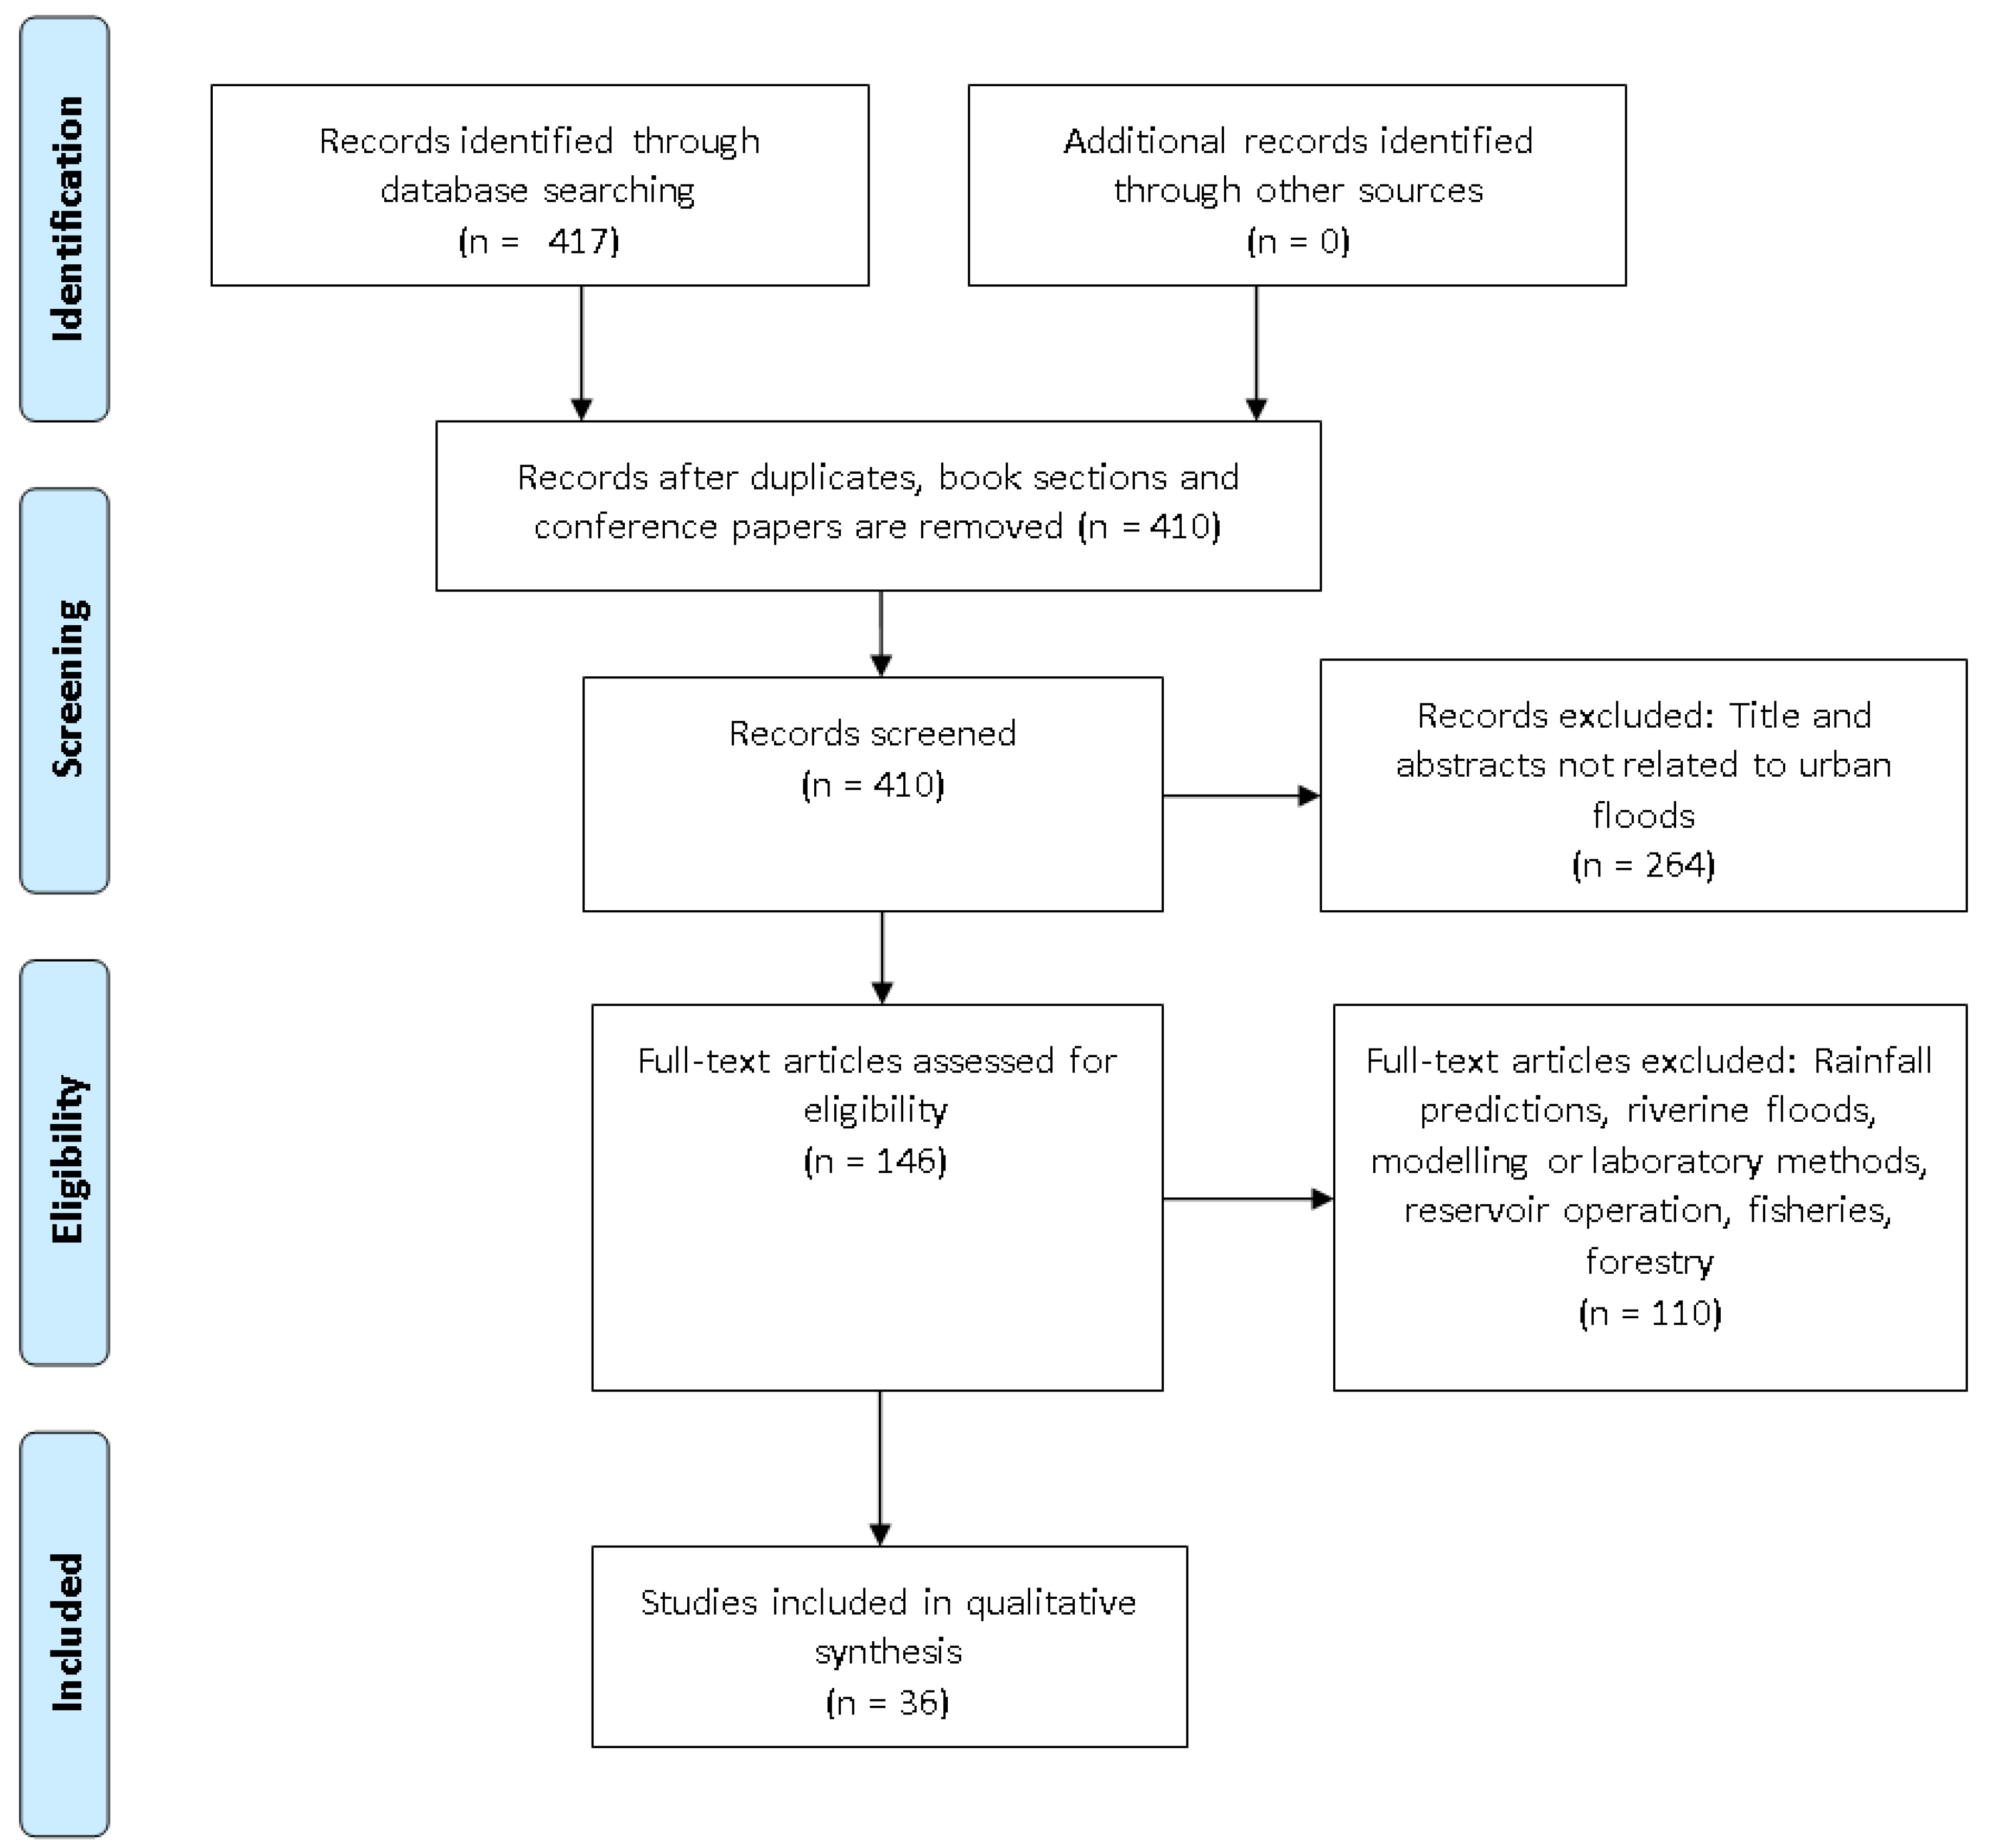
2. Systematic Review Methodology

A systematic review was conducted using the preferred reporting items for systematic review and meta-analysis protocols (PRISMA-P) 2015 checklist [10] to create objective and reproducible results. This study used web of science as the sole database for the literature search using a variety of search strings and Boolean operators to procure results as close to the scope of this review as possible. The search was conducted on 21 February 2021 and the results were refined to include studies between 2014 and 2020 only to assess the most recent urban flood cases and management strategies in India and China. The year 2014 was chosen as the starting point of this study’s literature review because it was the year of inception of China’s Sponge City Program, the transboundary applicability of whose elements forms the crux of this research. The search string results were further refined to include only peer-reviewed journal articles in the English language.
Figure 1 depicts a conceptual framework of the queries used in this review and Table 1 lists the exact search strings used for each of these conditions and the number of results obtained as of 21 February 2021. Searches were made to check for the presence of keywords in the title, abstract and author keywords and included results in which the keywords were present in either one of the following three locations. In order to find literature pertaining to urban flooding in India and China, condition #1 was allocated to track floods in India and included keywords of cities where urban floods occurred between the study period of 2014 and 2020. Condition #2 focused on floods in China and sponge cities and included the pertaining keywords. After combining the results of condition #1 and condition #2, 1782 results were obtained. In a bid to eliminate results that were beyond the scope of urban flooding case studies, condition #3 was created to include keywords pertaining to water quality assessments, hydrologic modeling methods and vegetation-related studies, and the Boolean operator “NOT” was used to eliminate these articles from the results obtained by combining condition #1 and condition #2. Condition #4 included keywords specifying precipitation, runoff-related urban waterlogging and floods, which were combined with the previous search results using the Boolean operator “AND” to niche down the results. Condition #5 included keywords focusing on policies, management and case studies to drive towards the disaster-handling strategies of India and China and to help pitch the sponge city concept against its contemporaries during the analysis. Condition #5 was also combined with the previous results using the “AND” operator. Finally, condition #6 was drafted to include the keyword water in either the title, abstract or author keyword of the results obtained in the proceeding search by combining the results using the “AND” operator. This search methodology yielded 417 results that were related to water and its management policies or case studies, especially in the areas of precipitation-related runoffs in the cities of India and China excluding studies focusing on water quality, vegetation-related studies or hydraulic modeling of imaginary floods in cities that had not experienced urban floods in the last 7 years. All 417 articles were imported to a new endnote library and full texts were obtained using access granted by Tsinghua University.
Figure 2 depicts the PRISMA flowchart with inclusion and exclusion criteria for filtering the results of the database search. Among the 417 results obtained, 1 duplicate and 6 non-journal articles (either conference papers or book sections) were present. A manual screening process was undertaken at this stage with 410 results and 264 articles whose titles and abstracts that were not related to urban flooding studies were excluded.
The 146 articles shortlisted were manually screened by reading the full texts, of which the 110 revolving primarily around rainfall predictions, riverine floods, reservoir operations, fisheries and forestry were excluded. Detailed notes of exclusion and inclusion criteria are available from the authors on request.

3. Major Precipitation-Related Flood Events in India and China

3.1. Floods in India

This section enlists recent flood events in Indian cities and traces the events leading to them. Table 2 provides an exhaustive list of urban flooding disaster-related information in Indian and Chinese cities between 2014 and 2020.

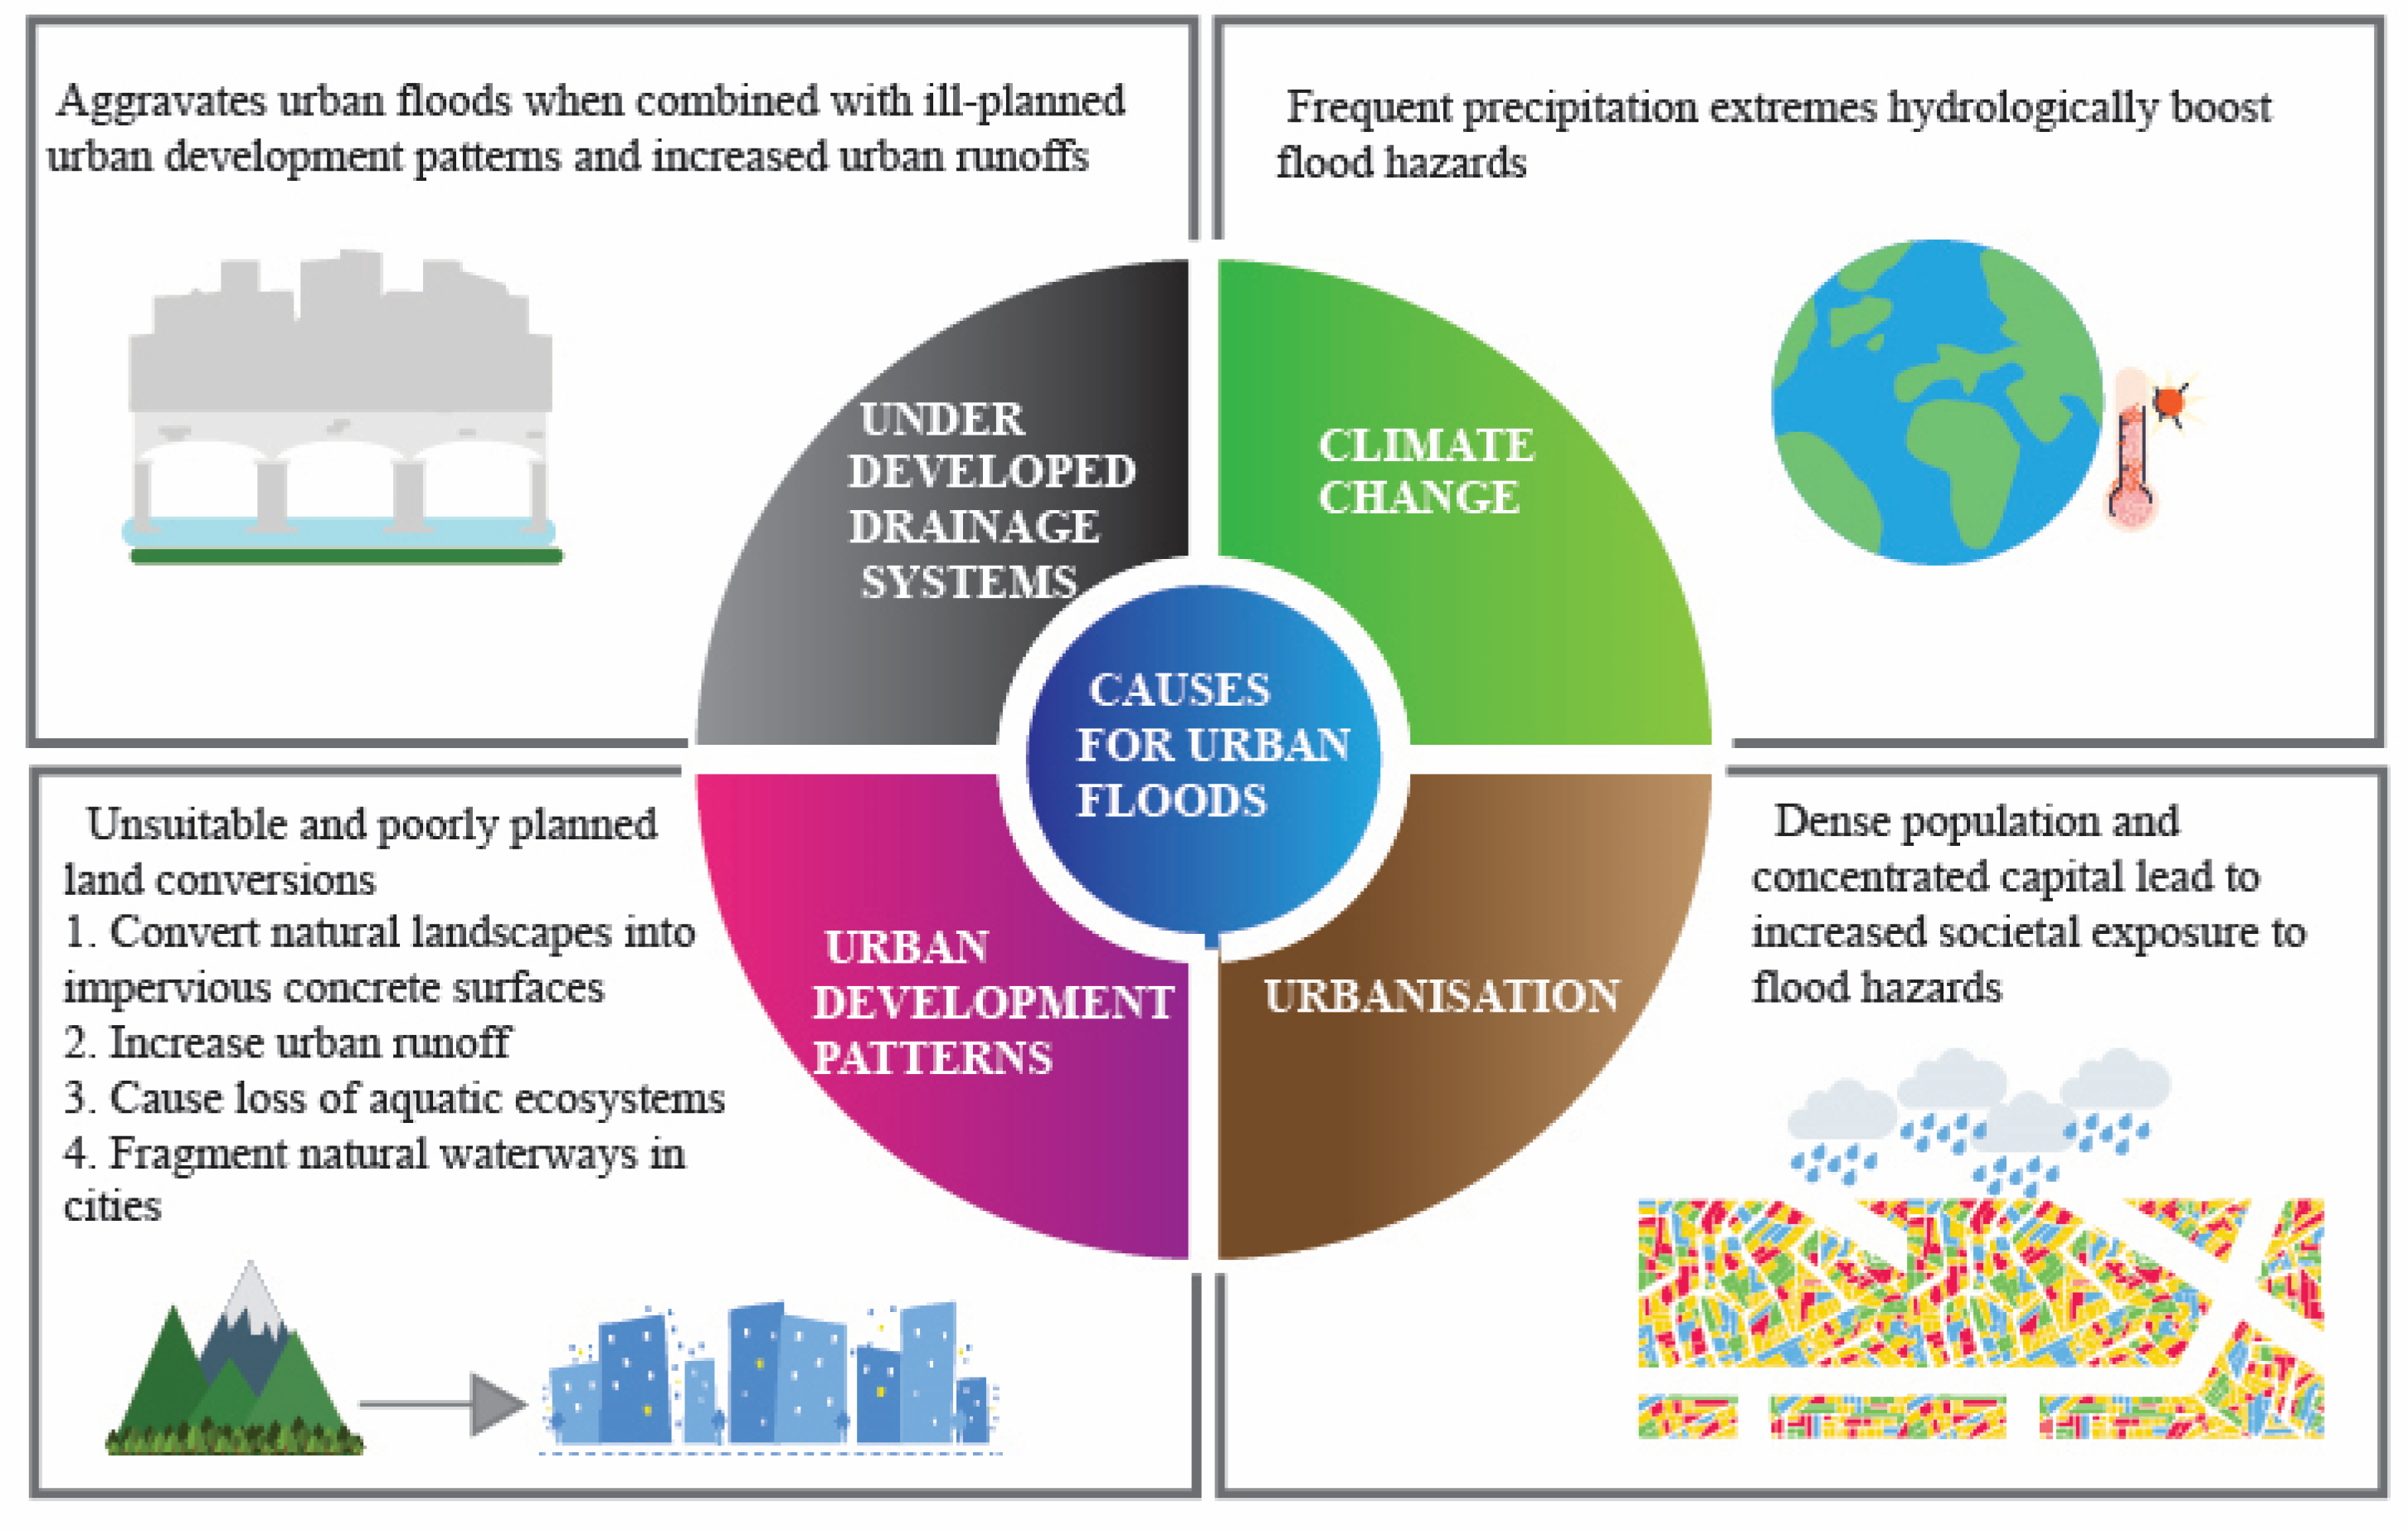
3.1.1. Causes of Floods

Several coastal mega cities around the world experience disasters owing to global warming and climate change including ocean acidification, frequent torrential rainfall events and short spell high-intensity precipitation [20]. The coastal city of Chennai is one of the four major metropolitan cities in India and is affected by frequent floods during the monsoon season due to its low elevation terrain, inadequate storm drains and encroached flood cushions like rivers, tanks and canals. Chennai receives an annual rainfall of 1400 mm of which 800 mm is during the northeast monsoon season. The Adyar flows through the city and its basins, consisting of 163 tanks, act as permanent water retention structures, whose surplus during heavy rainfall events discharges into the river. Currently, 15% of the storage capacity from these tanks is lost to siltation, encroachment and disuse, which, coupled with loss of the city’s floodplains, rivers and wetlands due to urbanization, has significantly altered the peak flows during rainfall events, thereby resulting in urban floods. In the last two decades, the Chennai Metropolitan Area was victim to a moderate one in 50-year flood in 2005 and an extreme one in 100-year flood in 2015, and these numbers are predicted to worsen as the city’s population is expected to touch 10 million by 2025 [3].
The southern state of Kerala experienced heavy rainfall on several days between July and August of 2018, accounting for a 1600 mm cumulatively recorded rainfall during this period, which is 56% above the usual rainfall rates. The situation was aggravated on 14 and 15 August when the rainfall rates spiked up to 300 mm in few areas and the state’s maximum average rainfall was 200 mm, which resulted in massive floods [12]. Kumar and Pradhan [14] point out that because the dams reached their maximum capacities during the week-long heavy rainfall prior to the actual flooding, the release of water from dams combined with the ongoing high precipitation accentuated the onset of the worst flooding event in the history of Kerala, which was further amplified by the water surges’ infliction on low-lying areas due to monsoonal winds.
On 23 September 2016, the city of Hyderabad in the present-day Telangana State of India experienced an extreme rainfall event of 165 mm resulting in urban flooding. The major reason was the 50% to 100% limitation in the carrying capacity of the city’s existing stormwater drains in 4 of its 15 zones, which resulted in a cumulative runoff volume of 8083 m3/h and an average flood depth of 0.5 m due to the overflowing of 306 stormwater drains [17].
Unprecedented heavy to extremely heavy rainfall (>24.5 cm) occurred in the state of Uttarakhand between 16 and 18 June 2016. This was due to the mid-air collision of the mid-tropospheric westerlies with the lower-tropospheric southern monsoon, which travelled northward one month earlier than its usual date of 15 July [21]. Though this resulted in floods in Himachal Pradesh, Haryana, Delhi and Uttar Pradesh in India, and heavy to very heavy rainfall in her neighbors Nepal and Tibet, 95% of all causalities from this event were borne by the state of Uttarakhand [23]. Uttarakhand receives 90% of its annual rainfall from the southwest monsoon, which shifted southward during the incident, resulting in a rainfall increment of 375% compared to the highest monsoon rainfall rate recorded in this region. The speed of progression of the southwest monsoon was the fastest since 1941 and covered the entire country in 15 days as opposed to its regular time of 45 days since its onset in the southern state of Kerala [7]. The situation worsened when the upper tributaries of the Ganga and Yamuna rivers breached causing riverine and flash flooding, landslides and loss of human lives and economic assets. Ziegler, Wasson [22] explained that the extent of the tragedy was amplified as it coincided with the peak pilgrimage season of the Chardham Yatra, affecting more than 100,000 pilgrims who were on their way to the temple town of Kedarnath. Kedarnath is located above the Mandakani river whose catchment received 600 mm of rainfall over 3 days during this period, which triggered landslide lake outburst floods (LLOF) in the upper slopes of Kedarnath. Debris flowed from this LLOF into the Mandakani river creating a temporary lake due to the damming effect and breached as a lake flood into the Kedarnath region above it. Thus, a major collision of LLOFs and lake floods occurred in Kedarnath claiming the lives of thousands.
Srinagar, which is the largest and fastest growing city in the Himalayan region in terms of population and area, has flood records dating from back to 3000 B.C. and simulations of present-day annual peak flows predict increased flood occurrences in the future as well [1].
The city of Surat receives an annual rainfall of 1376 mm, which ends up resulting in heavy output of water from the Tapi river-fed Ukai dam, causing urban floods with the most disastrous being the ones in 1968 and 2006 [24].

3.1.2. Studies and Findings

Vemula, Raju [17] studied the impacts of past and future extreme rainfall events on the existing stormwater networks in the city of Hyderabad under a flood risk analysis. Results showed that rainfall events of 165 mm, similar to what occurred in September 2016, will affect a maximum population of 1.8 million with a 9% to 24% flood risk. Flood risk is subject to the amount of rainfall, height of inundation and economic worth of assets in the flood zones. They predict that the next extreme rainfall event of 282 mm will occur in 2040 based on the global climate model (GCM). This event is estimated to affect a maximum of 2.7 million people and cause a 10%–30% flood risk, and result in an 82% runoff under the current stormwater networks’ capacity.
Studies by Kotal, Sen Roy [21] analyzed the dynamical and thermodynamical aspects of the Uttarakhand floods to understand the weather patterns behind this disaster. Reports state that the frequency of extreme rainfall events in the Himalayan region has been on a rise over the last 40 years, which can be attributed to global warming-induced increased monsoonal intensity.
Ziegler, Wasson [22] investigated the political economy and disaster perception through a geoscientific study of the Uttarakhand floods in Kedarnath with a view to improve predictability and warning for future events. They raise concerns with respect to the coarse sediments, debris and boulders deposited from the 2400 landslides that occurred in this region during the 2013 floods, which further reduced the carrying capacity of the river channels making them more flood prone than before. The fact that this region has experienced more than 12 flash floods from LLOFs in the last 800 years shows that this is a recurring problem that needs to be acknowledged by environmentalists and decision makers. However, the return period of such disasters is still unknown due to the absence of trustworthy long-term gauged flow data files. They also critique the tight public funds and inadequate information on disaster-proofing existing infrastructures in India, which has resulted in a “gambling” approach towards disaster prediction as governments fear criticism in what may be viewed as overinvestments in disaster mitigation. Post event compensations in the form of governmental aids are preferred with disaster management concerns, iterating that the next such event might never occur or at least not occur in the near future.
Alam, Bhat [1] assessed the flood risk in Srinagar using a risk triangle model considering hazard intensity, spatial exposure and vulnerability and found that 46% of the city was high on risk, 17% percent of it was at moderate risk and 37% of it was low on risk, implying that the same flood will have different impacts in different parts of the city.
Waghwala and Agnihotri [24] studied the impacts of urbanization and land-use changes on urban flooding in the city of Surat in Gujarat. They found that the average flood depth and area of inundation of the more recent 2006 floods were higher than that of the 1968 event and attributed this phenomenon to the shift of the land-use land-cover (LULC) changes of the city from a lesser urbanized one to a highly urbanized one through unplanned urban sprawling. This research proved that an increase in urbanization directly increases flooding risks, which are further amplified by the nature of urbanization as in the case of Surat, where natural floodplains were artificially infilled to create increased land areas, thereby further reducing natural flow drains and sinks and aggravating flooding risks. They propose constructing 20 detention ponds on either side of the Tapi river for flood diversion, which can lower the flood depth by 50% in the city. Nithila Devi, Sridharan [3] studied the role of small retention structures in future floods in Chennai and predicted that dredging all 163 tanks in the Adayar basin by 2 m can compensate for the increase in flooding due to urbanization in 2050, for a one in 50-year flood like the one in 2005. However, if tanks continue disappearing, the same flood will have the impact of a one in 100-year flood event like the one in 2015.
Jameson [4] emphasizes on the importance of adopting an integrated water resources management approach to flood management, not just in terms of improving stormwater drainage in low-lying areas, but also focusing on other aspects like rainwater harvesting, and identifying and utilizing natural sinks and marshlands to provide groundwater surcharge to achieve holistic water security and disaster mitigation. He calls for cross-institutional knowledge transfer of water management technologies, integrating rainwater harvesting with flood management towards dealing with these issues cumulatively and bringing about policies that affect practice.
Ramasamy, Gunasekaran [13] researched the possibility of flood events triggering reservoir-induced seismicity in Kerala since 43 of its dams are located along the seismically active Western Ghats mountain range, which also coincides with the areas of flood inundation. The varying pulses of high stresses from the earth’s crust due to high water depth in the reservoir and stresses from pore pressure from infiltration can result in RIS. Though 50% of these dams were prone to experiencing this risk as per these study results, such an earthquake was avoided during the 2018 Kerala flooding because the reservoir’s water height was lowered by discharging water.
A case study by Ryan, Trigg [15] on the management of Kerala’s Kakki reservoir showed that the peak flow could have been reduced to 50 m3/s from the experienced 493 m3/s during the floods on 14 August when the rainfall rate was highest through optimized reservoir operations in terms of saving sufficient storage for flood absorption and utilizing flood control zones.
Avashia and Garg [5] studied the implications of land-use planning in 42 Indian cities and found that the reduction in green, blue and open spaces directly increases flood risks, thereby negatively impacting the economy of the city and life quality of its inhabitants. Results showed that if lower-tier cities continue developing as per the trends set by the current high-tier cities, flooding risks will be exacerbated. To control this situation, Indian cities should incorporate and preserve sponge facilities in city planning. If such structural efforts are not possible, the only alternative is working towards keeping the global mean temperature increase well below 2 °C to avoid devastating consequences, though this cannot be controlled by India alone.

3.1.3. Recommendations for Flood Management

Vemula, Raju [17] recommend desilting of existing stormwater drains in Hyderabad to achieve a 100% improvement to the runoff situation for the predicted 2040 extreme rainfall event of 282 mm. For future events of higher rainfall extremities, it is essential to double the existing carrying capacity of the stormwater networks through widening, building and maintaining channels in addition to incorporating other low impact development (LID) and best management practices (BMP). Nithila Devi, Sridharan [3] mention that the state government of Tamil Nadu, where the city of Chennai is located, promotes reinitiating traditional community maintenance measures such as desilting tanks and weeding prior to monsoons to maximize the utilities of these structures. They also emphasize on the importance of arming tanks and storage units in flood-prone areas with flood gates to regulate their available water-storing capacities on the basis of live flood predictions.
Kotal, Sen Roy [21] stated that the complexity of rainfall prediction in the high-altitude Himalayan regions of India is amplified because of limited data, understanding and interaction between orography and weather systems. Xavier, Manoj [7] blame inadequacies in data observation and modeling constraints for the failure in predicting extreme weather events. Comprehensive modeling studies of extreme events associated with the Indian monsoon and its interactions with localized weather systems would help in disaster preparation and in setting up adequate infrastructural risk mitigation measures. Shekhar, Pattanayak [23] list out the problems in numerically simulating heavy rainfall events in mountainous terrains to the lack of high-resolution meteorological data and upper atmospheric profile data. Relying on remote sensing options for these data is challenged by the high temporal and spatial resolutions required to record the required parameters for such occurrences. Mishra and Nagaraju [12] raise the importance of remote sensing from space satellites in obtaining real-time weather information for disaster adaptation, because terrestrial weather stations are likely to stop functioning during disasters as in the case with the 2018 Kerala floods.
Ziegler, Wasson [22] recommend climate urgency in the political economy surrounding disasters, given the human vulnerabilities involved. Alam, Bhat [1] emphasize taking an integrated approach covering disaster intensity, areas prone to exposure and sociodemographic factors for flood assessment to effect structural and non-structural mitigation measures. Waghwala and Agnihotri [24] iterate that in the context of unavoidable urban expansion, alternate drainage solutions and flood cushions should be provided within the city in the form of detention ponds, and flood waters should be diverted into existing creeks and ponds. Such measures can speed up the resiliency of the city post floods.
Kumar, Pradhan [14] talk about the importance of extreme weather event prediction through mid-range modeling over blaming inadequacies in last-minute operations of structures like reservoirs during an unexpected disaster. In the context of Kerala, which experiences floods followed by droughts within a few months, he proposes that the construction of additional reservoirs might not only help mitigate future floods, but also provide water security and hydropower generation. Ramasamy, Gunasekaran [13] recommend careful planning and execution of water management strategies in reservoirs located in zones of seismic activity to prevent reservoir-induced seismicity (RIS) during floods. Wadhawan, Singh [11] raise concerns on the negligence of disaster management institutions in handling landslides caused due to floods in susceptible regions of Kerala, though the Western Ghats has been a hotspot for several landslide-related studies, which have been documented in the Geological Survey of India’s compendium.
Jameson [4] recommends that governments build their water management networks around flood management to initiate institutional synergies between rainwater harvesting, stormwater drainage networks and land-use planning. He also calls out that most flood management approaches tend to follow a top-down approach with engineering aspects given the highest importance amidst other critical factors. Avashia and Garg [5] also recommend integrated urban planning in designing resilient and sustainable cities.

3.2. Floods in China

China faces a unique water crisis situation in terms of co-existing water shortage, flooding and water pollution issues. Cities form an integral part of China’s development contributing to 80% of national GDP and accommodating 50% of its population. However, the number of Chinese cities experiencing flooding has doubled since 2008 with 130 of the total 654 cities experiencing floods every year, which is becoming a major concern in the country’s development [18]. This section spills details on floods in China’s cities such as Beijing, Shanghai, Fuzhou, Ningbo and Harbin.

3.2.1. Cases of Floods

Jia, Li [9] reported that the rate of increase in the number of Chinese cities affected by flooding has been on the rise ever since 1984, with its pace increasing with every passing decade as seen in 2001 and 2010. As of 2015, 60% of Chinese cities experienced precipitation-related urban flooding each year and this number was thrice as high as the predictions from official reports. Figure 3 lists out the major causes for urban flooding and it was found that cities along the southeast coast of China were most prone to urban floods, which is justified by the higher rates of urbanization and climatic conditions in this region when compared to the rest of the country.
China has a 18,000 km long coastline with several fast-developing coastal cities including the mega-city Shanghai, which is one of the largest coastal cities on earth occupying an area of 6340 square kilometers. Yuan, Xu [20] ascribe Shanghai’s extreme rainfall events induced by warm sector weather events to its geographic location by the sea and its location on the Huangpu Pu riverbank (a tributary of the Yangzte river), global warming, urban heat effect and land subsidence given that its average elevation varies between 2.2 to 4.5 m. Further, such events aggravate the risk of pluvial flooding in the city.
The mountainous city of Fuzhou in China’s Fujian province experiences typhoons and heavy rainfall (annual maximum of 43.9 mm/h) between July to September, which trigger the co-occurrence of flash floods in the Jinan and Baima rivers upstream resulting in urban flooding the downstream city. Flash floods are accentuated by terrain induced disadvantages such as steep slopes, reduced stream catchment areas and short stream lengths which render the construction of flood control reservoirs unsuitable. As of 2018, 21 million yuan was invested in the flash flood prevention of 72.2% of the city’s area comprising of 0.37 million vulnerable people [19].
The Yangtze river delta economic zone has several deltaic and coastal cities and water towns (colloquial expression for these cities) such as Ningbo. These cities follow unique city planning styles with a dense network of waterways and canals running through the city that were traditionally used as the primary means of water-borne transport before the advent of present-day automobiles. Ningbo stands among the top 20 coastal cities in the world and is accredited as a ‘water-saving city’, ‘garden city’ and ‘ecological city’ by the country [25]. It is located along China’s southeast coast and is surrounded by mountains, making it prone to pluvial and coastal floods, which have been exacerbated because of urban expansion taking over its wetlands, marsh areas, agricultural lands and other natural sponges. The impermeable modern-day curbs generate increased runoffs that exceed the capacity of Ningbo’s old pumping stations and existing drainage systems leading into the Yang river [25]. This region receives an annual precipitation of 1400 mm, experiences intense spells of rainfall during monsoons and is frequently affected by typhoons causing surface and groundwater flooding, fluvial flooding and marine flooding [26].
Nangang district in Harbin city of Heilongjiang province consists of drainage systems dating back to 1904 with a conduit capacity of 18 mm/h and drainage capacity of 135 m3/h, which fall short of the drainage capacity stipulated by the standards (185 m3/s) to tackle moderate rainfalls of 25 mm/h. ‘The Harbin water supply and drainage industry development strategic planning proposes to undertake sponge city facilities and drainage upgradation between 2020 to 2025 to overcome the current waterlogging challenges the city undergoes even during moderate rainfall events [27].

3.2.2. Studies and Findings

Jia, Li [9] found that the number of reported city events increased with urbanization and city built-up areas, which were less frequent when urbanization was below 36% as compared to when it reached 40%. However, they found out that, contradictory to expectations, the number of flooding events increased with an increase in the city’s green areas and total conduit length. The Ministry of Housing and Urban-Rural Development’s national standards contain green lands and green coverage standards. As per this definition, “green lands” are described as built-up areas covered by vegetation of which natural green lands should not account for more than 20% of the total green land. As of 2010, green lands comprising more than 31% and 35% of the area were set as base requirement and advanced standards, respectively. Green coverage is higher than green land because tree branches spread over larger surfaces of land, and green coverage comprising more than 36% and 41% of the area was set as a base requirement and advanced standard in 2010, respectively. Despite most cities meeting these standards, flooding occurs because not all green areas allow for infiltration owing to their constructions on shallow soils over impervious surfaces like concrete, in order to satisfy green land and green coverage indicators for city planning and development. Since green areas are considered as LIDs that are expected to control 70% to 85% of total precipitation, a subsequent stormwater drainage design based on these expectations may lead to flooding if these expectations are not met due to the infiltration constraints of green areas. The reasons for increase in flooding with respect to the increased cumulative conduit length of cities can be attributed to capacity and flexibility constraints of the older pipes [28] to which the new extensions are connected. It is also worthy to note that prior to 2014, China adopted city design standards corresponding to a return period of 4 months to 3 years for most sites, with the most important ones like Beijing’s Tiananmen square designed for a return period of 5 years, which are lower than the standards followed in most developed countries. Dai, van Rijswick [8] restated Premier Li Keqiang’s words in the annual government work report in 2017, emphasizing that “when taking solid steps to pursue a new type of urbanization, coordinated urban development should be promoted above and below the ground”.
Ma [19] performed a case study identifying the relationship between urban waterlogging and flash floods in the Chinese city of Fuzhou and analyzed integrative preventive measures under China’s Sponge City Program and National Flash Flood Prevention Project, as shown in Table 3.
Yuan, Xu [20] state that, although Shanghai experienced several precipitation events above the intensity of 50 mm/h, its drainage systems are capable of handling intensities of no more than 36 mm/h. These extreme precipitation events causing pluvial floods in the city of Shanghai are results of extraordinary torrential rainfall events and extraordinarily short-duration high-intensity rainfall events. Their study found that, while the total number of torrential rainfall events remained the same over the years, the frequency of extraordinary torrential rainfall events increased, which is correlated with the increase in sea level. This is supported by the China Ocean Bulletin report declaring Shanghai’s average yearly rise in sea level between 1980 and 2015 to be 3 mm, which greatly exceeds the global average. Extraordinarily short-duration torrential rainfalls can be attributed to increasing temperatures and Shanghai, whose temperature variations rise at a rate of 0.61 °C every 10 years; thus, the city is definitely at risk. Xu, Ouyang [16] analyzed flooding events in the city of Shenzhen between 1980 and 2018 and found that the flood mitigation capacity in the eastern parts of the city were better than what was observed in its western parts. They also reported that Shenzhen’s flood mitigation capacity has been undergoing a steady decline over these years owing to change in land-use patterns and urbanization.

3.2.3. Recommendations for Flood Management

Ma [19] recommends the use of water telemetry systems to tackle urban flooding in Fuzhou given that this is an internal problem arising from the external threat of flash floods, which are fueled by inadequate water carrying capacities of the upstream rivers. He recommends implementing structural measures like tunnels, cut-off ditches, flash flood drain branches, rainwater gardens, permeable pavements and capacity or rebuilding of drainage networks. He also recommends the integration of the above structural methods with non-structural methods like governance of urban rivers, scientific study of hazards, improved accuracy in disaster monitoring, cooperation across multiple sectors, education and emergency plans for the public, mass observation and preparedness and well-established laws and policies related to rainwater.
Jia, Li [9] reiterate the importance of improving cities’ infiltration capacities in addition to increasing their green areas to control urban flooding. Yuan, Xu [20] recommend the use of GIS, GPS and remote sensing data to monitor and forecast heavy rainfall events along with undertaking adequate measures to repair and increase drainage capacity; for example, using engineering technologies such as sluice gates and pumps to control pluvial flooding as in the case of Huangpu river in Shanghai. Pluvial flooding due to heavy rainfall may induce potentially large damage to coastal structures and residents’ lives. In recent years, the above hazards have become more serious. Thus, monitoring and database systems, with contemporary geomatics technologies such as GIS, GPS and remote sensing, should be used to effectively forecast heavy rainfall. Meanwhile, appropriate engineering treatment technology, such as repairing and increasing the capacity of the drainage system and the sponge city, should be chosen for this type of hazard.

4. Comparison of Indian and Chinese Urban Stormwater Practices

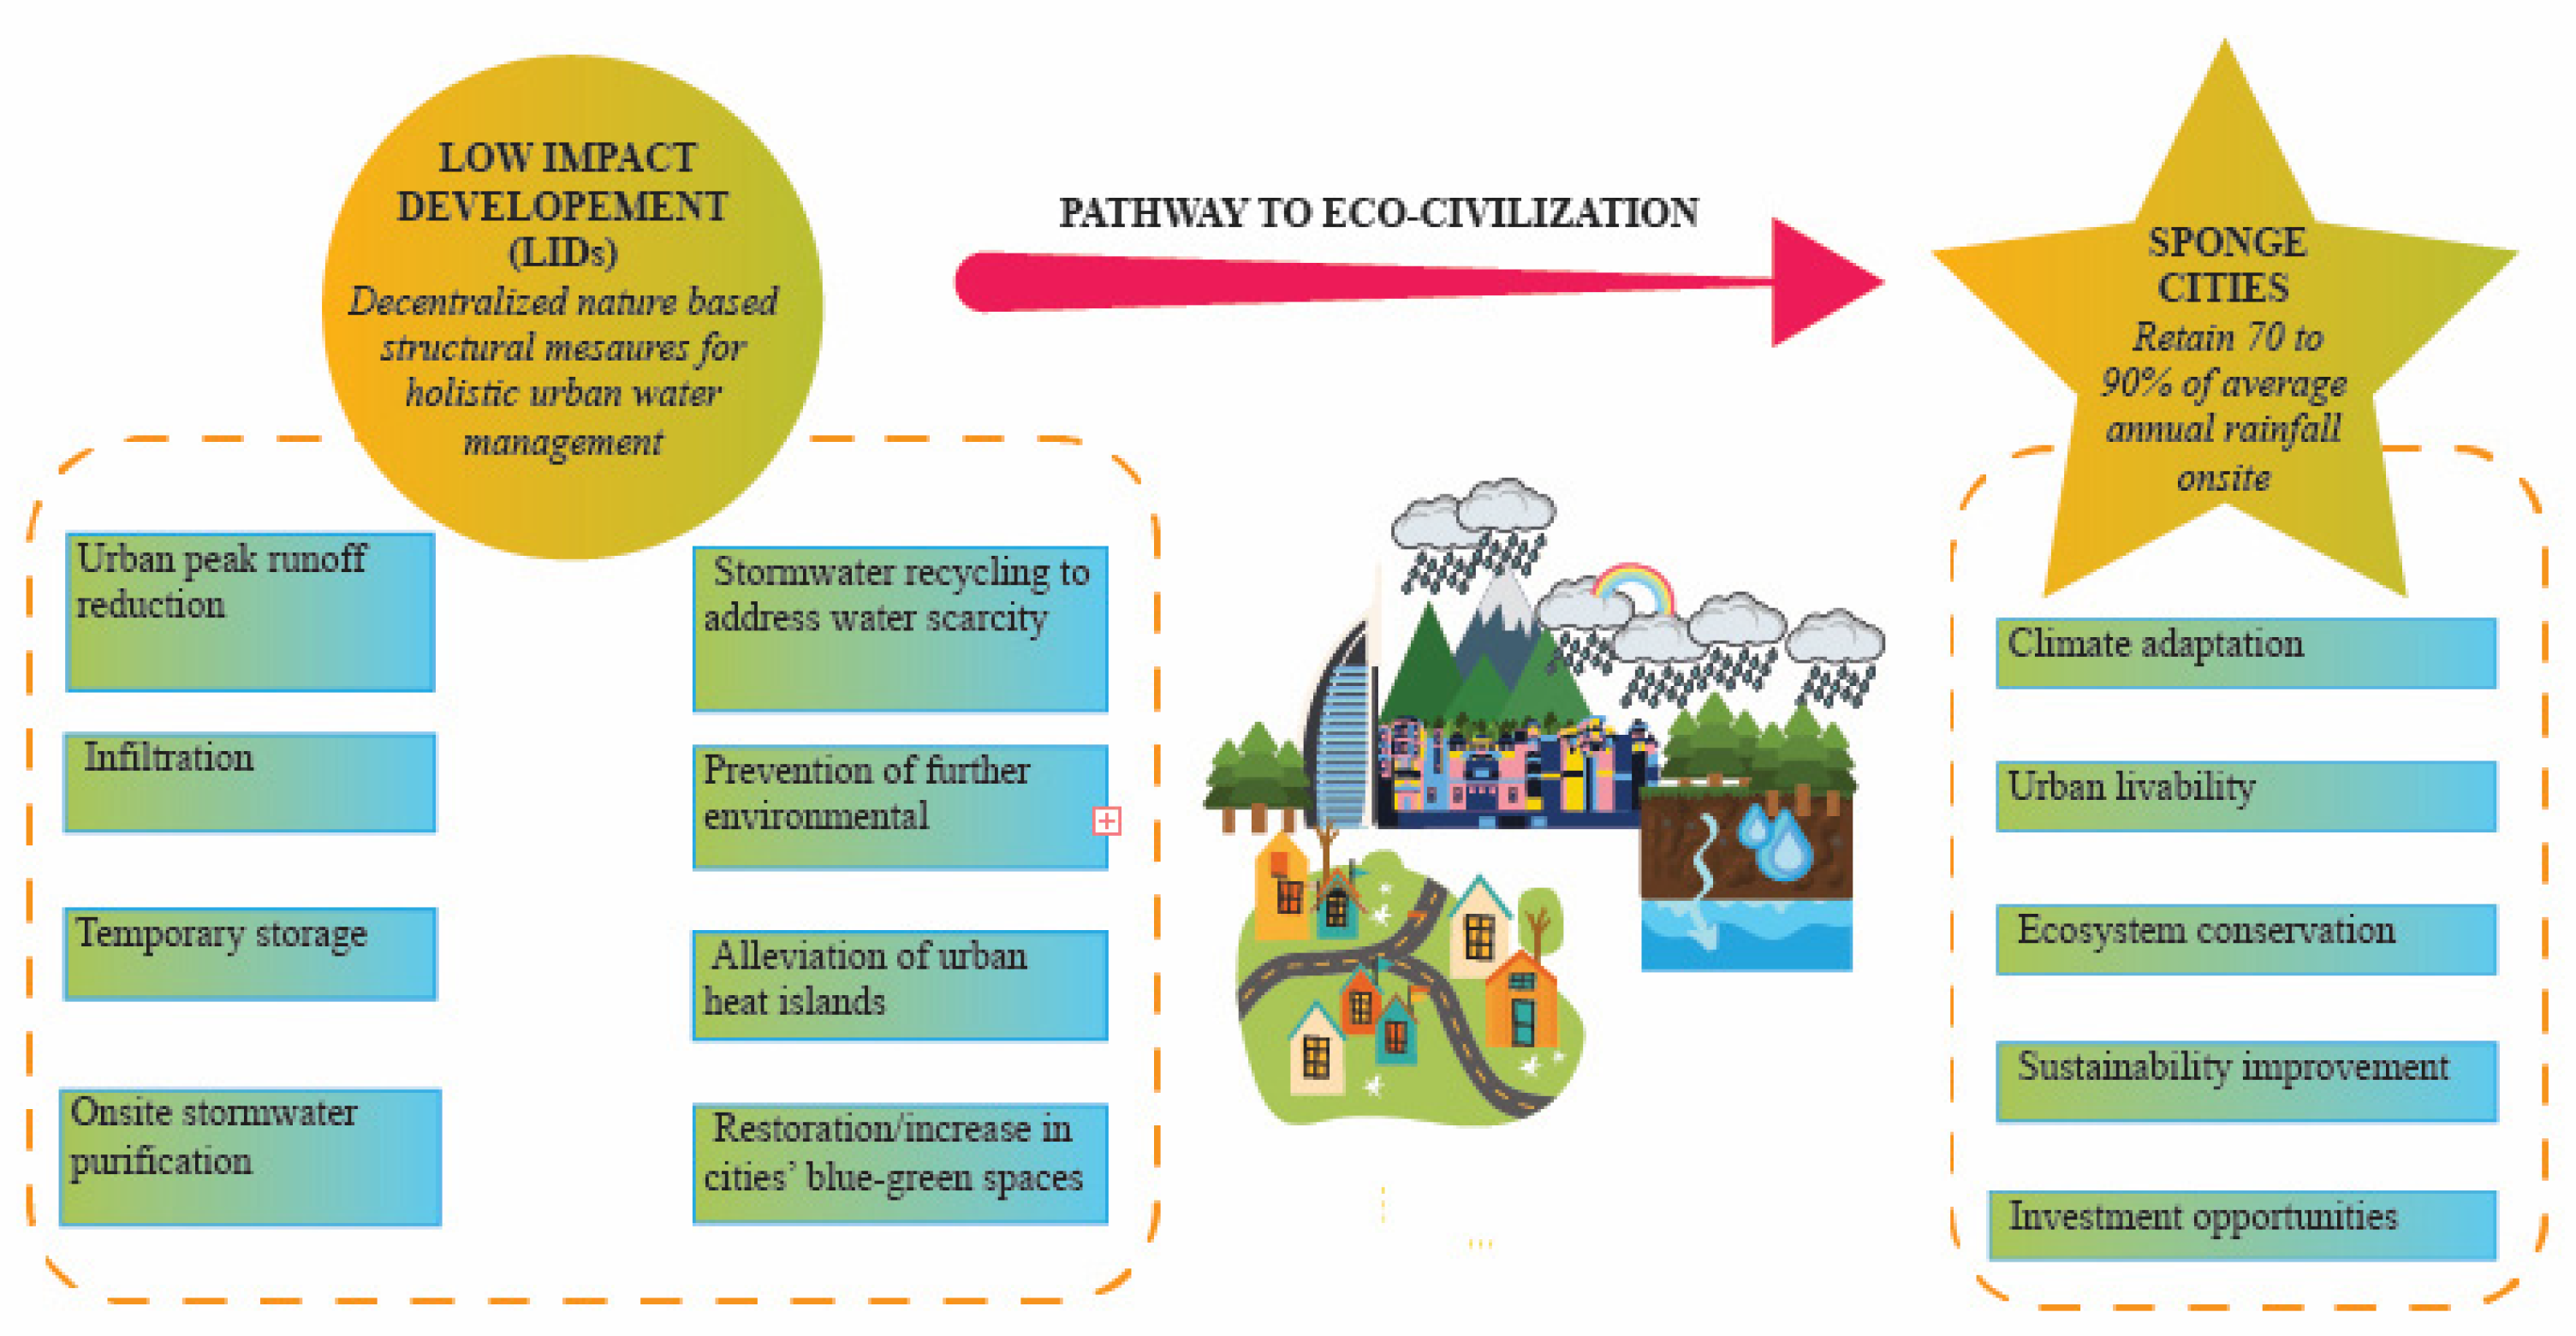
4.1. China’s Sponge City Program

The National Congress introduced the concept of ecological civilization as a national development strategy in 2007, which can be considered as a precursor to the SCP. Ecological civilization was listed as one of the five main goals of China’s development plan in the 18th National Congress of the Communist Party in 2012. The 13th Five-Year Plan between 2016 to 2020 focused on rainwater and flood mitigation advocating the “green is gold” philosophy to pave way for an ecological civilization [8]. China’s SCP is considered a supporter of the United Nations’ New Urban Agenda, which promotes global sustainable urbanization and integrated urban water management pertaining to climate change [29] as illustrated in Figure 4.
Between 2015 and 2016, the China Ministry of Finance (MOF) with support from the Ministry of Housing and Urban-Rural Construction (MHURC) and the Ministry of Water Resources (MWR) chose 30 pilot cities from over 500 applicants for the Sponge City Program (SCP) [28,30]. Given the geographical extent of the country coupled with its spanning across different climatic zones, from the tropics down south to sub-arctics in the extreme north and alpine conditions in the Tibetan regions, it becomes a challenge to identify a universal plan for all its cities. Currently, most of China’s pilot cities are selected along the southern and central areas, since they are the most prone to precipitation-related floods, given that the average annual rainfall in this area varies from 410 to 1830 mm and annual average temperature is between 4.6 °C and 25.5 °C. However, a few cities were selected from outside these zones, such as in the sub-arctic northeast and arid central north, to develop an understanding of what it takes to successfully implement the SCP in these areas [28].
The major ambition of this program was to retain 70% to 90% of the average annual rainfall received in these cities using decentralized nature-based low impact development (LID) measures and green infrastructure [29], thereby alleviating urban peak flow in runoffs by promoting onsite infiltration, temporary storage, purification and recycling of rainwater. This flood management approach looks at rainwater and stormwater runoff as a resource to be utilized to achieve urban water resilience, rather than a flood threat to be eliminated while mitigating the effects of urbanization (such as urban heat islands) on natural ecosystems, through restoration and creation of blue-green areas within city limits. Li, Ding [28] conducted a detailed survey of all 30 pilot sponge cities and deduced technical, financial and institutional challenges. From an economical point of view, this program hopes to improve local economy by generating opportunities for building green infrastructure, engineering technologies and upgrading existing grey infrastructure like city pipelines through capital intensives [28].
Concept wise, the SCP can be considered analogous to the USA’s low impact development (LID), the United Kingdom’s sustainable urban drainage systems (SUDS) and Australia’s water sensitive cities [18,28,29], but SCP is more ambitious in terms of scale and scope when compared to its international contemporaries [25]. A comparison of the salient features of low impact development (LID) and the Sponge City Program (SCP) concepts can be found in Table 4. Li, Collins [2] state that rebranding the SCP as a multiple benefit project will aid its enabling in a positive manner, since SC facilities go beyond the scope of traditional grey infrastructure, which have no impact on community participation. However, there are different schools that are against this idea of broadened scope descriptivism, quoting that such measures will dilute the specialization of such ventures.
The central government of China has set a target for the absorption of 70% of rainwater, which is to be utilized for 80% of the country’s urban water needs by 2030 [18]. However, it is to be noted that some reports state that LID measures tend to perform better during smaller storms and that their flood control performance decreases with increases in rainfall [31].

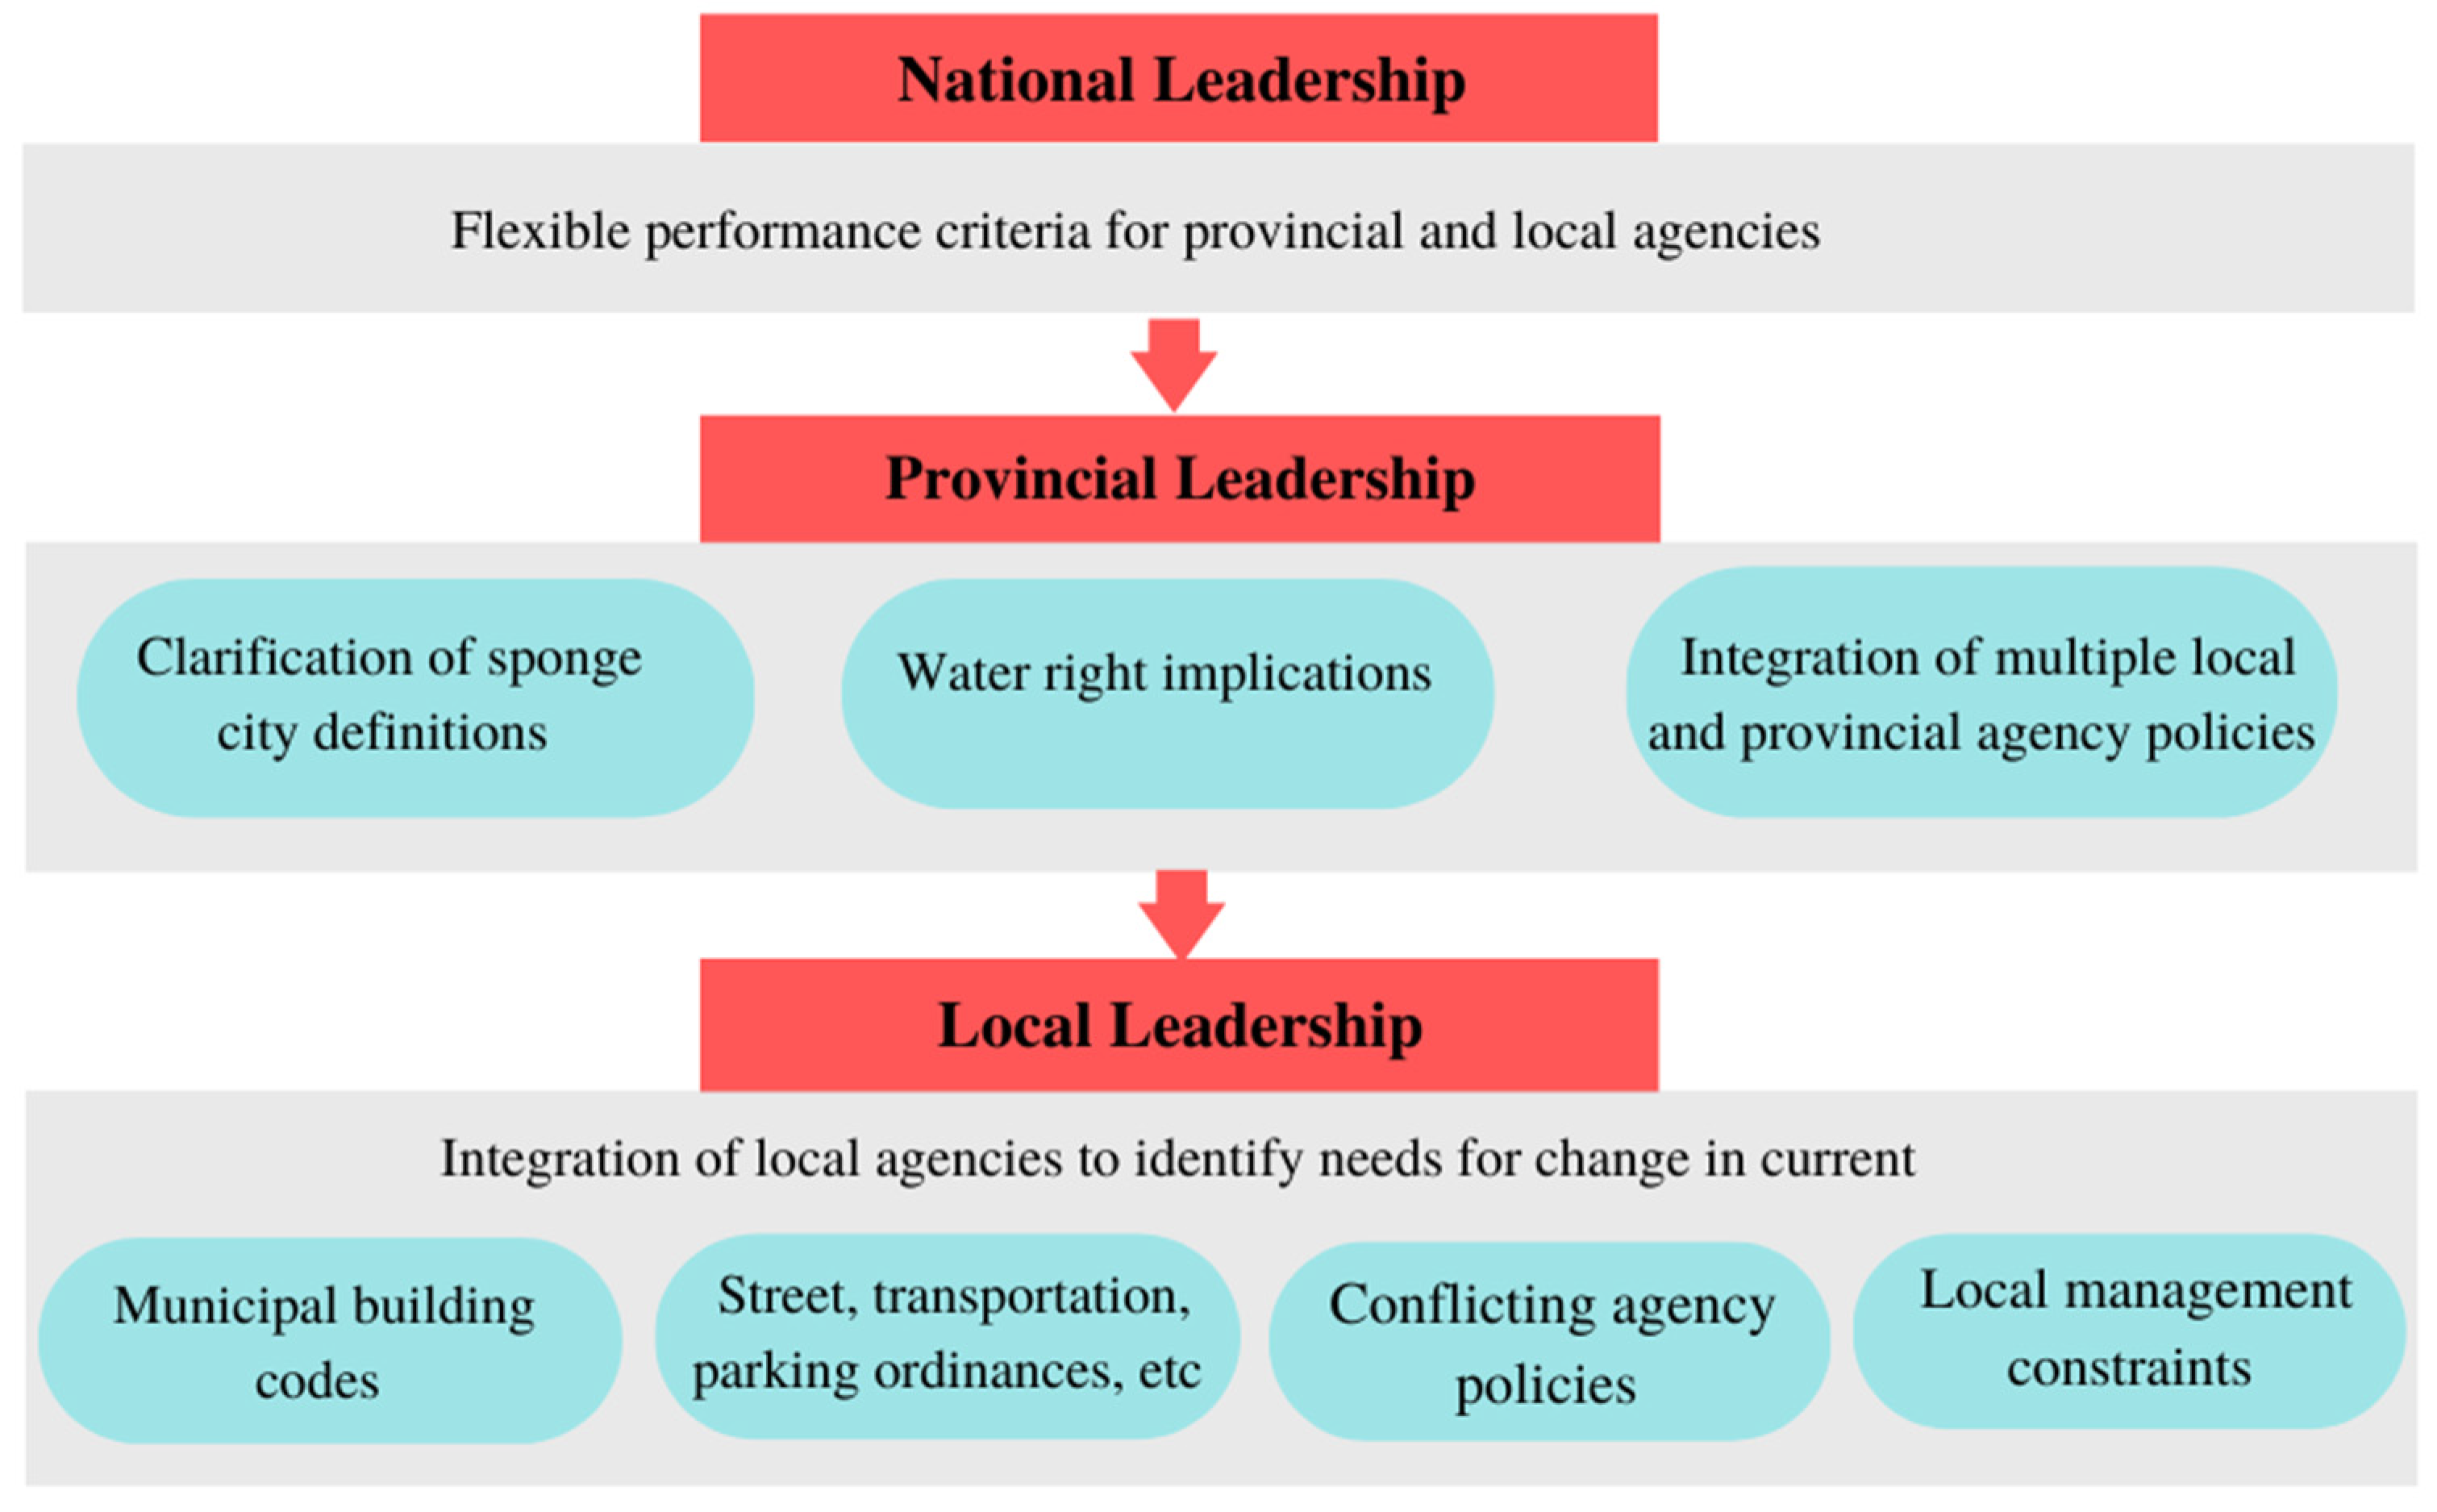
4.1.1. Policy Approach and Governance

China forms a hierarchical governance structure where the provincial and local governments facilitate and aid decisions made by the national government [8]. Jiang, Zevenbergen [18] state that administrative boundaries between local government agencies dealing with overlapping water administration functions may pose the risk of limited interaction and coordination among these governmental agencies.
Currently, there is a complex governance system dealing with the ambitious and multi-disciplinary SCP: The Ministry of Water Resources is responsible for handling urban flooding; the Ministry of Environment is responsible for water quality; the Ministry of Forestry is responsible for vegetation, trees, deforestation and soil–water interactions; and the Ministry of Planning and Construction Bureau is responsible for land-use planning [32]. It is important that the guidelines, codes, legislations and manuals of these ministries are coordinated up to the municipal levels to achieve seamless implementation.
Though the Sponge City Program has been advocated as a predominantly urban runoff and waterlogging prevention concept, Li, Ding [28] suggest that thinking of it along the lines of linking water sources to communities within regional watershed scales is beneficial in tapping the full potential of the system, instead of using its fragmented benefits like runoff mitigation only. Li, Collins [2] also state that GI and SC add value to the community beyond regular stormwater drainage and flood control, by creating economic growth through new job markets, expanding green areas for recreation and microclimate adaptability.
Dai, van Rijswick [8] explain the different forms of governance practiced worldwide, namely: (i) governing by example, where the government takes measures it advocates within its own properties; (ii) governing by provision, where the government directly provides services and resources; (iii) governing by authority using laws, technical standards, compliance setups and responsibility undertakings; and (iv) governing through (co)-funding by making provisions for PPPs and co-funding in projects. China seems to be following governance by authority and governance by co-funding with respect to its SCP.

4.1.2. Regulations

Li, Ding [28] discuss the regulatory challenges faced by the SCP in detailed manner. Though a national guideline was issued in 2014 followed by city-level guidelines for a couple of cities between 2015 and 2016, these guidelines lacked the specifics in terms of local adaptability for China’s soils, climate and topography, and were comparable to the guidelines followed in the United States. However, Griffiths, Chan [25] point out that, although LIDs, SUDS, WSUD, etc. are often referenced for SC planning, the best practices are drawn from China’s domestic projects, which is a sign of positive development in sustainable urban drainage.
For the successful implementation of SCP, national, provincial and local guidelines contain the following recommended specifics: (i) project assessment, planning and design; (ii) its construction, operation and maintenance; and (iii) its quality control, appraisal, monitoring and evaluation. It is important to achieve coordination between national, provincial and local levels [25] because water, land use and property rights are interdependent. Figure 5 depicts avenues for promoting government leadership and inter-agency cooperation. For example, a provincial government body bringing about changes in the water management upstream is prone to influence the quantity of water received downstream, which will impact local planning. Though the national and provincial levels are important in coordinating SC efforts throughout the country, provision of regulatory standards and roles of local agencies are critical towards the successful implementation of these measures. Local guidelines including construction manuals and design standards need to be developed post evaluating local conditions with the active advice of local developers, planners and engineers, since traditional municipal codes are based on grey infrastructural practices. Local governments may include formal training of their officials, public work staff, planning and design experts and the general community in sponge city practices and education. They could also consider undertaking the responsibility of developing a thorough life cycle analysis of the projects and practices in terms of performance and costs to generate a national database of best practices.
Countries like the UK have vested the power of decision making in sanctioning new developments in flood-prone areas to local planning agencies (LPA), which have the rights to restrict new developments if the proposal does not satisfy flood risk appraisals. In cases of unavoidable developments that fail to pass flood risk appraisals, clearance may be granted on the terms that the developers abide by safety standards and take responsibility for flood risk mitigation [32].

4.1.3. Planning of LID and GI elements in SC Pilot Cities

Currently, the pilot areas within each of the 30 pilot cities occupies an area of 15 km2 or more, with most of the LID measures enabled within this radius, though some green and grey infrastructures may be located beyond the pilot areas of the pilot cities to focus on innovation and novel approaches [28]. Sponge city guidelines require cities to be equipped to drain runoff up to 1:30 year 24-hour rainfall events. This means that the cities need to notch up from their existing capacities of 1:1 year 24-hour rainfall events, which cannot handle more than 187 mm per 24 hours [32]. Dai, van Rijswick [8] state that “window dressing” and “image projects” (defined as structures used solely to raise a city’s profile without contributing much to other practical uses) under the guise of sponge city elements should be avoided, and that the SCP alone cannot be used to eliminate urban flooding. The restoration and reconstruction of underground structures such as pre-existing drainage structures from older parts of cities need to be tended to as well to achieve real results. Fan and Matsumoto [27] view the SCP as a measure to increase the “curves” in urban areas to increase water absorption.
Though fixed deadlines are beneficial to project planning and execution, short timelines may result in lowered project effectiveness. Dai, van Rijswick [8] report that the first batch of pilot cities were allocated 3 months to design their sponge city plans, which may have led to overtime working hours of project teams in order to meet the tight deadlines. Another concern to bear in mind is that in addition to the SCP, China is also debuting a couple of other projects like the Pilot Urban Tunnel Program and the Urban Black Odorous Water Clean-Up Program, which requires coordination not just between the agencies responsible for SCP, but also with agencies working on these other two projects as well. The Urban Black Odorous Water Clean-Up Program covers over 1897 rivers and 218 Chinese cities, implying that several of the pilot sponge cities are also covered by this program [8].
Water towns like Ningbo and Suzhou in China have adopted a “blue-green city” concept since ancient times that is aligned with the SC vision. These cities have practiced measures like using seminatural canals to divert water from upstream areas into agricultural and municipal use zones, thereby reducing flood risk while improving water availability. Reports also state that Ningbo’s earthen canals used to be lined with Mulberry trees to prevent erosion, which also served as rearing hubs for silkworms used in silk production, thereby achieving ecological balance, water conduit safety and boosting the local economy [26].
Xu, Shen [6] found out that when drainage systems were built before the city itself, it performed better as in the case of Ganzhou and, therefore, they recommended sponge cities to be designed and planned prior to the construction of new urban areas. Since current pilot cities were planned to incorporate sponge city elements in existing urban structure, this works as an impediment and weakens rainwater management, which may be one of the reasons why two-thirds of the pilot sponge cities still experienced flooding as of 2016. This view is seconded by Griffiths, Chan [25], who also believe that transformation of existing aboveground structures like buildings and their associated underground drainage structures will be affected by pressures from modernization, space scarcity, land cost inflations and disputed ownership concerns. Studies by Zhang, Zhao [33] show that in the case of old residential areas, LID approaches integrating the use of green infrastructure with grey infrastructure could achieve both quantitative and qualitative flood mitigation results. In their area of study, Shuixianghuayua, which is an old residential area in Songling town, in the Wujiang district of the Suzhou province in China, a combination of LIDs resulted in a volume capture ratio of 91%, which surpassed the 80% requirement set by the regulatory standards. This action was thus capable of protecting the area against storm events of one in 5-year return periods, while removing 56% of the suspended solids in the runoff.

4.1.4. Land Use

Land use poses a major challenge in the implementation of sponge cities, given that urban areas have extremely high land prices, and the planning of sponge cities requires several LIDs to be located in private properties around community clusters. This is hard to achieve since builders and planners pivot towards optimizing construction planning using as much available land as possible in view of financial prospects, thus making it hard to convince them to allocate considerable spaces for the implementation of sponge city elements. Post instalment, the problem of long-term operation and maintenance of these structures located within private spaces is equally challenging for the public agencies. However, the problem of land use extends in public spaces as well, especially in the right of way along public roads, since this space faces demand for multiple uses such as bicycle friendly lanes, sidewalks, vehicle parking and stormwater drainage [28]. Li, Collins [2] point out that, conversely to the traditional thinking of private builders, properties with sponge city facilities are bound to increase in value in the upcoming years due to the trending green preferences among the public. They also state that governments should consider the cost reduction SC elements will affect few years down the line, when the need to constantly expand city drainage systems is overcome by sustainable urban planning, more water saving and improvement in the overall well-being of the city’s inhabitants.

4.1.5. Operation and Maintenance

The operation and maintenance required for sponge city elements are more frequent than what is required for traditional grey infrastructures since they are nature based. For example, periodic weeding and dredging is required in bio-swales in comparison to concrete conduits. It is also to be noted that, since these LI structures are not only centrally located or limited to public spaces like in the case of traditional grey structures, the chances of them being filled in or removed during other projects, especially within private areas, is of concern to public agencies responsible for their maintenance and smooth operation [28].

4.1.6. Materials Required

Though one of the goals of the SCP includes improving opportunities at local levels, majority of the products and materials used in its implementation are imported from abroad, including computer software used for designing, products such as rain garden systems, tree planting systems, green and blue roof systems, tree root protection modulars, landscape and sports and playground solution systems and blue products including vortex flow control devices and inlet filter devices, as well as various other monitoring equipment [28].

4.1.7. Quality Control, Appraisal and Performance Evaluation

The Ministry of Housing and Rural-Urban Development (MHURD), the Ministry of Finance (MOF) and the Ministry of Water Resources (MWR) are responsible for selecting cities on the basis of the applications submitted by provincial governments and periodic performance assessments. The selection is based on suitability of the proposed cities towards satisfying pilot goals, available financial mechanisms and complementary measures available at local governmental levels [28]. The lack of monetization measures for ecosystem services and the lack of evaluation tools to assess the benefits of green ventures in Western countries has been stated by Li, Collins [2]. In the case of China, paid tools for financial and economic analysis are available, but there seems to be less awareness or information about the availability of any free tools in the market. Unless measures to handle the market situation of these performance tracking tools are resolved, green ventures shall be considered unpredictable “risks” by policy makers, municipal authorities and the general communities. Ma, Jiang [29] recommend the use of the ecosystem services framework (ESF) tools for decision making (also advocated by the United Nations Millennium Ecosystem Assessment in 2005) to quantify the services of bio-complex human-urban ecosystems and conventional ecosystems.

4.1.8. Funding

Grants and municipal funds are the primary financial providers of the SC projects, which are beneficial in kick-starting the project early on, but are proving to be bottlenecks in their scalability and expansion [2]. As per preliminary estimates, the SCP is touted to cost between 15 to 22.5 million USD per square kilometer or 1.5 trillion USD for all 657 cities in China. Currently, each of the 30 pilot cities receives 60 to 90 million USD per annum for 3 years costing the central government around 6.35 billion USD [30]. Li, Ding [28] call for the integration of national agencies in sharing costs from available national funds to facilitate the implementation of sponge city projects at local levels. In the case of Ningbo, a 2:1:1 funding ratio was adopted in the order of central funding:city funding:district funding, accounting for 0.17 billion USD from central funding and 0.8 billion USD from city and district funding, respectively, until 2020 [25].
The debate on the higher initial cost requirements for sponge city facilities when compared to traditional drainage enhancement procedures is addressed by Fan and Matsumoto [27]. They found that, in the case of a district in China’s Harbin city, though sponge city implementation is more expensive in the initial phase [2], the project is expected to achieve carbon neutrality after 3 years and can double up as a carbon emission reduction factor, saving up to 198 tons of carbon dioxide emission per year in addition to absorbing 1.9 tons of NOx emissions, making it hugely advantageous from both financial and environmental perspectives. Lin, Tang [34] estimated the cost of sponge city elements in Dalian to be between 398.4 and 13.314 million Yuan if the “functional division of natural ecological environment planning” is used, which is lower than the costs of “function-based sponge city planning methods” by 601,000 Yuan and “ecohydrology-based sponge city planning methods” by 682,000 Yuan.
Though clear estimates and data with respect to the design, construction and implementation of SC facilities are available, the costs involved in its long-term maintenance, operations and life cycle costs may not be easily accessible. This poses a setback in attracting private and public parties towards SC investments due to ambiguity in terms of both future benefits and financial risks [28]. To arrive at an accurate cost-risk report, it is necessary to plot the benefit curve and damage curve and the expected flood expenses for a large range of rainfall return periods [31].

4.1.9. Partnerships

The Chinese government advocates for local matching, participation from qualified non-governmental financial institutions and construction companies, and public–private partnerships (PPP) [28]. Public–private partnerships are great ways of taping into private funding and expertise in large-scale construction projects, and they are increasingly used in the West, where the private sector companies build, control and operate the construction projects abiding to strict laws, regulations and overview of the government. Jiang, Zevenbergen [18] point out that PPP can be achieved if an attractive business model is prepared by the government to eliminate uncertainties in policy interventions, credit for accomplishments and goods ownership among prospective private partners. They also recommend the systematic monitoring and data collection of ongoing projects to design performance indicators for project appraisal. This information can also be useful in coming up with a cost-benefit analysis to justify investment values and attract private sector financing agencies to bridge the financial gaps that this initiative is currently experiencing. However, the local economy should be kept in mind in joint ventures involving large domestic and international firms, and facilitations for sub-contracts to local firms can be considered [28].
PPPs also help governments transfer risks to the private sector at a fixed price, to speed up project delivery, to lower cumulative project expenditures and to enhance cost certainty for the public sector. However, there are cases where public institutions are hesitant towards transferring big projects to private firms due to mutual trust issues [8]. In fact, cities are incentivized with a 10% bonus from the central government if the PPP contribution is higher than a given percentage of the total budget [30], but this sometimes prompts financially capable pilot cities to go in for PPPs, thereby resulting in an unwarranted increase in public expenditure and governance-based managerial loads [28]. Cities like Ningbo have been able to source up to 0.6 billion USD from PPPs and other construction contracts [25].
Dai, van Rijswick [8] throw light on the conflicts that may arise in PPP policies. Private investors may be wary of investing in SC projects because of the lack of performance information tracking, because as far as drainage infrastructures are concerned, both tangible and intangible results are to be anticipated [25]. Private firms are hesitant to participate in PPPs because of the lack of legal protection offered to them in case of court dispute with the public agencies. The alleviation of any forms of perceived ambiguity in the return of investments for the private firms involved in SCP’s PPPs needs to be addressed [8].
Li, Ding [28] bring up the four main setbacks when it comes to implementing public–private partnerships in China. First of all, China lacks an independent regulatory body and laws dedicated solely to PPPs. Secondly, there is an absence of a one-stop online databases consisting of complete information of PPPs that are up for bidding. Such a database should also include feasibility reports, agreements and statuses of clearances and land acquisitions to attract interested private agencies. Thirdly, project development particulars like feasibility studies, land acquisition and environmental, forest and floodplain clearances need to be listed by the concession authorities to avoid misunderstandings, mispricing and delayed execution by the partnering private sector parties. Fourthly, institutional capacities are a major consideration in such large projects at all levels, and more so at the local governmental levels, which are further augmented by concerns with respect to risk transfer, financial implications, contractual matters, politics, management and accountability.
Another hiccup SCP is facing is the fact that 19 out of its 30 pilot cities, including star cities like Beijing, Tianjin, Chongqing and the capital cities of Fuzhou, Wuhan, Jinan and Nanning, continue experiencing flooding post-SCP implementation in 2014, which is hurtful to the public profile of this program, thereby creating shadows of doubts among the general public and private investors [25].

4.1.10. Technical Specifications

Technical specifications play a very important role in the success of sponge city projects, and it is necessary to understand that not all practices are of universal suitability. There is a need for following localized approaches in implementing sponge city facilities given that urban drainage is subject to local hydrology, rainfall, climate and socioeconomic conditions [30], which calls for localized technical guides with demonstration projects in addition to the national guidelines provided by the MHURD [18]. It becomes significant to educate planning and execution professionals on LID practices to avoid misconstructions that might end up worsening situations given the geographical, topographical, climatic, hydrological and soil variability in China.
Li, Ding [28] pointed out that, though Chinese sponge city pilots differed drastically in their weather, geographical and topographical conditions, the LIDs recommended seem to be similar. For example, both the cities of Baicheng and Shenzhen are recommended to have green roofs and permeable pavements, though the former is a cold and arid region facing water quality and quantity issues, while the latter is a tropical coastal city with high groundwater tables facing issues like heavy seasonal storms, saltwater intrusion and poorly drained soil. Inappropriate strategies tend to aggravate the problem. As a rule of thumb, infiltrating practices should be avoided in poorly drained soil, high groundwater tables, steep slopes, landslide-prone areas, floodplains, contaminated soils and wellhead protection areas, while evaporation-prone measures should be avoided in arid and semi-arid regions. LID measures involving clayey soils are hard to implement because of the soil nature, and certain projects involving them have had to be retrofitted with underdrains indirectly alleviating the benefits of the LID philosophy.
Ma, Jiang [29] blame “design deficits” as the factor behind the blind unanimous implementation of similar LID facilities across the country despite obvious differences in local conditions. Dai, van Rijswick [8] report cases where cement was used to fill spaces between permeable paving blocks as used with traditional practices, instead of using the recommended polymeric sand as prescribed in the sponge city manuals to provide permeability for water. In the northern and colder regions of China where the water tends to freeze during winter months, it becomes impossible to operate certain LID measures throughout the year. For example, knowledge that green roofs and permeable pavements help in reducing urban peak flows is not sufficient and should be coupled with site suitability analysis to understand that this practice is not recommended for cold, arid, high evaporation or evapotranspiration areas facing water quality and water shortage issues.
Currently, a nationwide database containing empirical information of real-life projects has not been developed, but modeling and field project data of technologies and practices used in stormwater management are available [18]. Among these practices, permeable pavements have the best cost benefits given their low cost and high performance in preventing runoff generation, and they are capable of removing 80% to 90% of suspended solids. Though other options such as artificial wetlands, lakes, ponds, green roofs and vegetation buffers require a higher initial cost, they are effective in flood mitigation and water quality enhancement in addition to serving as public green spaces that help create ecosystems for ecological diversity within city limits [32]. Li, Huang [31] also found that permeable pavements had the best hydrological performance for a LID performance study based in Tianjin airport economic area.
Tang, Chan [26] suggest that in the case of blue-green cities like the water towns along the Yangtze river delta, increasing the density of water networks should be coupled with linking them to newly developed LIDs and blue-green infrastructures like wetlands, bioswales, urban forests, etc. Ningbo’s eco-corridor has succeeded in increasing the newer, eastern part of the city’s water storage and decentralized treatment capacity, and also works as “green lungs” in public spaces.
Xu, Shen [6] studied the old urban center of Hetao in the city of Ganzhou. which is seldom flooded despite being covered by water on three sides and being located in a city receiving 1435 mm of rainfall annually, which is on the higher scale with respect to China. This is intriguing because, in the case of other sponge cities including Beijing, outdated drainage systems seemed to impede the stormwater conduit capacity of the system, including the newer extensions made to improve overall city drainage. The success of this drainage system can be attributed to its three-part flood defense system including an ancient city wall to protect the area against river water intrusion, ditches, open channels and water windows to provide quick drainage, and ponds to facilitate water storage.
Bai, Li [35] performed a study in the Sucheng district of Jiangsu province, China investigating the performance of green roofs, permeable pavements, raingardens and concave greenbelts of variable dimensions under constant site locations. The positive impacts of LIDs were directly proportionate to their proportion of maximum construction area. Results show that LIDs are generally better suited for runoff reduction than urban peak flow reduction with rain gardens being the most expensive (58.24 to 160.16 USD/m2), followed by green roofs (23.30 to 30.58 USD/m2), permeable pavements (17.47 to 32.03 USD/m2) and concave greenbelts (6.55 to 21.84 USD/m2). Grass swales have been reported to be the most cost-effective LID practice in scenarios where only one type of LID is implemented [31].

4.1.11. Knowledge, Education and Training

Researchers advocate increased scientific research, capacity building, training, education and knowledge sharing of LID and GI facilities necessary to realize SC goals [2,18,28,30]. Flood management and urban drainage approaches in China have been predominantly grey infrastructure and engineering-based approaches in the past, and thus came under the control municipal water engineers [32]. The general criticism towards the SCP is that it is still predominantly an engineering- and technology-based program [18] with an institutional sector-to-sector approach, and it lacks in the integration of administrative bodies.
Jiang, Zevenbergen [18] call for detailed monitoring of SC projects and their data collection to facilitate developing indicators for performance evaluation, comparison, knowledge exchange and informational sharing with other projects. Currently, most of the parameters used are taken from published literature and values from experimental results, but real-time pilot city operations are crucial to improving the accuracy of cost-effectiveness studies of LIDs [31].
Li, Ding [28] point out that there is not yet sufficient research done on national, provincial and local levels to satisfy the rapid implementation schedules of the SCP. Due to the lack of real-time field data, the use of computer modeling-based predictions is resorted to for coming up with life cycle costs and operation and maintenance necessities under diverse conditions, which is not as satisfactory in convincing concerned parties who wish to understand the long-term performance and service requirements of existing sponge cities. Achieving such ambitious goals, which require tackling almost all urban water-related issues simultaneously, requires a gradual learning and feedback loop mechanism [32].
For the successful acceptance and active participation by all sectors of the society, it is essential to incorporate LID-based education in informal education through media, communal colleges, etc. for the general public, and in formal education for all age groups from kindergarten to university, along with detailed technical trainings of municipal staff [28].

4.1.12. Performance, Quality Control and Appraisal-Related Challenges and Recommendations

Currently, the Ministry of Housing and Rural-Urban Development (MHURD), the Ministry of Finance (MOF) and the Ministry of Water Resources (MWR) are responsible for selecting and evaluating pilot sponge cities’ performances [28]. Jiang, Zevenbergen [18] call for the creation of an internal organizational body specially dedicated to the continued evaluation, diagnosis, guidance, correction and improvement of the Sponge City Program, considering its magnitude and duration. Transparency and public access to this evaluation process can enable current, future and potential stakeholders grasp a better understanding of the standards expected to contribute to these LID practices [32]. Dai, van Rijswick [8] claim that the strict and short deadlines may have a detrimental effect on the overall project output. Table 5 summarizes the governance, technical, financial, evaluation and knowledge-training suggestions to tackle existing challenges of the Sponge City Program.

4.2. Policies in India

India is a vast country covering an area of 3.287 million km² and spans across varying physical, climatic, hydrological, social and demographical features. Tackling flood management in India is exhaustive in terms of resource requirements in addition to a demanding level of understanding of the issue in hand.

4.2.1. Policies for Flood Management

India does not follow a singular policy-based approach when tackling urban flood management, but this issue has been covered by several of its programs, namely: Flood Control Scheme by the Ministry of Water Resources, National Watershed Development Program for Rain-Fed Areas, Drought-Prone Area Program, Desert Development Program, Technology Mission on Drinking Water by the Ministry of Rural Areas and Employment, Soil Conservation in the Catchments of River Valley Projects and Catchments of Flood-Prone Rivers by the Ministry of Agriculture [36].
Singh and Kumar [36] summarize the cumulative input from flood management policies of India as follows: The first step is to develop a thorough understanding of the current flooding scenarios and precedented risks in the country. The primary recommendation to do so is by the preparation of detailed flood risks and damage predictions on strong scientific basis or real-time data, coupled with the evaluation of existing structural and non-structural flood management measures. Flood zone and flood risk mapping need to be prepared with close consultation with local authorities. The second step involves designing contingency plans such as charting out basin-wise strategies in flood-prone areas and investigating the effects of any international flood management projects that might influence site parameters, while being mindful of multipurpose projects that are active or touted to be implemented in these areas and international water boundaries. The third step involves financial planning essential to construct, operate and maintain existing and upcoming flood-related projects. The fourth step involves capacity building and training of frontline municipal workers and pushing for research in this direction at universities and research institutes.

4.2.2. Planning

Project timelines may be extended if required to enhance design plans by encouraging iterative discussion processes between research and data scientists, policymakers and government officials. In most cases, the role of these research agencies ends with providing a risk assessment report, but it makes more sense to continue the discussion until the implementation and operation of these adaptation measures considering the multidisciplinary and interdisciplinary angle to these projects, as well as further data requirements that may arise to deal with any limitations or uncertainties in the project’s life cycle [37].

4.2.3. Techniques and Methods

India has adopted a flood management strategy tilting towards structurally induced measures for disaster prevention, but one that falls short of flood-fighting measures during the time of the disasters. The structural measures adopted by India include the building of embankments along its major rivers accounting for a cumulative distance of 34,000 km as a part of the 10th five-year plan which protects 15 million hectares of land against pluvial flooding hazards [36]. Increasing conduit capacity through restoration and construction of new drainage systems coupled with dredging, widening and sharp bend removals in channels spanning across 39,000 km was undertaken across the states of Jammu and Kashmir, Punjab, Haryana, West Bengal, and Uttar Pradesh along with the floodproofing of 2500 towns and 4700 villages. However, there exists no evacuation plans or inundation maps for several dams that could be detrimental if heavy rainfalls induce water capacity exceedance in these dams [36].
The non-structural measures include a system of weather forecasting networks spearheaded by the Central Water Commission (CWC) and the Ministry of Water Resources (MWR), which include 175 stations in flood-prone areas in 62 river sites, with the use of wireless communication systems and micro-computers [36]. It is important to note that not all flood management projects have yielded positive results. In the case of Bihar, its flood-prone zones increased to 7.1 million hectares from the 2.5 million hectares back in 1954 when the area had practically no flood protection structures. Post the construction of a 3500 km embankment, the flooding risk amplified because the breaching of a weak section of an embankment was more damaging than the effect of an unprotected gradual riverbed breach [36].

4.2.4. Governance

The governance of India is top down with each state’s government being ruled by a political party that might be different from the political party in power at the central level. The central government takes on policy making and administrative roles towards flood management between the different states, while leaving the execution and groundwork to the respective state governments. India’s river water storage is 177 km3, which accounts only for 9% of its annual river water volume of 1953 km3 [36]. India shares transboundary rivers with its neighbors including China, Nepal, Myanmar, Bhutan, Bangladesh and Pakistan and has signed international agreements regarding flood forecasting, but more active engagements are required from all parties concerned.

4.2.5. Regulations

The Central Water Commission (CWC) is the control point of flood control since 1945. Its roles include planning flood management, drainage and erosion control schemes, monitoring their initializations, technical and cost-based evaluations of flood control measures, real-time data collection, forecasting and transmission of floods to local governments to aid the timely evacuation of people. The Central Flood Control Board (CFCB) was setup in 1954 to design country-scale flood mitigation plans but was dissolved in 1977 due to its merger with a different initiative. The National Flood Control Program was also initiated in 1954 and has been instrumental in the design and execution of structural, non-structural, legal and institutional flood protection measures [36].

4.2.6. Finance

The funding for floods in India can be separated into two types: funding required for flood protection and funding for post event disaster management. Funding for flood protection measures like dam building, channeling, etc. is allocated by the union government of India, which is the deciding authority of these projects. Responsibilities in planning and executing these projects are vested with the state governments and union territories. In the event of a flood disaster, the Calamity Relief Fund (CRF) and the National Fund for Calamity Relief (NFCR) pitch in to help states with rescue, relief and rehabilitation procedures [36]. It is to be noted that flood disaster management funds are independent of the flood planning funds allocated by the union government.

4.2.7. Knowledge, Education and Training

Knowledge on planning, designing, surveying, hydraulic data recording and usage in analytical research and detailed project report (DPR) creation should be transmitted to professionals in this area by outsourcing experts for training purposes if necessary. To scale up the success, members from all strata of the society including women, farmers, social workers and NGOs should be roped along with the support of local news agencies and media houses [36]. Suggestions for research requirements at the national and local levels are illustrated in Figure 6.

5. Discussion

This study acknowledges the progress made by India and China in approaching urban flood management and suggests the following to amplify the impact of their respective programs:
  • India may consider transitioning to an urban water resilience approach using LID practices as advocated by China’s Sponge City Program, as opposed to traditional flood managerial approaches. LIDs are beneficial because of the use of decentralized natural measures that do not interfere with future urbanization developments as traditional practices do, with respect to disturbing existing structures in terms of drainage re-laying, etc.
  • China may consider pushing for either PPPs, as practiced in Western countries, or open contracts/tenders, as done with most projects in India, to enhance funding opportunities for SCP projects. Coupling these projects with local economy-boosting programs is a win-win suggestion for both the national and local economy.
  • It is suggested that countries should consider further enhancing their inter-governmental and inter-agential cooperation between sectors involving water quality, flood management, land-use planning and water supply to achieve holistic urban water resilience while working in coordination with other related and tangential projects.
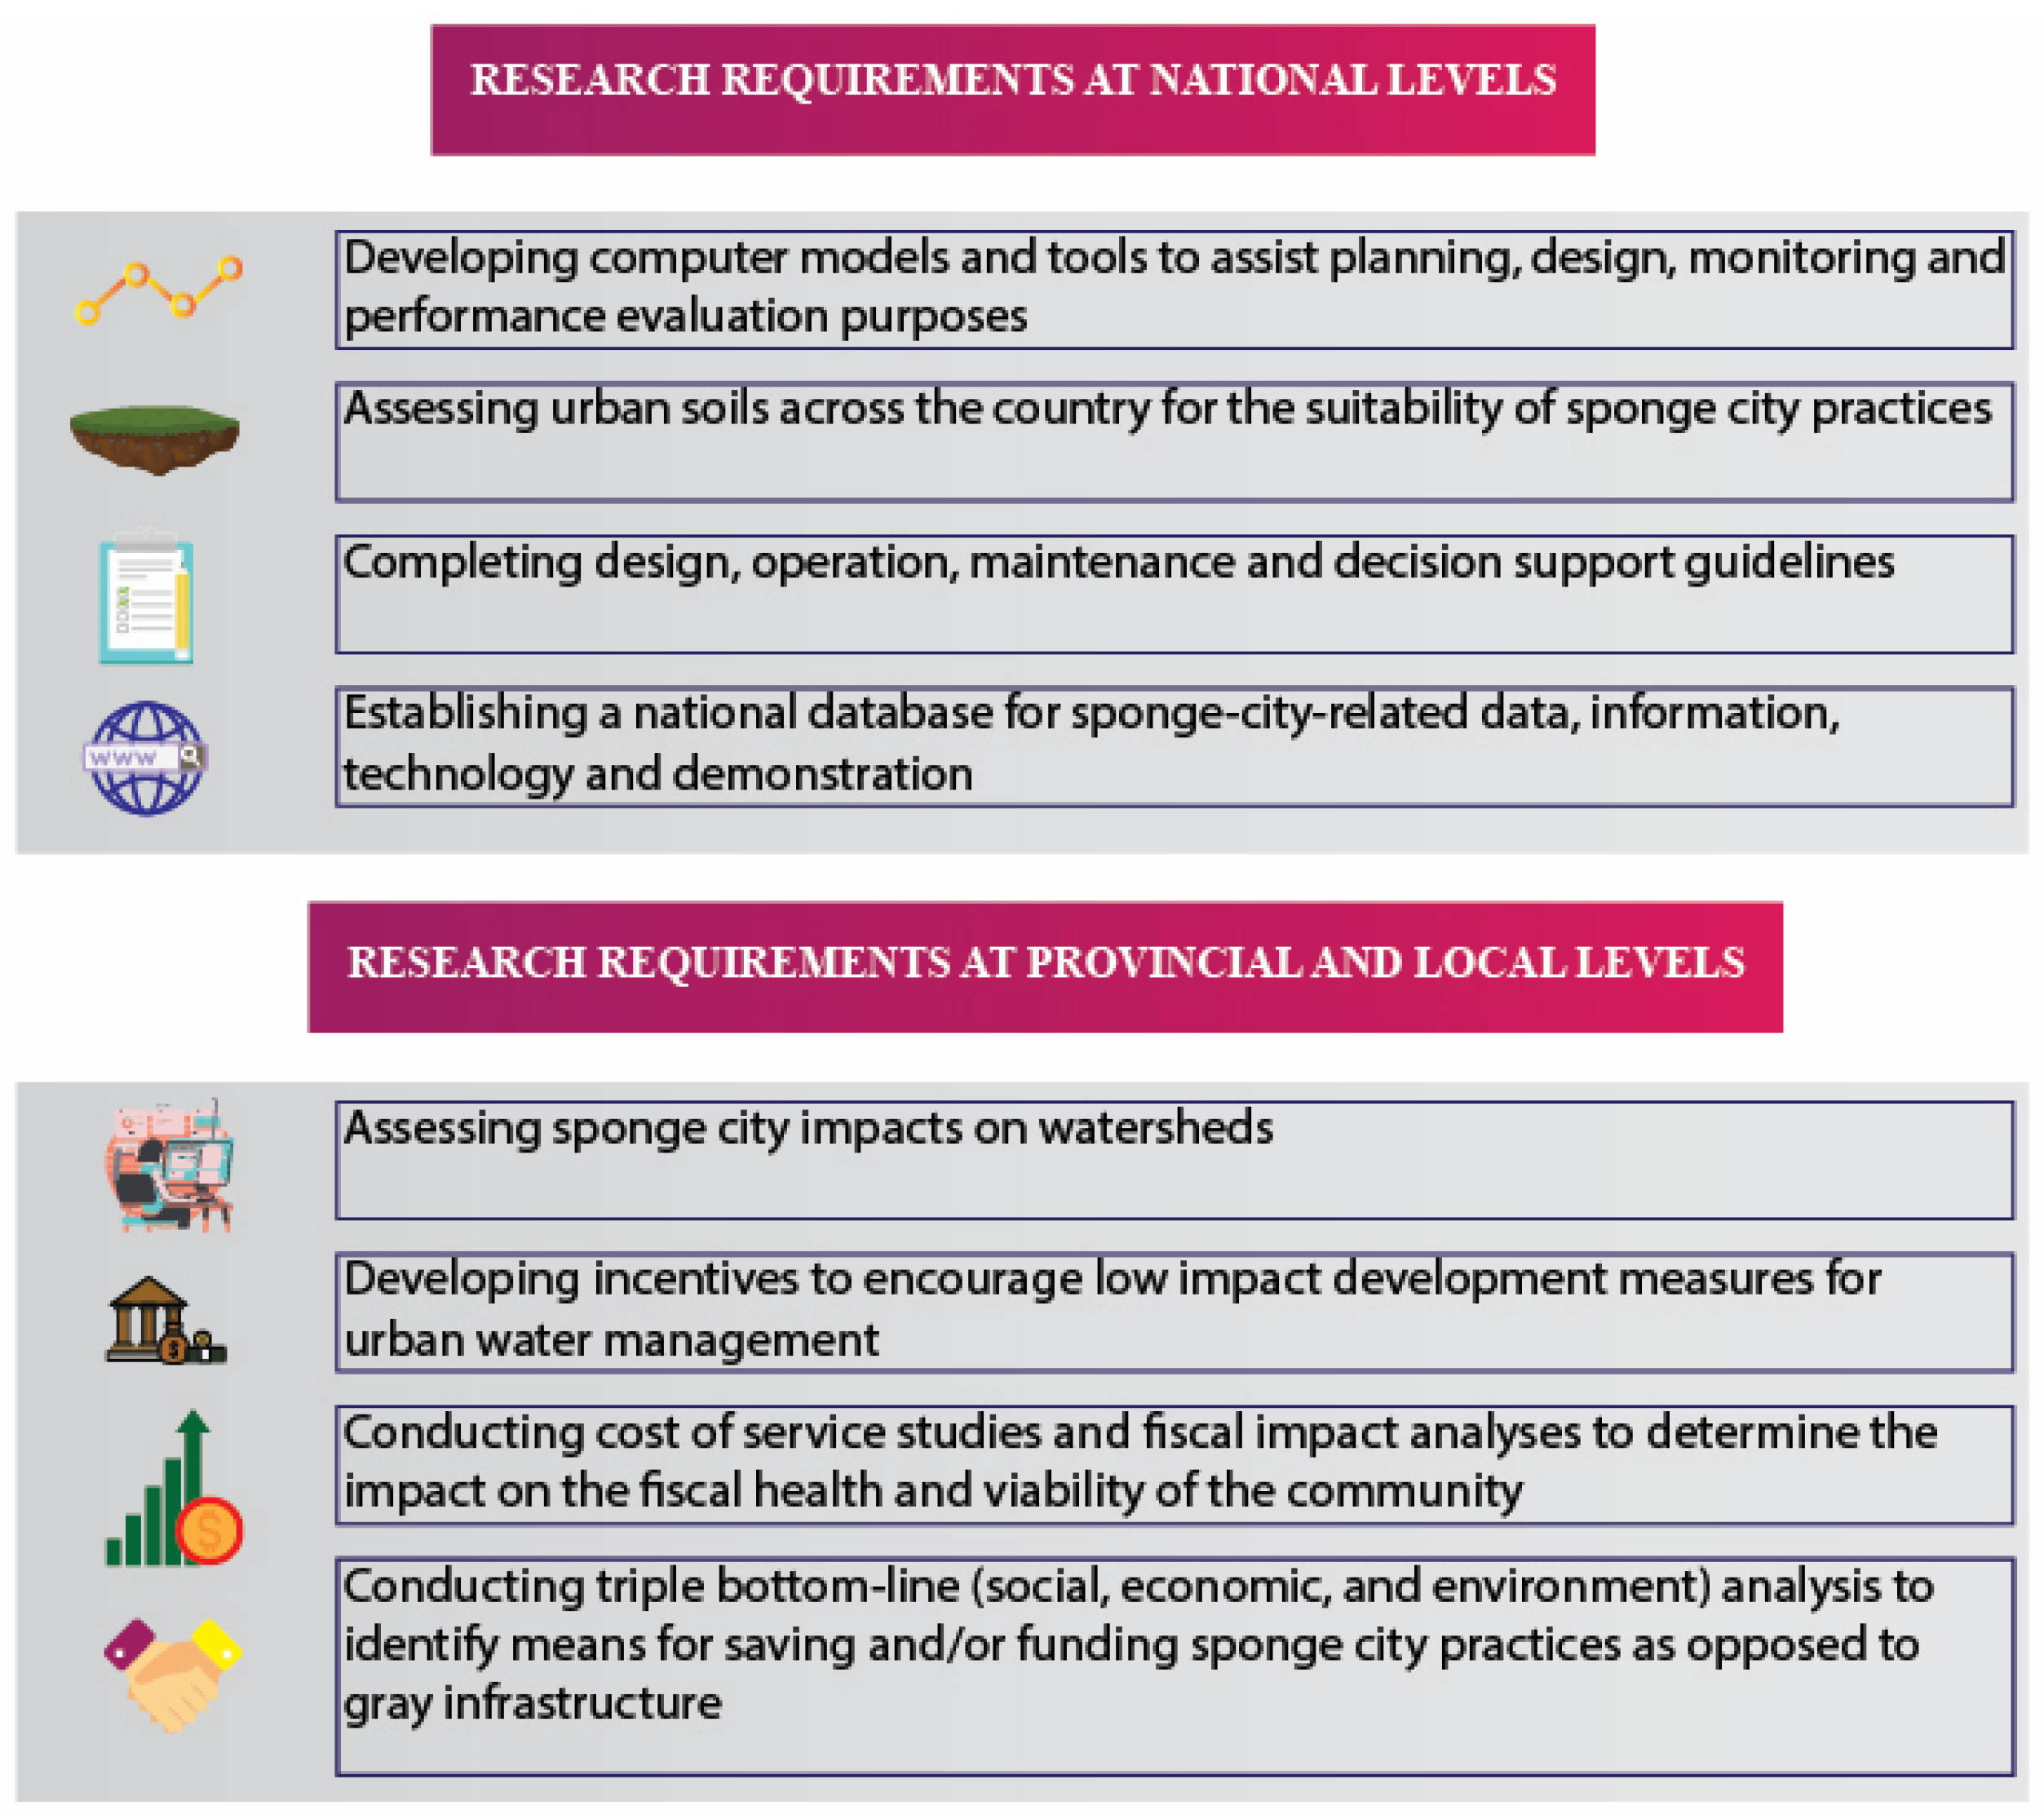
  • It is recommended that countries work on creating or enhancing the available information in open access databases with complete and real-time information of ongoing projects to aid researchers working on these topics and to improve transparency to attract more private companies.
  • Retrospection of projects’ life cycle management may help to decide if providing additional time during the planning phase may further enhance project performance.
  • Sustainability education across all age groups and technical training of green development practices among university students, researchers, policy makers, governmental officials, politicians and municipal workers are both crucial for the seamless planning and execution of these projects.
  • Further customization and localization of LID practices may enhance the success of these projects. Pilot site-based research projects involving scientists may be beneficial to constantly update best local practices, which calls for the creation of research grants and funding funnels to encourage scholarly contribution.
  • To spread the word to all sectors of society, governments can consider recruiting goodwill ambassadors and NGOs with strong public acceptances to eliminate any negative stigma surrounding these projects.
Given that urban flooding continues to be of major concern in most of the countries, coordination and communication between scholarly work and real-time site work need to be periodically represented to relevant decision makers to bring about long-term, practical and sustainable urban water management.

6. Conclusions

A systematic literature review was conducted to trace recent urban flooding cases in India and China, between 2014 and 2020, and their respective flood management approaches were critically analyzed.
This review identifies the following research gaps to be addressed:
  • Provision of a bird’s eye view of urban water management policies and approaches of India including, but not limited to, urban flood mitigation.
  • Information on existing and/or developing public access databases for sponge city projects in China.
  • Creation and public access to water resources and flood report data at city, district, province and state levels in both the countries.
  • Process and stakeholder details in water management policy drafting and frameworks of both countries.
  • Information on pathways for cross-national experience sharing in urban water management with LID and BMP pioneers in the West.
  • Clear studies comparing the effect of LID and SC elements in flood-prone zones before and after the implementation of these structures.
This work hopes to encourage further such comparative global studies to promote mutual learning and knowledge transfer in achieving urban water resilience either through bilateral programs or through detailed cross-boundary case studies and literature reviews.

Author Contributions

N.K.: conceptualization, data curation, formal analysis, writing—original draft preparation. X.L.: funding acquisition, project administration, supervision. S.N.: resources, visualization. K.K.P.: validation, writing—review and editing. All authors have read and agreed to the published version of the manuscript.

Funding

The National Key Research and Development Plan (Grant No. 2018YFC1504801) and the National Natural Science Foundation of China (Grant No. 52079068) are gratefully acknowledged.

Institutional Review Board Statement

Not Applicable.

Informed Consent Statement

Not Applicable.

Data Availability Statement

Not Applicable.

Conflicts of Interest

The authors declare no conflict of interest.

References

  1. Alam, A.; Bhat, M.S.; Farooq, H.; Ahmad, B.; Ahmad, S.; Sheikh, A.H. Flood risk assessment of Srinagar city in Jammu and Kashmir, India. Int. J. Disaster Resil. Built Environ. 2018, 9, 114–129. [Google Scholar] [CrossRef]
  2. Li, L.; Collins, A.M.; Cheshmehzangi, A.; Chan, F.K.S. Identifying enablers and barriers to the implementation of the Green Infrastructure for urban flood management: A comparative analysis of the UK and China. Urban For. Urban Green. 2020, 54, 126770. [Google Scholar] [CrossRef]
  3. Nithila Devi, N.; Sridharan, B.; Bindhu, V.M.; Narasimhan, B.; Bhallamudi, S.M.; Bhatt, C.M.; Usha, T.; Vasan, D.T.; Kuiry, S.N. Investigation of Role of Retention Storage in Tanks (Small Water Bodies) on Future Urban Flooding: A Case Study of Chennai City, India. Water 2020, 12, 2875. [Google Scholar] [CrossRef]
  4. Jameson, S.; Baud, I.S. Varieties of knowledge for assembling an urban flood management governance configuration in Chennai, India. Habitat Int. 2016, 54, 112–123. [Google Scholar] [CrossRef]
  5. Avashia, V.; Garg, A. Implications of land use transitions and climate change on local flooding in urban areas: An assessment of 42 Indian cities. Land Use Policy 2020, 95, 104571. [Google Scholar] [CrossRef]
  6. Xu, Y.S.; Shen, S.L.; Lai, Y.; Zhou, A.N. Design of sponge city: Lessons learnt from an ancient drainage system in Ganzhou, China. J. Hydrol. 2018, 563, 900–908. [Google Scholar] [CrossRef]
  7. Xavier, A.; Manoj, M.G.; Mohankumar, K. On the dynamics of an extreme rainfall event in northern India in 2013. J. Earth Syst. Sci. 2018, 127, 1–13. [Google Scholar] [CrossRef] [Green Version]
  8. Dai, L.; van Rijswick, H.F.; Driessen, P.P.; Keessen, A.M. Governance of the Sponge City Programme in China with Wuhan as a case study. Int. J. Water Resour. Dev. 2018, 34, 578–596. [Google Scholar] [CrossRef]
  9. Jia, S.; Li, Y.; Lü, A.; Liu, W.; Zhu, W.; Yan, J.; Liang, Y.; Xiang, X.; Guan, Z. City storm-flood events in China, 1984–2015. Int. J. Water Resour. Dev. 2019, 35, 605–618. [Google Scholar] [CrossRef]
  10. Moher, D.; Liberati, A.; Tetzlaff, J.; Altman, D.G.; Prisma Group. Preferred Reporting Items for Systematic Reviews and Meta-Analyses: The PRISMA Statement. PLoS Med. 2009, 6, e1000097. [Google Scholar] [CrossRef] [PubMed] [Green Version]
  11. Wadhawan, S.K.; Singh, B.; Ramesh, M.V. Causative factors of landslides 2019: Case study in Malappuram and Wayanad districts of Kerala, India. Landslides 2020, 17, 2689–2697. [Google Scholar] [CrossRef]
  12. Mishra, A.K.; Nagaraju, V. Space-based monitoring of severe flooding of a southern state in India during south-west monsoon season of 2018. Nat. Hazards 2019, 97, 949–953. [Google Scholar] [CrossRef]
  13. Ramasamy, S.M.; Gunasekaran, S.; Rajagopal, N.; Saravanavel, J.; Kumanan, C.J. Flood 2018 and the status of reservoir-induced seismicity in Kerala, India. Nat. Hazards 2019, 99, 307–319. [Google Scholar] [CrossRef]
  14. Kumar, V.; Pradhan, P.K.; Sinha, T.; Rao, S.; Chang, H.P. Interaction of a Low-Pressure System, an Offshore Trough, and Mid-Tropospheric Dry Air Intrusion: The Kerala Flood of August 2018. Atmosphere 2020, 11, 740. [Google Scholar] [CrossRef]
  15. Ryan, C.; Trigg, M.A.; Adarsh, S. An investigation into the impact of reservoir management Kerala floods 2018: A case study of the Kakki reservoir. IOP Conf. Ser. Earth Environ. Sci. 2020, 491, 012005. [Google Scholar] [CrossRef]
  16. Xu, D.; Ouyang, Z.; Wu, T.; Han, B. Dynamic Trends of Urban Flooding Mitigation Services in Shenzhen, China. Sustainability 2020, 12, 4799. [Google Scholar] [CrossRef]
  17. Vemula, S.; Raju, K.S.; Veena, S.S.; Kumar, A.S. Urban floods in Hyderabad, India, under present and future rainfall scenarios: A case study. Nat. Hazards 2019, 95, 637–655. [Google Scholar] [CrossRef]
  18. Jiang, Y.; Zevenbergen, C.; Fu, D. Understanding the challenges for the governance of China’s “sponge cities” initiative to sustainably manage urban stormwater and flooding. Nat. Hazards 2017, 89, 521–529. [Google Scholar] [CrossRef]
  19. Ma, M.; Yu, H.; Wang, H.; Kong, F.; Zhang, K.; Yang, H.; Liu, C.; Liu, Q. Characteristics of Urban Waterlogging and Flash Flood Hazards and Their Integrated Preventive Measures: Case Study in Fuzhou, China. J. Sustain. Water Built Environ. 2018, 4, 05017007. [Google Scholar] [CrossRef]
  20. Yuan, Y.; Xu, Y.S.; Arulrajah, A. Sustainable Measures for Mitigation of Flooding Hazards: A Case Study in Shanghai, China. Water 2017, 9, 310. [Google Scholar] [CrossRef]
  21. Kotal, S.D.; Roy, S.S.; Bhowmik, S.R. Catastrophic heavy rainfall episode over Uttarakhand during 16-18 June 2013-observational aspects. Curr. Sci. 2014, 107, 234–245. [Google Scholar]
  22. Ziegler, A.D.; Wasson, R.J.; Bhardwaj, A.; Sundriyal, Y.P.; Sati, S.P.; Juyal, N.; Nautiyal, V.; Srivastava, P.; Gillen, J.; Saklani, U. Pilgrims, progress, and the political economy of disaster preparedness—The example of the 2013 Uttarakhand flood and Kedarnath disaster. Hydrol. Process. 2014, 28, 5985–5990. [Google Scholar] [CrossRef]
  23. Shekhar, M.S.; Pattanayak, S.; Mohanty, U.C.; Paul, S.; Kumar, M.S. A study on the heavy rainfall event around Kedarnath area (Uttarakhand) on 16 June 2013. J. Earth Syst. Sci. 2015, 124, 1531–1544. [Google Scholar] [CrossRef]
  24. Waghwala, R.K.; Agnihotri, P.G. Flood risk assessment and resilience strategies for flood risk management: A case study of Surat City. Int. J. Disaster Risk Reduct. 2019, 40, 101155. [Google Scholar] [CrossRef]
  25. Griffiths, J.; Chan, F.K.; Shao, M.; Zhu, F.; Higgitt, D.L. Interpretation and application of Sponge City guidelines in China. Philos. Trans. R. Soc. A-Math. Phys. Eng. Sci. 2020, 378, 20190222. [Google Scholar] [CrossRef] [PubMed] [Green Version]
  26. Tang, Y.T.; Chan, F.K.; O’Donnell, E.C.; Griffiths, J.; Lau, L.; Higgitt, D.L.; Thorne, C.R. Aligning ancient and modern approaches to sustainable urban water management in China: Ningbo as a “Blue-Green City” in the “Sponge City” campaign. J. Flood Risk Manag. 2018, 11, e12451. [Google Scholar] [CrossRef]
  27. Fan, X.; Matsumoto, T. Comparative Analysis on Urban Flood Countermeasures Based on Life Cycle Thinking: A Comparison between Enhancing of Drainage Capacity Project and Sponge City. Environments 2020, 7, 51. [Google Scholar] [CrossRef]
  28. Li, H.; Ding, L.; Ren, M.; Li, C.; Wang, H. Sponge City Construction in China: A Survey of the Challenges and Opportunities. Water 2017, 9, 594. [Google Scholar] [CrossRef] [Green Version]
  29. Ma, Y.; Jiang, Y.; Swallow, S. China’s sponge city development for urban water resilience and sus-tainability: A policy discussion. Sci. Total Environ. 2020, 729, 139078. [Google Scholar] [CrossRef]
  30. Jia, H.; Wang, Z.; Zhen, X.; Clar, M.; Shaw, L.Y. China’s Sponge City construction: A discussion on technical approaches. Front. Environ. Sci. Eng. 2017, 11, 18. [Google Scholar] [CrossRef]
  31. Li, Y.; Huang, J.J.; Hu, M.; Yang, H.; Tanaka, K. Design of low impact development in the urban context considering hydrological performance and life-cycle cost. J. Flood Risk Manag. 2020, 13, e12625. [Google Scholar] [CrossRef]
  32. Chan, F.K.; Griffiths, J.A.; Higgitt, D.; Xu, S.; Zhu, F.; Tang, Y.T.; Xu, Y.; Thorne, C.R. “Sponge City” in China-A breakthrough of planning and flood risk management in the urban context. Land Use Policy 2018, 76, 772–778. [Google Scholar] [CrossRef]
  33. Zhang, Y.; Zhao, W.; Chen, X.; Jun, C.; Hao, J.; Tang, X.; Zhai, J. Assessment on the Effectiveness of Urban Stormwater Management. Water 2021, 13, 4. [Google Scholar] [CrossRef]
  34. Lin, M.; Tang, J.; Liu, M. Sponge City Planning of Dalian based on Functional Division of Natural Ecological Environment. Ekoloji 2019, 28, 3557–3567. [Google Scholar]
  35. Bai, Y.; Li, Y.; Zhang, R.; Zhao, N.; Zeng, X. Comprehensive Performance Evaluation System Based on Environmental and Economic Benefits for Optimal Allocation of LID Facilities. Water 2019, 11, 341. [Google Scholar] [CrossRef] [Green Version]
  36. Singh, O.; Kumar, M. Flood occurrences, damages, and management challenges in India: A geographical perspective. Arab. J. Geosci. 2017, 10, 102. [Google Scholar] [CrossRef]
  37. Allen, S.K.; Ballesteros-Canovas, J.; Randhawa, S.S.; Singha, A.K.; Huggel, C.; Stoffel, M. Translating the concept of climate risk into an assessment framework to inform adaptation planning: Insights from a pilot study of flood risk in Himachal Pradesh, Northern India. Environ. Sci. Policy 2018, 87, 1–10. [Google Scholar] [CrossRef]
Figure 1. Conceptual framework of conditional search logics.
Sustainability 13 06346 g001
Figure 2. Systematic literature review framework using PRISMA protocol.
Sustainability 13 06346 g002
Figure 3. Causes for urban floods based on Jiang, Zevenbergen [18].
Sustainability 13 06346 g003
Figure 4. Concept map of the Sponge City Program based on Ma, Jiang [29].
Sustainability 13 06346 g004
Figure 5. Promoting government leadership and inter-agency cooperation based on recommendations by Li, Ding [28].
Sustainability 13 06346 g005
Figure 6. Research requirements at national, provincial and local levels based on Li, Ding [28].
Sustainability 13 06346 g006
Table 1. Details of search strings and Boolean operators used in each condition.
ConditionLogicSearch StringNo. of Results
#1Floods in India[TI = “flood*” AND TI = ((“India”) OR (“Chennai” OR “Cochin” or “Kerala” OR “Delhi” OR “Mumbai” OR “Ahmedabad” OR “Hyderabad” OR “Surat” OR “Jamshedpur” OR “Guwahati”)) AND TI= (“manag*” OR “polic*” OR “stud*”)] OR [AK = “flood*” AND AK = ((“India”) OR (“Chennai” OR “Cochin” or “Kerala” OR “Delhi” OR “Mumbai” OR “Ahmedabad” OR “Hyderabad” OR “Surat” OR “Jamshedpur” OR “Guwahati”)) AND AK= (“manag*” OR “polic*” OR “stud*”)] OR [AB = “flood*” AND AB = ((“India”) OR (“Chennai” OR “Cochin” or “Kerala” OR “Delhi” OR “Mumbai” OR “Ahmedabad” OR “Hyderabad” OR “Surat” OR “Jamshedpur” OR “Guwahati”)) AND AB= (“manag*” OR “polic*” OR “stud*”)]1646
#2Floods in China, sponge citiesTI= (“flood*” AND “sponge cit*”) OR AK= (“flood*” AND “sponge cit*”) OR AB= (“flood*” AND “sponge cit*”)136
#1 AND #21782
#3Water quality, modeling techniques, vegetation-related studiesTI = (“experiment*” OR “lab*” OR “phosp*” OR “pollut*” OR “test*” OR “nitr*” OR “micr*” OR “bacteri*” OR “shed” OR “crop*” OR “agri*” OR “forest*”) OR AB = (“experiment*” OR “lab*” OR “phosp*” OR “pollut*” OR “test*” OR “nitr*” OR “micr*” OR “bacteri*” OR “shed” OR “crop*” OR “agri*” OR “forest*”) OR AK = (“experiment*” OR “lab*” OR “phosp*” OR “pollut*” OR “test*” OR “nitr*” OR “micr*” OR “bacteri*” OR “shed “OR “crop*” OR “agri*” OR “forest*”)17,814,347
(#1 AND #2) NOT #3809
#4Precipitation, runoffTI = (“rain”* OR “storm” OR “flood” OR “runoff” OR “flow” OR “drain” OR “hydr” OR “discharg*”) OR AK = (“rain”* OR “storm” OR “flood” OR “runoff” OR “flow” OR “drain” OR “hydr” OR “discharg*”) OR AB = (“rain”* OR “storm” OR “flood” OR “runoff” OR “flow” OR “drain” OR “hydr” OR “discharg*”)1,150,593
[(#1 AND #2) NOT #3] AND #4653
#5Policies, managementTI = (“manag*” OR “polic*” OR “method*” OR “project*” OR “case stud*” OR “plan” OR “approach” OR “low impact” OR “green” OR “eco” OR “sustain*” OR “techn*” OR “predict*” OR “analy*”) OR AK = (“manag*” OR “polic*” OR “method*” OR “project*” OR “case stud*” OR “plan” OR “approach” OR “low impact” OR “green” OR “eco” OR “sustain*” OR “techn*” OR “predict*” OR “analy*”) OR AB = (“manag*” OR “polic*” OR “method*” OR “project*” OR “case stud*” OR “plan” OR “approach” OR “low impact” OR “green” OR “eco” OR “sustain*” OR “techn*” OR “predict*” OR “analy*”)12,966,312
[( #1 AND #2) NOT #3] AND #4 AND #5608
#6WaterTI = “water*” OR AB = “water*” OR AK= “water*” 1,429,059
[( #1 AND #2) NOT #3] AND #4 AND #5 AND #6417
Table 2. Cases of urban floods in India and China.
City or State of OccurrenceFlood Event(s)Reason(s) for FloodingPrecipitationEconomic LossesLoss of LivesSource
Malappuram and Wayanad districts of Kerala4 to 8 August 2019Landslides triggered during 5 days of excessively heavy rainfall400% over the normal average rainfall>39 houses and a walkover bridge completely washed away81 dead[11]
Kerala14 and 15 August 2018Multi-day extreme rain events during July and August brought an accumulated rainfall of about 1600 mmRainfall range of 270–300 mm. Sometimes witnessed a rainfall intensity of 25 mm/h200 billion USD483 people dead and 50 Lakh people severely affected[12,13]
Kerala: Idukki, Palakkad, Kollam, Kottayam, Malappuram, Ernakulam and Pathanamthitta15 and 16 August 2018Continuous rainfall of more than a week occurred from 9 to 18 August 2018, including a heavy rainfall event from 15 to 16 August~400 mmThousands of houses destroyed500 dead[14]
13 districts in the state of Kerala15 to 17 August 2018~>42% of the normal rainfall was received which combined with most major reservoirs being at 90% capacity or more resulted in an extreme peak discharge 2346.6 mm of rainfall (from 1 June 2018 to 19 August 2018)Widespread damage to over 175,000 buildings433 dead[15]
Shenzhen16 to 17 September 2018Heavy rainfall due to the super Typhoon Mangkhut (strongest typhoon to hit the region since 1983)Accumulated rainfall of 225.5 mmFlooding in many areas across the cityNo info[16]
Hyderabad, Telangana23 September 2016 165 mmINR 10,000,000 (137,839 USD)0[17]
North and South China2016No infoNo info44.7 billion USD300 dead, 60 million impacted and 0.5 million evacuated[18]
Guangzhou10 May 2016Heavy rainstormNo infoNo info>10,000 people affected[6]
Chennai, Tamil NaduDecember 2015Poor maintenance and uncontrolled urbanization resulted in significant loss of storage capacities of the tanks, and this has altered the peak flows in the rivers flowing through the cityNo infoNo infoNo info[3]
Fuzhou, Fujian Province2015Typhoon Sedulous triggered urban waterlogging and flash floods270.5 mm (24 h maximum rainfall)Total loss of 29.36 billion yuan (4.404 billion USD) with 14.8 billion yuan (2.22 billion USD) as direct economic loss; 13.09 km embankment and 1465 irrigation facilities damaged48 million affected[19]
Zheijiang Province2015Rainfall runoff from Typhoon CanhongNo info300 million USD; >10,000 buildings inundatedNo info[20]
Srinagar, Jammu and KashmirSeptember 2014 46% of the city comprising 33 municipal wards was at high flood risk60% of city submerged under water up to 16-feet deep and extended inundation period of approximately 25 days in residential areas No info0.6 million stranded[1]
Himachal Pradesh, Delhi, Haryana, Punjab and Uttarakhand16 to 18 June 2013Interaction of the mid-tropospheric westerlies and lower tropospheric strong southeasterly monsoon current over the regionA very heavy rainfall zone (>6.5 cm to >12.5 cm) to extremely heavy rainfall (more than 24.5 cm).No infoNo info[21]
Uttarakhand2013The collision of an early monsoon with a high latitude system over the South Himalayan Front No infoLosses from preliminary damage ~700 million USD. Losses exceed 3 billion USD once losses due to tourism and rebuilding of transportation networks are includedEstimated death toll of 7000[22]
Kedarnath, Uttarakhand16 June 2013No info325 mmNo info5000 dead and 1,00,000 trapped[23]
Qingyuan county, Liaoning province2012Flash floodsNo info8.96 billion yuan (1.344 billion USD)1151 (either missing or dead)[19]
Beijing21 July 2012No infoNo info10 million yuan (1.5 billion USD), destroyed 8200 homes56,933 evacuated and 79 dead[19]
Zhouqu county, Gansu Province2010Flash floodsNo infoNo info1765 (either missing or dead)[19]
Hyderabad, Telangana8 to 10 August 2008 237 mmINR 4,920,000 (67,817 USD)0[17]
Fuzhou, Fujian Province2005Typhoon Longwang triggered urban waterlogging and flash floods316.4 mm (24 h maximum rainfall)Loss of 35.6 billion yuan (5.34 billion USD); 14,018 houses destroyed221.7 million affected, 52 people dead[19]
Hyderabad, Telangana23 and 24 August 2000Inadequacy of existent Storm water networks to carry above 15–20 mm of rainfall per hour as per design in 2008240 mmINR 13,500,000 (186,083 USD)26[17]
1 Yuan = 0.15 USD; 1 INR = 0.0138 USD.
Table 3. A detailed comparison of China’s National Flash Flood Prevention Project vs. Sponge City Program based on Ma [19].
ParameterNational Flash Flood Prevention ProjectSponge City Program
Problem(s) addressedPrevention of flash floodsUrban waterlogging and addressing water shortage
MethodsNon-structural methods such as investigation and evaluation, monitoring and early warning systems, mass observation and mass preparedness; policies and regulations supplemented by structural elements like design ideas, overall layout, embodiments and key flash flood ditch managementCities should function like sponges in storing, infiltrating and purifying excess rainwater and slowly release water into rivers and soil when needed through the comprehensive planning of urban stormwater runoff’s net storage, use and discharge through structural measures supplemented by planning and management laws
DesignMajorly non-structural methods supported by supplementary structural measuresMajorly structural methods such as environmentally friendly drainage systems, detention ponds, storage barrels, bioretention systems, etc. supported by non-structural methods
Year of initiationNo info2013
Construction/
Conduction period
7 years3 years
Funding28.9 billion overall during 7 years of conduction2.5 billion yuan per city for 3 years
EvaluationNo infoPerformance evaluation and incentive policies
No. of cities2058 counties in 29 provinces and a total of 3.866 million km230 cities
No. of beneficiaries304 million peopleNo info
Highlights and impactsAverage flood-related deaths have been reduced by 680 people per year relative to the period prior to implementation No info
Table 4. A comparison of the salient features of low impact development (LID) and the Sponge City Program (SCP) concepts as described by Jia, Wang [30].
ParameterLIDSponge City
Countries of practiceSeveralChina
Land-use principlesLID technology employs principles such as preserving and recreating natural landscape featuresDeviating from the traditional “rapid-draining” approach, the new paradigm calls for the use of natural processes such as soil and vegetation as part of the urban runoff control strategy
Stormwater management philosophyMinimizing effective imperviousness to create functional and appealing site drainage that treats storm water as a resource rather than a waste productThe “six-word” principle, which includes infiltrate, detain, store, cleanse, use and drain, forms the guidelines for urban storm water management
Holistic urban water management goalsMostly focused on stormwater managementSCP includes as its goals not only effective urban flood control, but also rainwater harvesting, water quality improvement and ecological restoration
Use of green and grey infrastructureLID and GI facilities experience limitations in controlling large or less-frequent storm eventsThe government mandates the integration of green and grey infrastructure required for flood control, water quality improvement and ecological protection and restoration
Table 5. Suggestions to tackle existing challenges of the Sponge City Program based on Jia, Wang [30] and Jiang, Zevenbergen [18].
Governance-Related SuggestionsTechnical SuggestionsFinancial SuggestionsQuality Control, Performance Evaluation and Appraisal-Related SuggestionsKnowledge, Education and Training-Related Suggestions
  • Decentralization of administrative authority properly to local governments can help the local authorities build a tailored and flexible policy approach appropriate for local social, environmental, economic and cultural situations
  • Integration of local land-use planning with SCP
  • Inclusion of SC implementation and performance records in promotion evaluation for local government officials
  • Establishment of a viable SC industry chain through central government’s assistance to related industries
  • Integration of SC elements in initial city master planning
  • Integration of green and grey infrastructures’ planning
  • Enforcement of regulations for water quality similar to the National Pollution Discharge Elimination System (NPDES) and the Total Maximum Daily Load (TMDL) programs used successfully in the United States
  • Development of localized regulations considering local climate, rainfall, ecology and important social and economic factors
  • Provision of detailed technical guidance, including information such as local climate, hydrologic, soil and vegetation
  • Provision of an operational and maintenance instruction manual
  • Promotion of public–private partnerships (PPPs) though a limited liability company (LLC) framework
  • Enforcement of detailed requirements for monitoring and analysis in order to provide quantitative information on facility performance and cost-effectiveness.
  • Issue of performance evaluation and certification of SC products from private companies
  • Inception of an organizational capacity in position that can internally and continuously evaluate, diagnose, guide and correct or improve implementation during its course
  • R&D of SC, LID and GI measures
  • Public engagement: media, public hearing sessions, comment periods for mandates, training sessions for practitioners, etc. are all viable means of letting people know and gaining their support and participation
  • Education at all levels (kindergarten to community colleges)
  • Data collection and knowledge sharing across cities
Publisher’s Note: MDPI stays neutral with regard to jurisdictional claims in published maps and institutional affiliations.

