Abstract
As a regional green industrial policy, the construction of national eco-industrial parks is of great significance to the realization of industrial green transformation, while its environmental effects and mechanisms have not yet been clarified. Using panel data from 308 prefecture-level cities in China from 2003 to 2017, this study takes the establishment of 3 national-level ecological industrial parks as a quasi-natural experiment, also using a time-varying difference in difference model to examine how green industrial policies affect industrial pollution emissions. The study found that the establishment of a national eco-industrial park has significantly reduced industrial sulfur dioxide emissions, and the emission reduction effect has a lag effect and long-term impact. In cities with strong environmental regulations, provincial capitals and municipalities, and cities with a high degree of marketization, eco-industrial parks have better emission reduction effects, while, in cities with greater economic growth incentives and fiscal pressures, eco-industrial parks are difficult to achieve emission reduction effects. The establishment of national eco-industrial parks can reduce industrial pollution emissions by improving pollution treatment efficiency and energy efficiency, as well as promoting industrial agglomeration. China should continue to promote the implementation of green industrial policies, to strengthen the construction of national-level eco-industrial parks at this stage.
1. Introduction
As a global manufacturing power, China’s rapid economic development has inevitably caused serious environmental pollution. Under the goal of high-quality economic development, the realization of industrial green transformation is one of the most important ways to build ecological civilization and realize green development [1]. To promote the construction of ecological civilization in the industrial field and promote the greener development of industry, since the 21st century, China’s central government has taken the lead in carrying out several national eco-industrial park (EIP) construction and transformation projects, providing an important carrier for exploring the win-win goal of industrial development and environmental protection [2]. As a regional green industrial policy, does the establishment of national eco-industrial parks effectively reduce industrial pollution emissions? If so, is the environmental impact of eco-industrial parks differ in different regions due to government behavior? What is the impact mechanism of the eco-industrial parks to achieve green transformation? This paper aims to answer the above questions and evaluate the environmental impact of eco-industrial park policy, which has important practical significance for promoting industrial green transformation, coordinating economic development and environmental protection, and achieving high-quality development in China.
Therefore, based on the economic and environmental data of 308 cities in China from 2003 to 2017, this paper takes three national eco-industrial park policies, namely the National Eco-industrial Demonstration Park policy, Industrial Park Recycling Transformation policy, and Low-carbon Industrial Park policy, as quasi-natural experiments, and uses a time-varying difference-in-difference design to investigate the causal impact of green industrial policy on industrial pollution emissions. The results showed that the establishment of three types of national eco-industrial parks significantly reduced industrial sulfur dioxide emissions. Furthermore, the event study method is introduced to investigate the dynamic effect of national eco-industrial parks on pollution emission. This paper found that the impact of national eco-industrial parks on industrial pollution emission reduction has a lag effect of about 2 years, and has a long-term impact at least in the 8 years. Considering the influence of the relationship between the central government and the local government on the implementation effect of green industrial policy, this paper further tests the government behavior heterogeneities of the establishment of national eco-industrial parks on pollution reduction. In the cities with strong environmental regulation, higher-level (provincial capitals and municipalities directly under the central government) and a high degree of marketization, the emission reduction effect of the eco-industrial park is better, while, in the cities with strong economic growth incentive and financial pressure, the emission reduction effect of the eco-industrial park is weaker. Finally, this paper discusses the direct and indirect impact mechanism of national eco-industrial parks to reduce industrial pollution and finds that EIP can reduce industrial pollution emissions by improving pollution treatment efficiency, improving energy efficiency, and promoting industrial agglomeration.
2. Literature Review
There are three types of literature related to the theme of this paper: first, the policy effect of the eco-industrial park; second, the environmental impact of the establishment of development zone; and third, the empirical research on green industry policy.
2.1. The Evaluation of Policy Effect of Eco-Industrial Park
As an important means to realize the green transformation of industry development, Eco-Industrial Parks (EIP) already have rich practical experience in post-industrialized economies, such as the United States, Japan, and European countries. Experience in the ecological industry in the United States and the Netherlands shows that making full use of regional ecological endowments and providing appropriate government incentives are the keys to the successful operation of EIP [3,4]. Japan’s eco-industrial zone construction plan represented by the Kitakyushu Eco-Town has answered the important question of how the development of eco-industry can be organically integrated with urbanization [5,6]. As representatives of successful transformation, Minamata, Kitakyushu, and Kawasaki have provided an important international experience for the development of green industries [7]. Japan’s experience shows that the key problem to be solved by combining eco-industry with urban development is to establish a highly developed circular industrial system [8,9]. Based on the structural analysis of the practice of modern eco-industrial parks in European countries, the goal of EIP is to realize the harmonious coexistence of economy, environment, and society by opening up the material circulation network [10,11].
Inspired by the international practice of eco-industry, China has realized that eco-industrial parks are of great value to the realization of sustainable industrial development, while there are few works of literature on the eco-industrial park based on the policy evaluation paradigm. An early comparative study based on the EIP pilot projects and found that the total amount and intensity of sulfur dioxide and chemical oxygen demand emissions in the eco-industrial park decreased after its establishment [12]. A recent empirical analysis also shows that eco-industrial park improves environmental performance and promotes a win-win situation between environmental optimization and economic development to a certain extent [13]. Based on urban data, the establishment of eco-industrial parks can promote the economic growth of the city through structural upgrading, government competition, and economic agglomeration [14]. Zhou and Wen regarded the national eco-industrial demonstration park policy as a quasi-natural experiment and found that it significantly improved the green economic efficiency of the city where the park is located [15]. On this basis, in this paper, the other two national eco-industrial park policies (Industrial Park Recycling Transformation and Low-carbon Industrial Park) are further included in the scope of the study, which provides more empirical evidence for the environmental effects of the national eco-industrial park policy. On the other hand, from the perspective of government behavior, this paper discusses the influencing factors of the implementation effect of green industrial policy. Finally, this paper discusses the mechanism of the national eco-industrial park to reduce pollution emissions.
2.2. Environmental Impact of Development Zone Policy
The impact of the national eco-industrial park on industrial pollution is essentially a part of the literature on the environmental effects of development zone policy. The existing literature evaluating development zone policy mainly focuses on its economic impact, and less on the environmental impact [16,17]. The establishment of the development zone may reduce environmental pollution by exerting the positive externality of agglomeration [18,19], but the difference in difference design performed by matching the development zone and the water quality monitoring station data finds that the establishment of the development zone may increase the emission concentration through the scale expansion effect of new enterprises [20]. Hu and Zhou found that national economic and technological development zones promote the improvement of regional environmental performance, and improve the level of environmental governance through technology spillover and demonstration effect [21]. Qiu found that the establishment of the development zone in the eastern region promotes the green innovation of enterprises and has a long-term effect, but damages the incentive of green innovation in the central and western regions [22]. To our knowledge, there is no consensus on the environmental impact of the establishment of the development zone in the literature, partly because there are many kinds of heterogeneous development zone policies, which may lead to different environmental impacts. The implementation objectives of development zone police are different, and the traditional two-phase difference-in-difference design will be easily interfered by other policies. This paper focuses on the national eco-industrial park, a kind of special development zone policy which focuses on promoting the industrial green transformation, and uses time-varying difference-in-difference design and a variety of robustness tests to clarify its causal impact on industrial pollution. In addition, the policy effect of the development zone may be heterogeneous in many aspects, this paper discusses the influencing factors of the development zone policy from the perspective of the economic and political environment of the city where the park is located.
2.3. The Economic and Environmental Impact of Green Industry Policy
In recent years, the theoretical and practical issues of China’s green industrial policy have been concerned [23,24,25], but the empirical research on evaluating the implementation effect of green industry policy is still in its infancy, and failed to reach an agreement on its effectiveness. Some studies have found that green industrial policy has a positive effect on economic development and environmental protection, while some believe that green industrial policy can only promote the strategic behavior of enterprises. Chen et al. studied the implementation effect of green industrial policy on the textile industry of 14 cities in China and found that the green industrial policy, including the establishment of green industrial parks, improved the innovation performance of textile enterprises and reduced the chemical oxygen demand (COD) emission intensity, but the sector-specific green industrial policy had no significant impact on smoke emission [26]. However, Huang and Yuan found that green industry policy can promote enterprises to carry out strategic arbitrage through M&A of supported enterprises [27]. Liu et al. took the Cleaner Production Promotion policy as a quasi-natural experiment and found that the green industrial policy promoted the production efficiency of enterprises through the optimization and upgrading of industrial structure [28]. Generally speaking, there are few empirical studies on the industrial pollution effect of green industrial policy, especially place-based policy, like EIP. This paper contributes to this literature by providing new evidence for how green industrial policy affects industrial pollution emissions from the perspective of eco-industrial park establishment.
3. Institutional Background and Theoretical Hypothesis
3.1. Institutional Background of National Eco-Industrial Park Policy
The practice of industrialized countries shows that industrial parks play an important role in performing the scale effect, synergy effect, and spillover effect of industrial agglomeration [29]. Since China established the first National Economic and Technological Development Zone in 1988, after a period of rapid development and adjustment, China has set up more than 500 national economic development zone projects, which has played an important exemplary role in promoting economic growth, structural upgrading, technological innovation and foreign trade [30]. However, under the background of increasingly severe environmental pollution problems, the industrial park has become the typical representative of industrial pollution problems due to the concentration of a large number of industrial enterprises but lack of corresponding environmental management ability [31]. To promote the coordinated development of environmental protection and industrial development, promoting industrial green transformation has become an important goal of the development of industrial parks [32,33].
Based on the concept of eco industry [34], China has carried out three influential national eco-industrial park construction projects: (1) National Eco-Industrial Demonstration Park—Since 2001, the construction project of the national eco-industrial demonstration park has been officially carried out by the former State Environmental Protection Administration. Since the 11th Five-Year Plan, the project has been jointly promoted by the Ministry of environmental protection, the Ministry of Commerce, and the Ministry of science and technology considering the increasingly severe situation of environmental protection. Up to now, China has officially approved the establishment of 48 national eco-industrial demonstration parks, and there are other 45 parks in the stage of approval for construction. (2) Industrial Park Recycling Transformation Project.—The former State Environmental Protection Administration also launched the pilot demonstration project of Circular Economy Park in 2001; which was renamed as the circular transformation demonstration project of Industrial Park in 2012, led by the National Development and Reform Commission and the Ministry of Finance. At present, 129 industrial parks have been set up in China, covering 30 provinces. (3) Low Carbon Industrial Park Pilot Project.—The project was launched in 2013 and jointly initiated by the National Development and Reform Commission and the Ministry of Industry and Information Technology. So far, 67 low-carbon industrial parks have been set up in 2014 and 2017 in two batches.
In the National Eco-Industrial Park Management Measure issued by the Chinese government, the definition of an eco-industrial park is: a manufacturing and service industry gathering area, through the collaborative management of the environment and reuse, to obtain greater environmental and economic benefits. Through collaboration, the total revenue obtained by the park is greater than the sum of the individual benefits of each company. This kind of collaboration is often referred to as industrial symbiosis, which includes the physical exchange of materials and by-products, and the management of shared water, energy, and waste infrastructure.
The Measure stated that the qualification of an eco-industrial park requires the signing of an environmental compliance commitment. The main contents are: first, to effectively implement environmental protection laws and regulations; second, to commit to the stable discharge of key pollution sources; third, to commit to all enterprises in the park to complete National or local key pollutant total control indicators; finally, an environmental risk management system needs to be established. In these four tasks, the second and third directly require the control of pollutant emission indicators, and the air pollutants represented by industrial sulfur dioxide are the core control indicators of the system.
It can be seen from the documents issued by various ministries and commissions of the central government of China over the years that, on the one hand, the above three major National Eco-Industrial Park projects sharing similar goals were officially launched at a similar time, and the number of approved parks increased year by year. At present, 126 industrial parks have participated in at least one pilot project, and 16 parks belong to the same three pilot projects. On the other hand, the application procedures of the three eco-industrial park projects are roughly the same. First of all, the park shall submit the application or technical report to the leading group for performance verification, and the expert group shall review it, and regular review shall be conducted. The more rigorous approval procedure ensures the effectiveness and long-term effect of the national eco-industrial park policy, to a certain extent, but will also probably delay its emission reduction effect.
To improve the economic and environmental benefits of eco-industrial parks, the competent authorities of national eco-industrial park projects have prepared formal management methods and standard documents to construct a formal evaluating system. The evaluation system can be summarized into four aspects: economic development, pollution control, resource conservation, and management ability. In terms of emission reduction targets, sulfur dioxide is included in the index system in all national pilot eco-industrial parks, which will play a significant role in reducing industrial pollution. Based on the above institutional background, this paper proposes the following theoretical hypotheses:
Hypothesis 1 (H1).
The establishment of national eco-industrial park policies will reduce industrial pollution represented by sulfur dioxide; its effect exists in the long term but also has a certain lag.
As a regional industrial policy led by the central government and performed at the city level, the heterogeneous implementation effect of the national eco-industrial park policy will be affected by government behavior [35]. The main body of green industrial policy implementation-central and local governments-cannot be simply treated as a whole. On the contrary, the interaction and game between governments is an important mechanism for shaping the effect of policies. On the one hand, the central government will provide government subsidies for green industry policies and the establishment of industrial parks in accordance with strategic goals, such as industrial development and environmental protection. However, it may be difficult for the central government to formulate specific plans based on the actual conditions of industries in various regions. On the other hand, the actual implementer of central policy tools is the local government. Based on the decentralization system of the central government, local governments with certain discretionary powers will make adjustments according to local conditions in the process of implementing central policies and formulating local policies. Local governments have local information advantages and can better plan for local development.
The more important issue is that there is a conflict between the central government and local governments in terms of the goals of policy implementation. The central government tends to formulate forward-looking plans, but, since the promotion of local officials depends on performance evaluation indicators, such as the local economic growth rate, local governments will pay more attention to short-term benefits.
In cities with greater pressure on environmental protection, the government will implement environmental regulations more strictly due to environmental performance assessment [36] and will have stronger incentives to improve the environmental governance of eco-industrial parks [37]. In high-level cities, it is easier for the central government to carry out environmental supervision [38], to strengthen the demonstration effect of local eco-industrial parks [39]. “Promotion tournament caused by economic growth performance assessment by the central government will affect the implementation of environmental regulations [40], promote the transfer of pollution emissions nearby, and weaken the emission reduction effect of the eco-industrial park policy [41]. Because of the environmental decentralization of local government and the funding for preferential policies in EIP construction [42], cities with less financial pressure are more able to carry out pollution control, and the motivation for local governments to deregulate regulations is also weak [43]. Higher marketization level is conducive for market-orient environmental regulation tools to exert emission reduction effect [44] and promote the porter effect of achieving win-win between economic growth and environmental benefits [45], as well as can also weaken the negative impact of resource misallocation and bottom-up competition among local governments on implementing environmental regulation policy [46].
Hypothesis 2 (H2).
The emission reduction effect of the eco-industrial park policy will be affected by the behavior of the city’s local government.
3.2. Theoretical Mechanism Analysis
Based on the previous literature and text analysis of eco-industrial park policy, this paper proposes that the national eco-industrial park policy can reduce industrial pollution emissions by strengthening environmental regulation, improving energy efficiency, and promoting industrial agglomeration.
3.2.1. Improving Pollution Treatment Efficiency
As far as the direct mechanism is concerned, on the one hand, the establishment of the eco-industrial park can make the local government regulate the environment more directly and effectively, thus improving pollution treatment efficiency and promote enterprises to reduce pollution [47]. To promote the construction of the eco-industrial park, the local government will increase the investment in environmental governance, especially in industrial pollution governance, and improve the treatment efficiency of pollution emissions by building more centralized pollution treatment infrastructures [48]. The improvement of the industrial pollution treatment system is conducive to the supervision of the real emission behavior of enterprises, and it is convenient for supervisors to use systematic indicators and a vertical supervision system to evaluate the environmental impact of enterprise production [49]. Besides, the establishment of the eco-industrial park has an indirect impact on pollution by strengthening environmental regulation, and, thus, will also improving pollution treatment efficiency. Due to the widespread existence of the “pollution haven” effect in developing countries, the central government’s economic growth performance appraisal and “promotion competition” mechanism make local governments have the motivation of “bottom competition” to relax environmental regulations to attract investment [50]. On the contrary, the evaluation system of the national eco-industrial park introduces multi-dimensional performance appraisal, which brings environmental quality and energy efficiency into the evaluation system with the same status as economic growth. As a result, the establishment of EIP can promote pollution treatment efficiency by strengthening environmental regulation [51].
Hypothesis 3 (H3).
The establishment of the national eco-industrial park will reduce industrial pollution emissions by improving pollution treatment efficiency.
3.2.2. Improving Energy Efficiency
The national eco-industrial park can reduce industrial pollution emission by improving energy efficiency, especially the energy use efficiency. For enterprises entering the park, the government requires regular disclosure of energy use information, and submission of energy-saving planning and technical instructions, to encourage enterprises to turn from end-to-end emission reduction to source governance [52]. On the government side, relying on the construction of the eco-industrial park, the government will allocate special funds to carry out energy-saving technological transformation. Energy-saving measures in the park can be extended to the city through demonstration effect, which can improve energy efficiency and optimize energy structure [53]. In addition, the eco-industrial park can use the comprehensive environmental assessment system and targeted green innovation subsidies to more effectively compensate the cost of saving energy and resources input, thus improving the energy utilization efficiency of enterprises and reduce pollution emissions [54,55].
Hypothesis 4 (H4).
The establishment of the national eco-industrial park policies will reduce industrial pollution emissions by improving energy efficiency.
3.2.3. Promoting Industrial Agglomeration
Finally, as far as the indirect mechanism is concerned, national eco-industrial parks can reduce pollution emissions by improving the degree of industrial agglomeration [56,57]. The establishment of eco-industrial park will play a demonstration role, so the government can implement the regional green industry policy in a unified way [58], and attract enterprises to enter and carry out clean production technology transformation [59] through emission reduction subsidies [60] and tax incentives [61], which is conducive to the spillover of green technology innovation among enterprises with input-output linkage and the improvement of the efficiency of green technology innovation [62,63]. At the same time, EIP can also promote industrial enterprises to produce industrial correlation effect in the park and even in the city where it is located [64], thus promoting industrial agglomeration to play a positive externality of the environment [65], contributing to the decoupling effect between economic growth and environmental pollution, and then reducing pollution emissions [66].
Hypothesis 5 (H5).
The establishment of the national eco-industrial park will reduce industrial pollution by promoting industrial agglomeration.
4. Research Design
4.1. Empirical Model
Because the establishment time of eco-industrial parks in different cities is not the same, this paper adopts the idea of the time-varying difference-in-difference setting [67], the cities with eco-industrial parks were set as the treatment group, and the cities without eco-industrial parks were set as the control group. The model is set as follows:
where i is the city, and t is the year. The core explanatory variable, the national eco-industrial park policy is set as a dummy variable , where is whether the city has established an eco-industrial park; if so, it is 1, otherwise 0; is a time dummy variable, and, if the city establishes an eco-industrial park in year t, the value of is 1, otherwise 0. The explained variable is industrial pollution. β is the regression coefficient in interest. If the β is significantly negative, it means that the establishment of the eco-industrial park reduces the industrial pollution; if the regression coefficient β is significantly positive, it means that the establishment of the eco-industrial park exacerbates the industrial pollution instead. X is a series of control variables, , is the fixed effect of city and time, and is the error term.
4.2. Variable Definition and Data Source
4.2.1. Explanatory Variable
National eco-industrial park policy (EIP). In this paper, three types of national eco-industrial park pilot projects are regarded as quasi-natural experiments to investigate their environmental effects, including the establishment or approval to the construction of the National Eco-industrial Demonstration Park, Low-carbon Industrial Park, and Industrial Park Recycling Transformation. Based on the following reasons, this paper regards the three eco-industrial parks as a unified national eco-industrial park policy for evaluation.
First, although these projects have certain differences, their common goal is to reduce the impact of industry on the environment and improve industrial competitiveness. According to the classification method of the United States Environmental Protection Agency (USEPA), the parks in these projects belong to the category of “eco-industrial parks”. Second, compared with international experience, China has distinct characteristics in promoting the construction of eco-industrial parks, such as a strong top-down approach, the use of uniform standards and procedures, and a huge number of parks. Therefore, because the three types of EIP projects are directly responsible by the central government, and the central government has formulated very similar unified management rules for them, this makes all these eco-industrial park projects established in China are very similar in nature. Finally, as far as the management system is concerned, currently three EIP projects are jointly managed by the Ministry of Environmental Protection of the People’s Republic of China, the Ministry of Finance, and the Development and Reform Commission. Therefore, based on the above reasons, this paper regards these three types of policies as a broad Eco-industrial Park project for evaluation.
For cities that have set up more than one national eco-industrial park project in the study period, considering that previous studies have shown that the number of parks has no significant impact on the policy effect [68], we use the establishment year of the first park to assign the value of .
4.2.2. Explained Variable
Industrial pollution. According to the previous literature and the institutional background of EIP policy, the paper uses industrial sulfur dioxide emissions in log (lnSO2) to measure the environmental pollution in industrial production. The choice of the explanatory variables is mainly based on the following considerations: firstly, coal constitutes the major ingredient in China’s energy structure, thus determining that sulfur dioxide is one of the most important pollution emission indicators in industrial production; secondly, sulfur dioxide will directly affect the air quality, which is the most direct pollutant perceived by the people and, therefore, is the main controlling pollution of the Chinese government. Finally, the current three national eco-industrial park policies all make it clear that sulfur dioxide emissions are one of the most important direct controlling indexes. Considering that the total industrial pollution emission is closely related to the local industrial scale, the industrial sulfur dioxide emission intensity variable is obtained by standardizing the industrial sulfur dioxide emission with the industrial gross output value in the robustness test to eliminate the potential endogeneities caused by industrial production scale.
4.2.3. Control Variables
Referring to the existing literature, this paper also controls other factors affecting the industrial pollution emission at the urban level, including ① economic development level (lnGDP): measured by the logarithm of the actual per capita GDP. Considering the possible Kuznets curve relationship between economic development and environmental pollution, the square term of the real per capita GDP (lnGDP2) is added. ② The degree of opening up (lnFDI) is measured by the logarithm of the actual foreign investment value. ③ Population density (POPDEN) is measured by the ratio of the total population to the land area of the municipal area. ④ Industrial structure (INDUS) is measured by the proportion of total industrial output value to regional GDP.
4.2.4. Data Source and Summary Statistics
The data of the national eco-industrial park is collected manually by the author from the relevant policy documents issued by the Ministry of Ecology and Environment, the National Development and Reform Commission, the Ministry of Finance, and the Ministry of Industry and Information Technology of the people’s Republic of China. Urban pollution emissions and other economic data are mainly from the China Urban Statistical Yearbook, as well as the statistical yearbooks of provinces and cities. By matching the data of the National Eco-industrial Park policy with the data of prefecture-level cities and deleting the missing data, the unbalanced panel data of 308 prefecture-level cities in China from 2003 to 2017 are obtained. GDP is deflated by the consumer price index in 2003. The descriptive statistics of the main variables are shown in Table 1. From the perspective of the mean difference between treatment and control group, the sulfur dioxide emission of cities with national eco-industrial parks is significantly lower than that of cities without national eco-industrial parks, which provides preliminary evidence for the emission reduction effect of national eco-industrial parks, but its causality needs to be further tested.

Table 1.
Descriptive statistics of main variables.
5. Result and Discussion
5.1. Overall Impact of Eco-Industrial Park on Industrial Pollution Emission
According to model (1), we first test the overall impact of the EIP on industrial sulfur dioxide emission, the results are shown in Table 2. The explanatory variables in columns (1)–(4) of Table 2 are in order the establishment of national eco-industrial demonstration park, approval to the construction of the national eco-industrial park, m, recycling transformation of the industrial park, and low-carbon industrial park, respectively. The control variables and the fixed effect of city and time are added.
Table 2.
Overall impact of eco-industrial park on industrial pollution.
The results show that all three kinds of national eco-industrial park policies have significantly reduced the sulfur dioxide emissions of the cities, and there are significant differences in the degree of impact among the three types of parks. The estimated results in columns (1) and (2) show that compared with the cities without national eco-industrial demonstration parks, the industrial sulfur dioxide emissions of the cities established national eco-industrial demonstration parks (EIPp) decreased by 25.3%, while the industrial sulfur dioxide emissions of the cities approved to start the construction (EIPs) decreased by 11.2%. Columns (3) and (4) show the impact of the industrial park recycling transformation (REC) and low-carbon industrial park (LC) on industrial pollution. The estimated results show that the sulfur dioxide emission of cities with industrial park recycling transformation is reduced by 9.9% and that of low-carbon industrial park cities is reduced by 14.2%.
Columns (5) and (6) further examine the relationship between different EIP policies. In column (5), the three types of national eco-industrial park policies are combined into one treatment group, which is the national eco-industrial park policy variable (EIP) in model (1). The results show that the emission of sulfur dioxide in cities with either one of three types of eco-industrial park has been reduced by 8.4%. The treatment group in column (6) is further set as cities with all three kinds of policies (ECL), namely cities with national eco-industrial demonstration park (established or approved to construction), recycling transformation, and low-carbon industrial park simultaneously. The results show that the sulfur dioxide emission of the city with all national eco-industrial park policies is relatively reduced by 38.3%, and the emission reduction effect is stronger than that of the cities with a single national eco-industrial park policy.
In addition, the regression results of other control variables in Table 2 are consistent with the existing conclusions in the literature. The coefficient of regional per capita real GDP (lnGDP) is significantly positive, and its square term (lnGDP2) is significantly negative, which conforms to the inverted “U” relationship of the Environmental Kuznets Curve. The regression coefficient of foreign direct investment (lnFDI) is significantly negative, indicating that the current opening up is conducive to reducing industrial pollution emissions. Population density (POPDEN) and the proportion of secondary industry (INDUS) significantly increased industrial pollution emissions as expected. The regression results of model (1) partially verify Hypothesis 1, that is, the establishment of the national eco-industrial park reduces industrial pollution.
5.2. The Dynamic Effect of the National Eco-Industrial Park on Industrial Pollution
The estimated results of benchmark model (1) can be interpreted as the average treatment effect (ATE) of national eco-industrial parks policy on industrial pollution emissions. To further explore the possible dynamic effect of the eco-industrial park on industrial pollution, this paper establishes model (2) based on the setting of previous literature [69]:
where is a series of dummy variables representing the distance between the time and the first year of EIP’s establishment, specifically: if the eco-industrial park is established in in city i, then is equal to 1; if the distance between year j and the establishment time of the EIP is t, then the is equal to 1, and so forth, to generate all the corresponding dummy variables , where l = 1,…,11. Then, we construct interaction terms of EIP and , and we add all of them to the model (1) to substitute the term to investigate the dynamic effect of the national eco-industrial park during the sample period.
Table 3 reports the estimated results of model (2). In terms of dynamic effect, after the establishment of the eco-industrial park, industrial pollution emissions showed a relatively consistent downward trend, while the regression coefficient of the first two years after the establishment of the EIP did not show enough significance, indicating that there is a certain lag time from the completion of the eco-industrial park to the beginning of its functioning. From the eco-industrial park established for 3 years (EIP_3) to 7 years (EIP_7), according to the regression coefficient, after the eco-industrial park entered the stable operation period, its pollution-reducing effect on industrial pollution emissions was continuously enhanced and significant and reached the peak in the seventh year. In the longer term, after the eighth year (EIP_8), the emission reduction effect of the eco-industrial park began to decline. On the one hand, this may be related to the continuous development of local industry, the dynamic transformation of industrial structure and regional transfer, the proportion and structure of the green industry in the eco-industrial park are gradually stable and will not continue to improve so that its emission reduction effect is no longer significant; on the other hand, only the first batch of cities set up eco-industrial parks last for more than eight years: Within the sample period of this paper, only 11.4% of the national eco-industrial parks have existed for more than 8 years. So, the disappearance of dynamic effect may be related to the sharp decline of the sample size of treatment group after the eighth year.
Table 3.
The dynamic impact of eco-industrial parks on industrial pollution.
The regression results in Table 3 show that there is a time lag and lasting effect of the national eco-industrial park on industrial pollution reduction. The possible reason is that it takes a certain amount of time for enterprises in the park to introduce pollution reduction technologies and update production lines. At the same time, it also takes a certain period of running in for the park to fully play its production coordination and resource recycling functions, energy-saving cooperation among internal enterprises also requires time for negotiation. The existence of a long-term emission reduction effect may be because the approved national eco-industrial park needs to meet a series of binding indicators in terms of pollution emission, and needs to be continuously inspected after its establishment. Therefore, local governments have the motivation to better implement industrial environmental regulation policies, so as for the eco-industrial park to play an exemplary role, thus promoting enterprises to carry out green technology innovation and other ways to achieve the porter effect. The above conclusions verify theoretical hypothesis 1, that is, the emission reduction effects of eco-industrial parks have lagged and long-term dynamic characteristics.
5.3. Heterogeneity Analysis
5.3.1. Heterogeneity of Environmental Regulation Intensity
Due to the differences in industrial scale, structure, and pollution situation between cities, different cities are facing different pressure of emission reduction, which may have a significant impact on the pollution reduction effect of the eco-industrial park. Considering that the environmental regulation policies at the city level reflect the environmental regulation intensity of different cities, this paper selects the “two control zones” policy (sulfur dioxide and acid rain pollution control) approved earlier than the eco-industrial park to investigate the heterogeneous impact of the eco-industrial park on pollution reduction under different environmental regulation intensity. To set the dummy variable (TCZ) for the Two Control Zone policy: if the city i belongs to the Two Control Zone city, it will be assigned 1, otherwise 0. Furthermore, the interaction term between the TCZ and the EIP variable is constructed (did_TCZ), and we add the policy dummy variables and interaction terms to the benchmark model (1).
The estimation results of heterogeneity of environmental regulation intensity are shown in column (1) of Table 4. The results show that the establishment of the national eco-industrial park in cities with TCZ policy has a stronger effect on reducing sulfur dioxide emissions, which may be due to the higher pressure of environmental regulation faced by cities with two control zones policy, stricter the local government will carry out environmental governance in EIP.
Table 4.
The heterogeneous impact of eco-industrial parks on industrial pollution.
5.3.2. Heterogeneity of Urban Hierarchy
Considering the central and local government relationship in China, the administrative level is an important source of differences between cities. Municipalities directly under the central government, provincial capitals, and vice provincial cities not only have a higher level of economic development but also face stronger political constraints. Therefore, as the central government’s environmental governance policy, national eco-industrial parks may have different impacts in cities of different administrative levels. In this regard, this paper constructs the city level dummy variable (city_level) and uses the same method to construct the interaction term (did_citylevel), and we add them to the model (1) for regression. Column (2) of Table 4 shows the estimated results. In cities with higher administrative levels, the establishment of the national eco-industrial park can better reduce industrial sulfur dioxide emissions. This means that the establishment and construction of national eco-industrial parks reflect the environmental protection awareness of the central government, so the emission reduction effect of EIP will be affected by the political constraints faced by the cities.
5.3.3. Heterogeneity of Economic Growth Pressure
If administrative constraints from the central government are an important factor influencing the emission reduction effects of the national eco-industrial park, then from another perspective, when cities face competition from other local governments, their motivation to reduce industrial pollution through the eco-industrial park may be weaker. In this regard, this paper constructs the economic growth pressure variable (growgap): subtract the average growth rate of the province where the city is located from the city’s current economic growth rate and lag it by 1 year. This variable reflects the rank of a city’s economic growth rate in its province. Then, we construct the interaction term (did_growgap) between the economic growth pressure and EIP to explore the heterogeneous impact of eco-industrial parks on industrial pollution emissions under different economic growth pressures.
Column (3) of Table 4 shows the estimation results. The regression coefficient of the interaction term is significantly positive, which means that the greater the economic growth pressure the city faces, the less effective the EIP will control industrial sulfur dioxide pollution emissions. This result is in line with the above inference, that is, economic growth pressure will weaken the emission reduction effect of national eco-industrial parks.
5.3.4. Heterogeneity of Fiscal Pressure
The planning of urban development of the national eco-industrial park will also be affected by the level of local fiscal decentralization. On the one hand, if the local financial pressure is small and the public expenditure budget is abundant, the city is more likely to invest more funds in public good, including the construction of eco-industrial parks to support environmental protection and industrial green development, thereby making the eco-industrial parks more prominent in emission reduction effects. On the other hand, if the city’s financial pressure is high, not only will the government not be able to invest resources to support the construction of eco-industrial parks, it will also lead to various short-term behaviors, such as introducing higher pollution levels of production activities to promote economic growth and raise fiscal taxation, which may weaken the emission reduction effect of the eco-industrial park.
In this regard, this paper constructs the urban fiscal pressure decentralization (gov_er) by calculating the ratio of local general public budget expenditure to income, and the interaction term (did_gov_er) is also constructed. The results are shown in column (4) of Table 4. In cities with high fiscal pressure, eco-industrial parks cannot exert the effect of reducing industrial pollution emissions.
5.3.5. Heterogeneity of Marketization
Finally, the effect of green industrial policy and the pollution emission behavior of enterprises will also be affected by the degree of marketization, and the effect of the national eco-industrial park in reducing pollution emissions may vary under different marketization levels. Since the commonly used marketization index only has data at the provincial level, this paper uses the proportion of the total industrial output value of foreign-invested industrial enterprises in the total industrial output value as a proxy indicator of the level of urban industrial marketization (fdi_ind). At the same time, we construct the interaction term (did_fdi_ind) and add it to the model to examine the heterogeneity effect of eco-industrial parks on industrial pollution emissions under different marketization levels.
The results are shown in column (5) of Table 4. Under the condition of a high degree of marketization, the eco-industrial park has a stronger effect on industrial sulfur dioxide emission reduction. This may be since, in cities with a high degree of marketization, industrial enterprises have less “political connections” and are more compliant with environmental regulations so that eco-industrial parks can better introduce cleaner production technologies to reduce sulfur dioxide emissions. The above conclusions verify theoretical hypothesis 2, that is, the emission reduction effects of the national eco-industrial park are affected by government behaviors.
5.4. Influence Mechanism Analysis
The above empirical results prove that the establishment of the national eco-industrial park can significantly reduce urban industrial sulfur dioxide emissions. Then, the mechanism by which the EIP can reduce industrial pollution remains to be further analyzed. In this regard, this paper adopts the mediation model to test the influence mechanism of the establishment of national eco-industrial parks on industrial pollution emissions [70]:
where are intermediary variables, and the meaning of other variables is the same as that of in model (1). Model (3) tests how the establishment of the national eco-industrial park affects the mediating mechanism variables. If the results are significant, model (4) further adding the mediating variable into model (1), which verifies how the eco-industrial park affects industrial pollution emissions through mediating mechanism variables.
5.4.1. Eco-Industrial Park Reduces Industrial Pollution by Improving Pollution Treatment Efficiency
The key to effectively reducing industrial pollution in eco-industrial parks lies in improving pollution treatment efficiency. By establishing and playing a synergistic effect between enterprises or within enterprises, that is, form an efficient transmission and reuse mechanism of production inputs and materials, EIP could thereby reduce the formation and discharge of industrial pollutants. In terms of end treatment, the eco-industrial park can take the lead in establishing an efficient organization and management system and play a demonstrative effect, thereby reducing the overall industrial pollution discharge of the city. In this regard, the industrial pollutant treatment efficiency (PTE) is used as an intermediate variable to verify this impact mechanism. PTE calculates that the removal of industrial sulfur dioxide divided by the production of industrial sulfur dioxide, that is, the sum of sulfur dioxide removal and emission. Therefore, the value range of PTE is between 0 and 1. The closer the PTE is to 1, the higher the proportion of the treated sulfur dioxide emissions in the total emissions, and the less pollution to the environment.
The regression results of the impact mechanism of pollution treatment rate are shown in columns (1) and (2) of Table 5. Column (1) regresses the pollution treatment on the eco-industrial park. The results show that the establishment of the national eco-industrial park significantly improves the efficiency of industrial pollution treatment. In column (2), the influence mechanism variable and the explanatory variable are added to the regression equation at the same time. The explanatory variable, the national eco-industrial park is still negative but not significant, while the absolute value of the industrial pollution treatment efficiency coefficient of the influence mechanism variable increases, and the significant level increases to 1%. This shows that the establishment of the eco-industrial park is to reduce industrial pollution by a complete mediation effect of improving the efficiency of industrial pollution treatment, thus verifying the theoretical hypothesis 3.
Table 5.
The impact mechanism of eco-industrial park on industrial pollution.
5.4.2. Eco-Industrial Park Reduces Pollution Emission by Improving Energy Efficiency
From the perspective of input efficiency, the national eco-industrial park can reduce pollution emissions by improving the input efficiency of energy resources. Previous studies have found that China’s energy consumption not only depends on output effects but also has obvious structural effects and density effects. Therefore, energy consumption intensity does not directly reflect changes in energy use efficiency [71]. In this regard, the electricity consumption per unit of fixed asset investment is used as the proxy variable of energy use efficiency (EUE) as the intermediary variable to verify this influence mechanism.
The results are shown in columns (3) and (4) of Table 5. Column (3) regresses the energy use efficiency on the eco-industrial park, finding that the eco-industrial park significantly improves the energy use efficiency at the level of 1%; column (4) regresses the sulfur dioxide emission on eco-industrial park and energy use efficiency, and the coefficients are both significantly negative at the level of 1%. This verified Hypothesis 4 that the establishment of eco-industrial parks can reduce industrial pollution by improving energy efficiency.
5.4.3. Eco-Industrial Parks Reduce Pollution Emissions by Increasing Industrial Agglomeration
Existing studies have pointed out that the industrial clusters formed by the establishment of development zones have an impact on pollution emissions, such as promoting green innovation of enterprises and reducing pollution emissions through input-output linking efficiency and demonstration effect. As a kind of green industrial policy, the industrial agglomeration formed by the national eco-industrial park may also have a positive impact on industrial pollution control. In this regard, the industrial entropy is used to measure the industrial agglomeration (LQ) of the regional industry clustering to test this influence mechanism: , where the numerator is the ratio of the total industrial output value of city i to the regional GDP in year t, and the denominator is the ratio of the country’s total industrial output value to the GDP in year t.
The regression results of the influence mechanism of industrial agglomeration are shown in columns (5) to (6) of Table 5. Column (5) regress the industrial agglomeration on the eco-industrial park, and the results show that the establishment of the national eco-industrial park significantly improves the degree of industrial agglomeration; column (6) regress the pollution emissions on the eco-industrial park and industrial agglomeration at the same time, and the coefficients of the eco-industrial park and industrial agglomeration are both significantly negative at the level of 1%. This verified Hypothesis 4 that the establishment of national eco-industrial parks can reduce industrial pollution emissions by increasing the degree of industrial agglomeration.
5.5. Robustness Test
5.5.1. Parallel Trend
The prerequisite for the validity of the difference in difference design is that the treatment group and the control group satisfied the prior parallel trend hypothesis. To test whether the common trend of pollution emission is the same for treatment and control group before the establishment of the eco-industrial park, this paper further constructs ex-ante time dummy variables: first, we calculate the time distance between the current year and the establishing year of the EIP ; then, we generate, each time, dummy variables of the time distance according to variable. Using the current year of establishment of EIP as the base, we add all dummy variables other than the base period to the model (1) to replace the EIP and perform the regression to test for parallel trend.
Figure 1 plots the coefficient of industrial pollution emissions on distance dummy variables. The results show that the coefficients between the treatment group and the control group have no significant difference beforehand the establishment of EIP; thus, the parallel trend is satisfied.
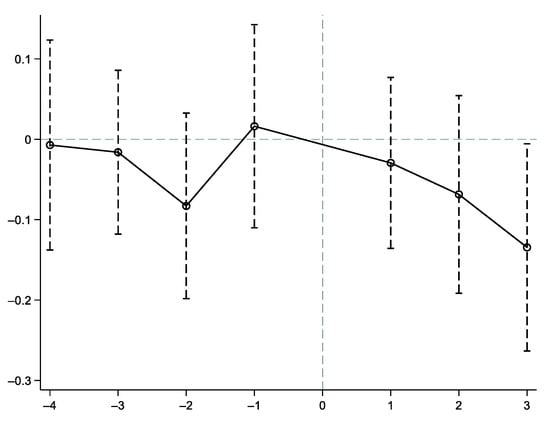
Figure 1.
Parallel trend test.
5.5.2. Propensity Score Matching
The multi-period difference in difference design in this paper satisfies the parallel trend, but the non-random designation of the treatment group may still cause the estimation result to be biased. When the central government approved the establishment of eco-industrial parks, they may comprehensively consider factors, such as geographical differences, economic development, and industrial structure between cities, makes the emission reduction effect of eco-industrial parks comes from the systemic differences between cities that have been approved to establish or construct national eco-industrial parks and cities that have not.
For this reason, this paper adopts the propensity score matching method to solve the self-selection bias caused by non-randomness in the treatment groups. According to the data availability and literatures, this paper selects the following matching variables: the logarithm of the regional GDP and its square term, foreign direct investment in logarithm, population density, industrial structure, fiscal decentralization, environmental regulations (proxied by the logarithm of city sewage charges). In terms of the matching method, to retain as many samples as possible on the premise of ensuring the matching effect, the kernel matching method is used for sample matching [72]. In terms of matching sample selection, this paper separates all data by year and matches a control group for cities that established the eco-industrial park that year [73].
Based on the sample obtained from propensity score matching, we re-regress the model (1) again. The results in column (1) of Table 6 show that the establishment of the national eco-industrial park still reduces industrial pollution, which shows that the emission reduction effects of eco-industrial parks are not disturbed by sample selection bias.
Table 6.
Robustness test.
5.5.3. Exclude the Impact of other Environmental Protection Policies
Since China has been committed to reducing industrial pollution and achieving green transformation since the beginning of this century, the emission reduction effects of national eco-industrial parks may come from the influence of other policies in the same period. By searching policy documents within the time frame studied in this paper, we found that the “Ten Measures for Air Pollution Prevention and Control Policy” promulgated in 2013 may have a covering impact on the emission reduction effects of the national eco-industrial park. Its primary goal is to promote the desulfurization transformation of heavy-polluting industries, strictly control production capacity and strengthen emission restrictions, so it may also curb industrial pollution emissions.
To alleviate the interference of this policy on the effect of EIP, the dummy variable of the policy (PCAP) and EIP were included in the model (1) and performed the regression again. The results in column (2) of Table 6 show that, after controlling the dummy variables of the policy, the emission reduction effect of the national eco-industrial parks is still robust.
5.5.4. Replacing the Explained Variable
Using industrial sulfur dioxide emissions in logarithm as the single explained variable may cause measurement errors. To this end, we replace the explained variable for the robustness test. Here, the logarithm of the sulfur dioxide emission intensity and industrial smoke and dust emissions are used to measure industrial pollution. Columns (3)–(4) of Table 6 show the regression results, respectively, and the core coefficient is still robust after replacing the explained variables.
5.5.5. Placebo Test
The emission reduction effect of the eco-industrial park may come from some random factors or other unobserved policy effects. Therefore, the effectiveness of EIP policy intervention needs to be verified by the placebo test when the difference in difference design is used for causal inference.
Therefore, according to the practice of the placebo test in the literature [74], the treatment group was randomly generated according to the proportion of the treatment group in the sample, following the practice of bootstrap, repeatedly regress the model (1) 200 times. The kernel density of the result is plotted in Figure 2. The results showed that the T values of the result of the random treatment group were mostly distributed around 0, which indicated that the results of the random treatment group were not significant, and their absolute values were less than that of the actual model. This means that the emission reduction effect of the eco-industrial park does not come from random factors and is relatively stable.
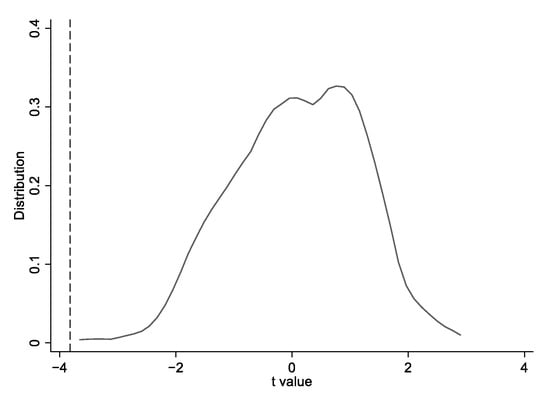
Figure 2.
The kernel density of the placebo test using bootstrap. The vertical dashed line in the figure is the actual t value of the regression result of the model (1).
6. Conclusions
Whether the green industry policy effectively reduces industrial pollution is an important question that China must answer to promote the green transformation of industry and improve the construction of ecological civilization. Using the panel data of 308 prefecture-level cities in China from 2003 to 2017, this paper regards the three national eco-industrial park policies of the National Eco-industrial Demonstration Park, Industrial Park Recycling Transformation, and the Low-Carbon Industrial Park as quasi-natural experiments, and uses a time-varying difference-in-difference model to examine how green industrial policies affect industrial pollution emissions.
The result shows that the establishment of the national eco-industrial park has significantly reduced industrial sulfur dioxide emissions, and the emission reduction effect reflects the dynamic characteristics of the coexistence of a lag effect and a long-term effect. The heterogeneity analysis found that, in cities with strong environmental regulations, provincial capitals and municipalities, and cities with a high degree of marketization, eco-industrial parks have better emission reduction effects, while, in cities with greater economic growth incentives and financial pressures, the emission reduction effect of the eco-industrial park disappear. The impact mechanism analysis found that the establishment of the national eco-industrial park can reduce industrial pollution emissions by improving pollution treatment efficiency, improving energy input efficiency, and promoting industrial agglomeration.
Based on the main conclusions of this paper, the following policy recommendations are put forward.
At present, national eco-industrial parks have played a significant role in reducing industrial pollution. However, the number of China’s eco-industrial parks is still very small, which shows that the construction of eco-industrial parks has huge potential for reducing pollution emissions and yet to be tapped. At this stage, China should continue to promote the implementation of green industrial policies by encouraging the construction of national-level eco-industrial parks, and orderly promoting the transformation of traditional industrial parks into the eco-industrial park.
At the same time, the government needs to establish a more efficient and stable EIP management system to make the eco-industrial park’s emission reduction effect more immediate and lasting.
It should be noted that whether the eco-industrial park can effectively play a role in pollution control is largely related to the local government’s objective choice between economic development and environmental governance. Therefore, providing local governments with incentives for environmental regulation, increasing environmental vertical management mechanisms in low-level prefecture-level cities, and establishing a high-level market economy system are key arrangements for further exerting the EIP emission reduction effect. In addition, the central government needs to weaken the local government’s dilemma between economic development and environmental governance and set up special fiscal transfer payments for the development of eco-industry to improve local governments’ willingness to protect the environment.
Finally, in terms of catalyzing the emission reduction effects of eco-industrial parks, the government also needs to continue to increase the construction of environmental infrastructures, such as pollutant treatment facilities and garbage recycling facilities. In terms of energy efficiency, an energy recycling system can be introduced in the eco-industrial park to increase energy technology input. Finally, in terms of industrial spatial layout, the government should continue to give play to the environmental externalities of industrial agglomeration to reduce pollution emissions and control the diffusion of pollutants to achieve green, circular, and sustainable industrial development.
This paper is a preliminary attempt to assess the environmental impact of China’s eco-industrial park construction employing program evaluation design. Under the constraints of data availability, the complexity of policy implementation, and government transparency, this paper only examines the effect of EIP in terms of emission reduction (Reduce), but it is unable to conduct an in-depth analysis of the circular economy efficiency (Reuse and Recycling) of eco-industrial parks. At present, the advanced practices of eco-industry represented by Japan’s Eco-Town project aim at realizing 3R (Reduce, Reuse, and Recycling) by achieving the complete recycling of material utilization, the sustainability of industrial agglomeration, and the continuous progress of environmental technology. The solution of these key issues in China requires further in-depth research.
Author Contributions
Conceptualization, L.S. and X.Z.; methodology, L.S.; software, L.S.; validation, L.S. and X.Z.; formal analysis, L.S.; resources, X.Z.; data curation, X.Z.; writing—original draft preparation, L.S.; writing—review and editing, X.Z.; supervision, X.Z. All authors contributed to writing the paper. All authors have read and agreed to the published version of the manuscript.
Funding
This research was funded by Major project funding for social science research base in Fujian province social science planning (FJ2020MJD2015).
Institutional Review Board Statement
Not applicable.
Informed Consent Statement
Not applicable.
Data Availability Statement
The datasets generated during and/or analyses during the current study are available in the http://www.stats.gov.cn/ (accessed on 23 March 2021).
Conflicts of Interest
The authors declare no conflict of interest.
References
- Hou, J.; Teo, T.S.; Zhou, F.; Lim, M.K.; Chen, H. Does Industrial Green Transformation Successfully Facilitate a Decrease in Carbon Intensity in China? An Environmental Regulation Perspective. J. Clean. Prod. 2018, 184, 1060–1071. [Google Scholar] [CrossRef]
- Zeng, D.Z.; Cheng, L.; Shi, L.; Luetkenhorst, W. China’s Green Transformation through Eco-Industrial Parks. World Dev. 2021, 140, 105249. [Google Scholar] [CrossRef]
- Heeres, R.R.; Vermeulen, W.J.V.; de Walle, F.B. Eco-Industrial Park Initiatives in the USA and the Netherlands: First Lessons. J. Clean. Prod. 2004, 12, 985–995. [Google Scholar] [CrossRef]
- Gibbs, D.; Deutz, P. Reflections on Implementing Industrial Ecology through Eco-Industrial Park Development. J. Clean. Prod. 2007, 15, 1683–1695. [Google Scholar] [CrossRef]
- Van Berkel, R.; Fujita, T.; Hashimoto, S.; Geng, Y. Industrial and Urban Symbiosis in Japan: Analysis of the Eco-Town Program 1997–2006. J. Environ. Manag. 2009, 90, 1544–1556. [Google Scholar] [CrossRef] [PubMed]
- Shiroyama, H.; Kajiki, S. Case Study of Eco-town Project in Kitakyushu: Tension among Incumbents and the Transition from Industrial City to Green City. In Governance of Urban Sustainability Transitions: European and Asian Experiences; Loorbach, D., Wittmayer, J.M., Shiroyama, H., Fujino, J., Mizuguchi, S., Eds.; Theory and Practice of Urban Sustainability Transitions; Springer: Tokyo, Japan, 2016; pp. 113–132. ISBN 978-4-431-55426-4. [Google Scholar]
- Low, M. Eco-Cities in Japan: Past and Future. J. Urban Technol. 2013, 20, 7–22. [Google Scholar] [CrossRef]
- Ohnishi, S.; Fujita, T.; Chen, X.; Fujii, M. Econometric Analysis of the Performance of Recycling Projects in Japanese Eco-Towns. J. Clean. Prod. 2012, 33, 217–225. [Google Scholar] [CrossRef]
- Ohnishi, S.; Fujii, M.; Fujita, T.; Matsumoto, T.; Dong, L.; Akiyama, H.; Dong, H. Comparative Analysis of Recycling Industry Development in Japan Following the Eco-Town Program for Eco-Industrial Development. J. Clean. Prod. 2016, 114, 95–102. [Google Scholar] [CrossRef]
- Valenzuela-Venegas, G.; Vera-Hofmann, G.; Díaz-Alvarado, F.A. Design of Sustainable and Resilient Eco-Industrial Parks: Planning the Flows Integration Network through Multi-Objective Optimization. J. Clean. Prod. 2020, 243, 118610. [Google Scholar] [CrossRef]
- Genc, O.; van Capelleveen, G.; Erdis, E.; Yildiz, O.; Yazan, D.M. A Socio-Ecological Approach to Improve Industrial Zones towards Eco-Industrial Parks. J. Environ. Manag. 2019, 250, 109507. [Google Scholar] [CrossRef]
- Tian, J.; Liu, W.; Lai, B.; Li, X.; Chen, L. Study of the Performance of Eco-Industrial Park Development in China. J. Clean. Prod. 2014, 64, 486–494. [Google Scholar] [CrossRef]
- Fan, Y.; Bai, B.; Qiao, Q.; Kang, P.; Zhang, Y.; Guo, J. Study on Eco-Efficiency of Industrial Parks in China Based on Data Envelopment Analysis. J. Environ. Manag. 2017, 192, 107–115. [Google Scholar] [CrossRef]
- Pu, L.; Ding, J.F.; Liu, C. Does national eco-industrial park boost urban economic growth? Empirical evidence based on DID. Ind. Econ. Res. 2021, 56–69. [Google Scholar] [CrossRef]
- Zhou, F.X.; Wen, H.W. Green Industrial Agglomeration and Quality of Urban Industrial Development: Evidence from the National Eco-industrial Park Policy. Ind. Econ. Rev. 2019, 10, 5–19. [Google Scholar]
- Yang, D.Y.-R.; Wang, H.-K. Dilemmas of Local Governance under the Development Zone Fever in China: A Case Study of the Suzhou Region. Urban Stud. 2008, 45, 1037–1054. [Google Scholar] [CrossRef]
- Wei, Y.D. Zone Fever, Project Fever: Development Policy, Economic Transition, and Urban Expansion in China. Geogr. Rev. 2015, 105, 156–177. [Google Scholar] [CrossRef]
- Geng, Y.; Liu, Z.; Xue, B.; Dong, H.; Fujita, T.; Chiu, A. Emergy-Based Assessment on Industrial Symbiosis: A Case of Shenyang Economic and Technological Development Zone. Environ. Sci. Pollut. Res. 2014, 21, 13572–13587. [Google Scholar] [CrossRef]
- Butturi, M.A.; Lolli, F.; Sellitto, M.A.; Balugani, E.; Gamberini, R.; Rimini, B. Renewable Energy in Eco-Industrial Parks and Urban-Industrial Symbiosis: A Literature Review and a Conceptual Synthesis. Appl. Energy 2019, 255, 113825. [Google Scholar] [CrossRef]
- Wang, B.; Nie, X. Industrial Agglomeration and Environmental Governance: The Power or Resistance—Evidence from a Quasi-Natural Experiment of Establishment of the Development Zone. Chin. Ind. Econ 2016, 12, 75–89. [Google Scholar]
- Hu, Q.G.; Zhou, Y.F. Environmental performance of development zones with industrial agglomeration: Aggravating pollution or promoting governance? China Popul. Resour. Environ. 2020, 30, 64–72. [Google Scholar]
- Qiu, Y.D. Development Zone Establishment, Regional Bias and Enterprise Green Innovation. J. Shanghai Univ. Financ. Econ. 2020, 30, 64–72. [Google Scholar]
- Rodrik, D. Green Industrial Policy. Oxf. Rev. Econ. Policy 2014, 30, 469–491. [Google Scholar] [CrossRef]
- Altenburg, T.; Assmann, C.; Rodrik, D.; Padilla, E.; Ambec, S.; Esposito, M.; Haider, A.; Semmler, W.; Samaan, D.; Cosbey, A. Green Industrial Policy: Concept, Policies, Country Experiences; United Nations Environment Programme: Nairobi, Kenya, 2017. [Google Scholar]
- Harrison, A.; Martin, L.A.; Nataraj, S. Green Industrial Policy in Emerging Markets. Annu. Rev. Resour. Econ. 2017, 9, 253–274. [Google Scholar] [CrossRef]
- Chen, L.; Zhou, R.; Chang, Y.; Zhou, Y. Does Green Industrial Policy Promote the Sustainable Growth of Polluting Firms? Evidences from China. Sci. Total Environ. 2021, 764, 142927. [Google Scholar] [CrossRef] [PubMed]
- Huang, W.N.; Yuan, T.R. Substantive Transformation and Upgrading or Strategic Policy Arbitrage—Research on the Impact of Green Industry Policy on Green M&As of Industrial Enterprises. J. Shanxi Univ. Financ. Econ. 2021, 43, 56–67. [Google Scholar]
- Liu, P.; Huang, W.-C.; Chen, H. Can the National Green Industrial Policy Improve Production Efficiency of Enterprises?—Evidence from China. Sustainability 2020, 12, 6839. [Google Scholar] [CrossRef]
- Yu, F.; Han, F.; Cui, Z. Evolution of Industrial Symbiosis in an Eco-Industrial Park in China. J. Clean. Prod. 2015, 87, 339–347. [Google Scholar] [CrossRef]
- Li, L.X.; Shen, G.J. Special Economic Zones, Comparative Advantage, and Industrial Structural Transformation. China Econ. Q. 2015, 14, 885–910. [Google Scholar]
- Han, X.; Sun, T.; Cao, T. Study on Environmental Pollution Loss Measurement Method of Waste Gas Emits in Nanjing MV Industrial Park. Environ. Sci. Pollut. Res. 2020, 27, 16539–16553. [Google Scholar] [CrossRef]
- Wen, Z.; Hu, Y.; Lee, J.C.K.; Luo, E.; Li, H.; Ke, S. Approaches and Policies for Promoting Industrial Park Recycling Transformation (IPRT) in China: Practices and Lessons. J. Clean. Prod. 2018, 172, 1370–1380. [Google Scholar] [CrossRef]
- Hong, H.; Gasparatos, A. Eco-Industrial Parks in China: Key Institutional Aspects, Sustainability Impacts, and Implementation Challenges. J. Clean. Prod. 2020, 274, 122853. [Google Scholar] [CrossRef]
- van Beers, D.; Tyrkko, K.; Flammini, A.; Barahona, C.; Susan, C. Results and Lessons Learned from Assessing 50 Industrial Parks in Eight Countries against the International Framework for Eco-Industrial Parks. Sustainability 2020, 12, 611. [Google Scholar] [CrossRef]
- Li, B.; Wu, S. Effects of Local and Civil Environmental Regulation on Green Total Factor Productivity in China: A Spatial Durbin Econometric Analysis. J. Clean. Prod. 2017, 153, 342–353. [Google Scholar] [CrossRef]
- Yu, Y.; Zhou, L.; Zhou, W.; Ren, H.; Kharrazi, A.; Ma, T.; Zhu, B. Decoupling Environmental Pressure from Economic Growth on City Level: The Case Study of Chongqing in China. Ecol. Indic. 2017, 75, 27–35. [Google Scholar] [CrossRef]
- Zheng, W.; Chen, P. The Political Economy of Air Pollution: Local Development, Sustainability, and Political Incentives in China. Energy Res. Soc. Sci. 2020, 69, 101707. [Google Scholar] [CrossRef]
- Hao, Y.; Deng, Y.; Lu, Z.-N.; Chen, H. Is Environmental Regulation Effective in China? Evidence from City-Level Panel Data. J. Clean. Prod. 2018, 188, 966–976. [Google Scholar] [CrossRef]
- Yu, C.; Dijkema, G.P.; de Jong, M. What Makes Eco-Transformation of Industrial Parks Take Off in China? J. Ind. Ecol. 2015, 19, 441–456. [Google Scholar] [CrossRef]
- Sheng, J.; Webber, M.; Han, X. Governmentality within China’s South-North Water Transfer Project: Tournaments, Markets and Water Pollution. J. Environ. Policy Plan. 2018, 20, 533–549. [Google Scholar] [CrossRef]
- Feng, T.; Du, H.; Lin, Z.; Zuo, J. Spatial Spillover Effects of Environmental Regulations on Air Pollution: Evidence from Urban Agglomerations in China. J. Environ. Manag. 2020, 272, 110998. [Google Scholar] [CrossRef]
- Wu, H.; Hao, Y.; Ren, S. How Do Environmental Regulation and Environmental Decentralization Affect Green Total Factor Energy Efficiency: Evidence from China. Energy Econ. 2020, 91, 104880. [Google Scholar] [CrossRef]
- Bai, J.; Lu, J.; Li, S. Fiscal Pressure, Tax Competition and Environmental Pollution. Environ. Resour. Econ. 2019, 73, 431–447. [Google Scholar] [CrossRef]
- Sun, W.; Chen, Z.; Wang, D. Can Land Marketization Help Reduce Industrial Pollution? Int. J. Environ. Res. Public Health 2019, 16, 2213. [Google Scholar] [CrossRef] [PubMed]
- Wang, X.; Zhang, C.; Zhang, Z. Pollution Haven or Porter? The Impact of Environmental Regulation on Location Choices of Pollution-Intensive Firms in China. J. Environ. Manag. 2019, 248, 109248. [Google Scholar] [CrossRef]
- Bian, Y.; Song, K.; Bai, J. Market Segmentation, Resource Misallocation and Environmental Pollution. J. Clean. Prod. 2019, 228, 376–387. [Google Scholar] [CrossRef]
- Du, W.; Li, M. Assessing the Impact of Environmental Regulation on Pollution Abatement and Collaborative Emissions Reduction: Micro-Evidence from Chinese Industrial Enterprises. Environ. Impact Assess. Rev. 2020, 82, 106382. [Google Scholar] [CrossRef]
- Chang, L.; Li, W.; Lu, X. Government Engagement, Environmental Policy, and Environmental Performance: Evidence from the Most Polluting Chinese Listed Firms. Bus. Strategy Environ. 2015, 24, 1–19. [Google Scholar] [CrossRef]
- Greenstone, M.; He, G.; Jia, R.; Liu, T. Can Technology Solve the Principal-Agent Problem? Evidence from China’s War on Air Pollution; National Bureau of Economic Research: Cambridge, MA, USA, 2020. [Google Scholar]
- Zheng, S.; Kahn, M.E.; Sun, W.; Luo, D. Incentives for China’s Urban Mayors to Mitigate Pollution Externalities: The Role of the Central Government and Public Environmentalism. Reg. Sci. Urban Econ. 2014, 47, 61–71. [Google Scholar] [CrossRef]
- Cao, X.; Kostka, G.; Xu, X. Environmental Political Business Cycles: The Case of PM2. 5 Air Pollution in Chinese Prefectures. Environ. Sci. Policy 2019, 93, 92–100. [Google Scholar] [CrossRef]
- Kosajan, V.; Chang, M.; Xiong, X.; Feng, Y.; Wang, S. The Design and Application of a Government Environmental Information Disclosure Index in China. J. Clean. Prod. 2018, 202, 1192–1201. [Google Scholar] [CrossRef]
- Lu, Y.; Wang, Y.; Zhang, W.; Hubacek, K.; Bi, F.; Zuo, J.; Jiang, H.; Zhang, Z.; Feng, K.; Liu, Y. Provincial Air Pollution Responsibility and Environmental Tax of China Based on Interregional Linkage Indicators. J. Clean. Prod. 2019, 235, 337–347. [Google Scholar] [CrossRef]
- Gramkow, C.; Anger-Kraavi, A. Could Fiscal Policies Induce Green Innovation in Developing Countries? The Case of Brazilian Manufacturing Sectors. Clim. Policy 2018, 18, 246–257. [Google Scholar] [CrossRef]
- Tang, K.; Qiu, Y.; Zhou, D. Does Command-and-Control Regulation Promote Green Innovation Performance? Evidence from China’s Industrial Enterprises. Sci. Total Environ. 2020, 712, 136362. [Google Scholar] [CrossRef]
- Wang, Y.; Wang, J. Does Industrial Agglomeration Facilitate Environmental Performance: New Evidence from Urban China? J. Environ. Manag. 2019, 248, 109244. [Google Scholar] [CrossRef]
- Liu, S.; Zhu, Y.; Du, K. The Impact of Industrial Agglomeration on Industrial Pollutant Emission: Evidence from China under New Normal. Clean Technol. Environ. Policy 2017, 19, 2327–2334. [Google Scholar] [CrossRef]
- Yuan, Q.; Yang, D.; Yang, F.; Luken, R.; Saieed, A.; Wang, K. Green Industry Development in China: An Index Based Assessment from Perspectives of Both Current Performance and Historical Effort. J. Clean. Prod. 2020, 250, 119457. [Google Scholar] [CrossRef]
- Zhang, D.; Zheng, W. Less Financial Constraints, More Clean Production? New Evidence from China. Econ. Lett. 2019, 175, 80–83. [Google Scholar] [CrossRef]
- Yi, Y.; Li, J. The Effect of Governmental Policies of Carbon Taxes and Energy-Saving Subsidies on Enterprise Decisions in a Two-Echelon Supply Chain. J. Clean. Prod. 2018, 181, 675–691. [Google Scholar]
- Song, M.; Wang, S.; Zhang, H. Could Environmental Regulation and R&D Tax Incentives Affect Green Product Innovation? J. Clean. Prod. 2020, 258, 120849. [Google Scholar]
- Jiao, J.; Chen, C.; Bai, Y. Is Green Technology Vertical Spillovers More Significant in Mitigating Carbon Intensity? Evidence from Chinese Industries. J. Clean. Prod. 2020, 257, 120354. [Google Scholar] [CrossRef]
- Li, J.; Du, Y. Spatial Effect of Environmental Regulation on Green Innovation Efficiency: Evidence from Prefectural-Level Cities in China. J. Clean. Prod. 2021, 286, 125032. [Google Scholar] [CrossRef]
- Zhang, M.; Sun, X.; Wang, W. Study on the Effect of Environmental Regulations and Industrial Structure on Haze Pollution in China from the Dual Perspective of Independence and Linkage. J. Clean. Prod. 2020, 256, 120748. [Google Scholar] [CrossRef]
- Hong, Y.; Lyu, X.; Chen, Y.; Li, W. Industrial Agglomeration Externalities, Local Governments’ Competition and Environmental Pollution: Evidence from Chinese Prefecture-Level Cities. J. Clean. Prod. 2020, 277, 123455. [Google Scholar] [CrossRef]
- Wang, Q.; Jiang, R.; Zhan, L. Is Decoupling Economic Growth from Fuel Consumption Possible in Developing Countries?—A Comparison of China and India. J. Clean. Prod. 2019, 229, 806–817. [Google Scholar] [CrossRef]
- Beck, T.; Levine, R.; Levkov, A. Big Bad Banks? The Winners and Losers from Bank Deregulation in the United States. J. Financ. 2010, 65, 1637–1667. [Google Scholar] [CrossRef]
- Liu, W.; Shi, H.-B.; Zhang, Z.; Tsai, S.-B.; Zhai, Y.; Chen, Q.; Wang, J. The Development Evaluation of Economic Zones in China. Int. J. Environ. Res. Public Health 2018, 15, 56. [Google Scholar] [CrossRef]
- Nunn, N.; Qian, N. The Potato’s Contribution to Population and Urbanization: Evidence from a Historical Experiment. Q. J. Econ. 2011, 126, 593–650. [Google Scholar] [CrossRef]
- Baron, R.M.; Kenny, D.A. The Moderator–Mediator Variable Distinction in Social Psychological Research: Conceptual, Strategic, and Statistical Considerations. J. Personal. Soc. Psychol. 1986, 51, 1173. [Google Scholar] [CrossRef]
- Velasco-Fernández, R.; Dunlop, T.; Giampietro, M. Fallacies of Energy Efficiency Indicators: Recognizing the Complexity of the Metabolic Pattern of the Economy. Energy Policy 2020, 137, 111089. [Google Scholar] [CrossRef]
- Becker, S.O.; Ichino, A. Estimation of Average Treatment Effects Based on Propensity Scores. Stata J. 2002, 2, 358–377. [Google Scholar] [CrossRef]
- Lu, J. The Performance of Performance-Based Contracting in Human Services: A Quasi-Experiment. J. Public Adm. Res. Theory 2016, 26, 277–293. [Google Scholar] [CrossRef]
- Liu, Q.; Lu, Y. Firm Investment and Exporting: Evidence from China’s Value-Added Tax Reform. J. Int. Econ. 2015, 97, 392–403. [Google Scholar] [CrossRef]
Publisher’s Note: MDPI stays neutral with regard to jurisdictional claims in published maps and institutional affiliations. |
© 2021 by the authors. Licensee MDPI, Basel, Switzerland. This article is an open access article distributed under the terms and conditions of the Creative Commons Attribution (CC BY) license (https://creativecommons.org/licenses/by/4.0/).