1. Introduction
Since the early 2000s, many member countries of the Association of Southeast Asian Nations (ASEAN) have enacted food safety policies. One of these policies is the introduction of national good agricultural practices (GAP) standards, which are created and administered by the public authority of respective countries (except the private standard called “ThaiGAP” managed by a private institution and a public university). These public GAP standards were introduced in response to the chronic overuse and misuse of agricultural pesticides in this region [
1], along with associated public concerns about food safety [
2]. Globally, the public orientation of GAP standards in the ASEAN region is unique. The national GAP standards implemented in other parts of the world are mostly managed by private institutions without state engagement. Some of them, such as MexicoGAP, ChileGAP, and KenyaGAP, have sought to benchmark GlobalGAP [
3].
GlobalGAP is a private GAP standard that originated in Western Europe and currently exerts a dominant influence on the global fresh fruit and vegetable (FFV) value chain. It was launched in 1997 under the banner of major European retailers, and it was called “EurepGAP” until September 2007, when its name and logo were changed to GlobalGAP due to its increasingly global influence [
4]. As of May 2019, there were over 200,000 growers with a GlobalGAP-certified status in at least 135 countries [
5,
6].
In the past couple of decades, GlobalGAP has been the center of academic studies on GAP due to its pioneering and prominent features of food safety and quality assurance at the field level. In the 2000s, attention was paid to GlobalGAP’s proclivity to prioritize larger farms over smaller farms in providing certification via the conditions of investment it required from growers to meet its strict standards [
7,
8,
9]. In the 2010s, numerous studies attempted to identify the socioeconomic features of GlobalGAP-certified farms by comparing them to the case of uncertified farms. Thus, they revealed the advantage of GlobalGAP-certified farms over uncertified farms with respect to several socioeconomic attributes, such as farmgate prices received [
10], export sales [
11], share of FFV sold to lucrative markets [
12], crop yield [
13], gross revenue from cropping [
13,
14], net income from cropping [
15], and education and experience regarding high-value supply chains [
16]. Some studies also noted that inequalities existed even among GlobalGAP-certified growers regarding the abovementioned aspects [
12,
17].
The public GAP standards of ASEAN nations are significantly lower than GlobalGAP and generally lower than other private GAP standards regarding required compliance for growers. Unlike private GAP standards, most or all audit and certification expenses are borne by governments. This suggests a greater opportunity for small-scale growers to gain access to mainstream markets through GAP [
4].
Table 1 displays the basic facts of the national public GAP standards of ASEAN nations. Despite the common goal of food safety and quality assurance, the public GAP standards of ASEAN nations exhibit significantly different degrees of grower certification. Thailand’s Q-GAP is the largest standard in terms of the annual number of certified farms; it accounts for most farms with a certified status in the ASEAN region. Meanwhile, Singapore’s SingaporeGAP-VF, Myanmar’s MyanmarGAP, Cambodia’s CamGAP, and Brunei’s BruneiGAP account for less than 10 certified farms within each nation for the year when the latest data are available. This seems to attest to the Thai government’s single-minded quest for the quantitative achievements of the national GAP certification through extensive resource mobilization behind the scenes.
Academic research on national public GAP standards has mushroomed since the early 2010s. It can be classified into three orientations: (1) farmers’ adoption of GAP standards; (2) farmers’ compliance with a GAP standard; (3) consumer buying behavior and decision-making processes associated with GAP-certified food products. In the following sections, the first two are reviewed regarding their relevance to the purpose of this research (for research on consumer buying behavior and decision-making process, see Giao [
24], Thai and Pensupar [
25], and Wongprawmas and Canavari [
26]). Studies on farmers’ adoption of public GAP standards are focused on identifying the critical factors influencing their standard adoption. The most frequently cited factors are gross income derived from selling a GAP-certified crop [
27,
28,
29,
30,
31], certified growers’ experience of GAP training [
27,
32,
33,
34,
35], accessibility to GAP information [
30,
32,
35,
36], and farm size [
27,
30,
32]. Other than these factors, farmers’ adoption of public GAP standards is predicated on a country-specific condition. For example, in the case of PhilGAP, the government of the Philippines promotes its adoption by getting small farmers involved in various FFV sectors. Nonetheless, certification of the standard is dominated by corporate farms in the banana industry. This is related to their ability to meet stringent export requirements [
37].
Studies on farmers’ GAP compliance are mainly concerned with the use and management of agrochemicals. Schreinemachers et al. [
1] observed no statistically significant differences between 45 Q-GAP-certified and 245 uncertified farms regarding the amount of pesticides used, the methods of pest control employed, and the handling of pesticides, for a total of nine vegetable and fruit crops in a watershed in Chiang Mai Province, Northern Thailand. In two communities of Chaiyaphum Province, Northeast Thailand, Amekawa [
38] found that over half of the 64 Q-GAP-certified pomelo growers did not understand the purpose of GAP in relation to food safety. Of those who mentioned a reduction in their pesticide use, only a few attributed the cause to the effect of GAP training rather than the growth stage of pomelo. Srisopaporn et al. [
39] compared 41 continued Q-GAP adopter rice farmers with 66 adopt-then-disadopters and 70 never-adopters in terms of their agrichemical use. They found that continued adopters bought significantly less amounts of chemical fertilizers than never-adopters and adopt-then-disadopters. They also sprayed insecticides and fungicides significantly less often, although no significant differences were observed in the application of herbicides (the authors of the study attributed the observed differences from the findings of Schreinemachers et al. [
1] and Amekawa [
38] to the generally easier nature of rice production regarding the reduction in the use of pesticides than the case of FFV production). In a comparison of pesticide use and management of 19 MyGAP-certified and 57 uncertified durian farms in Pahang Province, Malaysia, Amekawa et al. [
27] identified significantly smaller annual amounts of pesticides used by MyGAP-certified farmers as compared to the uncertified farmers. However, considering the quota-based recruitment of individual farmers for GAP application by officers of the Department of Agriculture (DoA), Malaysia, the authors posed a “chicken or egg” question. That is, is the observed result actually due to the effect of GAP adoption or due to the selection bias of farms that performed better even before they adopted GAP?
Considering the mixed results regarding the assessed performance of public GAP standards for food safety and quality assurance, this study examines Thailand’s Q-GAP program for two main purposes. First, it aims to compare the perceptions of Q-GAP-certified and uncertified farmers in terms of their awareness of food safety and quality assurance, as well as their recognition and personal views of the Q-GAP policy. Second, it seeks to examine the difference between the two types of farmers in their pesticide use practices from the viewpoint of their experiences of training, audit, recordkeeping, pesticide handling, and the amount of pesticide residues detected in their respective produce.
Four motivations govern this research agenda. First, the adoption and diffusion of agricultural innovations significantly depend on farmers’ perceptions of the ease and merits associated with the adoption of innovations [
27]. However, most public GAP literature does not consider such internal aspects when examining farmers’ adoption of and engagement in a particular standard. While studies on public GAP standards adopt various statistical approaches, many of them focus on the identification of quantitative associations among external variables, such as income and land size, without delving into the perspectives of standard adopters and non-adopters e.g., [
1,
28,
30,
32,
33,
35,
36,
39]. This research contributes to the literature by illuminating farmers’ inner experience of GAP adoption and linking them to their behavior, practices, and outcomes.
Second, when compared to the public GAP literature on adoption, little has been studied on the reality of GAP-certified farmers’ compliance, such as their agrochemical use practices. This particularly holds true for the absence of a case study that focuses in detail on a single vegetable crop for a comparison between GAP-certified and uncertified farmers; the existing single-crop case studies focused on fruits [
27,
31,
38], rice [
39], or tea [
28]. This lacuna appears bizarre, as vegetables tend to attract more intensive pesticide spraying than other crop types. Thus, we aim to fill this gap by drawing on the case of cabbage.
Third, the preceding public GAP studies, especially those single-crop case studies on GAP compliance, mainly examine the case of export-oriented crops [
27,
28,
29,
30,
31,
33,
37,
38]. Such studies may be helpful to see farmers’ motivations to apply for a GAP standard and their pesticide use practices in relation to the features of export market demand (e.g., higher prices and pressure to apply more pesticides to meet the esthetic needs of foreign consumers as compared to the case of domestic demand). However, there is a lack of insight into these aspects for crops whose sales are confined to local or domestic markets. Our research seeks to fill this gap by considering the case of domestic market-oriented cabbage. Cabbage grown in Chiang Mai Province is barely exported overseas because of its significant perishability characteristic of leafy vegetable crops.
Fourth, to the authors’ knowledge, no GAP studies have analyzed the reality of farmers’ use of synthetic pesticides based on the integration of social research and laboratory testing. This study sought to add strength to its multilevel, multimethod approach by comparing the results of a questionnaire farm survey with those obtained from laboratory pesticide residue testing to analyze the level of farmers’ use of synthetic pesticides.
We consider that this study is broadly relevant to the issues of agricultural sustainability. GAP is considered a comprehensive approach toward the attainment of agricultural sustainability in the practice of conventional agriculture. The dependence of industrial agriculture on synthetic agrochemicals (e.g., insecticides, fungicides, herbicides, and chemical fertilizers) has caused various externalities. These include pest resistance [
40], a reduction in biodiversity, air and water pollution, soil depletion [
41], and various health problems associated with pesticide poisoning [
42,
43]. Following a GAP standard, producers can correct these signs of unsustainability by appropriately controlling the use of agrochemical inputs, thereby ensuring the health and safety of producers and consumers, animal welfare, and environmental protection [
34]. Thus, they can benefit from various resource-conserving practices, such as “integrated pest management, soil and water conservation, integrated plant nutrition and recycling, multiple cropping, water harvesting, and waste recycling” [
44] (p. 1248).
Particularly noteworthy regarding plant protection is the incorporation of integrated pest management (IPM) into a GAP program. IPM is a systems approach that integrates various crop protection practices with careful monitoring of pests and their natural enemies. It does not aim to eradicate pest populations but rather to manage them below the economic threshold levels. This is done through a combination of tactics such as agroecological cultivation practices (e.g., crop rotation, intercropping, or undersowing), physical methods (e.g., mechanical weeders), natural products (e.g., semiochemicals or biocidal plant extracts), biological control with natural enemies, and a supervised or targeted use of synthetic pesticides (instead of routinized broad-based spraying) [
45]. IPM has been practiced by smallholders in tropical countries over decades, especially in Southeast Asia, where the “farmer-first” approach to participatory nonformal education through “farmer field schools” has brought greater success in IPM implementation [
46,
47]. The efficacy of IPM for crop productivity and sustainable pest and pesticide management has been widely recognized. For example, a study on 85 IPM projects from 24 Asian and African countries implemented over the past two decades observed a mean yield increase of nearly 40.9%, coupled with a reduction in pesticide use to 30.7% compared with baseline [
48].
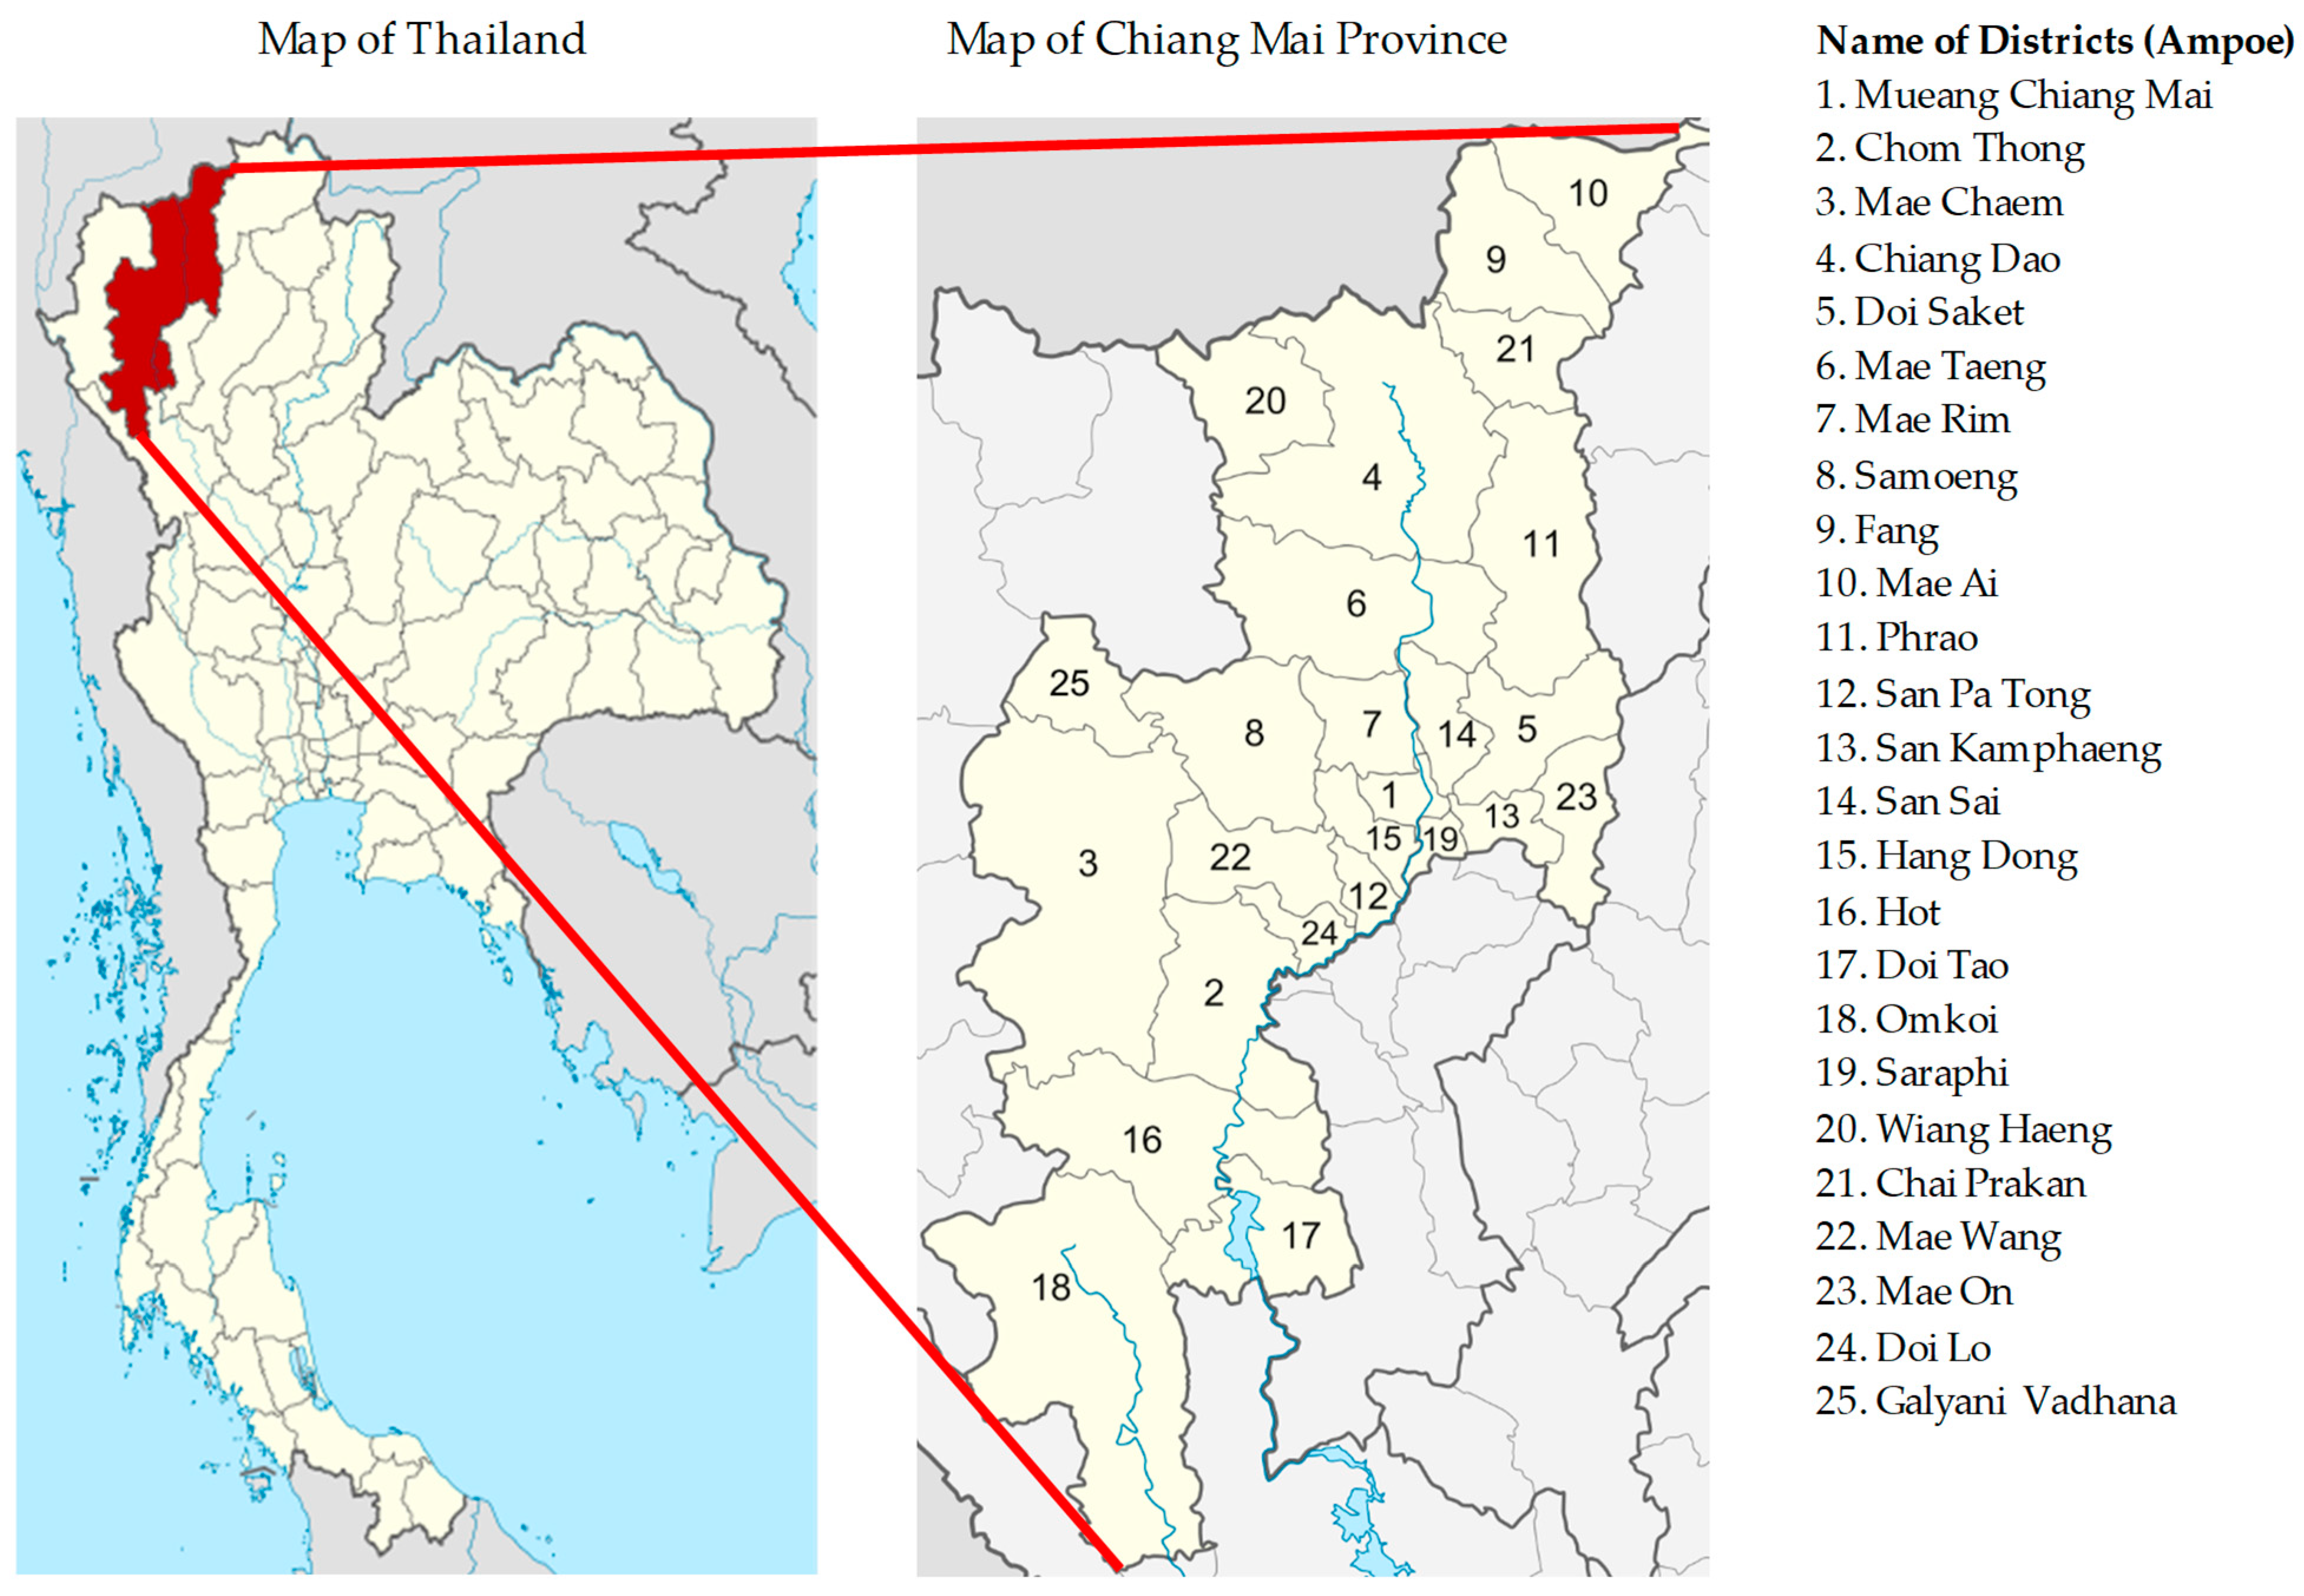
In this study, we conducted field research in Chiang Mai Province, located in Northern Thailand. Northern Thailand covers an area of 17 million ha or 33% of the nation’s total land area, and this region is characterized by a mix of hills, mountains, and flat land. The area is home to dozens of ethnic groups, who generally arrived in Thailand later than other groups, many of whom, such as Hmong, Yao, Akha, Lahu, and Lisu, were forced to settle in upland or highland areas. Mountainous areas have been a hotbed of poverty and insecurity because of the general lack of suitability for agriculture, political and cultural isolation, frequent rebels and dissidents, and rampant opium production. Impressed by the ability of various peach trees to provide the local farmers with a higher income than opium, in 1969, Rama IX (King Bhumibol Adulyadej) began promoting the hill tribes’ cultivation of alternative crops, such as various tree fruits and vegetables. The purpose was to replace the opium production of hill tribes, which became a key component of the Royal Project in the region. The Royal Project Foundation, a non-profit organization founded by Rama IX, is the chief organization to implement the Royal Project through a total of 38 development centers located in five provinces, including Chiang Mai, Chiang Rai, Mae Hong Son, Lamphun, and Phayao. The project is supported by the Highland Research and Development Institute (HRDI), which was founded in 2005 as the extended arm of the Royal Project within and beyond the project area. The HRDI works with the Royal Project in providing logistical services to the hill tribes for the distribution of their products—handicrafts, agricultural products certified of GAP standards, and traditional gift items—to local and national supermarkets such as Tops Market and Tesco and various specialty stores. The HRDI also provides consultation services to the hill tribes regarding their marketing strategy, local entrepreneurship programs, and farming methods [
49].
As mentioned, the target crop used in this study is cabbage. Cabbage (
Brassica oleracea L. var.
capitata), known to originate in West Europe, is among the most widely grown and consumed leafy vegetables worldwide [
50] as cited in [
51]. Together with Brussels sprouts, broccoli, cauliflower, and kale, it belongs to the family of cruciferous vegetables [
52]. Cabbage serves physical growth with ample mineral salts, vitamins, and proteins [
53], as cited in [
51]. In addition to being consumed as a food, cabbage has been also used for medicinal purposes to treat headaches, gout, diarrhea, and peptic ulcers [
54] as cited in [
52]. During the growth stage, cabbage may be damaged by numerous insects and pathogens, such as “
Myzus persicae (Sulzer),
Pieris rapae (L.),
Plutella xylostella L.,
Spodoptera exigua Hubner,
Phyllotreta striolata Fabricius, bacterial soft rot, and mildew” [
55] (p. 723). Accordingly, various pesticides (insecticides, fungicides, and herbicides) may be used to control the pests. In the context of Chiang Mai Province, cabbage was first adopted by the Hmong hill tribe through government promotion for the replacement of opium farming, subsequently spreading to Thai lowlanders [
56].
The remainder of this paper proceeds as follows.
Section 2 discusses Thailand’s Q-GAP policy.
Section 3 discusses the research methods used.
Section 4 presents the results and discussion. Finally,
Section 5 provides the conclusions and policy implications.
3. Materials and Methods
This research combines sociological research on cabbage farmers’ views and practices related to their Q-GAP adoption with laboratory analyses of pesticide residues in the collected sample crops. Thus, it aims to organically integrate social science research on the compliance of farms participating in Q-GAP (i.e., process control) and natural science analysis of pesticide residue testing (i.e., outcome management) in collaboration with social and natural scientists. It is argued that this type of interdisciplinary research has the potential to influence existing research streams that focus on either process control or outcome management. This is against the backdrop that natural scientists have also examined the efficacy of GAP in several studies; however, their laboratory or field testing has been conducted without simultaneous integration with social scientific findings [
59,
60,
61,
62,
63].
One of the researchers of this study, along with research assistants from Chiang Mai University, conducted a questionnaire survey at cabbage farming sites in Chiang Mai Province in Thailand from June 2019 to January 2020 (see the maps in
Figure 1). Cabbage was selected as the target vegetable crop for this study for the following four reasons. First, we focused on vegetables as the target FFV category in this study. Second, we examined the case of a crop whose sales were projected in the domestic market. Third, cabbage farms were one of the few vegetable farms found to have a sizable number of Q-GAP certifications in Chiang Mai Province at the time of the research. Fourth, cabbage is a leafy vegetable whose skin is susceptible to pesticides; therefore, the crop is worth testing for pesticide residues. Thus, vegetables such as onions, garlic, and baby corn whose skin can protect these vegetables from pesticide penetration were not considered, although these vegetables entailed a significant number of Q-GAP certifications.
For interviews with farmers, according to the DoA list, there were a total of 73 Q-GAP-certified cabbage farms in Chiang Mai Province at the time of the research. We received a list from the DoA’s Chiang Mai office and attempted to contact all farmers on the list to request an interview and identify their locations. Consequently, we interviewed 41 certified farmers and collected cabbages from their farms for pesticide residue analysis. They resided in various districts of the province. Additionally, in the neighborhood of their residences, we interviewed two or three uncertified cabbage farmers. A criterion for the selection of uncertified farms was that they should never apply for Q-GAP certification for cabbage at the time of the interview. This condition allowed to include those uncertified cabbage farmers who had grown at least one Q-GAP-certified crop (other than cabbage). Four such uncertified farmers are included in this study; this may have some positive spillover effects on their cabbage farming practices toward GAP. Accordingly, we interviewed a total of 90 uncertified farmers from 12 out of the 25 districts in Chiang Mai Province and obtained cabbage samples from them. Every farmer was interviewed for approximately 30–40 min using a prepared questionnaire. Responses were noted on the questionnaire sheet, and conversations were recorded using a voice recorder. In the data collection, the local area measure of “rai” (equivalent to 0.16 ha) was used. Rai is a standard measure of the area in Thailand. As most studied farms are as small as less than 0.5 ha for cabbage cultivation, we present the area in the results section using rai. Data were analyzed using Stata statistical analysis software. Independent t-test was applied to compare mean differences between continuous variables, and chi-square test was conducted to examine the relationship between group variables. Additionally, frequency distribution was used to present the distributional results of dummy variables.
The cabbage samples for pesticide residue analysis were collected randomly from five points in the farm field of a farmer, with each point having similar distances to the other. Five cabbage samples were collected from each farm. Unwashed cabbage samples were chopped into small pieces. Subsequently, the processed sample weighing 500 g was randomly selected for analysis. Sample preparation was performed according to the Codex Protocol 21 [
64]. These steps were performed within one day of sampling. Prior to analysis, each sample was transferred into an ice box and stored in a freezer at −20 °C at the Laboratory of Environmental and Occupational Health Science, Research Institute for Health Sciences, Chiang Mai University.
The samples stored in the freezer were prepared for organophosphate pesticide (OP) and synthetic pyrethroid pesticide (SP) analysis as described in one of the authors’ previous study [
65]. The OPs and SPs were analyzed using gas chromatography with a flame photometric detector (GC-FPD) and an electron capture detector (GC-ECD), respectively. Five levels of OP and SP calibration were prepared and spiked into pooled cabbages in the range of 0.05–1.6 µg/kg. The limit of detection (LoD) was reported according to the lowest amount of analyte in a sample [
66]. The limit of quantification (LoQ) was reported according to the lowest concentration measured using an acceptable relative standard deviation (RSD). The spiked mixed solution of OPs and SPs at a concentration of 0.40 mg/kg was used to determine intrabatch (
n = 10) and interbatch (
n = 13) precision. Recovery was measured via the spiked mixed solution of OPs and SPs at three levels: low (0.02 mg/kg), medium (0.08 mg/kg), and high (0.16 mg/kg). The precision was calculated as the RSD of repeated measurements, and the accuracy was reported as the % recovery rate.
4. Results and Discussion
4.1. Socioeconomic Profile of Studied Cabbage Farmers
Table 3 shows the basic profiles of the respondents’ cabbage farms. Of the three social variables—gender ratio, age, and education—gender ratio and age showed a significant difference (
p < 0.1). In both certified and uncertified farms, most of the main interviewed household farmers were men. Q-GAP-certified farmers are nearly five years older than uncertified farmers. This is contrary to the findings regarding MyGAP-certified durian farmers [
27] and VietGAP-certified vegetable growers [
67], who were significantly younger than uncertified farmers, allegedly due to their willingness to accept novel agricultural practices. However, Krause et al. [
29] also observed a significantly higher age of Q-GAP-certified orchid farmers over uncertified farmers; this may be related to the added time advantage of older farmers regarding the stock of their knowledge and experience about GAP.
The land size of Q-GAP-certified farms devoted specifically to growing cabbage (“Size of cabbage farmland in rai”) is smaller than uncertified farms, with a significant difference (p < 0.1). This gap may be related to the difference in the farming activities of the two farm types: on average, certified farmers grew 1.82 times more crop than uncertified farms with a statistical difference (p < 0.01). In reality, all the surveyed certified farmers grew at least one crop other than cabbage, while 18.9% of the uncertified farmers grew only cabbage. More than half of the certified farmers also grew at least one certified crop other than cabbage. Meanwhile, as mentioned earlier, there were only four uncertified cabbage farmers who grew at least one certified crop that is not cabbage.
All interviewed farmers grew cabbage in the form of family farming. Of these, 13 certified farms (31.7%) hired workers, of which one farm employed a worker on a permanent contract. The rest of the farms employed workers on a temporary contract, with nine of them (69.2%) hiring workers for 10 days or less, mainly during the harvest season. Meanwhile, 20 uncertified farms (22.2%) hired workers. One of these farms employed two workers, and another employed one worker, based on a permanent contract. The rest of the farms employed workers exclusively on a temporary contract, with 13 of them (65.0%) hiring for 10 days or less, mainly during the harvest season. In both types of farms, most of the workers were paid THB 300 (approximately USD 9.0) for their daily work, while others were paid THB 250 (approximately USD 7.5) or THB 200 (approximately USD 6.0). Of the farms that hired workers, the average certified farm (n = 13) employed 3.15 workers, and the average uncertified farm (n = 20) employed 2.54 workers. Hence, certified farms hired 24.0% more workers than uncertified farms, with no statistical difference.
Table 4 shows the economic and marketing profiles of the cabbage farmers in the past year. The uncertified farms’ yield per rai was 18.7% higher than certified farms, with no significant difference. The per rai produce values in the table represent the mean value obtained from the per rai value of each farm, which creates variance across individual farms. If per rai values are obtained by dividing the mean amount of produce by the mean land size for cabbage farming of each farmer type, the yield advantage of uncertified farms over certified farms is only 3.9% (the per farm produce value obtained from dividing the mean value of the total produce by the mean cabbage land size is 6089.99 kg/rai for certified farms and 6330.05 kg/rai for uncertified farms). Additionally, uncertified farmers allotted 33.3% more land to cabbage farming than certified farmers. Accordingly, the total cabbage produce of uncertified farmers was found to be 38.5% more than certified farmers. However, the difference is not statistically significant.
Regarding cabbage sales, certified farms’ sales per rai were 26.7% larger than uncertified farms, with no significant difference. The per rai sales values in the table represent the mean value obtained from the per rai value of each farm. If per rai values are obtained by dividing the mean value of sales by the mean land size for cabbage farming by farmer type, the yield advantage of certified farms over uncertified farms is 27.5%, with no statistical difference. This is not considerably different from the case of per rai sales value as the average of each farm. Although uncertified farms as a group did see approximately 3.9% higher yield than certified farms, their sales efficiency in terms of land size was 26.7% lower because of the significantly higher farmgate cabbage prices received by certified farmers as compared to uncertified farmers. The reported lowest and highest cabbage prices received by an average Q-GAP-certified farmer were 67.1% and 51.6% higher than those received by an average uncertified farmer, respectively (given
n = 40 for certified farms and
n = 83 for uncertified farms) (not all the produce of certified farmers can be sold at the premium price markets; Q-GAP-certified farmers may also sell some or a major portion of their produce at the non-premium price markets. Therefore, the gap in the sales amount of the two farmer types appears to be smaller than the gap in the reported prices). This finding regarding price gaps may appear counterintuitive. Studies on public GAP standards reporting certified farmers receiving a higher price than uncertified farmers relate it primarily to the former’s superior accessibility to export markets than the latter [
27,
29,
35,
38]. Meanwhile, this study, in the case of cabbage, does not involve export market sales. The quasi-price premium received by certified cabbage farmers was related to the Royal Project. The Royal Project provides local farmers with a guaranteed price that is higher than the local market price and sells the produce at various relevant local and domestic markets that require GAP, including major supermarkets. There are also groups of certified farmers who sell their produce to local specialty shops or markets catering to health-conscious consumers who demand organic or GAP-certified food. They tend to receive relatively high prices. Accordingly, despite the significant land size advantage of the uncertified farms, their total revenue from cabbage sales was only 5.3% higher than that of the certified farms, with no statistical difference.
4.2. Farmers’ Adoption of Q-GAP
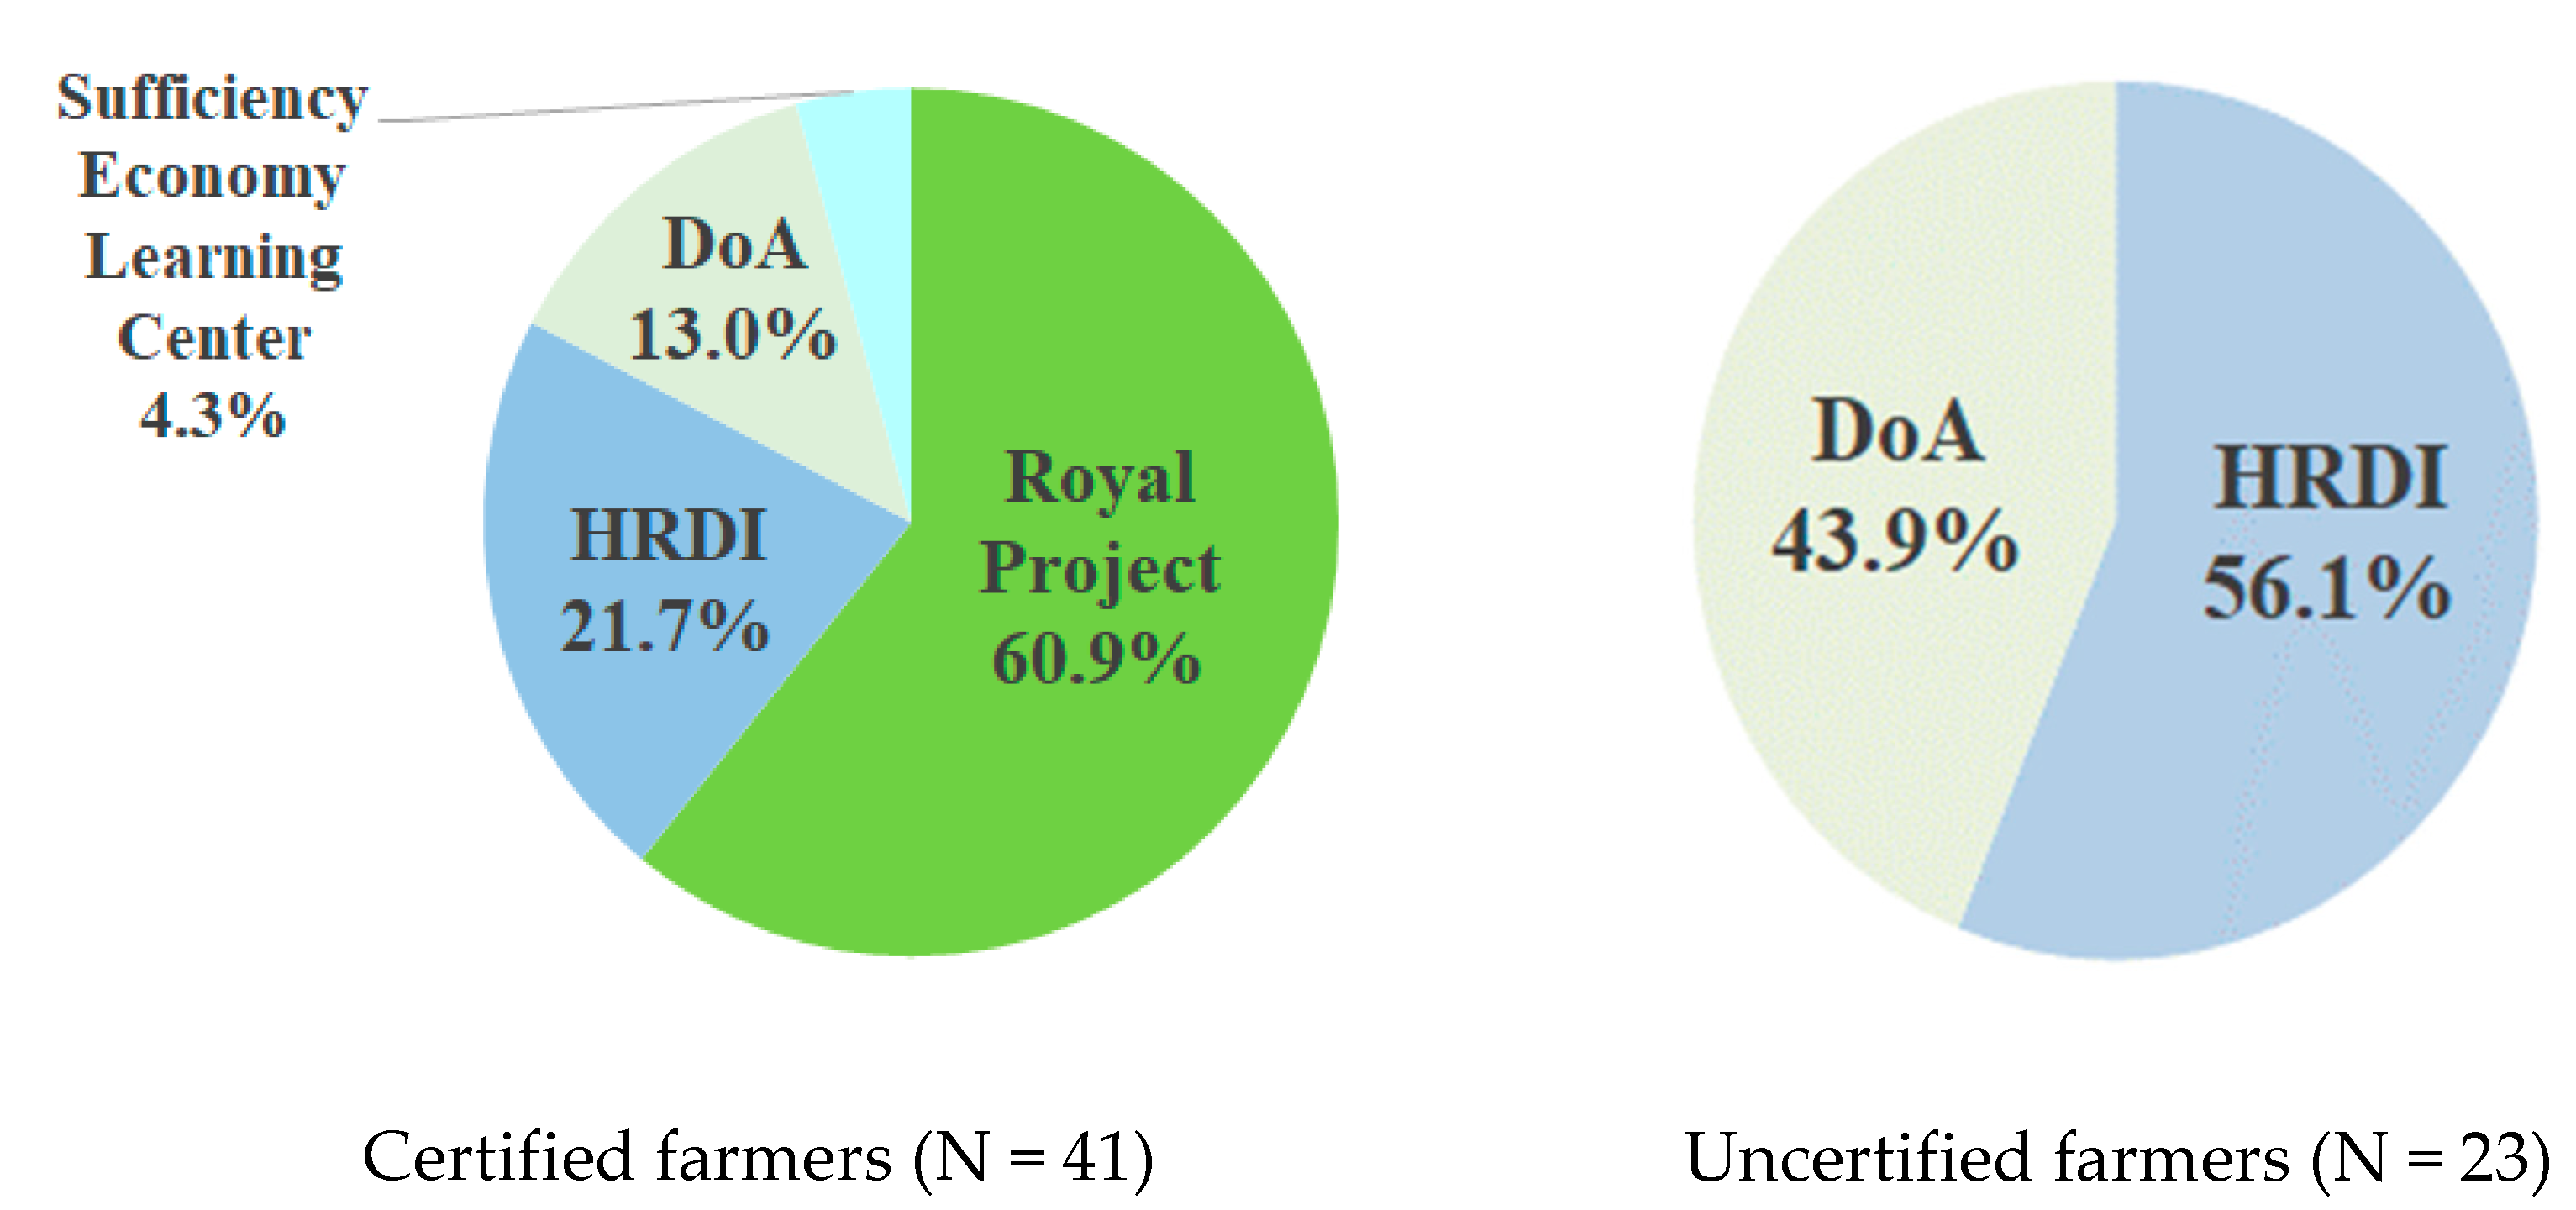
Farmers need to become aware of a public GAP standard before applying for certification.
Figure 2 shows the surveyed farmers’ initial sources of knowledge about Q-GAP. The number of uncertified farmer respondents who were aware of Q-GAP is limited, given that 67 uncertified farmers did not know of Q-GAP at the time of the survey. For certified farmers, the HRDI proved to be the most dominant source of knowledge, followed by the DoA. Generally, in Thailand, the district-level officers at the Department of Agriculture and Agricultural Extension (DoAE) play a key role in providing farmers with initial knowledge and training related to Q-GAP; however, no farmers in this study mentioned this department in their responses. As explained earlier in relation to the Royal Project, the HRDI is a public organization established in 2005 as part of the Royal Project to promote the introduction of cash crops to replace opium production in the highlands. This agency mediates between farmers and the DoAE in providing GAP training to the former provided by the latter. Therefore, the DoAE is not identified by any farmer in this study as the initial source of knowledge, although many could have received GAP training through the DoAE afterward. Regarding the initial source of knowledge of the 23 uncertified farmers who knew of Q-GAP, the Royal Project took the predominant share (60.9%,
n = 14), followed by the HRDI (21.7%,
n = 5), the DoA (13.0%,
n = 3), and so on. When the uncertified farmers refer to the Royal Project, they refer to the training and marketing components of the Royal Project with which the HRDI is not involved. When an individual farmer belongs to a producer association that has no contact with the HRDI regarding Q-GAP, or when a farmer has no affiliation with a producer association, the farmer may become aware of Q-GAP by happening to meet the agricultural research officer of the Royal Project or seeing the GAP-affiliated market outlets provided by the Royal Project.
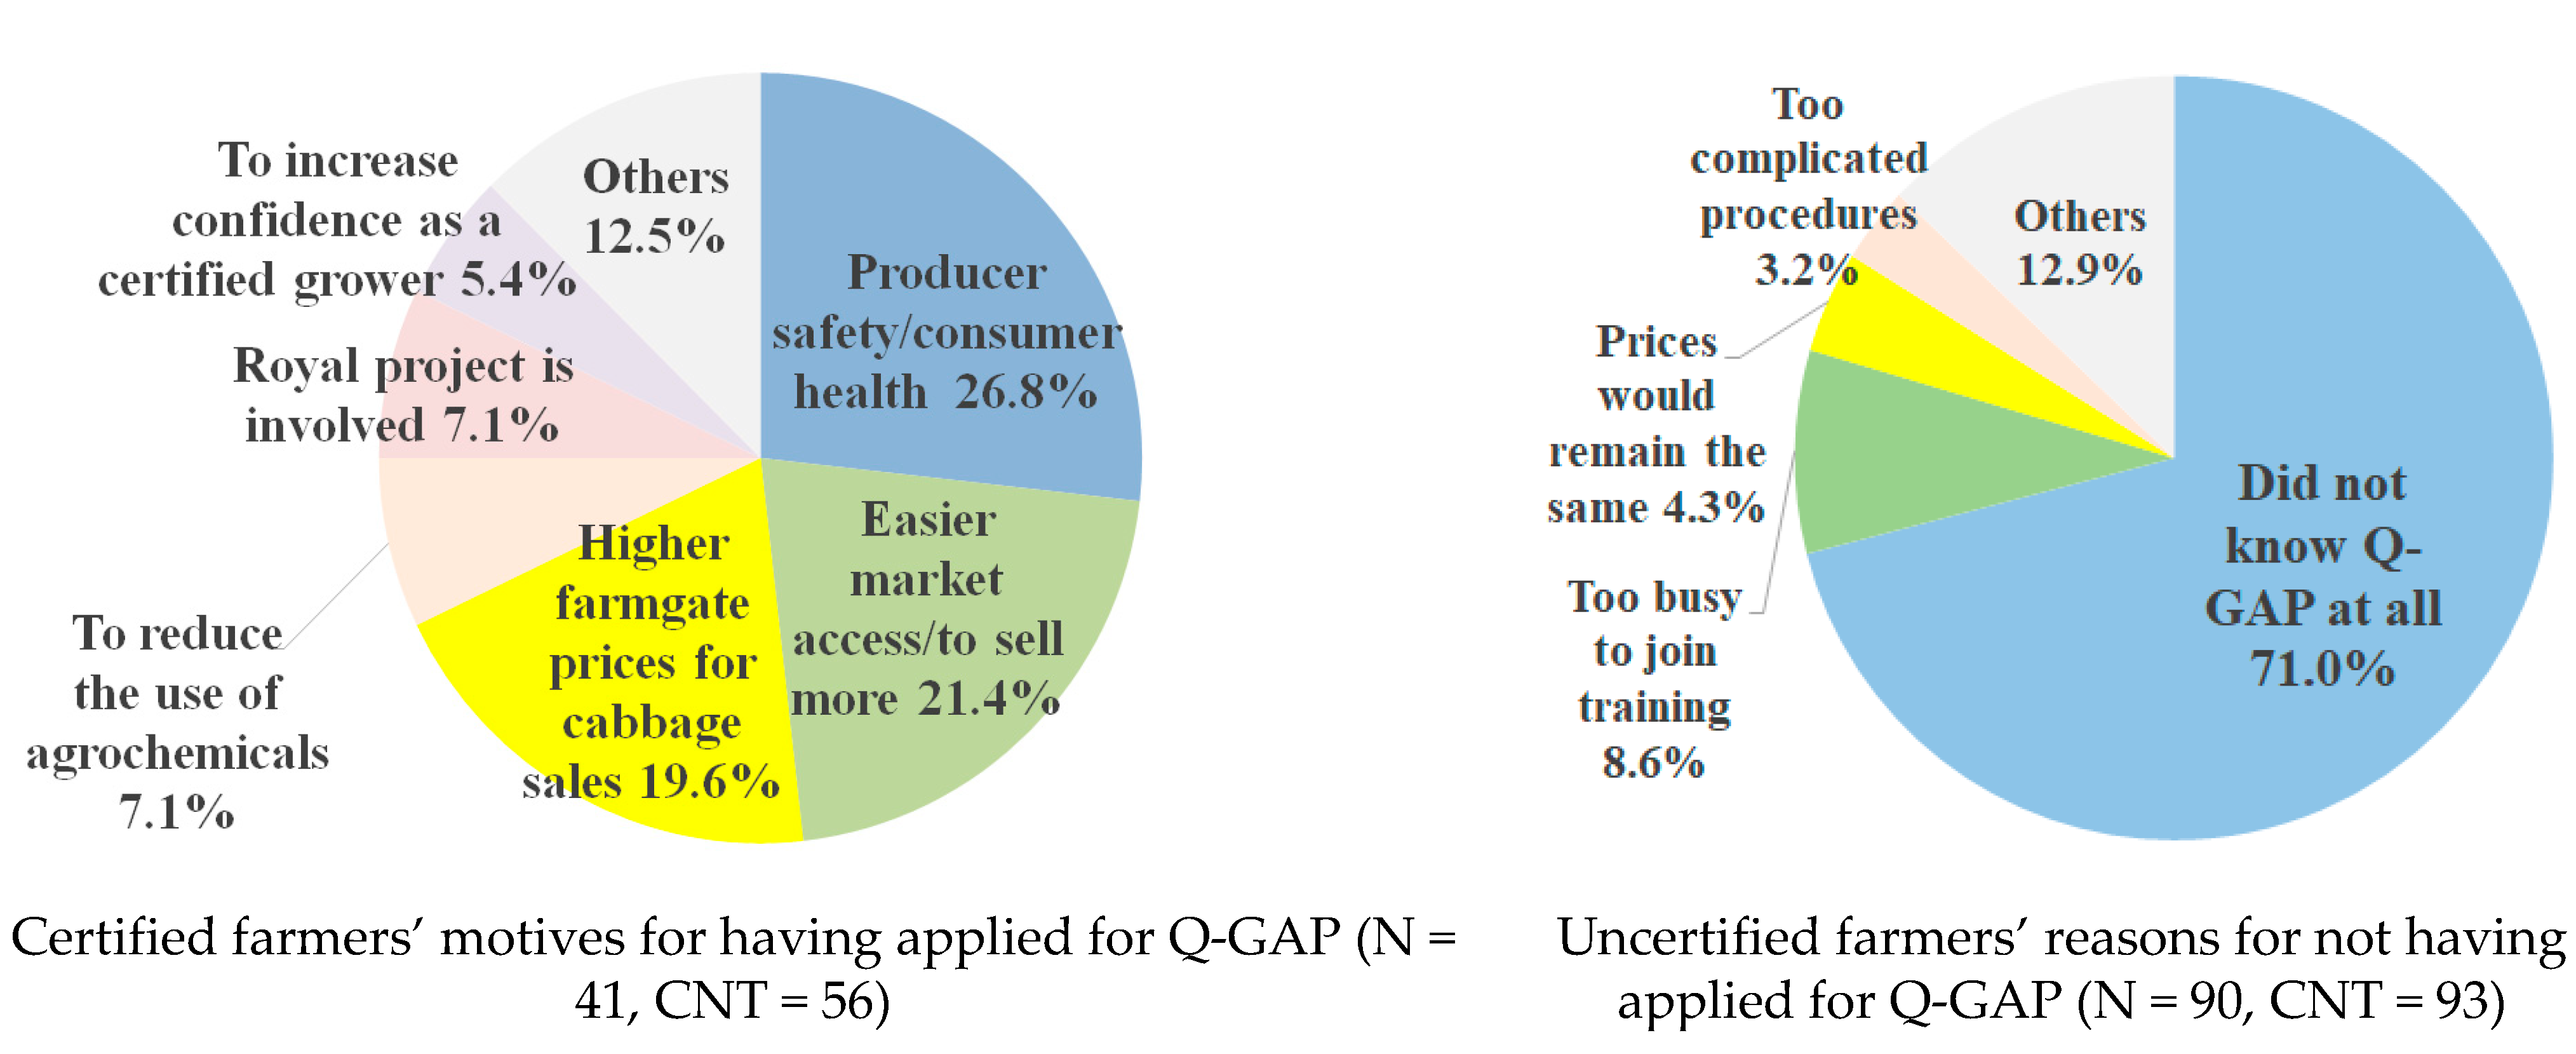
The motives of farmers to apply for and receive public GAP certification are relatively unknown in the context in which their crop sales are confined to domestic or local markets.
Figure 3 shows certified cabbage farmers’ motives for applying for Q-GAP and uncertified farmers’ reasons for not applying for Q-GAP for cabbage production. The primary motive of certified farmers for having applied for Q-GAP was “producer safety/consumer health” (26.8%) to be obtained via Q-GAP certification. This finding is salient, as this choice does not come first in other public GAP studies [
27,
38], where farmers have stronger economic motivations related to access to export market sales. However, it is also noted that economic reasons (“Easier market access/to sell more” and “Higher farmgate prices for cabbage sales”) still collectively account for 41.0%. Regarding the reasons why uncertified farmers had not applied for Q-GAP certification, the primary reason was that they were not aware of Q-GAP (71.0%), followed by “Too busy to attend training meetings” (8.6%), “Farmgate prices for cabbage sales would remain the same” (4.3%), “Required procedures are too complicated” (3.2%), among others. Notably, nobody mentioned a potential increase in pest problems or a reduction in productivity as their reasons for not applying for Q-GAP certification.
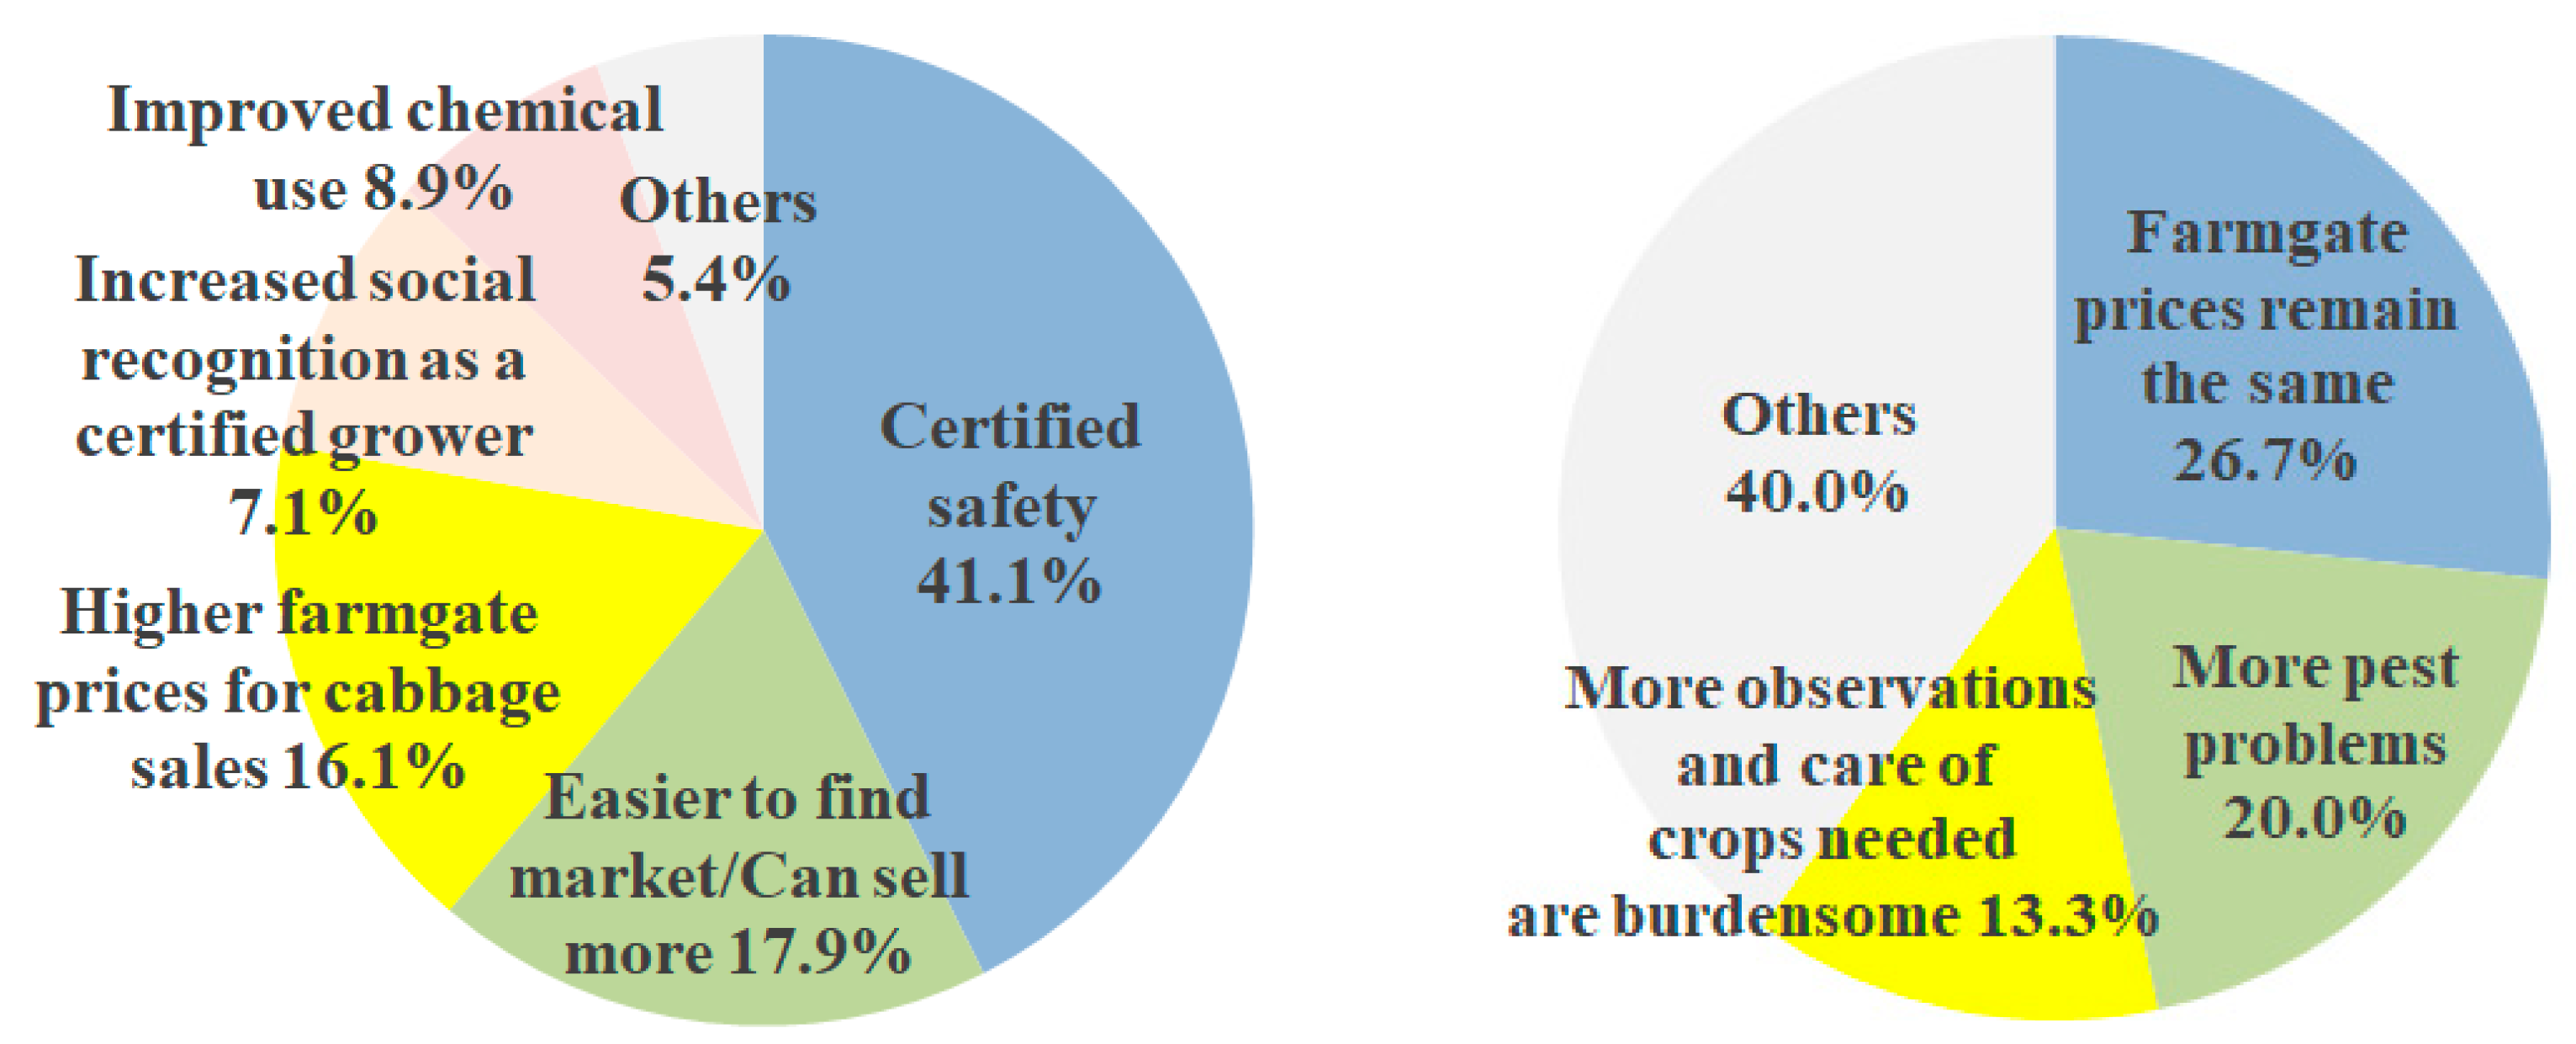
Certified farmers were asked about the benefits and disadvantages of Q-GAP certification based on their participation in the public food safety program (
Figure 4). Regarding the benefits, they are more or less similar to their original expectations (motives in applying for Q-GAP). However, notably, “certified producer and consumer safety” (41.4%) takes a larger share than their original expectations for it by 14.3%. Regarding disadvantages, 65.9% of certified farmers (
n = 27) mentioned that there was no disadvantage. Of the disadvantages mentioned (CNT = 15), “Farmgate prices remain the same in some markets” (26.7%) takes the largest share, followed by “More pest problems occurring after practicing Q-GAP” (20.0%), “More observations and care of crops needed are burdensome” (13.3%), among others.
4.3. Farmers’ Perceptions of GAP Policy and Pesticide Use
A critical point regarding the effective implementation of a GAP policy is related to the extent to which certified farmers understand the goal of the GAP policy.
Table 5 shows the results of farmers’ perceptions of the Q-GAP policy and pesticide use. Over 90% of the certified cabbage farmers correctly identified food safety assurance as the central goal of the Q-GAP policy, whereas 19 out of 24 uncertified farmers (79.2%) who were aware of Q-GAP accurately identified the central goal of the Q-GAP policy.
Cabbage farmers were questioned about their thoughts regarding the adverse impact of pesticide use when it is appropriately managed in relation to three types of affected objects: users’ health, consumers’ health, and the environment. The results show a significantly more optimistic viewpoint of uncertified farmers than certified farmers for all three types (p < 0.01). As cabbage grown in Northern Thailand is a domestic market-oriented crop, cabbage farmers may not be pressured to use as much pesticide as those growing export-oriented crops. The uncertified farmers’ more limited awareness of the possible impact of pesticides would also be related to their more limited experience of receiving GAP training as compared to certified farmers. The farmers in this study were also asked whether they thought that they had received sufficient support from the local governments for their access to useful farming technologies and practices. However, no significant difference was observed between the certified and uncertified farmers.
4.4. Training and Processes for Obtaining Q-GAP Certification
Table 6 shows the results of farmers’ experiences of receiving government training related to GAP and agrochemical use. Significant differences in favor of certified farmers over uncertified farmers are found in terms of their government training experiences of pesticide use and Q-GAP certification, as well as the number of days taken for the two types of training. Such significantly superior results for certified farmers are likely to be related to the adoption of Q-GAP. Farmers were also questioned regarding their knowledge of and training experiences related to IPM, given that it is relevant to sustainable pest control through the minimal application of synthetic pesticides. Their knowledge of IPM was initially tested to determine whether they knew of the term. The level of knowledge for both certified and certified farmers was not considerably high, with no significant differences identified. The interviewers provided relevant explanations to those who did not know of the term. Overall, 31.7% of the certified farmers and 28.8% of the uncertified farmers had received some kind of IPM training. No significant differences were found in their training experiences of IPM through either governmental or non-governmental agencies/individuals. Finally, the respondents were questioned regarding their experiences of government training on the use of organic fertilizer. While a higher proportion of certified farmers were found to have such an experience than uncertified farmers, there was no significant difference observed between the two groups.
4.5. Experiences of Farm Audit
Table 7 shows Q-GAP-certified farmers’ experiences of farm audit by DoA inspectors. The mean number of times DoA audit was needed to receive their most recent Q-GAP certification for cabbage was 1.05, which means most of the farmers received the certification in their first round of audit. Except for one farmer who responded with “half a day,” the time taken by DoA inspectors to audit the studied certified farmers for the first audit was less than an hour, with an average of 27 min. Prior to an audit, an applicant farmer for a GAP standard is not supposed to receive prior notice about the auditors’ visit so that the applicant cannot make any special preparation or treatment for the on-farm inspection and audit. However, all the certified farmers were contacted in advance for the first audit, on average over a week ago, for their latest certification. As auditors need to visit many farms in a limited time, they do not want to waste their time by visiting the applicant farmers without prior notice and find them absent from the farm or home. In the audit, the auditors checked the records of 78.0% of the certified farmers. As recordkeeping is a mandatory component for obtaining certification, the ideal completion percentage for this task must be 100%. Certified farmers were also asked whether they handed cabbage samples directly to DoA auditors for the pesticide residue test. In principle, crop samples should be selected from the field by the auditors themselves so that the applicant farmers cannot make any prior arrangements to select the most pesticide-free crop sample for the residue test. According to the four farmers (9.8%) who handed sample cabbages directly to the auditor, the average number of the samples handed was 3.0.
4.6. Synthetic Pesticide Use
Table 8 shows the adoption and use of synthetic pesticides in the past year based on the date of the survey interview. The number of times each of the three types of pesticides was applied in the past year was identified for two different cases: when farmers who did not use a particular type of pesticide were included in the analysis and when they were excluded from the analysis. The results show that for all three types of synthetic pesticides, the adoption rate of uncertified farmers is significantly higher than that of certified farmers. Likewise, the frequency of uncertified farmers’ pesticide application in the past year was significantly more than that of certified farmers for all three types of pesticides when the respondents who did not use the particular pesticide were included in the analysis. However, no significant difference was found in the frequency of fungicide or herbicide application when the respondents who did not use them were excluded from the analysis. To put it the other way around, this indicates the significant reliance of uncertified farmers on synthetic insecticide use.
4.7. Detected Pesticide Residue Levels
For pesticide residue analysis, valid cabbage samples were collected from 39 Q-GAP-certified and 90 uncertified farms.
Table 9 shows the pesticide residue levels detected from the OP analysis of the 19 active chemical ingredients. Residues were found in samples from the five chemical ingredients (the ingredients of which no residue was detected in any sample were Methamidophos, Mevinphos, Dicrotophos, Mono-crotophos, Dimetroate, Parathion-methyl, Fenitrophos, Prothiophos, Methidathion, Profenphos, Ethion, EPN, Az-inphos-methyl, and Azinphos-ethyl). No significant difference in residue levels was identified between the two types of farms for any of the five ingredients. Samples exceeding the Codex maximum residue level (MRL) specified for diazinon were found to belong to six certified farms (15.4%) and 24 uncertified farms (26.7%). Further, samples with the chlorpyrifos level that exceeded the MRL belonged to one certified farm (2.6%) and two uncertified farms (2.2%). For both diazinon and chlorpyrifos, no significant difference between certified and uncertified farms was identified in the number of farms detected for MRL exceedance.
Table 10 shows the pesticide residue levels detected by the SP analysis of the eight active chemical ingredients. Residues of the six chemical ingredients were found in the samples (the ingredients of which no residue was detected in any sample were Fenpropathrin and Dethamethrin). Of the six ingredients, only the L-Cyhalothrin level showed a significant difference between the two types of farms (
p < 0.01), with certified farms showing a higher residue level. The aggregate SP result shows a higher concentration in uncertified farms (
p < 0.05). No samples were identified that exceeded the Codex MRL for all six ingredients.
4.8. Use of Non-Synthetic Pest Control Methods
Table 11 shows a comparison of certified and uncertified farmers’ use of non-synthetic pest control methods. This item of inquiry is useful for examining the degree of farmers’ commitment to IPM as part of their sustainable farm management. A significantly greater proportion of Q-GAP-certified farmers adopted at least one non-synthetic pest control method (
p < 0.01). Of the 10 methods that have at least one user farmer, herbal insecticides show the highest adoption rate for both certified and uncertified farmers, with no significant difference between the two farmer types. This appears to show farmers’ relatively higher interest in controlling insect pests and their insecticide use based on the use of insect repellent herbal plants. Only biological fungicides and herbal herbicides showed a significant difference in the adoption rate between the two groups (
p < 0.05), with the former presenting a greater proportion of uncertified farmers and the latter that of certified farmers. Additionally, herbal insecticides and herbicides were the only methods in which there were more than 10% of the users of either farm type.
4.9. Recordkeeping
Table 12 shows the results of recordkeeping. Not all farmers use a particular kind of farm input, such as insecticides or fertilizers. Those who do not use a particular farm input do not have to maintain records for it. Therefore, the table shows the total number of respondents who used a particular input, as well as the percentage of respondents who retained their records. Significant differences were found between the two groups regarding synthetic insecticides (
p < 0.01), non-synthetic pest management methods (
p < 0.05), chemical fertilizer (
p < 0.01), and alternative fertilization methods (
p < 0.01), with certified farms showing a higher recordkeeping level. However, neither fungicide nor herbicide users, either certified or uncertified, were found to maintain records of their use of these inputs.
4.10. Pesticide Safety and Handling Practices
Table 13 compares the agrochemical safety and handling practices of Q-GAP-certified and uncertified farmers. The items used were all derived from the Q-GAP code of conduct in the TAS 9001–2013 version. They comprise a set of control points that critically concern applicant farmers’ agrochemical safety and handling practices. The responses used for statistical comparison were limited to those who used at least one kind of pesticide out of insecticides, fungicides, and herbicides (N = 27 for certified farmers and N = 75 for uncertified farmers).
Of the total 13 items, three showed significant differences in favor of certified farmers over uncertified farmers regarding good pesticide handling practices (items 2, 3, and 4). At a glance, these appear to demonstrate the certified farmers’ superior understanding of what they are expected to do with pesticides based on the knowledge they have acquired through GAP training. However, the results for item 1 on the knowledge of legally registered agrochemicals show that only approximately 30% of the surveyed cabbage farmers mentioned that they knew of the types of such chemicals. Therefore, the self-reported responses for item 2 may not precisely reflect the actual situation of their possession or use of legally registered pesticides. Regarding the items that show no significant difference, eight items show that both types of farmers have a relatively high compliance of over 70% (items 5–11 and item 13). Meanwhile, both farmer types showed approximately 57% compliance with item 12 (destroying empty pesticide containers). In relation to item 10 (stopping the application of pesticides before harvest following recommendations), we also compared the two types of farmers regarding the withdrawal period. It was found that an average certified farmer has a withdrawal period of 9.2 days as compared to an average uncertified farmer’s 14.7 days, with a significant difference (p < 0.05). This suggests that overall, it is the uncertified farmers, not the certified farmers, who are more heedful in protecting their crops from pre-harvest chemical pollution. Considering these findings together, it can be said that Q-GAP certified cabbage farmers do not undertake significantly superior agrochemical safety and handling practices than their uncertified counterparts.
4.11. Discussion
The Q-GAP-certified farmers appear to enjoy less privileged cabbage production conditions as they devote a significantly smaller land size to the cultivation of cabbage (p < 0.1) compared to the uncertified farmers. Accordingly, the certified farmers have less total cabbage production, less total cabbage sales, and less yield, albeit no statistically significant difference from the uncertified farmers. However, the amount of the certified farmers’ cabbage sales per rai is higher than that of the uncertified farmers, with no significant difference, due to the significantly higher farmgate cabbage prices they receive. This is made possible through the marketing assistance provided by the HRDI and the Royal Project. It enabled the certified farmers’ superior access to high-value markets, such as local specialty markets and major supermarkets in the country that require GAP certification for product sales. In this sense, the demand for GAP-certified vegetables from local or domestic markets had a similar effect on certified farmers’ economic welfare with the case where export market sales through GAP certification are available.
The certified farmers had various motives to receive Q-GAP certification, including both economic and non-economic motives. Unsurprisingly, “producer safety/consumer health,” instead of an economic factor, was counted most as their key motive to have applied for Q-GAP certification—given that cabbage, the crop they grow for commercial sale, has no access to export markets in the context of their locale. The fact that over half of the certified farmers had Q-GAP certification for multiple crops would have added strength to their acknowledgment of the importance of safety assurance through GAP. This finding appears more salient when looking at the certified farmers’ view of benefits from Q-GAP certification: “certified safety for producers and consumers” received the largest counts, accounting for over 40%, which is unlikely for export-oriented crops. Nonetheless, economic reasons still collectively accounted for over 40% of their motives for Q-GAP adoption, implying the still relatively high importance of GAP certification for their economic livelihood.
The certified farmers’ organizational link to the HRDI and the DoA was instrumental in their initial knowledge of the Q-GAP program. Their link to the HRDI is considered a region-specific condition for Northern Thailand, given the lack of such institutional presence in other regions of Thailand. The same can be said of the initial link of some uncertified farmers to the Q-GAP through the Royal Project. Meanwhile, over 70% of the uncertified farmers considered for this study were completely unaware of Q-GAP at the time of the research. In this regard, knowledge gaps seem to retain a significant barrier to technical innovations for vegetable growers living remotely from urban towns.
Regarding effectiveness in raising awareness through joining the Q-GAP program, over 90% of the Q-GAP-certified farmers were found to have an understanding of the objective of the policy (i.e., food safety assurance). This appears to be a significant stride from the time when the Q-GAP research published in an international journal for the first time was conducted in 2008. Only around half of the surveyed 67 Q-GAP-certified pomelo farmers in two communities of Chaiyaphum Province could relate their certification to the policy goal [
38]. The certified cabbage farmers also showed a significantly more heedful attitude than the uncertified farmers toward the effects of pesticide use on the users, consumers, and the environment. This is supported by their significantly higher level of public training experiences related to pesticide management and Q-GAP certification as compared to the uncertified farmers. However, both certified and uncertified farmers’ knowledge and training experiences related to IPM was found to be as low as approximately one-third and one-fourth of the respondents, respectively.
Regarding synthetic pesticide use practices, a significantly lesser proportion of the certified farmers were found to use either insecticide, fungicide, or herbicide than the uncertified farmers. The number of times they applied each of the three types of synthetic pesticides in the past year was also found to be significantly less than that of the uncertified farmers when including those who did not use the particular pesticide. In reality, 78.0% of the certified farmers reported that their pesticide management improved because of their learning experiences through the Q-GAP training program. These findings regarding the significantly limited adoption and controlled spraying of pesticides by certified farmers may be attributed to the positive effect of joining the food safety program. The findings also appear consistent with the relatively higher weight they place in safety assurance in their motivations for and felt benefits from GAP adoption compared to the case of more export-oriented crops. This result appears salient considering that four uncertified cabbage farmers were holding Q-GAP certification for at least one crop other than cabbage, implying positive spillover effects on their cabbage farming practices toward GAP.
The outcomes of self-reported adoption and frequency of pesticide application were checked through chemical residue testing. Of the 19 active chemical ingredients included in the OP analysis and the eight ingredients in the SP analysis, only one chemical ingredient (L-Cyhalottrin) was found to have a significant difference in the detected residue level, with certified farmers having a higher residue level (p < 0.01). Samples exceeding the Codex MRL regarding two active chemical ingredients were found from both certified and uncertified farms (15.4% for the certified group and 26.7% for the uncertified group) with no significant difference in the number of farms detected of the exceedance. In the aggregate-level analysis, no significant differences were identified between the two types of farms in the OP analysis of the five active chemical ingredients whose residue was detected in the samples. However, uncertified farmers showed a significantly higher aggregate residue level than certified farmers (p < 0.05) for the SP analysis of the six ingredients whose residue was detected in the samples. Considered together, certified farmers do not seem to exert dramatic control of pesticide residues as their self-reported awareness of the risk and use practices of pesticide spraying might suggest. This result is supported by their still limited knowledge, training experience, and field practice of IPM, as well as their less reserved pre-harvest pesticide spraying compared to the practice of uncertified farmers.
Regarding other process control aspects related to pesticide use, a significantly higher proportion of certified insecticide users maintained records on insecticide use as compared to that of the uncertified counterparts. However, the percentage of Q-GAP-certified recordkeepers remained at 64.0%, which is far less than the expected 100%. No fungicide users or herbicide users among certified farmers were found to maintain records on either fungicide or herbicide use. Moreover, a significantly superior result of certified farmers over uncertified farmers was found with only three out of the 13 items related to agrochemical safety and handling practices, although both types of farmers showed relatively high compliance of over 70% for eight items. One of the items (i.e., possession or use of illegal pesticides) may even be doubted regarding its validity because the certified farmers reportedly have limited knowledge of legally registered agrochemicals. Further, only 57.1% of the certified pesticide users self-reported the habit of disposing empty pesticide containers properly.
On the official part of process control, unlike the general GAP principle for an audit visit without advance notice, the DoA auditors’ visit was conducted with prior notice by 100%. Most certified farmers received their latest Q-GAP certification for their cabbage produce in their first audit. However, the average time taken by the DoA auditors in their first audit was 27 min when excluding one seemingly outlier farm that took half a day. This appears to be short for a careful check of the 116 control points. In the audit, 22% of the certified farmers were not checked for their recordkeeping practices by DoA auditors vis-à-vis the ideal official completion rate of 100%. Four farmers were allowed to directly hand cabbage samples to the auditors for pesticide residue testing, thereby undermining the proper procedure of random sampling.
Considered together, the above results regarding Q-GAP-certified farmers’ awareness with respect to food safety assurance and their pesticide use practices indicate definite progress from the time of early studies on Q-GAP, such as Amekawa’s field research in 2008 [
35] and that of Schreinmachars et al. in 2009–2010 [
1]. However, the Q-GAP’s goals in improving other process control practices, such as growers’ pesticide handling, recordkeeping, and DoA officers’ auditing, require the accomplishment of a higher progress level. Therefore, there is a need for more governmental efforts, especially in these areas.
5. Conclusions and Policy Implications
The research reveals at least five salient conclusions regarding its contributions to the public GAP literature and the proposed policy implications. First, this research illuminated farmers’ inner experience of GAP adoption, linking them to their behavior, practices, and outcomes. Thus, we could detect both unity and dissonance among the Q-GAP-certified farmers’ motivations for and benefits from the adoption of the food safety standard, their views of pesticide risks, their good and bad control of plant protection mechanics, and the outcomes observed in the amount of chemical residues detected. It would be difficult to obtain such a multidimensional—if not whole-ranging—perspective of a complex reality without conducting a multilevel probing such as that held in this research. While studies on public GAP standards adopt various statistical approaches, they mostly focus on the identification of quantitative associations among external factors without delving into the perspectives of grower respondents. However, this study effectively highlighted the usefulness of taking a more comprehensive approach relating the target agency’s perceptions, processes, and outcomes in a single study.
Second, this study contributes to the public GAP literature for the accumulation of knowledge in terms of certified farmers’ compliance with a GAP standard, such as their agrochemical use practices. This is contrary to the condition in the literature that most previous studies focused on farmers’ adoption of a public GAP standard. Additionally, there has been a relative absence of a case study in the public GAP literature that focuses on a single vegetable crop for a comparison between GAP-certified and uncertified farmers, given that the existing single-crop case studies focused on a fruit crop, rice, or tea. This lacuna appeared bizarre, as vegetables tend to attract more intensive pesticide spraying than other crop types. Thus, we aimed to fill this gap by studying cabbage.
Third, while the preceding public GAP studies, especially single-crop case studies on GAP compliance, focally examine the case of export-oriented crops, the crop of our target, cabbage grown in Chiang Mai Province, is focused on local or domestic market sales. The existing studies are helpful in understanding farmers’ motivations to apply for a GAP standard and their pesticide use practices in relation to the unique features of export market demand (e.g., higher prices and pressure to apply more pesticides to meet the esthetic needs of foreign consumers as compared to the case of domestic demand). However, there is a lack of insight into these aspects for crops whose sales are confined to local or domestic markets. Our research sought to fill this gap using the case of domestic market-oriented cabbage. Accordingly, it was found that compared to the case when certified farmers grew an export-oriented crop, the surveyed certified cabbage farmers placed a higher priority on safety assurance regarding their motivations to apply for and felt benefits from the adoption of the Q-GAP standard. Additionally, they were found to still retain a significant interest in acquiring more economic benefits from Q-GAP certification (e.g., good farmgate prices) through increased access to high-value major supermarkets and local specialty markets that require Q-GAP certification by way of the Royal Project mediation.
Fourth, while this research observed notable progress in certified farmers’ perceptions of the importance of safety assurance, awareness of pesticide risks, and adoption and frequency of pesticide use from the time of earlier studies on Q-GAP compliance, it also identified weaknesses in the current Q-GAP policy implementation. First, over 70% of the uncertified cabbage farmers did not know of Q-GAP, and this knowledge gap implies the need for further publicization of the program in the mountainous region. Second, certified farmers’ knowledge and adoption of IPM practices appeared inadequate to improve their plant protection mechanics associated with the selective and controlled use of synthetic pesticides. Third, official process control procedures need to be tightened. This is especially regarding training farmers about legally permitted pesticides and proper disposal of empty pesticide containers, and careful auditing by DoA officers (i.e., detailed interviews with applicant farmers, deliberate checks on their recordkeeping, and randomized selection of crop samples for pesticide residue testing).
Finally, this study makes a novel contribution to the possibility of international cross-disciplinary research through a unique partnership between social and natural scientists. To the authors’ knowledge, no GAP studies have analyzed the reality of farmers’ use of synthetic pesticides based on the integration of social and natural science research. This study sought to add strength to its multilevel, multimethod approach by comparing the results of a questionnaire farm survey with those obtained from laboratory pesticide residue testing for analyzing the level of farmers’ use of synthetic pesticides. Thus, the research created a synergy between process and outcome. Accordingly, we could grasp a wider picture of the reality of pesticide use by cabbage farmers and identify a gap between some of the farmers’ self-reported farming practices and their unknown environmental outcomes.
However, there is a limitation in this research: the sample size was limited. Thus, similar cross-disciplinary research needs to be conducted with a larger sample size; many FFV crops that have been understudied in relation to GAP certification could be studied through such research. Another limitation is related to the external validity of the research findings from Chiang Mai Province. Q-GAP-certified farmers producing domestic market-oriented vegetables in Northern Thailand might expect and enjoy better market conditions through assistance from the HRDI and the Royal Project compared to farmers from other areas where such assistance is absent. The conditions in other regions of Thailand or other nations in Southeast Asia may be different.
A preempt challenge for conducting this sort of cross-disciplinary research would be such that the concomitant operation of survey research and pesticide residue analysis for a large sample could be overwhelmingly costly for the time, money, and effort required. International collaboration adds further cost, especially when researchers reside in different countries but need to get together in one country. Guided opportunities from public support will be beneficial for this kind of interdisciplinary research. Specifically, a research collaboration between a public GAP official laboratory unit and a third-party research institution such as a university is expected to bring about fruitful results.


 ,
, 


