Article

Recreational Harvest of Sharks and Rays in Western Australia Is Only a Minor Component of the Total Harvest

Australian Fisheries and Marine Research Laboratories, Department of Primary Industries and Regional Development of Western Australia, P.O. Box 20, North Beach, WA 6920, Australia
*
Author to whom correspondence should be addressed.
Sustainability 2021, 13(11), 6215; https://doi.org/10.3390/su13116215
Submission received: 6 April 2021 / Revised: 13 May 2021 / Accepted: 26 May 2021 / Published: 31 May 2021

Abstract

:
Sharks and rays are a global conservation concern with an increasing number of species considered at risk of extinction, mostly due to overfishing. Although the recreational harvest of sharks and rays is poorly documented and generally minimal, it can be comparable to the commercial harvest. In this study, we quantified the recreational harvest of sharks and rays in Western Australia, a region with a marine coastline greater than 20,000 km. A total of 33 species/taxonomic groups were identified, with the harvest dominated by dusky and bronze whalers, blacktip reef sharks, gummy sharks, Port Jackson sharks, wobbegongs, and rays and skates. Eighty-five percent of individuals were released with an unknown status (alive or dead). We found a latitudinal gradient of species composition, with tropical and subtropical species of the genus Carcharhinus dominating in the north and temperate species from a range of families dominating in the south. Overall, our findings showed that the recreational harvest was negligible when compared with commercial landings.

1. Introduction

Recreational fishing has numerous socioeconomic benefits, and the vast majority of people that fish today do so recreationally [1,2,3]. Although recreational fishing accounts for only 10% of the total global fish harvest [4], it can exceed the commercial harvest in some regions [5]. Recreational fishing can have negative impacts on fish populations and ecosystems [6] and these impacts have been difficult to quantify [1]. Despite being implicated in the decline of some fish populations, recreational fishing is rarely considered a threat, not even to endangered species [6], in part because obtaining robust estimates of the recreational harvest is difficult for rare species and may not account for post-release mortality (PRM) [7].
The International Union for Conservation of Nature Red List Criteria reports that one quarter of shark and ray species are threatened with extinction due to overfishing [8], with several species listed under international agreements aimed at regulating wildlife trade and at protecting endangered migratory species. Sharks and rays are particularly vulnerable to overexploitation and can be susceptible to population collapse if not properly managed given their intrinsic low productivity [9]. Commercial fishing is considered the main threat to shark and ray populations [10], and population assessments are typically limited to evaluating commercial catches (e.g., [11,12]). Although catches of sharks and rays from recreational fishing are generally small when compared with catches from commercial fishing, in some cases, the recreational harvest can be comparable to and even of similar magnitude or higher than commercial catches [13]. For most regions, however, the potential impact from recreational fishing on shark and ray populations is unknown since reliable harvest time series are typically either limited or unavailable [2].
The consequences of not accounting for the recreational harvest in stock and ecosystem assessments are unclear [14]. Hence, quantifying the recreational harvest is essential for making accurate stock estimates and for assessing the impacts of the recreational harvest on the marine community. The data collected from monitoring marine recreational fisheries in Western Australia provide a unique case study for quantifying the recreational harvest of sharks and rays, since this monitoring encompasses more than 20,000 km of the coastline across both tropical and temperate bioregions.
Recreational fishing has been a popular activity in Western Australia for many years, with an estimated 2.82 million fish from more than 180 species caught by boat-based recreational fishers in 2017–2018 [15]. The most sought-after species are invertebrates (western rock lobster, Panulirus cygnus, and blue simmer crab, Portunus armatus) and teleosts (school whiting, Sillago schomburgkii, bassensis, and vittata; Australian herring, Arripis georgianus; and pink snapper, Chrysophrys auratus). Although sharks and rays are caught by recreational fishers, they are rarely targeted and contribute to only a minor component of the total recreational harvest [15]. In contrast, sharks have been targeted by commercial fishing operations in Western Australia since the early 1940s [16,17]. Currently, stock assessments have only incorporated commercial landings because the time series of recreational harvesting are unavailable [18]. This study aims to describe the species composition and to reconstruct the annual recreational harvest of sharks and rays. The aim is to improve our understanding of the recreational shark and ray harvest in Australia by providing harvest estimates over time.

2. Materials and Methods

2.1. Data Sources

To quantify the recreational harvest, we used data from boat-based recreational fishing surveys and charter logbooks (tour operator returns) across the multiple bioregions of Western Australia (Figure 1). This quantification also required the scaling of these data back to 1941, which is considered the start of commercial shark fishing in Western Australia [16,17]. Recreational fishers in Western Australia are required to possess a Recreational Boat Fishing Licence, which provides a cost-effective sampling platform for recreational fishing surveys. Biennial statewide recreational fishing surveys were conducted in Western Australia in 2011/12 (March 2011 to February 2012), 2013/14 (May 2013 to April 2014), 2015/16 (September 2015 to August 2016) and 2017/18 (September 2017 to August 2018) [15]. A random sample of Recreational Boat Fishing licence holders were selected for an initial Screening Survey to identify potential fishers for the 12-month phone-diary survey. Survey participants were given diary kits containing a welcome letter, species identification guide [19], fishing location guide [20] and diary. After receiving the diary kits, a brief diary explanation was provided by trained interviewers, and participants were encouraged to use the diary card to record fishing effort (start and end times of a fishing event), catch (numbers by species, bothretained and released), location, method, and trip time (boat launched and retrieval times) for every fishing event during the 12-month period. Survey participants were then contacted regularly by phone during the 12-month period in order to collect their fishing information. Further details about the survey design, annual estimates, and measure of uncertainty for shark and ray species are available from [15,21,22,23].
Reporting of catch and effort data from charter-boat recreational fishing has been monitored with mandatory charter logbooks in Western Australia since 2001. These data include fishing effort (number of clients on charter boat), catch (numbers by species, both retained and released), and location [24]. For consistency with time series reconstructions (see below), only the years when the state-wide surveys were conducted were considered in this study. As the charter logbook data are from an assumed census, there are no measures of uncertainty associated with aggregated catch.

2.2. Data Analyses

The data from boat-based recreational fishing surveys and charter logbooks were adjusted to improve the accuracy of estimated recreational harvest based on the following steps: (1) the proportional allocation of catches from generic to specific taxa, (2) an adjustment of the estimated catch from private-boat recreational fishing to account for shore-based recreational fishing, (3) an adjustment of the estimated catch to account for PRM, and (4) the conversion of estimated catch in individual numbers to biomass using average weight. Following data adjustments, the recreational harvest time series were reconstructed. All analyses were done using the statistical software R [25]. The computer code developed for data adjustments and analyses can be accessed at https://github.com/JuanMatiasBraccini/Git_Stock.assessments (accessed on 30 May 2021).

2.2.1. Reapportioning Generic Taxa

Both state-wide surveys and charter logbooks include some records for generic taxa that do not distinguish between species (e.g., ‘whaler shark’, ‘other shark’, or ‘hammerhead’), as fishers only reported one taxonomic group. Therefore, for both data sets the estimated harvest of sharks reported as ‘whaler shark’ was reapportioned using the overall proportion of whaler sharks reported at a species level by bioregion and year. Similarly, the estimated harvest of sharks reported as ‘other shark’ were reapportioned using the proportion of sharks reported to the species level. The estimated harvest of ‘hammerhead’ was reapportioned into either scalloped (Sphyrna lewini) or smooth (S. zygaena) hammerhead according to the bioregion in which the harvest was reported and based on the observed spatial distribution of these two species [26]. Although great hammerhead sharks (S. mokarran) also occur in northern Western Australia, they are less common than scalloped hammerhead sharks. For this reason, great hammerhead sharks were not considered in our reapportioning. Hence, the ‘hammerhead’ harvest reported in the Gascoyne and North Coast bioregions was allocated to scalloped hammerhead sharks, whereas the harvest reported in the West Coast and South Coast bioregions was allocated to smooth hammerhead sharks. Additionally, records of bull shark (C. leucas) were considered to be pigeye shark (C. amboinensis) due to their morphological similarities and the much greater abundance of pigeye sharks than bull sharks in the study area [27].

2.2.2. Patterns in Species Composition

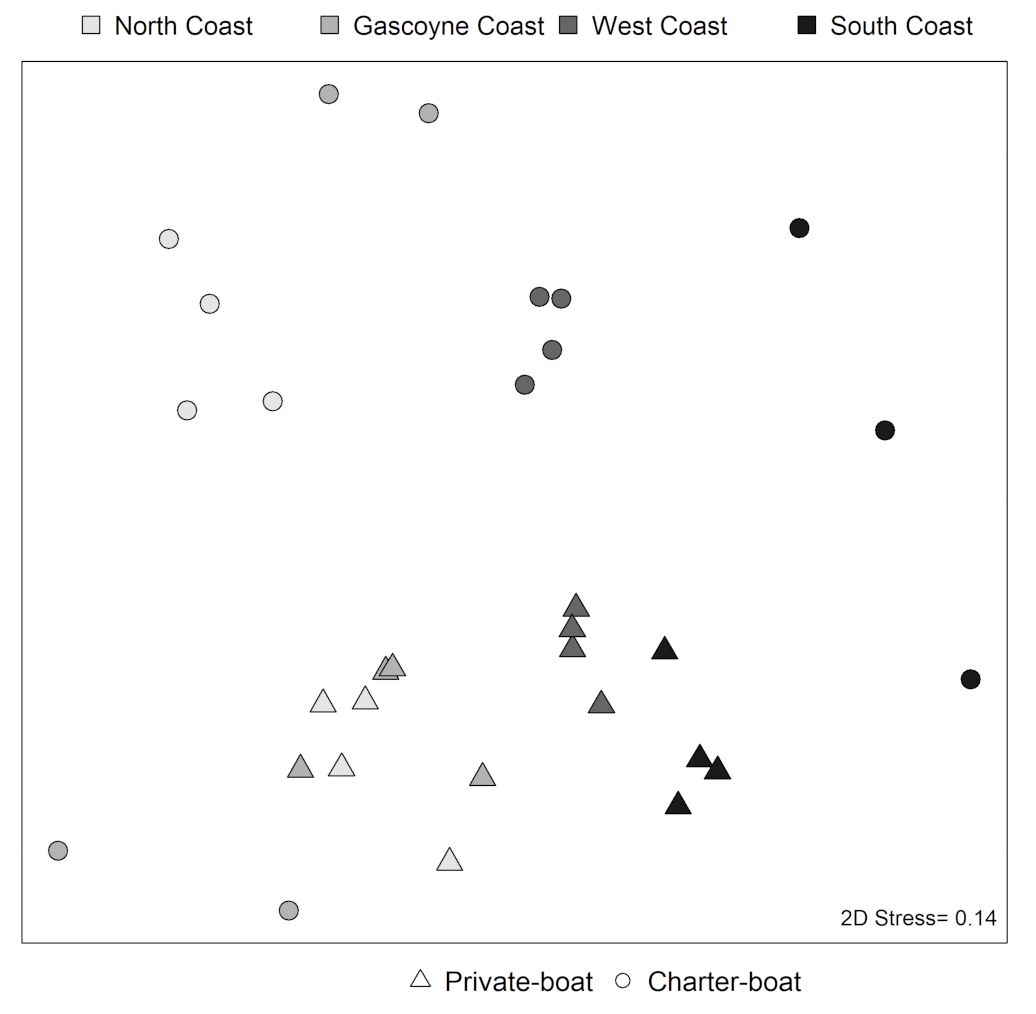
For the state-wide survey and charter logbook data, multivariate analyses were performed using the vegan package [28] to determine patterns in species composition among bioregions and between private-boat and charter-boat fishing. Non-metric multidimensional scaling (nMDS) on squared-root transformed data (number of individuals of the different species) and Bray–Curtis dissimilarities was used to collapse the multivariate species composition into two dimensions. Similarity Percentage Analysis (SIMPER) was used to determine the contribution of each species to the dissimilarity between bioregions.

2.2.3. Calculation of Shore-Based Recreational Fishing

Currently, there are no year-specific or region-specific estimates of shore-based recreational fishing harvest. Therefore, the estimated harvest from private-boat surveys was adjusted to account for shore-based recreational fishing using a private-boat to shore-based ratio (1:0.96) available for the 2000–2001 harvest of shark and ray species across Western Australia (DPIRD, unpublished data). Thus, for each state-wide survey year, shore-based recreational fishing harvest was calculated as the product of 0.96 and the estimated catch of each shark and ray species from private-boat recreational fishing.

2.2.4. Accounting for Post-Release Mortality

To account for Post-Release Mortality (PRM), species-specific PRM from a combination of commercial and recreational line fishing was obtained from the literature [29,30,31,32,33]. This information was only available for gummy (Mustelus antarcticus), school (Galeorhinus galeus), Port Jackson (Heterodontus portusjacksoni), and hammerhead sharks, and for rays and skates. For species without available estimates, a value of 30% was assumed (Table 1). The estimated harvest for each species was calculated as the sum of the retained catch and the product of the released catch with the assumed PRM. This process was repeated for estimated catches from both the state-wide surveys and charter logbooks for each year.

2.2.5. Conversion of Numbers to Weights

The average weights for species retained by private-boat recreational fishers were determined from boat ramp recreational fishing surveys conducted during 2011–12 through 2017–18 [34]. For shark and ray species, average weights were available for gummy, whiskery (Furgaleus macki) and whaler sharks, wobbegongs, and rays and skates. For species without available estimates, the average weight for whaler sharks was used for species with a maximum body size of >2 m total length (TL) and the average weight for gummy shark was used for species with a maximum body size of ≤2 m TL (Table 1). For each species, an average weight across all survey years was applied to estimate the total harvest (the sum of private-boat, shore-based, and charter-boat estimates). Given differences in the reliability of estimated catches across state-wide survey years [15], higher credence was given to estimates with a lower relative standard error (RSE) by calculating an average weight, as determined by 1/RSE.

2.2.6. Reconstruction of Time Series

For each species, the calculated average annual harvest (in weight) across survey years was multiplied by a relative time series of residential population size and an estimated participation rate in recreational fishing (29.8%), which corresponds to the average participation rate between 2009–2010 and 2018–2019 [35]. The relative time series of residential population size was obtained by dividing the Estimated Residential Population of Western Australia between 1941 and 2018 (Australian Bureau of Statistics, https://www.abs.gov.au, accessed on 25 November 2019) by the residential population size in 2011. The year 2011 was chosen because it was the first year of the state-wide surveys.

3. Results

In total, 33 shark and ray species (or species groups) were identified, with dusky whaler (Carcharhinus obscurus), rays and skates, blacktip reef (C. melanopterus), Port Jackson and gummy sharks, bronze whaler (C. brachyurus), and wobbegongs dominating the recreational harvest (Table 1). For some species, there was a very small number of observations. Most caught individuals (85%) were of unknown status (alive or dead), although hound sharks such as gummy and whiskery sharks were typically retained (Table 1).
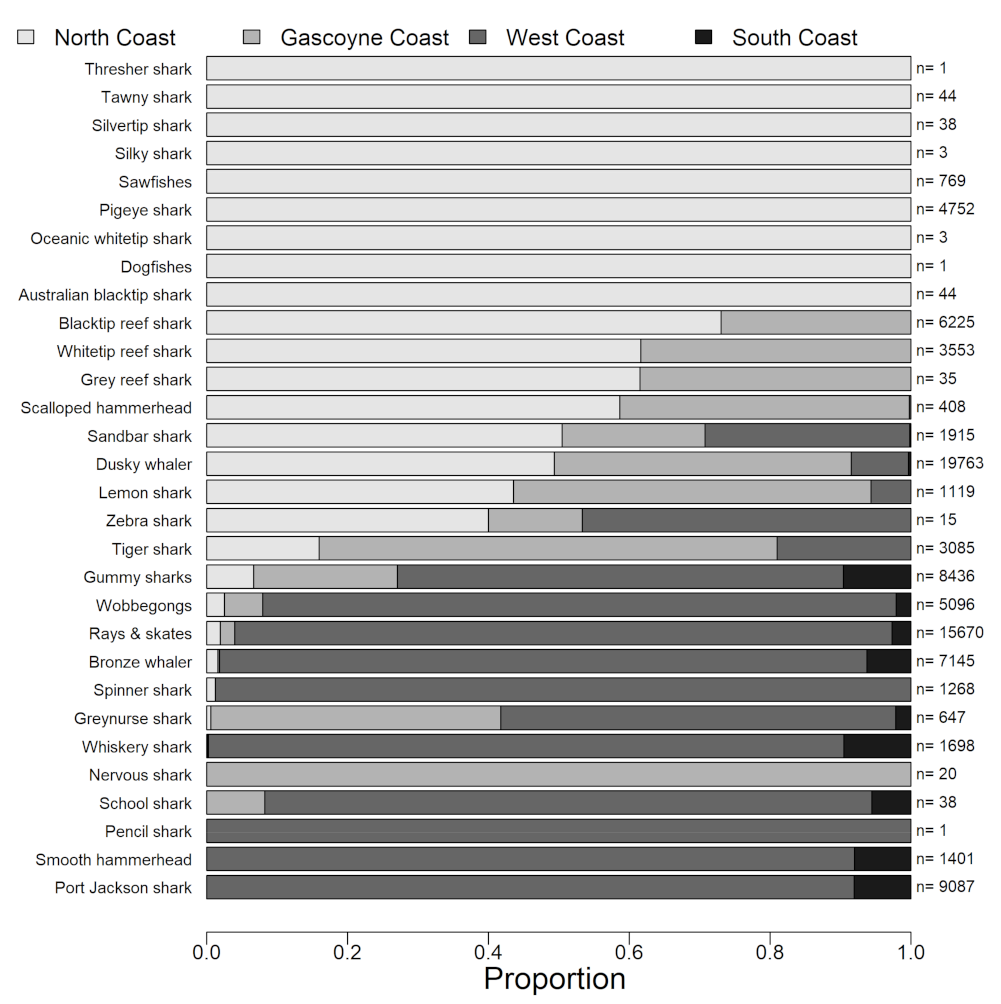
There were significant differences in species composition among bioregions (Table S1; Figure 2), with the nMDS estimating a north-to-south gradient corresponding to the species’ general distribution (Figure 3). At the bioregional extremes in the North Coast and South Coast bioregions, differences in catch composition were attributed to the predominance of tropical and subtropical species of the genus Carcharhinus in the North Coast such as reef, pigeye (C. amboinensis), lemon (Negaprion acutidens), sandbar (C. plumbeus) and tiger (Galeocerdo cuvier) sharks, and to temperate species in the South Coast, such as gummy and Port Jackson sharks and bronze whaler (Figure 2).
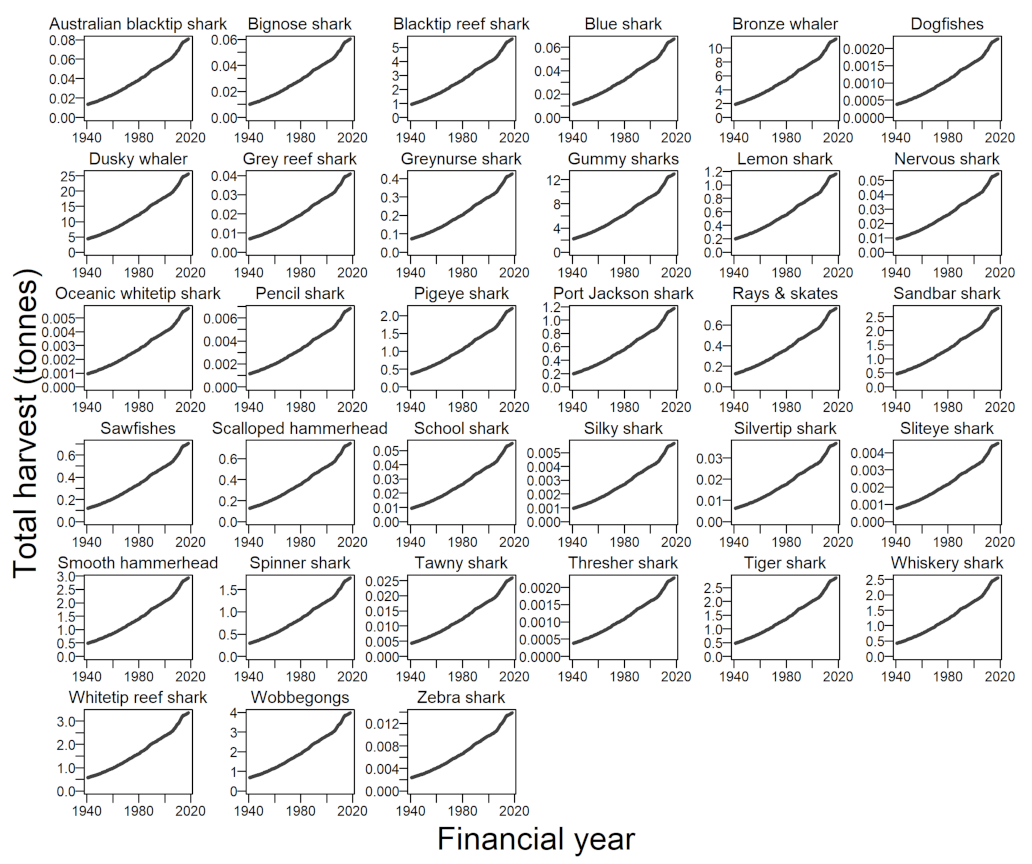
As expected from the reconstruction method, which scaled harvests by the residential population size, recreational harvest increased with time (Figure 4). The reconstructed annual recreational harvest increased from 14 tonnes in the early 1940s to 83 tonnes in 2017–2018. Dusky and bronze whalers, and gummy and blacktip reef sharks had the highest annual harvests, whereas for most other species, annual recreational harvests were negligible (<1 tonne in 2017–2018).

4. Discussion

The reconstructed time series indicate that recreational harvest of shark and ray species is low and represents a small component of the total mortality of sharks and rays in Western Australia compared with commercial landings. The shark and ray harvest from commercial and recreational fisheries reveals a contrasting trend. At its historic peak, the commercial shark fisheries of Western Australia (Northern Shark Fisheries and Temperate Demersal Gillnet and Demersal Longline Fisheries) reported annual shark and ray landings of >1300 and >1800 tonnes, respectively [36,37]. The contemporary commercial landings of sharks and rays (<1000 tonnes) is lower than in previous decades as a result of management measures aimed at ensuring the sustainability of fisheries. In contrast, the largest annual recreational harvest was for 2017–18 at 83 tonnes, i.e., <2.7% of the peak of commercial landings. At an assumed average weight of 5 kg, this equates to <17,000 individuals. Based on a nation-wide survey, which included screening from the general population and a 12-month phone–diary survey in 2000/01 [38], an estimated 24,000 sharks and rays were harvested in Western Australia and ≈82% of the harvest was released. In contrast, several million individuals of teleost species are harvested annually in Western Australia, most of which are retained [15].
In comparison to other Australian states such as Victoria, New South Wales, and South Australia, sharks are less of a target for game fishers in Western Australia [39,40]. Whaler and tiger sharks have been tagged and released by recreational game fishers in Western Australia, particularly in Exmouth and Broome, where game fishing for marlin and other billfish is popular [41]. However, our findings are in agreement with the broader Australian nation-wide survey, indicating that sharks and rays in Western Australia are not the primary target species for most recreational fishers and, when captured, are mostly (85%) released. Hence, it is unlikely that recreational fishing represents a considerable risk to the sustainability of most of these species.
Accurately identifying the recreational catch is difficult, particularly for carcharhinids that are taxonomically very similar [42] and for sharks that are released prior to landing. In the current study, the use of species identification guides and trained telephone interviewers helped recreational fishers recall information on their catches. Nevertheless, misidentification could have occurred for some species. Furthermore, the reconstruction of shore-based recreational fishing was performed by scaling the harvest from private-boat fishers. This represents a limitation to the current study, as we had to assume that shore-based fishing has remained the same over time and that both sectors have the same shark and ray species composition. To improve the current harvest estimates, targeted shore-based surveys are therefore required, as some shark and ray species, such as wedgefish (Rhinidae) and guitarfish (Rhinobatidae and Glaucostegidae), have been caught and released by shore-based fishers (M. Braccini pers. obs.) but did not occur in the reported private-boat harvest.
Species-specific PRM estimates from recreational line fishing were only available for a fraction of the species, and PRM estimates can vary with shark size. Hence, we assumed an arbitrary value of 30% for those species without estimates. This was considered to account for the mortality of sharks and rays released by recreational fishers related to capture stress, damage due to hooks or terminal tackle, or poor handling practices [2]. Shark depredation is a common issue encountered by recreational fishers in some regions of Western Australia [15,43], and the PRM values used in this study also account for this “cryptic” source of mortality. However, further research is warranted to determine species-specific PRM estimates and to identify effective ways for recreational fishers to handle and release sharks and rays to aid in their survival [44]. Similarly, average weight information was only available for a subset of species. Hence, for those species that attain large sizes and are released in relatively large numbers, such as tiger shark and sawfishes, future research should aim at collecting average weight data in order to minimize underestimating the extent of the recreational harvest of these species.
The species composition of the recreational harvest varied across bioregions, where carcharhinids dominated in tropical and subtropical waters and more temperate species from a range of families dominated in the south. Similarly, on the east coast of Australia several species of the genus Carcharhinus dominated the catch composition of recreational fishers in the north [45], whereas the catch composition in the south comprised of mostly temperate species from a range of different families [46,47].

5. Conclusions

The historically low recreational harvest in Western Australia is unlikely to have impacted shark and ray stocks substantially. For other stocks and regions, recreational harvesting has had considerable impacts on shark populations and can be of a comparable magnitude to commercial shark fishing. For example, the greynurse shark (Carcharias taurus) was almost extirpated from the east coast of Australia due to mostly recreational spearfishing [48], and the recreational harvest of large coastal sharks in the Gulf of Mexico and east coast of the US is considered larger than the commercial harvest for some species [13]. In contrast, commercial shark and ray landings in Western Australia is more than 10 times larger than the recreational harvest, and for most of the commonly harvested species by recreational fishers, there have been substantial management measures implemented to ensure sustainability [37].
The present study estimated the recreational harvest of sharks and rays in Western Australia, reconstructing the time series required for assessing these stocks to comply with state, national, and international initiatives for the conservation and sustainable management of sharks and rays. By incorporating the species-specific harvest time series into stock assessments, this newly available information allows for quantifying the impact of recreational fishing on shark and ray populations in Western Australia, even though this effect is expected to be negligible as the recreational harvest represents only a fraction of commercial landings.

Supplementary Materials

The following are available online at https://www.mdpi.com/article/10.3390/su13116215/s1, Table S1: Elasmobranch species (or species groups) that contributed most to dissimilarity between bioregions in Western Australia.

Author Contributions

Conceptualization, M.B. and K.R.; methodology, M.B., E.L., K.R., and S.T.; writing—original draft preparation, M.B.; writing—review and editing, E.L., K.R., and S.T.; visualization, M.B.; funding acquisition, K.R. All authors have read and agreed to the published version of the manuscript.

Funding

This research was funded by the Department of Primary Industries and Regional Development of Western Australia.

Institutional Review Board Statement

The study was conducted according to the guidelines of the Edith Cowan University, and approved by the Edith Cowan University Human Research Ethics Committee (2010-6146 1-11-2010). Animals Ethics review and approval were waived for this study, as this research re-lied on self-reporting of catch by recreational fishers and no shark fishes were directly used in this study.

Informed Consent Statement

Informed consent was obtained from all respondents, with parent and/or legal guardian consent for licensed fishers under 18 years.

Data Availability Statement

The data presented in this study are available upon request from the corresponding author. The data are not publicly available due to ethical considerations.

Acknowledgments

We thank all of the private-boat recreational fishers who participated in the surveys and the staff from the Survey Research Centre (Edith Cowan University) for coordinating and conducting the state-wide surveys. We also thank all of the tour operators who completed logbooks for charter-boat recreational fishing and the DPIRD staff for providing these data.

Conflicts of Interest

The authors declare no conflict of interest. The funders had no role in the design of the study; in the collection, analyses, or interpretation of data; in the writing of the manuscript; or in the decision to publish the results.

References

  1. Arlinghaus, R.; Abbott, J.K.; Fenichel, E.P.; Carpenter, S.R.; Hunt, L.M.; Alós, J.; Klefoth, T.; Cooke, S.J.; Hilborn, R.; Jensen, O.P.; et al. Governing the recreational dimension of global fisheries. Proc. Natl. Acad. Sci. USA 2019, 116, 5209–5213. [Google Scholar] [CrossRef] [Green Version]
  2. Gallagher, A.J.; Hammerschlag, N.; Danylchuk, A.J.; Cooke, S.J. Shark recreational fisheries: Status, challenges, and research needs. Ambio 2017, 46, 385–398. [Google Scholar] [CrossRef] [PubMed] [Green Version]
  3. McPhee, D.P. Urban recreational fisheries in the australian coastal zone: The sustainability challenge. Sustainability 2017, 9, 422. [Google Scholar] [CrossRef] [Green Version]
  4. Cooke, S.; Cowx, I. The role of recreational fishing in global fish crises. Bioscience 2004, 54, 857–859. [Google Scholar] [CrossRef]
  5. McPhee, D.; Leadbitter, D.; Skilleter, G. Swallowing the bait: Is recreational fishing ecologically sustainable? Pac. Conserv. Biol. 2002, 8, 40–51. [Google Scholar] [CrossRef] [Green Version]
  6. Cooke, S.J.; Hogan, Z.S.; Butcher, P.A.; Stokesbury, M.J.W.; Raghavan, R.; Gallagher, A.J.; Hammerschlag, N.; Danylchuk, A.J. Angling for endangered fish: Conservation problem or conservation action? Fish Fish. 2016, 17, 249–265. [Google Scholar] [CrossRef]
  7. Kyne, P.; Feutry, P. Recreational fishing impacts on threatened river sharks: A potential conservation issue. Ecol. Manag. Restor. 2017, 18, 209–213. [Google Scholar] [CrossRef] [Green Version]
  8. Dulvy, N.K.; Fowler, S.L.; Musick, J.A.; Cavanagh, R.D.; Kyne, P.M.; Harrison, L.R.; Carlson, J.K.; Davidson, L.N.; Fordham, S.V.; Francis, M.P.; et al. Extinction risk and conservation of the world’s sharks and rays. eLife 2014, 3, e00590. [Google Scholar] [CrossRef] [PubMed] [Green Version]
  9. Walker, T.I. Can shark resources be harvested sustainably? A question revisited with a review of shark fisheries. Mar. Freshw. Res. 1998, 49, 553–572. [Google Scholar] [CrossRef]
  10. Field, I.; Meekan, M.; Buckworth, R.; Bradshaw, C. Susceptibility of sharks, rays and chimaeras to global extinction. Adv. Mar. Biol. 2009, 56, 275–363. [Google Scholar] [CrossRef]
  11. Walker, T.I. Stock assessments of the gummy shark, Mustelus antarcticus Gunther, in Bass Strait and off South Australia. In Population Dynamics for Fisheries Management; Hancock, D.A., Ed.; Australian Government Printing Service: Canberra, Australia, 1994; pp. 173–187. [Google Scholar]
  12. Punt, A.E.; Walker, T.I. Stock assessment and risk analysis for the school shark (Galeorhinus galeus) off southern Australia. Mar. Freshw. Res. 1998, 49, 719–731. [Google Scholar] [CrossRef]
  13. Cortés, E.; Brooks, L.; Scott, G. Stock Assessment of large coastal sharks in the U.S. Atlantic and Gulf of Mexico. In Sustainable Fisheries Division Contribution SFD-2/03-177; National Oceanic and Atmospheric Administration, National Marine Fisheries Service, Southeast Fisheries Science Center: Panama City, FL, USA, 2002; pp. 1–63. [Google Scholar]
  14. Zeller, D.; Darcy, M.; Booth, S.; Lowe, M.K.; Martell, S. What about recreational catch?. Potential impact on stock assessment for Hawaii’s bottomfish fisheries. Fish. Res. 2008, 91, 88–97. [Google Scholar] [CrossRef]
  15. Ryan, K.; Hall, N.; Lai, E.; Smallwood, C.; Tate, A.; Taylor, S.; Wise, B. Statewide Survey of Boatbased Recreational Fishing in Western Australia 2017/18; Fisheries Research Report No. 297; Department of Primary Industries and Regional Development: Perth, WA, Australia, 2019. [Google Scholar]
  16. Simpfendorfer, C.; Donohue, K.J. Keeping the fish in “fish and chips”: Research and management of the Western Australian shark fishery. Mar. Freshw. Res. 1998, 49, 593–600. [Google Scholar] [CrossRef]
  17. Whitley, G.P. Preliminary Report on the Long Line Fishery at Bunbury, W.A.; Unpublished Report; Western Australian Marine Research Laboratories: North Beach, Australia, 1943; 9p. [Google Scholar]
  18. Braccini, M.; Blay, N.; Hesp, A.; Molony, B. Resource Assessment Report Temperate Demersal Elasmobranch Resource of Western Australia; Fisheries Research Report 294; Department of Primary Industries and Regional Development: Perth, WA, Australia, 2018. [Google Scholar]
  19. DoF. Recreational Fishing in Western Australia—Fish Identification Guide, 5th ed.; Fisheries Occasional Publication No. 103; Department of Fisheries: Perth, WA, Australia, 2017. [Google Scholar]
  20. DoF. Recreational Fishing in Western Australia—Fishing Location Guide; Fisheries Occasional Publication No. 92; Department of Fisheries: Perth, WA, Australia, 2011. [Google Scholar]
  21. Ryan, K.L.; Wise, B.S.; Hall, N.; Pollock, K.; Sulin, E.; Gaughan, D. An Integrated System to Survey Boat-Based Recreational Fishing in Western Australia 2011/12; Fisheries Research Report No.249; Department of Fisheries: Perth, WA, Australia, 2013. [Google Scholar]
  22. Ryan, K.; Hall, N.; Lai, E.; Smallwood, C.; Taylor, S.; Wise, B. State-Wide Survey of Boat-Based Recreational Fishing in Western Australia 2013-14; Fisheries Research Report No. 268; Department of Fisheries: Perth, WA, Australia, 2015. [Google Scholar]
  23. Ryan, K.; Hall, N.; Lai, E.; Smallwood, C.; Taylor, S.; Wise, B. Statewide Survey of Boat-Based Recreational Fishing in Western Australia 2015/16; Fisheries Research Report No. 287; Department of Primary Industries and Regional Development: Perth, WA, Australia, 2017. [Google Scholar]
  24. Telfer, C. The Western Australian Charter Boat Industry: Working towards Long-Term Sustainability. Master’s Thesis, School of Natural Sciences, Edith Cowan University, Perth, WA, Australia, 2010. [Google Scholar]
  25. R Core Team. R: A Language and Environment for Statistical Computing; R Foundation for Statistical Computing: Vienna, Austria, 2018; Available online: https://www.R-project.org/ (accessed on 1 March 2018).
  26. Braccini, M.; Taylor, S. The spatial segregation patterns of sharks from Western Australia. R. Soc. Open Sci. 2016, 3, 160306. [Google Scholar] [CrossRef] [Green Version]
  27. Braccini, M.; Molony, B.; Blay, N. Patterns in abundance and size of sharks in northwestern Australia: Cause for optimism. ICES J. Mar. Sci. 2020, 77, 72–82. [Google Scholar] [CrossRef]
  28. Oksanen, J.; Blanchet, F.G.; Friendly, M.; Kindt, R.; Legendre, P.; McGlinn, D.; Minchin, P.R.; O’Hara, R.B.; Simpson, G.L.; Solymos, P.; et al. Vegan: Community Ecology Package; R Package Version 2.5-6. 2019. Available online: https://CRAN.R-project.org/package=vegan (accessed on 1 March 2018).
  29. Gulak, S.; de Ron Santiago, A.; Carlson, J. Hooking mortality of scalloped hammerhead Sphyrna lewini and great hammerhead Sphyrna mokarran sharks caught on bottom longlines. African J. Mar. Sci. 2015, 37, 267–273. [Google Scholar] [CrossRef]
  30. Frick, L.; Reina, R.; Walker, T. Stress related physiological changes and post-release survival of Port Jackson sharks (Heterodontus portusjacksoni) and gummy sharks (Mustelus antarcticus) following gill-net and longline capture in captivity. J. Exp. Mar. Bio. Ecol. 2010, 385, 29–37. [Google Scholar] [CrossRef]
  31. Gallagher, A.; Serafy, J.; Cooke, S.; Hammerschlag, N. Physiological stress response, reflex impairment, and survival of five sympatric shark species following experimental capture and release. Mar. Ecol. Prog. Ser. 2014, 496, 207–218. [Google Scholar] [CrossRef] [Green Version]
  32. Ellis, J.R.; McCully Phillips, S.R.; Poisson, F. A review of capture and post-release mortality of elasmobranchs. J. Fish Biol. 2016, 90, 653–722. [Google Scholar] [CrossRef] [PubMed]
  33. Rogers, P.J.; Knuckey, I.; Hudson, R.J.; Lowther, A.D.; Guida, L. Post-release survival, movement, and habitat use of school shark Galeorhinus galeus in the Great Australian Bight, southern Australia. Fish. Res. 2017, 187, 188–198. [Google Scholar] [CrossRef]
  34. Smallwood, C.B.; Tate, A.; Ryan, K.L. Weight-Length Summaries for Western Australian Fish Species Derived from Surveys of Recreational Fishers at Boat Ramps; Fisheries Research Report No. 278; Department of Primary Industries and Regional Development: Perth, WA, Australia, 2018. [Google Scholar]
  35. DPIRD. Annual Report 2019; Department of Primary Industries and Regional Development: Perth, WA, Australia, 2019. [Google Scholar]
  36. Molony, B.; McAuley, R.B.; Rowland, F. Northern shark fisheries status report: Statistics only. In Status Reports of the Fisheries and Aquatic Resources of Western Australia 2012/13: The State of the Fsheries; Fletcher, W.J., Santoro, K., Eds.; Department of Fisheries: Perth, WA, Australia, 2013; pp. 216–217. [Google Scholar]
  37. Braccini, M.; Blay, N. Temperate demersal gillnet and demersal longline fisheries recource status report 2018. In Status Reports of the Fisheries and Aquatic Resources of Western Australia 2016/17: The State of the Fisheries; Gaughan, D.J., Santoro, K., Eds.; Department of Primary Industries and Regional Development: Perth, WA, Australia, 2018; pp. 170–174. [Google Scholar]
  38. Henry, G.; Lyle, J. The National Recreational and Indigenous Fishing Survey; RDC Project No.99/158; New South Wales Fisheries: Cronulla, Australia, 2003. [Google Scholar]
  39. Cheshire, K.; Ward, P.; Sahlqvist, P.; Summerson, R. Monitoring the Recreational Take of Shark Species of Relevance to Commonwealth Fisheries; Prepared for the Recreational Fishing Industry Development Strategy; Department of Agriculture: Canberra, Australia, 2013. [Google Scholar]
  40. Taylor, S.M.; Braccini, J.; McAuley, R.; Fletcher, W.J. Review of Potential Fisheries and Marine Management Impacts on the South-Western Australian White Shark Population; Fisheries Research Report 277; Department of Fisheries: Perth, WA, Australia, 2016. [Google Scholar]
  41. Pepperell, J. NSW DPI Game Fish Tagging Program Report 2010–2011; Pepperell Research: New South Wales, Australia, 2011. [Google Scholar]
  42. Last, P.R.; Stevens, J.D. Sharks and Rays of Australia, 2nd ed.; CSIRO Publishing: Collingwood, VIC, Australia, 2009. [Google Scholar]
  43. Mitchell, J.D.; McLean, D.L.; Collin, S.P.; Taylor, S.; Jackson, G.; Fisher, R.; Langlois, T.J. Quantifying shark depredation in a recreational fishery in the Ningaloo Marine Park and Exmouth Gulf, Western Australia. Mar. Ecol. Prog. Ser. 2018, 587, 141–157. [Google Scholar] [CrossRef]
  44. Mcclellan Press, K.; Mandelman, J.; Burgess, E.; Cooke, S.J.; Nguyen, V.M.; Danylchuk, A.J. Catching sharks: Recreational saltwater angler behaviours and attitudes regarding shark encounters and conservation. Aquat. Conserv. Mar. Freshw. Ecosyst. 2016, 26, 689–702. [Google Scholar] [CrossRef]
  45. De Faria, F. Recreational Fishing of Sharks in the Great Barrier Reef World Heritage Area: Species Composition and Incidental Capture Stress. Master’s Thesis, School of Earth and Environmental Sciencies, James Cook University, Townsville, QLD, Australia, 2012. [Google Scholar]
  46. Pepperell, J.G. Trends in the distribution, species composition and size of sharks caught by Gamefish Anglers off South-eastern Australia, 1961–1990. Aust. J. Mar. Freshw. Res. 1992, 43, 213–225. [Google Scholar] [CrossRef]
  47. Jones, K. South Australian Recreational Fishing Survey 2007/08; South Australian Fisheries Management Series Paper No 54; PIRSA Fisheries: Adelaide, Australia, 2009. [Google Scholar]
  48. Young, M.; Foale, S.; Bellwood, D. Impacts of recreational fishing in Australia: Historical declines, self-regulation and evidence of an early warning system. Environ. Conserv. 2014, 41, 350–356. [Google Scholar] [CrossRef]
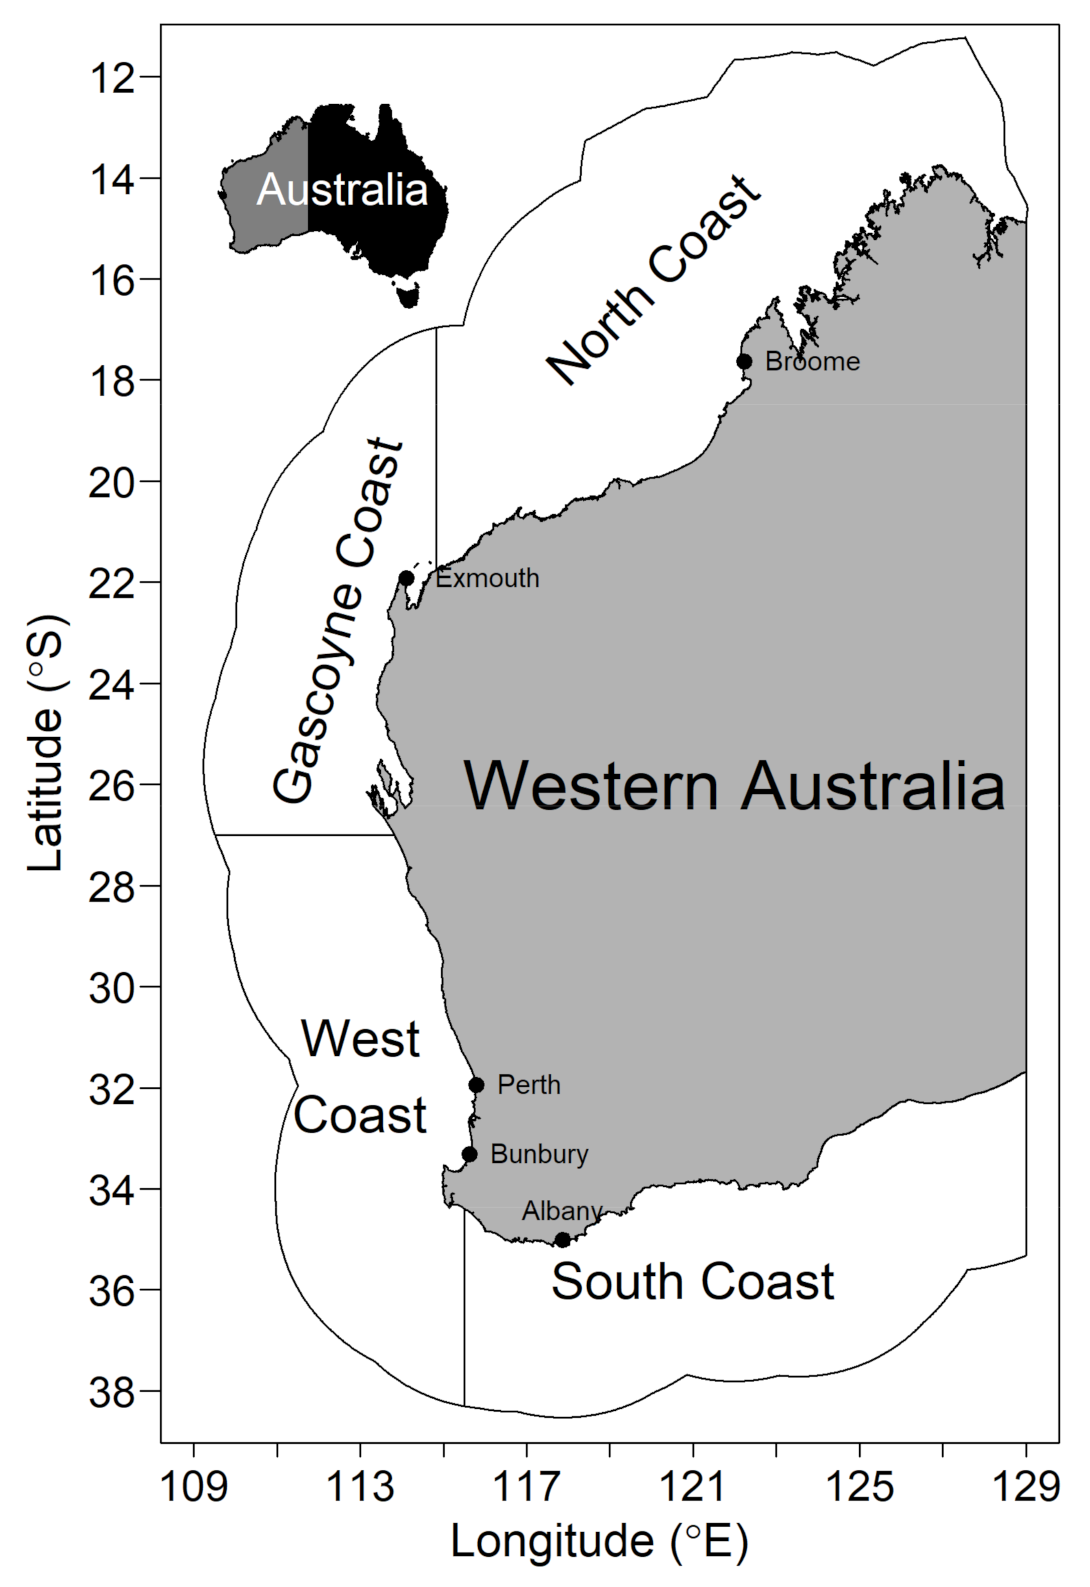
Figure 1. Marine bioregions fished by private-boat recreational fishers and charter operators in Western Australia.
Sustainability 13 06215 g001
Figure 2. Proportion of the relative abundance of shark and ray species (or species groups) among bioregions (private-boat recreational fishers only) in Western Australia. The total number of individuals is shown on the right-hand side. Species are ordered by bioregion.
Sustainability 13 06215 g002
Figure 3. Nonmetric multidimensional scaling ordination using square root transformed counts and Bray–Curtis similarities from catches of shark and ray species (or species groups) reported by private-boat recreational fishers and charter operators in Western Australia. Each point denotes both a survey type and combination of year and region.
Sustainability 13 06215 g003
Figure 4. Time series of recreational harvest for shark and ray species (or species groups). .
Sustainability 13 06215 g004
Table 1. Relative abundance of shark and ray species (or species groups) from catches reported by private-boat recreational fishers in both state-wide recreational fishing surveys (2011–12, 2013–14, 2015–16, and 2017–18) and charter logbooks (since 2002), with estimates of average weight and post-release mortality rate used for reconstructing recreational harvest. Species are sorted by taxonomic order.
Common NameScientific NameNumbersAverage Weight (kg)Post-Release Mortality
RetainedReleased
Carcharhiniformes
Silvertip SharkCarcharhinus albimarginatus0465.40.3
Bignose SharkCarcharhinus altimus0335.40.3
Grey Reef SharkCarcharhinus amblyrhynchos151995.40.3
Pigeye SharkCarcharhinus amboinensis773195.40.3
Bronze WhalerCarcharhinus brachyurus563911,9565.40.3
Spinner SharkCarcharhinus brevipinna104822855.40.3
Nervous SharkCarcharhinus cautus7244.20.3
Silky SharkCarcharhinus falciformis7115.40.3
Oceanic Whitetip SharkCarcharhinus longimanus178305.40.3
Blacktip Reef SharkCarcharhinus melanopterus82717,1785.40.3
Dusky WhalerCarcharhinus obscurus312936,5235.40.3
Sandbar SharkCarcharhinus plumbeus98932495.40.3
Australian Blacktip SharkCarcharhinus tilstoni801175.40.3
Tiger SharkGaleocerdo cuvier19959205.40.3
Sliteye SharkLoxodon macrorhinus034.20.3
Lemon SharkNegaprion acutidens6424895.40.3
Blue SharkPrionace glauca0355.40.3
Whitetip Reef SharkTriaenodon obesus29066504.20.3
Smooth HammerheadSphyrna zygaena72721215.40.6
Scalloped HammerheadSphyrna lewini599065.40.6
Gummy SharksMustelus antarcticus and M. stevensi10,43372404.20.1
Whiskery SharkFurgaleus macki245412563.70.3
School SharkGaleorhinus galeus3892874.20.1
Pencil SharkHypogaleus hyugaensis1824.20.3
Lamniformes
Thresher SharkAlopias vulpinus025.40.3
Greynurse SharkCarcharias taurus2912705.40.13
Heterodontiformes
Port Jackson SharkHeterodontus portusjacksoni13817,7154.20.05
Orectolobiformes
WobbegongsOrectolobidae162583696.70.05
Tawny SharkNebrius ferrugineus21995.40.3
Zebra SharkStegostoma fasciatum10325.40.3
Squaliformes
DogfishesSqualidae014.20.3
Rhinopristiformes
SawfishesPristidae1814895.40.3
Rajiformes
Rays and SkatesRajidae47830,2490.50.16
Publisher’s Note: MDPI stays neutral with regard to jurisdictional claims in published maps and institutional affiliations.