1. Introduction
It is in our hands to make development sustainable, that is, to ensure that it meets the needs of the present without compromising the ability of future generations to meet their own. This is the official concept of sustainable development introduced in the Brundtland report [
1]. Ecological sustainability refers to the balanced interaction between a given species and its environment, and it is to be understood as the environmental biocapacity for sustaining all the activities generated by the members of that species. In the case of humans, this concept mainly encompasses the provision of resources for human consumption and activities as well as the assimilation of the associated waste. There may be a biocapacity reserve or deficit in a territory [
2].
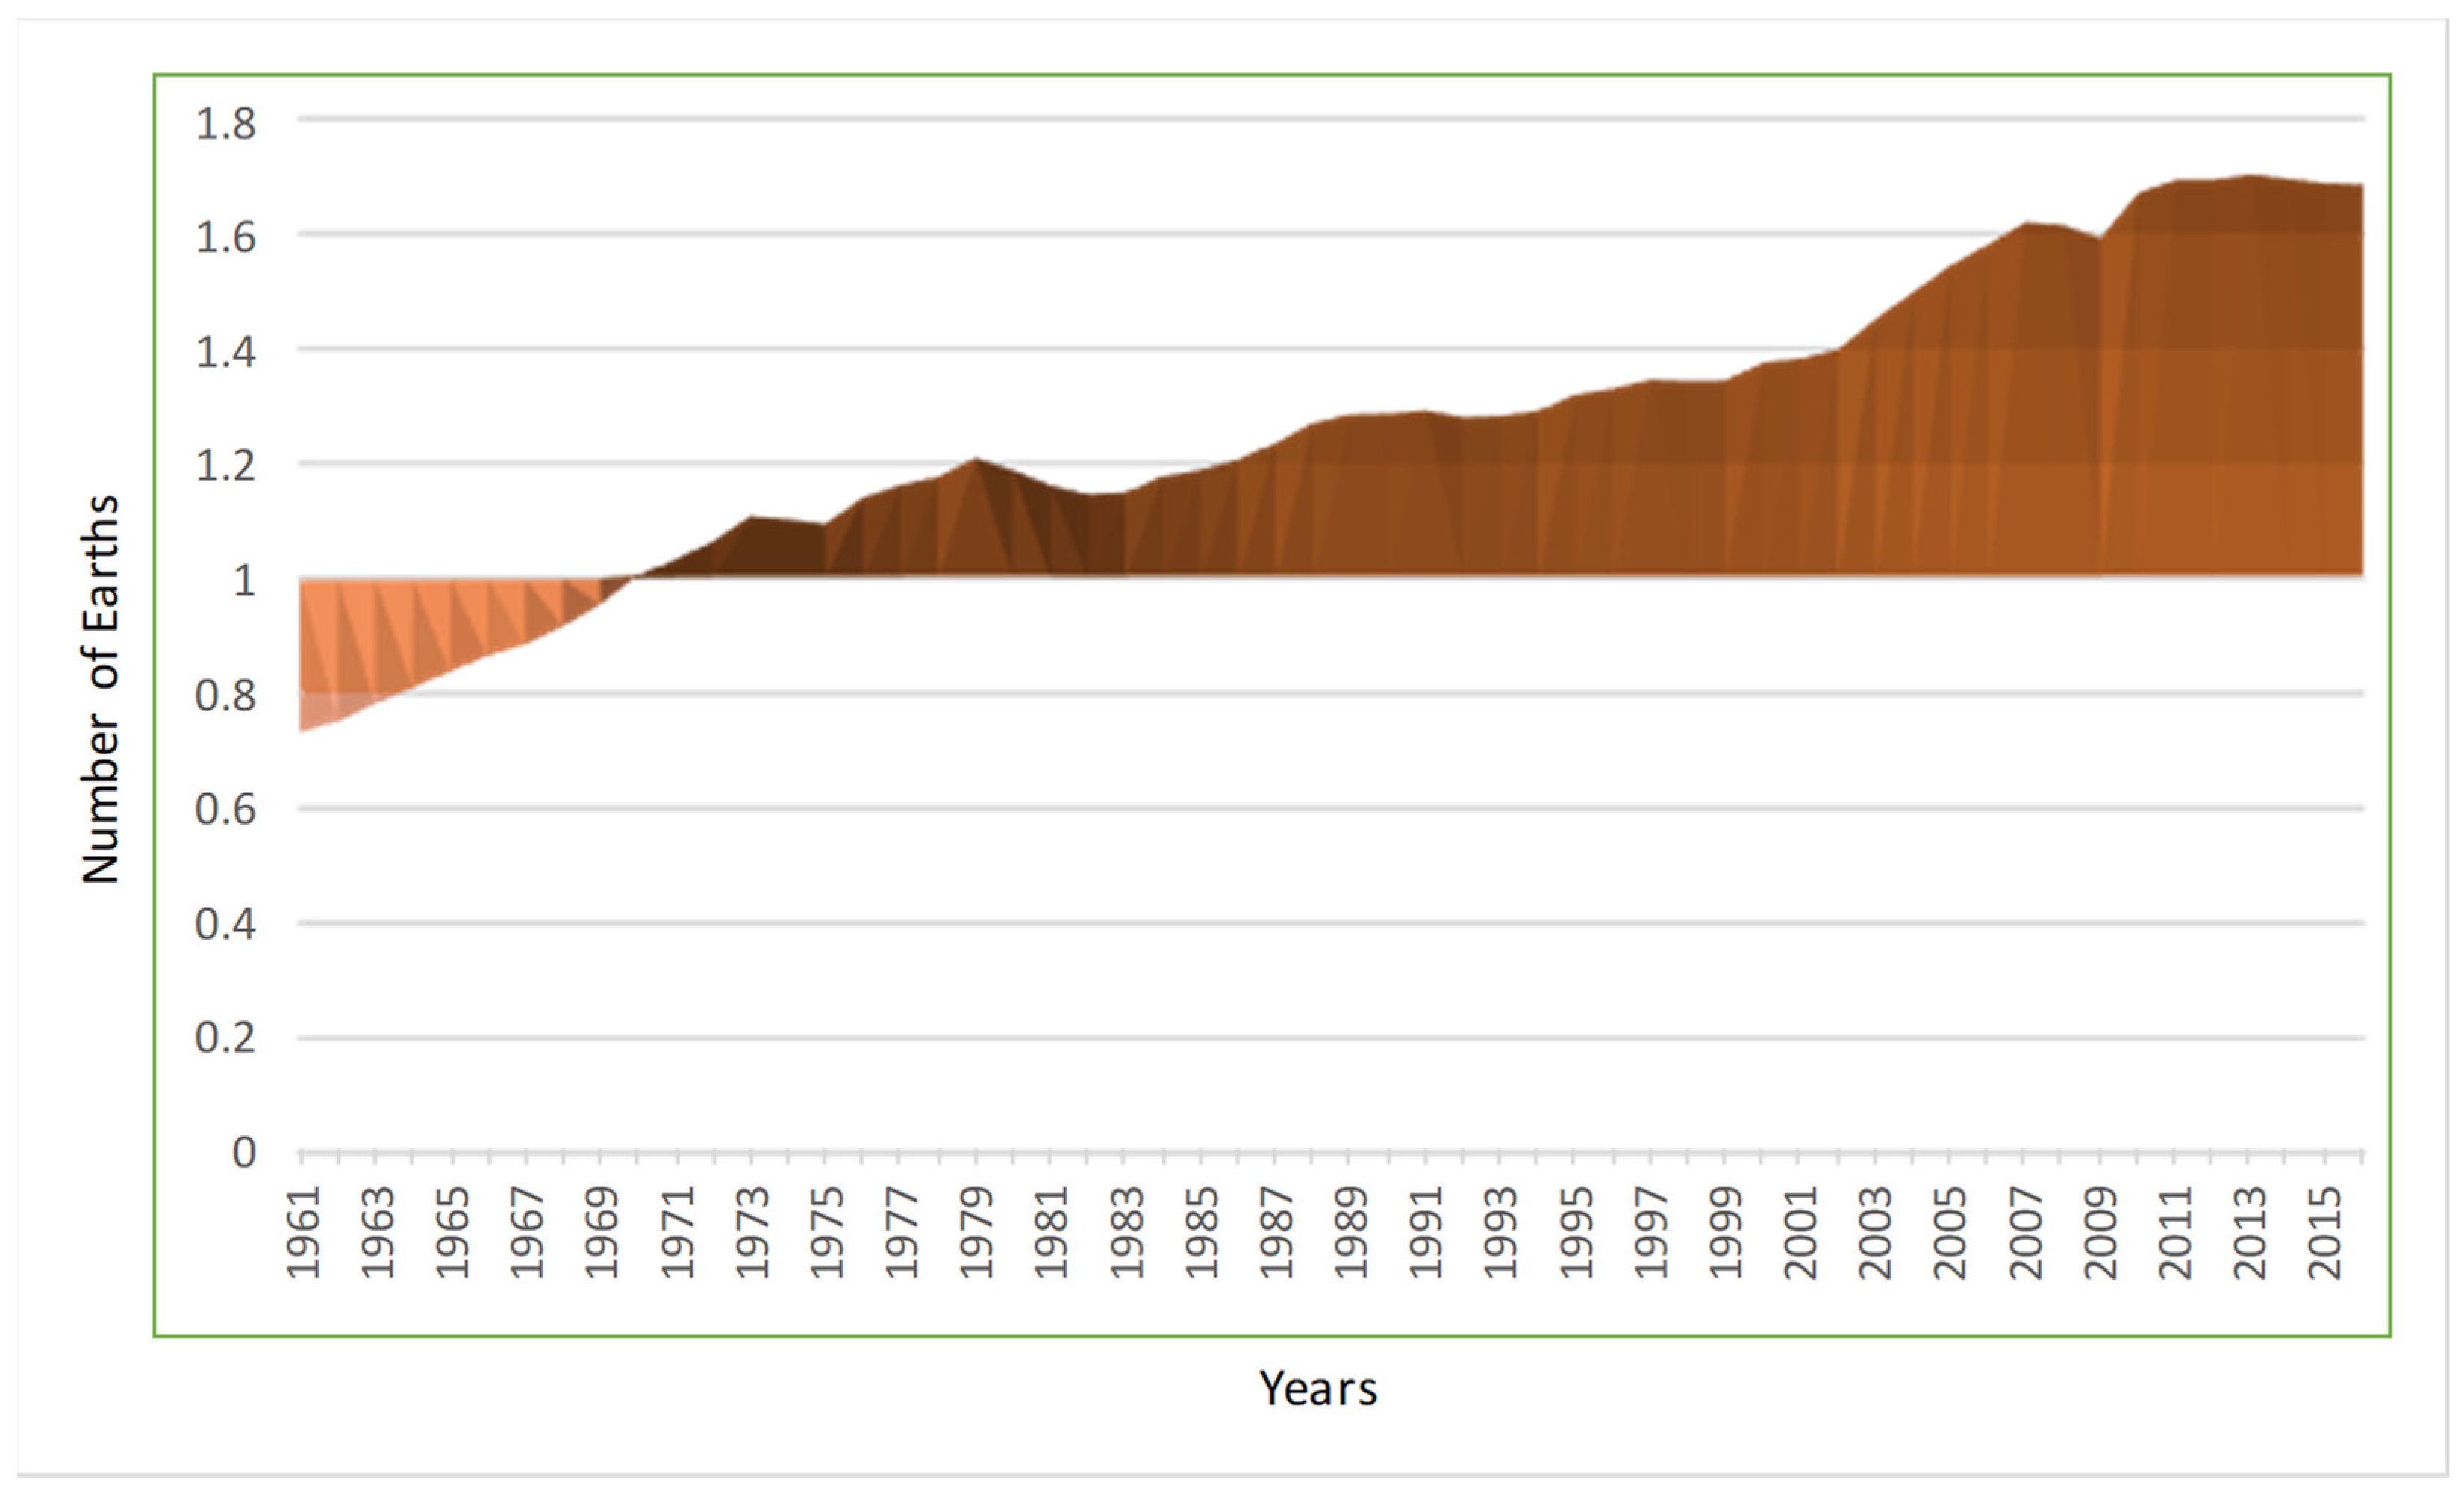
The biocapacity of Earth to produce resources and assimilate waste is determined by its surface and biological productivity. On this basis, human activity on Earth is not ecologically sustainable. The graph in
Figure 1 shows the evolution of the ratio of the ecological footprint (EF) to the biocapacity of Earth. The trend is predicted to worsen as an increasing fraction of natural spaces becomes occupied, and because each individual consumes more resources and generates more waste on average. Knowing your own EF is the first step in planning and implementing policies to reduce it.
A significant part of the human environmental impact is from transport. This is due partly to the occupation of natural spaces by transport infrastructures (roads, parking lots, railways, airports, and ports) and the manufacture, maintenance, and disposal of vehicles, but primarily, to the emission of greenhouse gases during the transportation of people and goods. These gases are produced by fossil-fuel combustion and are the main drivers of climate change attributed to human activity, mainly carbon dioxide (CO
2). Ref [
3] estimates that 27% of total greenhouse-gas emissions in the EU-28 in 2017 was produced by transport, 72% of which is attributed to road transport.
UN estimates that 54.4% of the population lived in cities in 2016 and predicts that by 2030 it will be 60% [
4]. The contribution of universities to sustainability of the cities is relevant [
5]. Universities can be considered today “small cities” due to their large size, population, and the various complex activities that take place on campus, which have a great direct and indirect impact on the environment. The sustainability of the campus has become an issue of concern for university planners and government environmental protection agencies [
6]. The US Environmental Protection Agency reported in 2000 that it was holding colleges and universities to the same standards as the industry regarding environmental and human health issues [
7]. More and more universities are committing to sustainability, albeit with different approaches [
8]. Some universities are playing an exemplary role as catalysts towards sustainable development [
9,
10]. In developing countries, there are few peer-reviewed studies looking at greenhouse gas emissions generated by universities. The shortage is most evident in Latin American universities. A group of Chilean universities signed an agreement with Chile’s National Cleaner Production Agency that includes a measurement of corporate greenhouse gas emissions among the objectives of this agreement [
11]. Suitable economic and environmental indicators must be defined to evaluate the problem and plan solutions. The Rio Summit of 1992 established the foundations for the creation of sustainability indicators, particularly the EF. This study focuses on the EF produced by the emission of CO
2 into the atmosphere, also called carbon footprint [
12]. The aim of this study is to calculate the carbon footprint associated with person mobility at the University of A Coruña (UDC), and to analyse the main influencing factors, with a special emphasis on transport modes. The results can be used to devise measures for impact reduction and to implement environment monitoring plans. This kind of analysis has been developed in other universities in different countries. Fifteen of these studies, from universities in Spain [
13,
14,
15,
16], Belgium [
17], UK [
18,
19], Australia [
20], Canada [
21,
22], China [
23], Thailand [
24], India [
25], and USA [
26,
27,
28,
29,
30] are used as comparisons of the values obtained in this research. The knowledge of UDC 2016 values and characteristics will allow researchers in the field to have additional comparative results to the set used in several previous studies, that includes UDC 2008 values (not previously published in a scientific journal but available in [
15]).
The next section presents the main characteristics of the UDC, such as the geographic characteristics of the campuses or the size of the population in 2016, both staff and students enrolled. That section also presents the methodology and the parameters used to calculate the EF of mobility (EFM) in the three studies conducted at UDC in 2008, 2016, and 2020.
Section 3 presents the results of mobility habits and their carbon footprint, inferred from the survey carried out in 2016. The results are analysed according to the different types of journeys, transport modes used, and the individual profile.
Section 4 discusses challenges, trends, and policies related to universities sustainability. It explores in detail the mobility habits in the UDC and evaluates policies to reduce the mobility carbon footprint that can be applied in UDC and other universities. The results of the CUs (commutes from the place of residence to the university campus) are compared with those obtained in UDC in the previous study carried out in 2008 (not previously published in a scientific journal but available in [
15]) and the pilot survey conducted in 2020 with a georeferencing service developed at the UDC (not previously published). The total EFM per capita (EFM pc) is compared with that obtained at other universities worldwide.
Section 5 presents some conclusions from the findings and proposes next steps to continue with the analysis of UDC’s carbon footprint and reduction policies that could be applied.
2. Materials and Methods
The environmental impact of mobility at UDC in 2016 was analysed using the methodology established by [
31]. This approach involves calculating the EF, a synthetic indicator of the environmental impact of human activities related to physical space, allowing a comparison with biocapacity indicators. The ecological sustainability of human activity in the environment can thus be evaluated. Those authors defined the EF as the area of ecologically productive territory (crops, pastures, forests, or aquatic ecosystems) necessary to produce the resources utilised and to assimilate the waste produced by a given population over a year, for a given living standard. Van der Berg and Grazi [
32] points out that EF is perhaps the best known and most used environmental indicator worldwide. This indicator has been widely used as a tool for measuring sustainable development (see [
33] for a list of cases), although that use has been subjected to some scientific debate [
32,
34,
35].
The EFM, carbon footprint, or EF needed to absorb the emitted CO
2 corresponding to one year’s worth of personal travel for UDC-related activity is calculated using equation (1), and this is the main component of transport-associated EF. Other minor contributions were not included, such as the transport of goods, the parking area on the campuses (5 ha at UDC), the road network, and the crop area associated with generating energy for cycling or walking. Although the EC could not only account for direct CO
2 emissions but also for indirect emissions and occupied land [
36], these other components are not included in the calculation.
The CO
2 fixation capacity of the ground is the number of tons (tn) of CO
2 present in the atmosphere that can be fixed by a hectare (ha) of land in a year. This study uses the value 6.27 tn/ha of local forest [
4,
13], the same as that used in the studies for 2008 [
15] and 2020. To facilitate comparisons with results obtained at other universities, we adopted a globalised value of ha (gha, [
4,
13,
37]) for calculating the EFM by considering the world-averaged biological productivity. The correspondence factor is 1 ha of forest = 1.34 gha.
The EFM was calculated by including the following transport categories: Commutes from the place of residence to the university campus (CU); for those people who relocated because of their activity at UDC (‘displaced’ persons), commutes to their former home -or place of origin- (CH); and other unusual journeys (NC).
The indicator was calculated by performing statistical inference from a sample of respondents, based on a survey of mobility habits. The 2016 survey was conducted between April 20 and May 23 with an online questionnaire developed on the university’s website. The previous 2008 survey was conducted in May with a paper-based questionnaire. The 2020 survey was conducted in April through the emapic georeferencing service (
https://emapic.es) developed at the UDC.
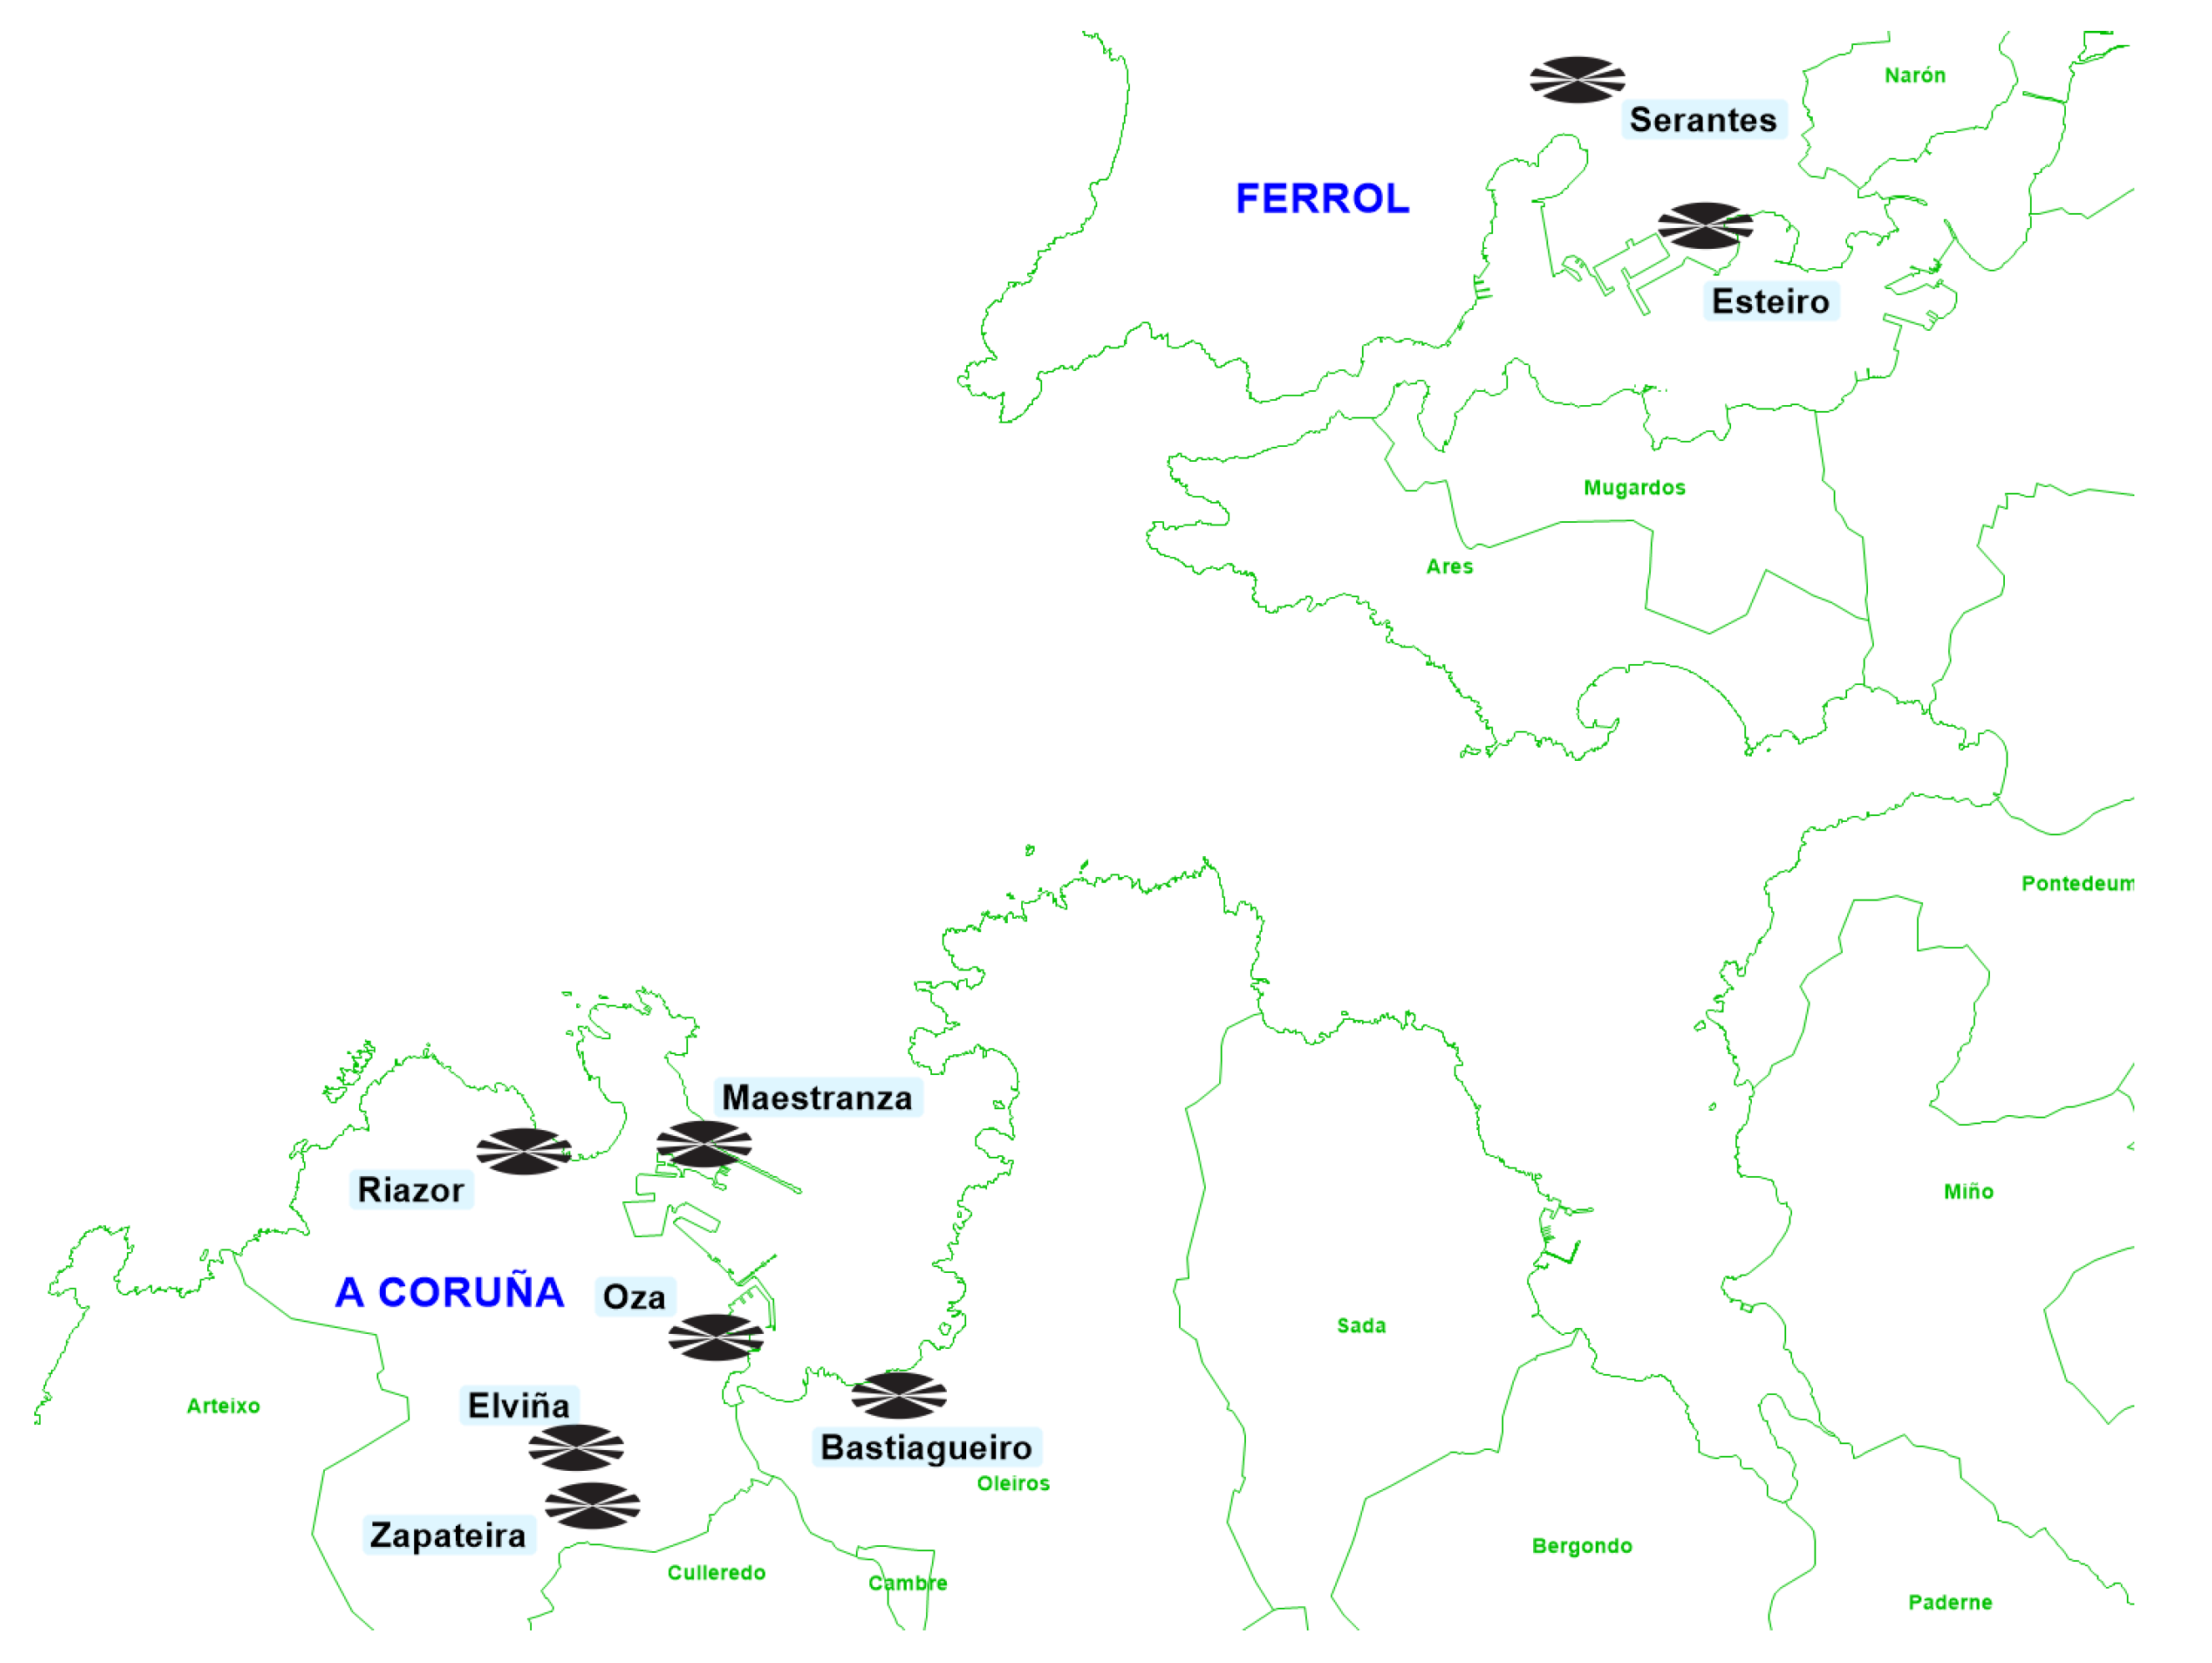
UDC is a public university in Spain with eight campuses distributed in two metropolitan areas, as shown in
Figure 2. There are six campuses in the metropolitan area of A Coruña: Three are located in the urban area and three in the non-urban area (outside the city centre or even, in one case, outside the city-council limits). The two campuses in the metropolitan area of Ferrol (one of which is very small) are here combined and are simply denominated ‘Ferrol’.
The population considered in this study comprises all the students and internal staff at UDC, which include administration and services staff (A&S staff) and training and research staff (T&R staff). External personnel (e.g., cafeteria staff) were not included. Mobility habits were inferred by assuming the student presence over 8.5 months and staff presence over 11 months per year. The population data, segregated according to campus and sub-population, were obtained from the UDC internal databases (
Table 1). The table also shows the distribution of the 492 valid survey responses. Elevation factors were applied to the sample to calculate weighted means for the different sub-populations and campus types.
The total emission corresponding to each respondent was calculated by considering the emission factor of the mode of transport utilised, which is the amount of CO
2 (kg) that a given mode of transport emits into the atmosphere per kilometre travelled. In the case of car travel, the number of occupants was also considered. The emission factors considered were: 0.20, 0.10, 0.07, and 0.05 kg of CO
2/km for cars, depending on the presence of one, two, three, or four car occupants, respectively; 0.06 for motorcycle travelling; 0.03 for buses and trains; and 0.11 for airplanes. Non-emitting transport modes (e.g., on bicycle or on foot) had an emission factor of 0 [
4,
13].
The level of significance (LoS) used for inference was 5%. The hypothesis of equality of variances was tested using F-tests to choose the type of test in each contrast of the hypothesis of equality of means: t-test or Welch.
3. Results
In this section, the results obtained in the 2016 survey are presented. UDC students and internal staff performed 3,885,632 journeys covering 100,117,053 km in total in 2016, amounting to a direct emission of 10,188 tons of CO
2 into the atmosphere. The EFM was 1625 ha of local forest land or 2177 gha, corresponding to 29 times the total area occupied by UDC (the total area occupied by the eight UDC campuses is 56 ha) or 148 times its biocapacity to absorb the gases (the forest land of UDC is 11 ha). The EFM equals 49% of the total EF of UDC in 2016. A summary of EFM and EFM per capita (EFM pc) is presented in
Table 2.
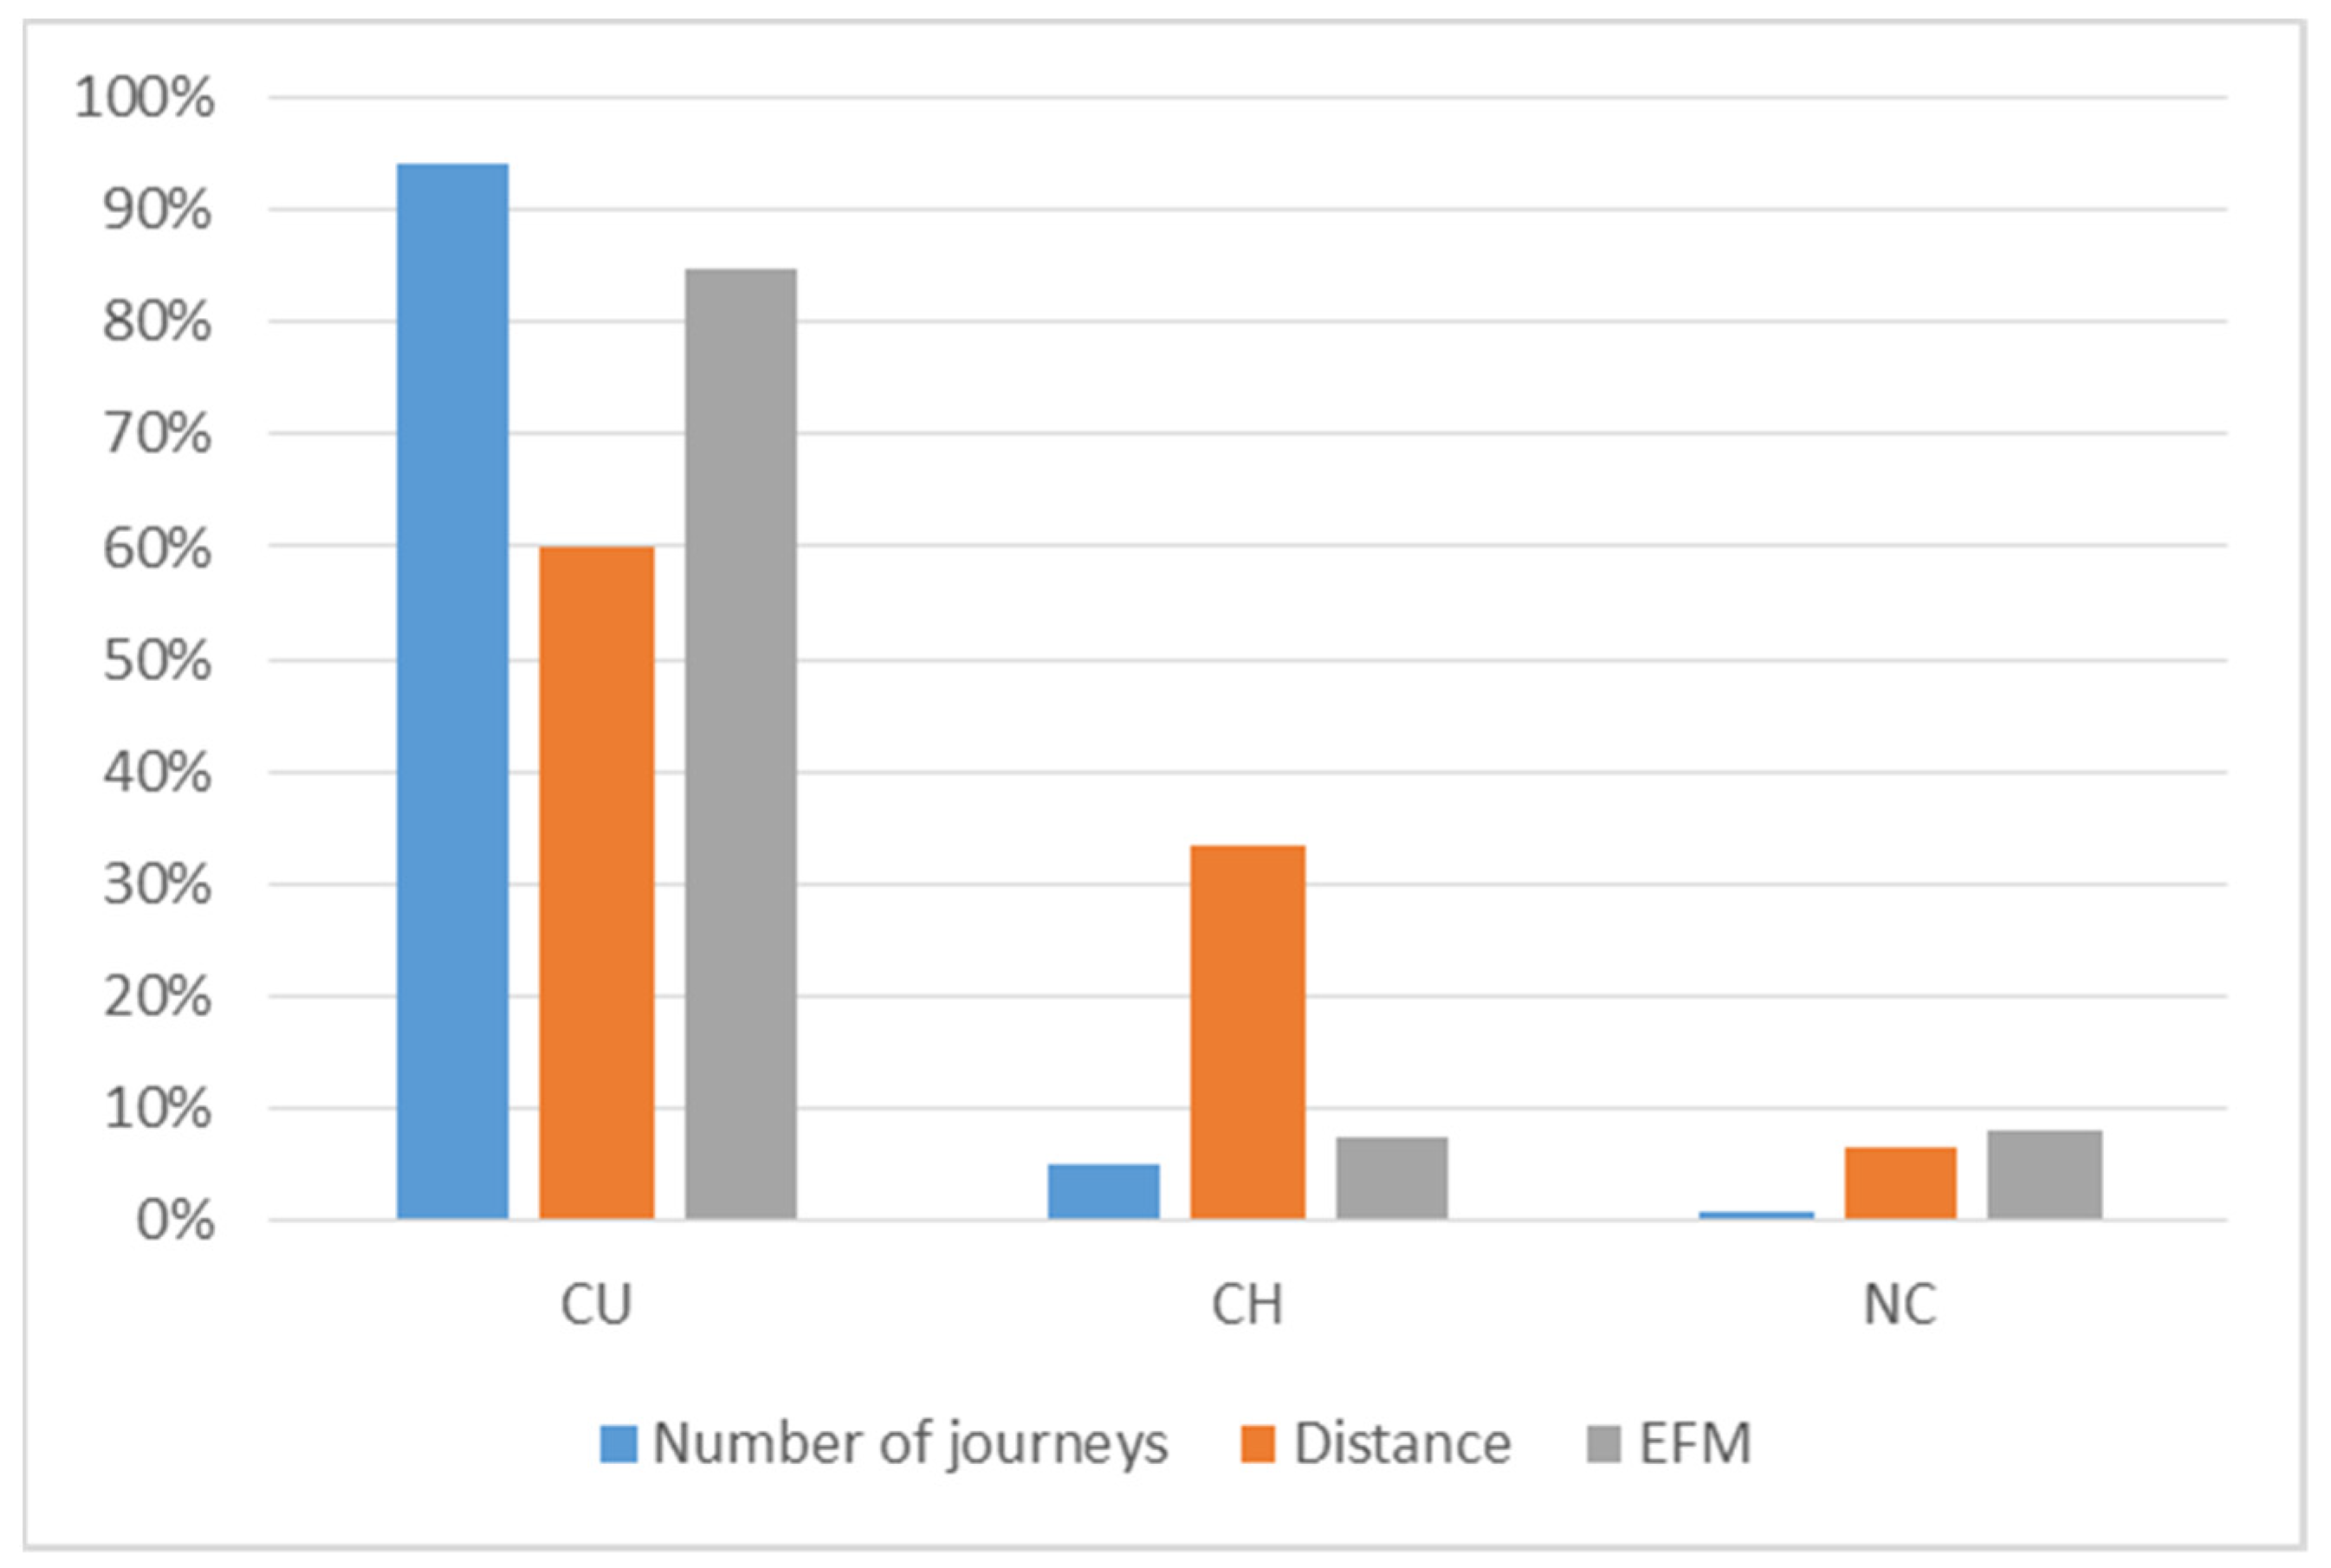
Figure 3,
Figure 4,
Figure 5 and
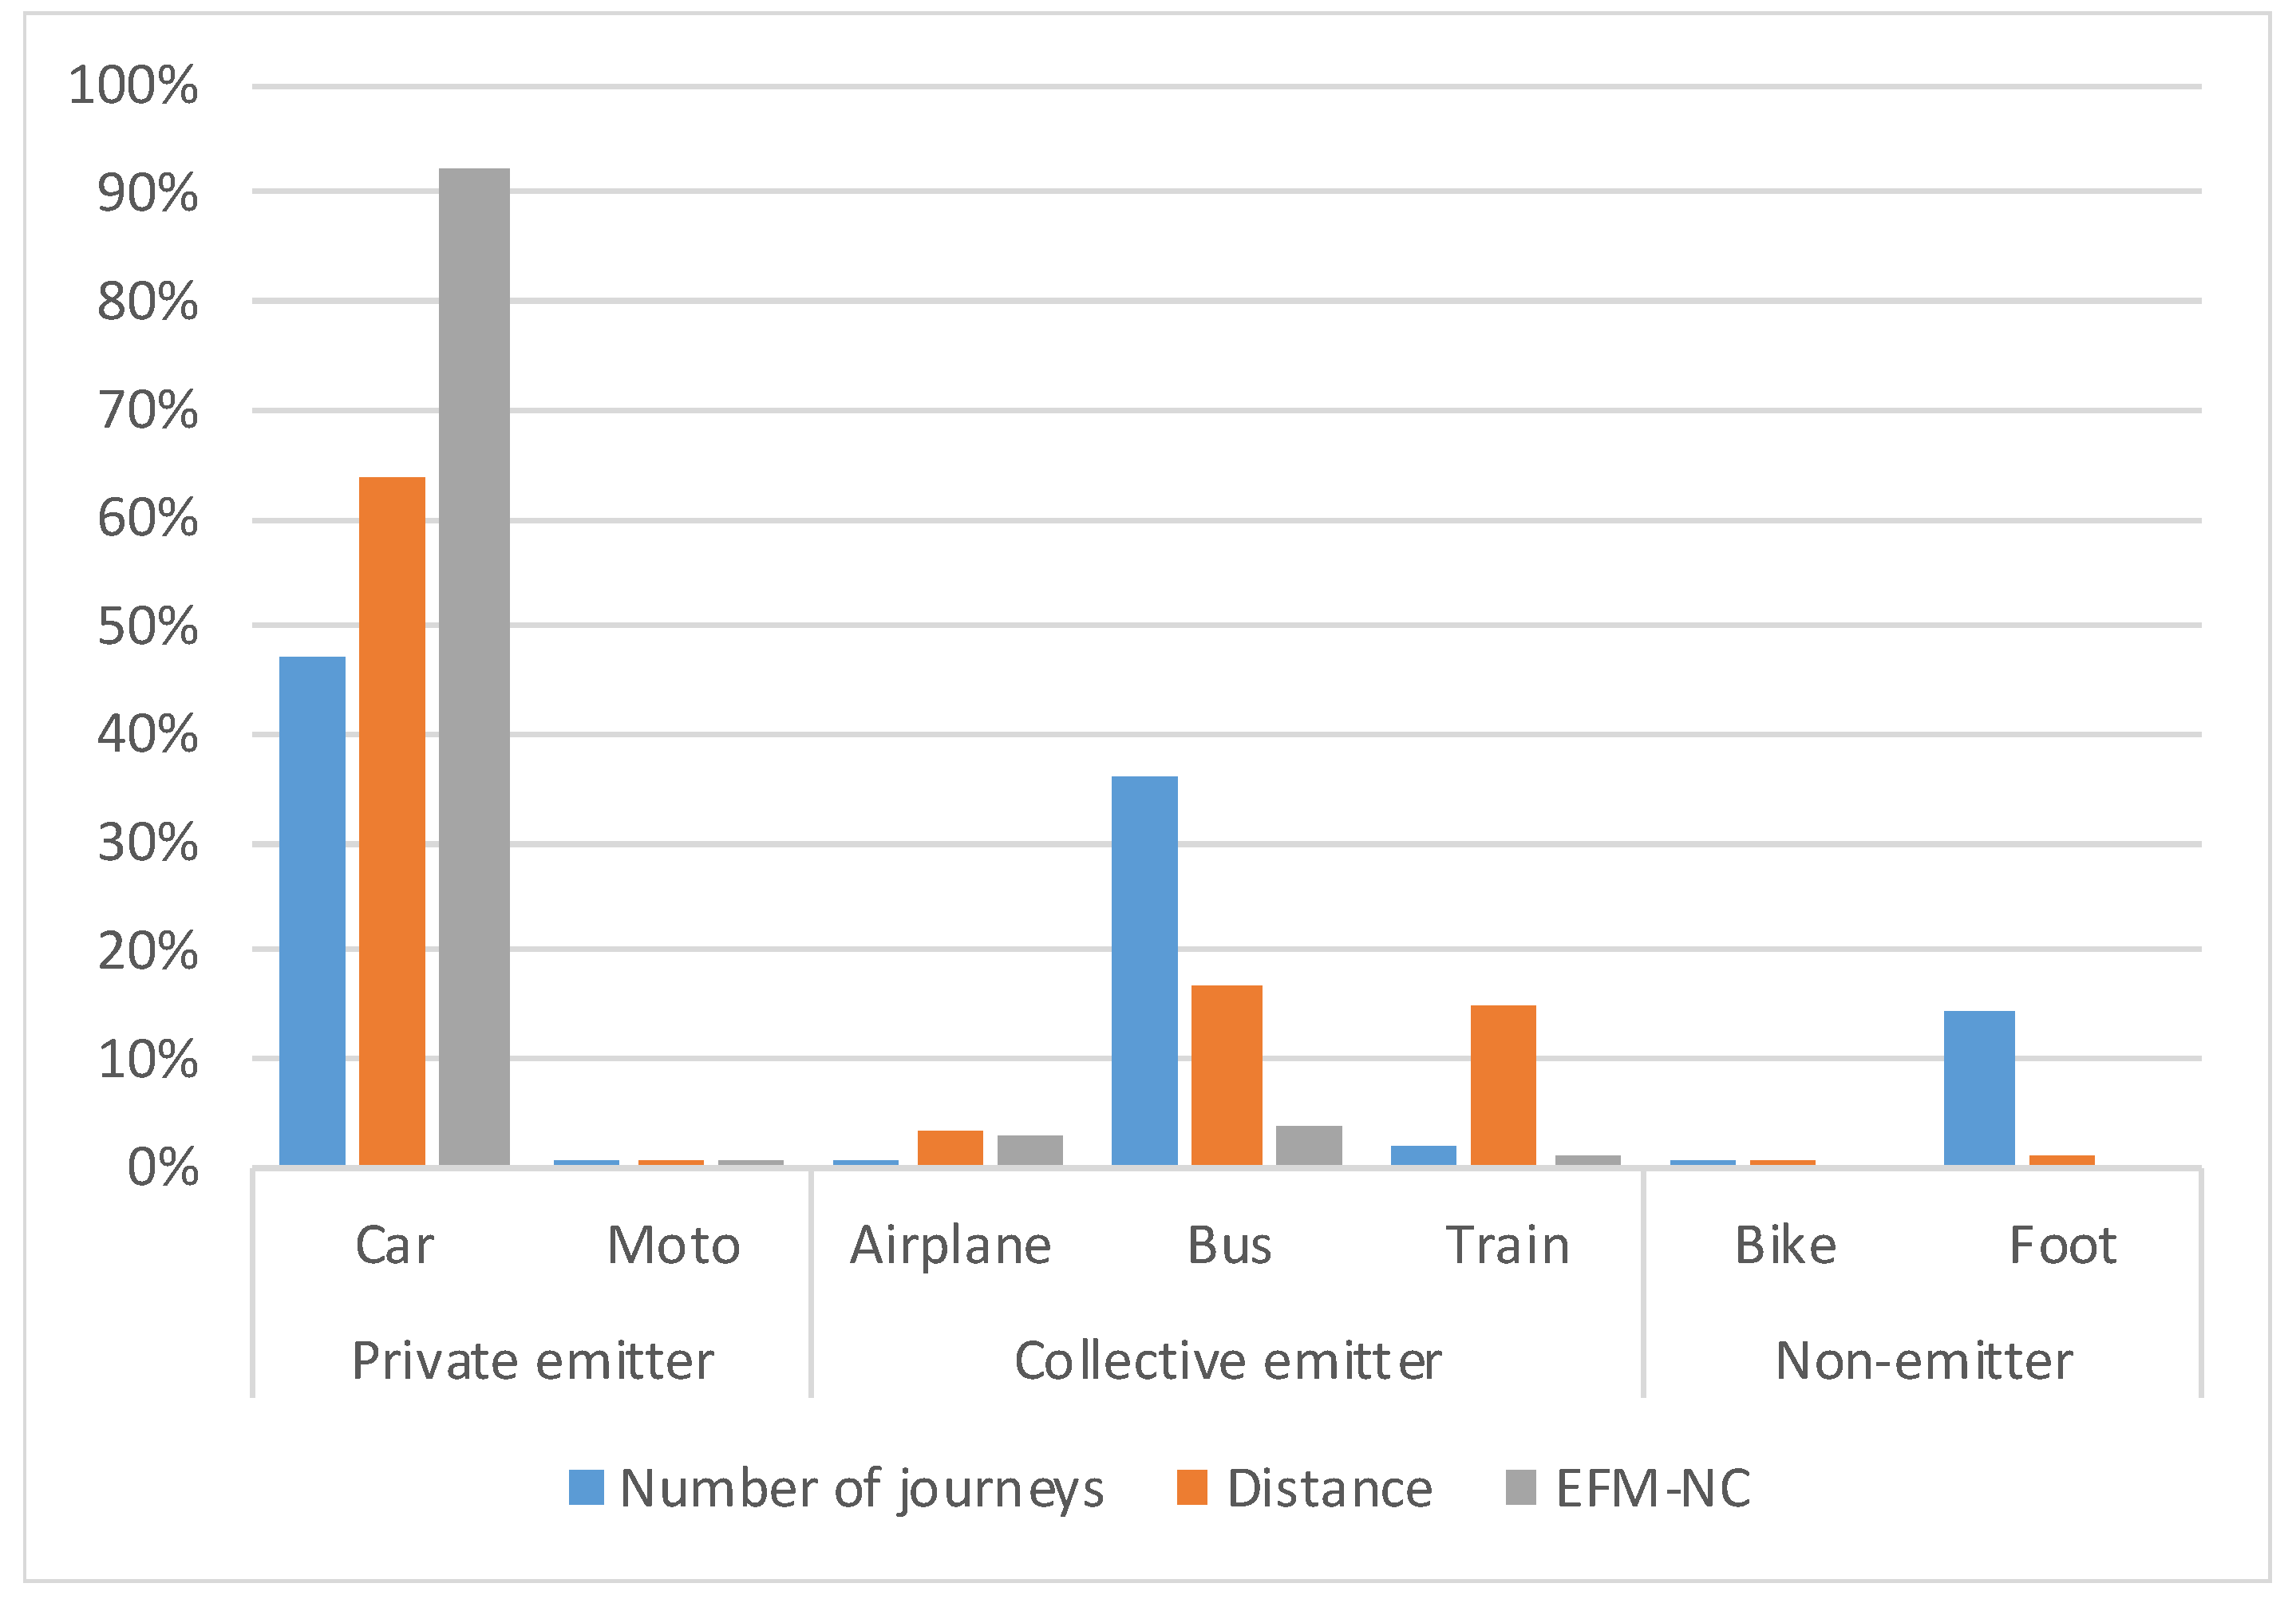
Figure 6 show the main characteristics of journeys made by the survey participants, and their EFM. Most importantly, 85% of the total EFM was generated in CU, which represents 94% of the total number of journeys and 60% of the distance covered. Additionally, 84% of people at UDC made a CU journey at least four days per week during the school year. Interestingly, 92% of the total EFM was generated by car trips, and 80% of the total EFM was generated by car CU trips. In addition, 15% of all journeys were made by non-emitting transport modes (only 0.2% by bicycle), representing 1% of the total distance travelled. The remaining 38% of the total number of journeys were made by a collective mode of transport (bus, train, or plane), accounting for 35% of the total distance travelled, and only for 8% of the EFM.
Table 3 shows that 64% of CU-related car journeys counted a single occupant, which was 72% in the case of staff. The EFM is reduced by 70% by switching means of transport from car to motorcycle, by 85% by switching to bus/train, and by 100% when switching to cycling/walking.
The EFM per capita (pc) for CU journeys (EFM-CU) is 0.0663 ha (see
Table 4) and shows a high degree of dispersion (coefficient of variation 1.8) due to the high dispersion of the distance between the place of residence and the campus (coefficient of variation 1.5) and the large difference between the CO
2 emissions factor of each transport mode.
EFM-CU values show significant differences between campuses (see
Table 4 and
Figure 7). The remoteness of a campus from an urban centre and the presence, availability, and proximity of car-parking facilities all significantly and directly influence the choice of the car as mode of transport for CU. This in turn affects the EFM and EFM-CU pc as follows:
The EFM-CU pc for non-urban campuses in A Coruña is 2.2 times greater than that for the urban campuses in the city; 50% of CU journeys to non-urban campuses are made by car, approximately 14% more than that to urban campuses.
USC, a university located close to UDC (75 km away), applied the same methodology (including local value of CO
2 emission and absorption parameters) for its EFM calculation [
13]. The EFM-CU pc for USC for 2007 was 0.04 gha, the same as that for the urban campuses of A Coruña, as USC campus is an urban one.
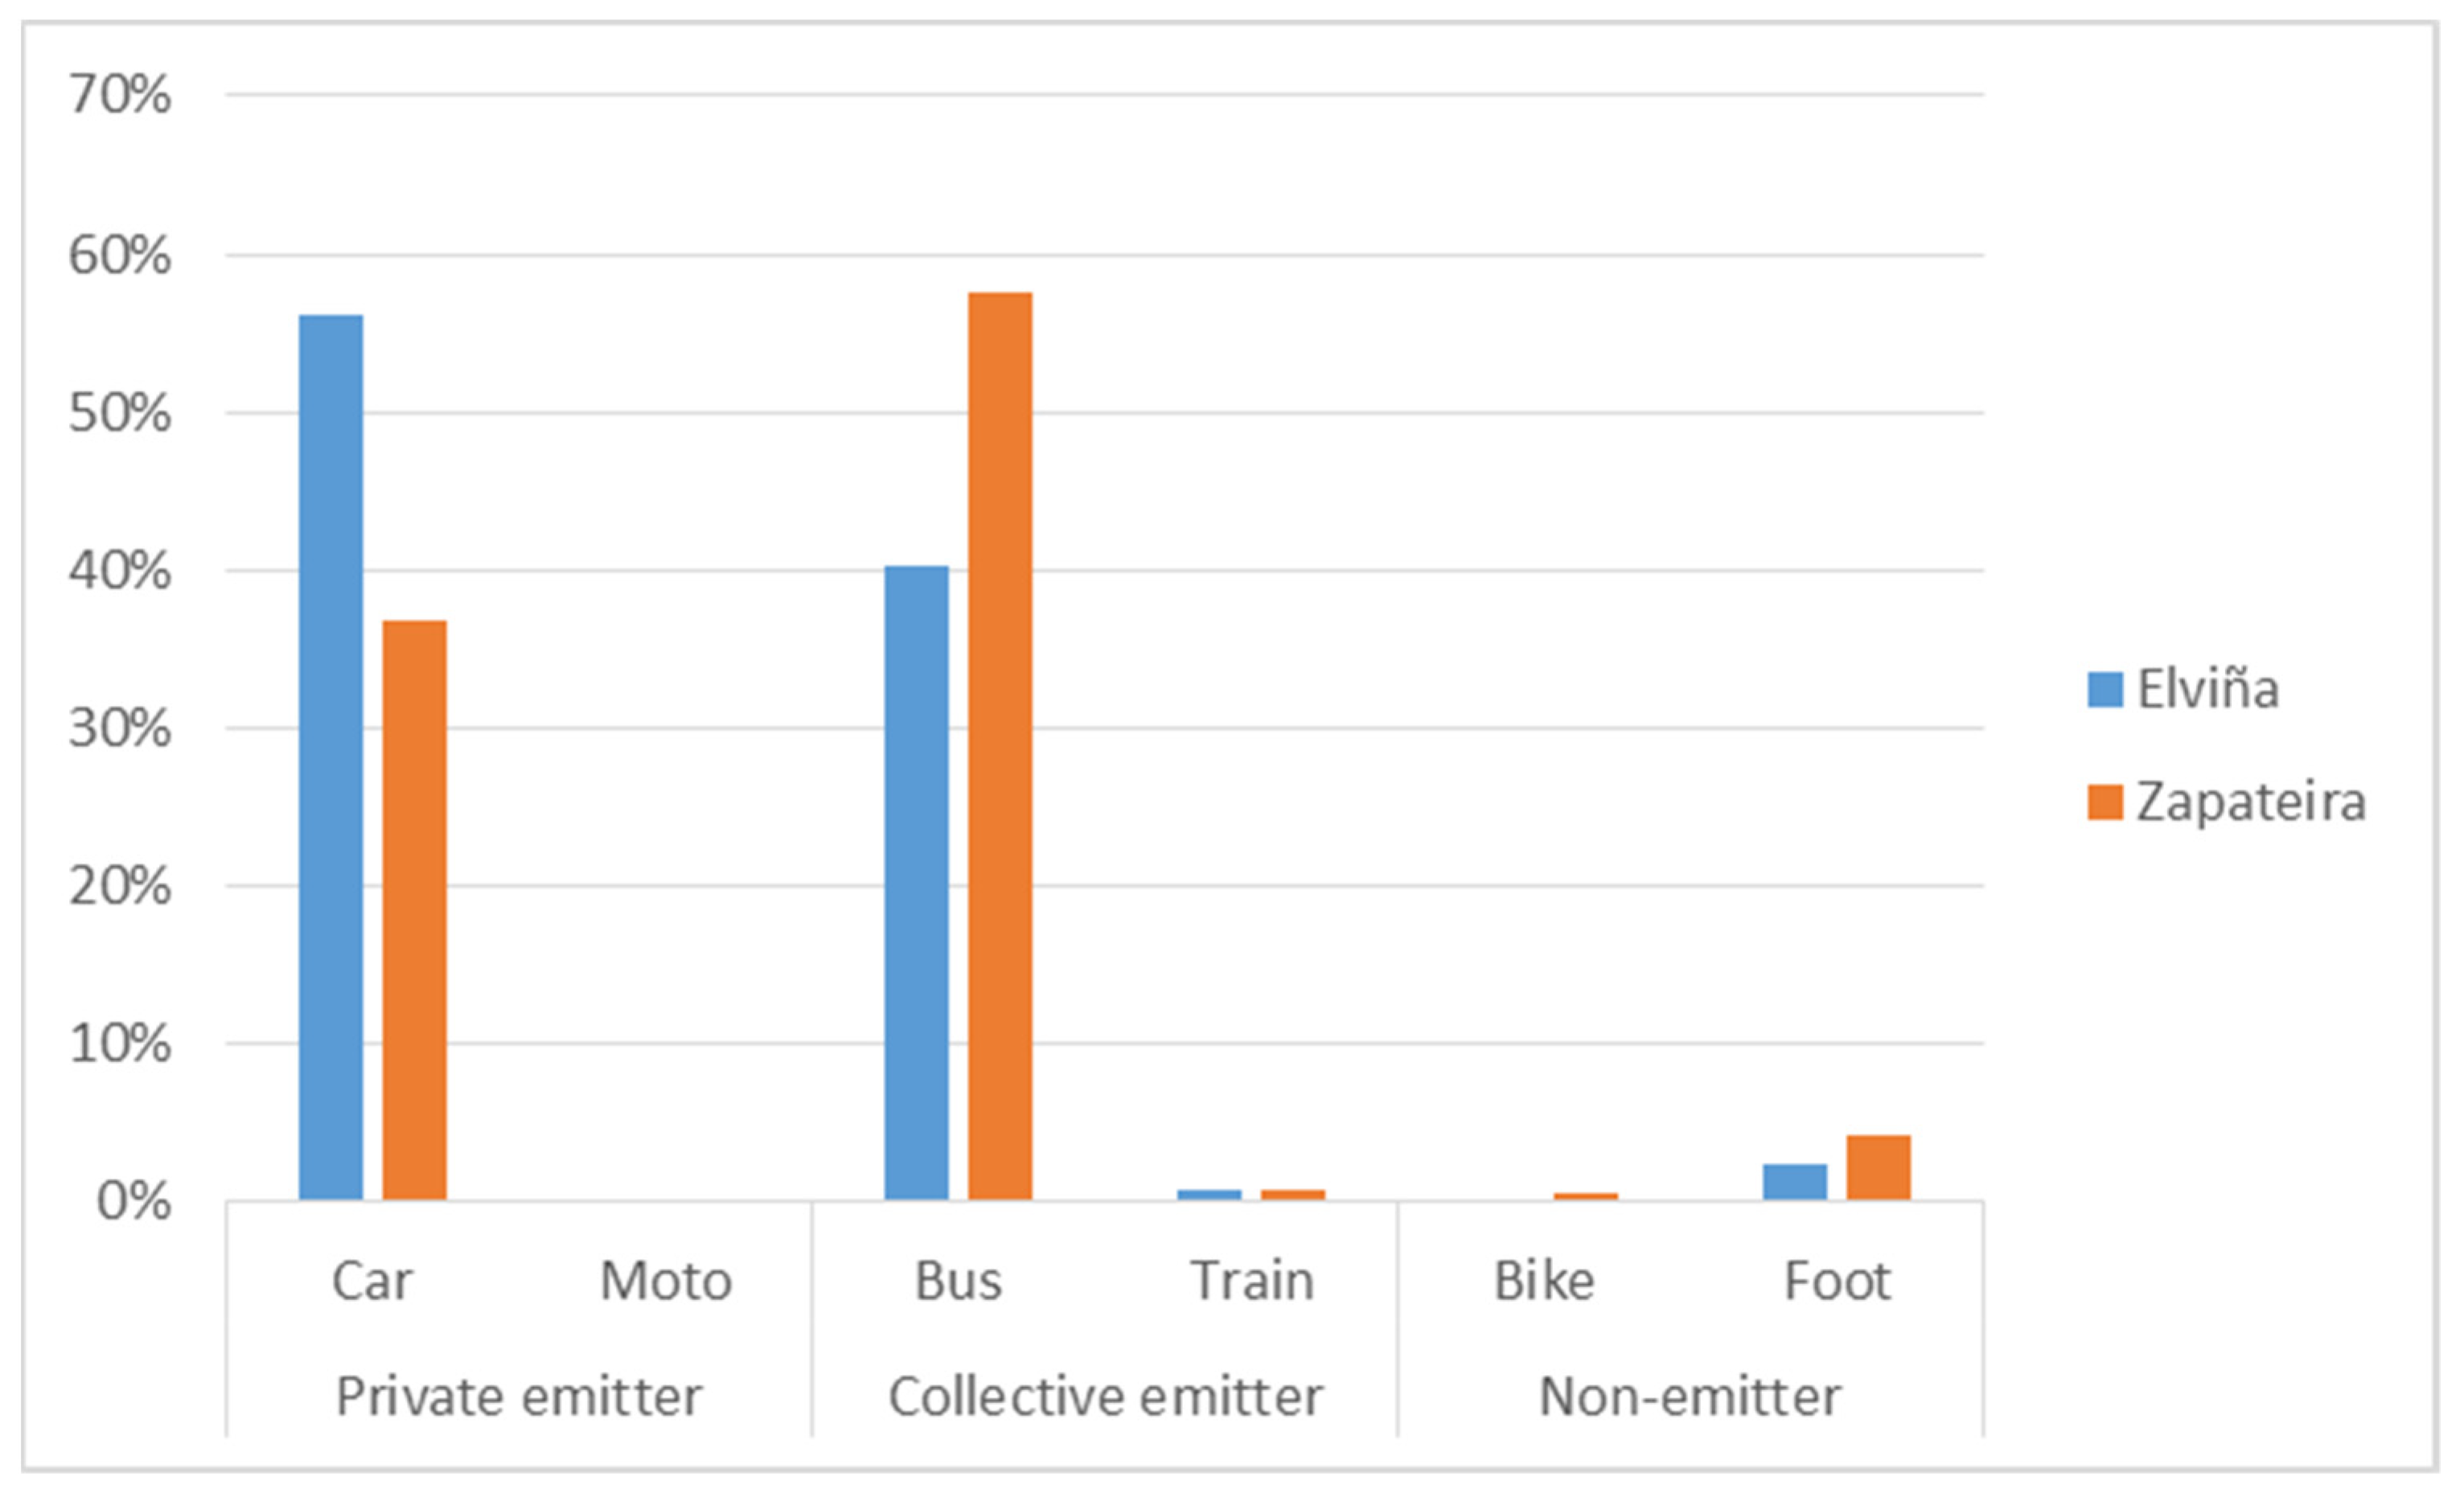
Zapateira and Elviña, two non-urban campuses in A Coruña, are the most populated campuses in UDC (comprising 21% and 49% of the total UDC population, respectively). They are in close proximity and share the same bus line to the city centre. However, EFM-CU of the car journeys for Elviña is greater than that for Zapateira. In Elviña, CU car journeys account for 54% of the total CU, while in Zapateira, they account for only 36%. Elviña and Zapateira both provide free car-parking facilities. In Elviña, this facility is at the ground level and is located near the study centres, whereas the multi-storey car park in Zapateira forces commuters to walk a longer distance to reach their study centres.
The campuses of the metropolitan area of Ferrol have an EFM-CU pc that is 50% greater than that for the metropolitan area of A Coruña, and thrice that value for the urban campuses in Coruña.
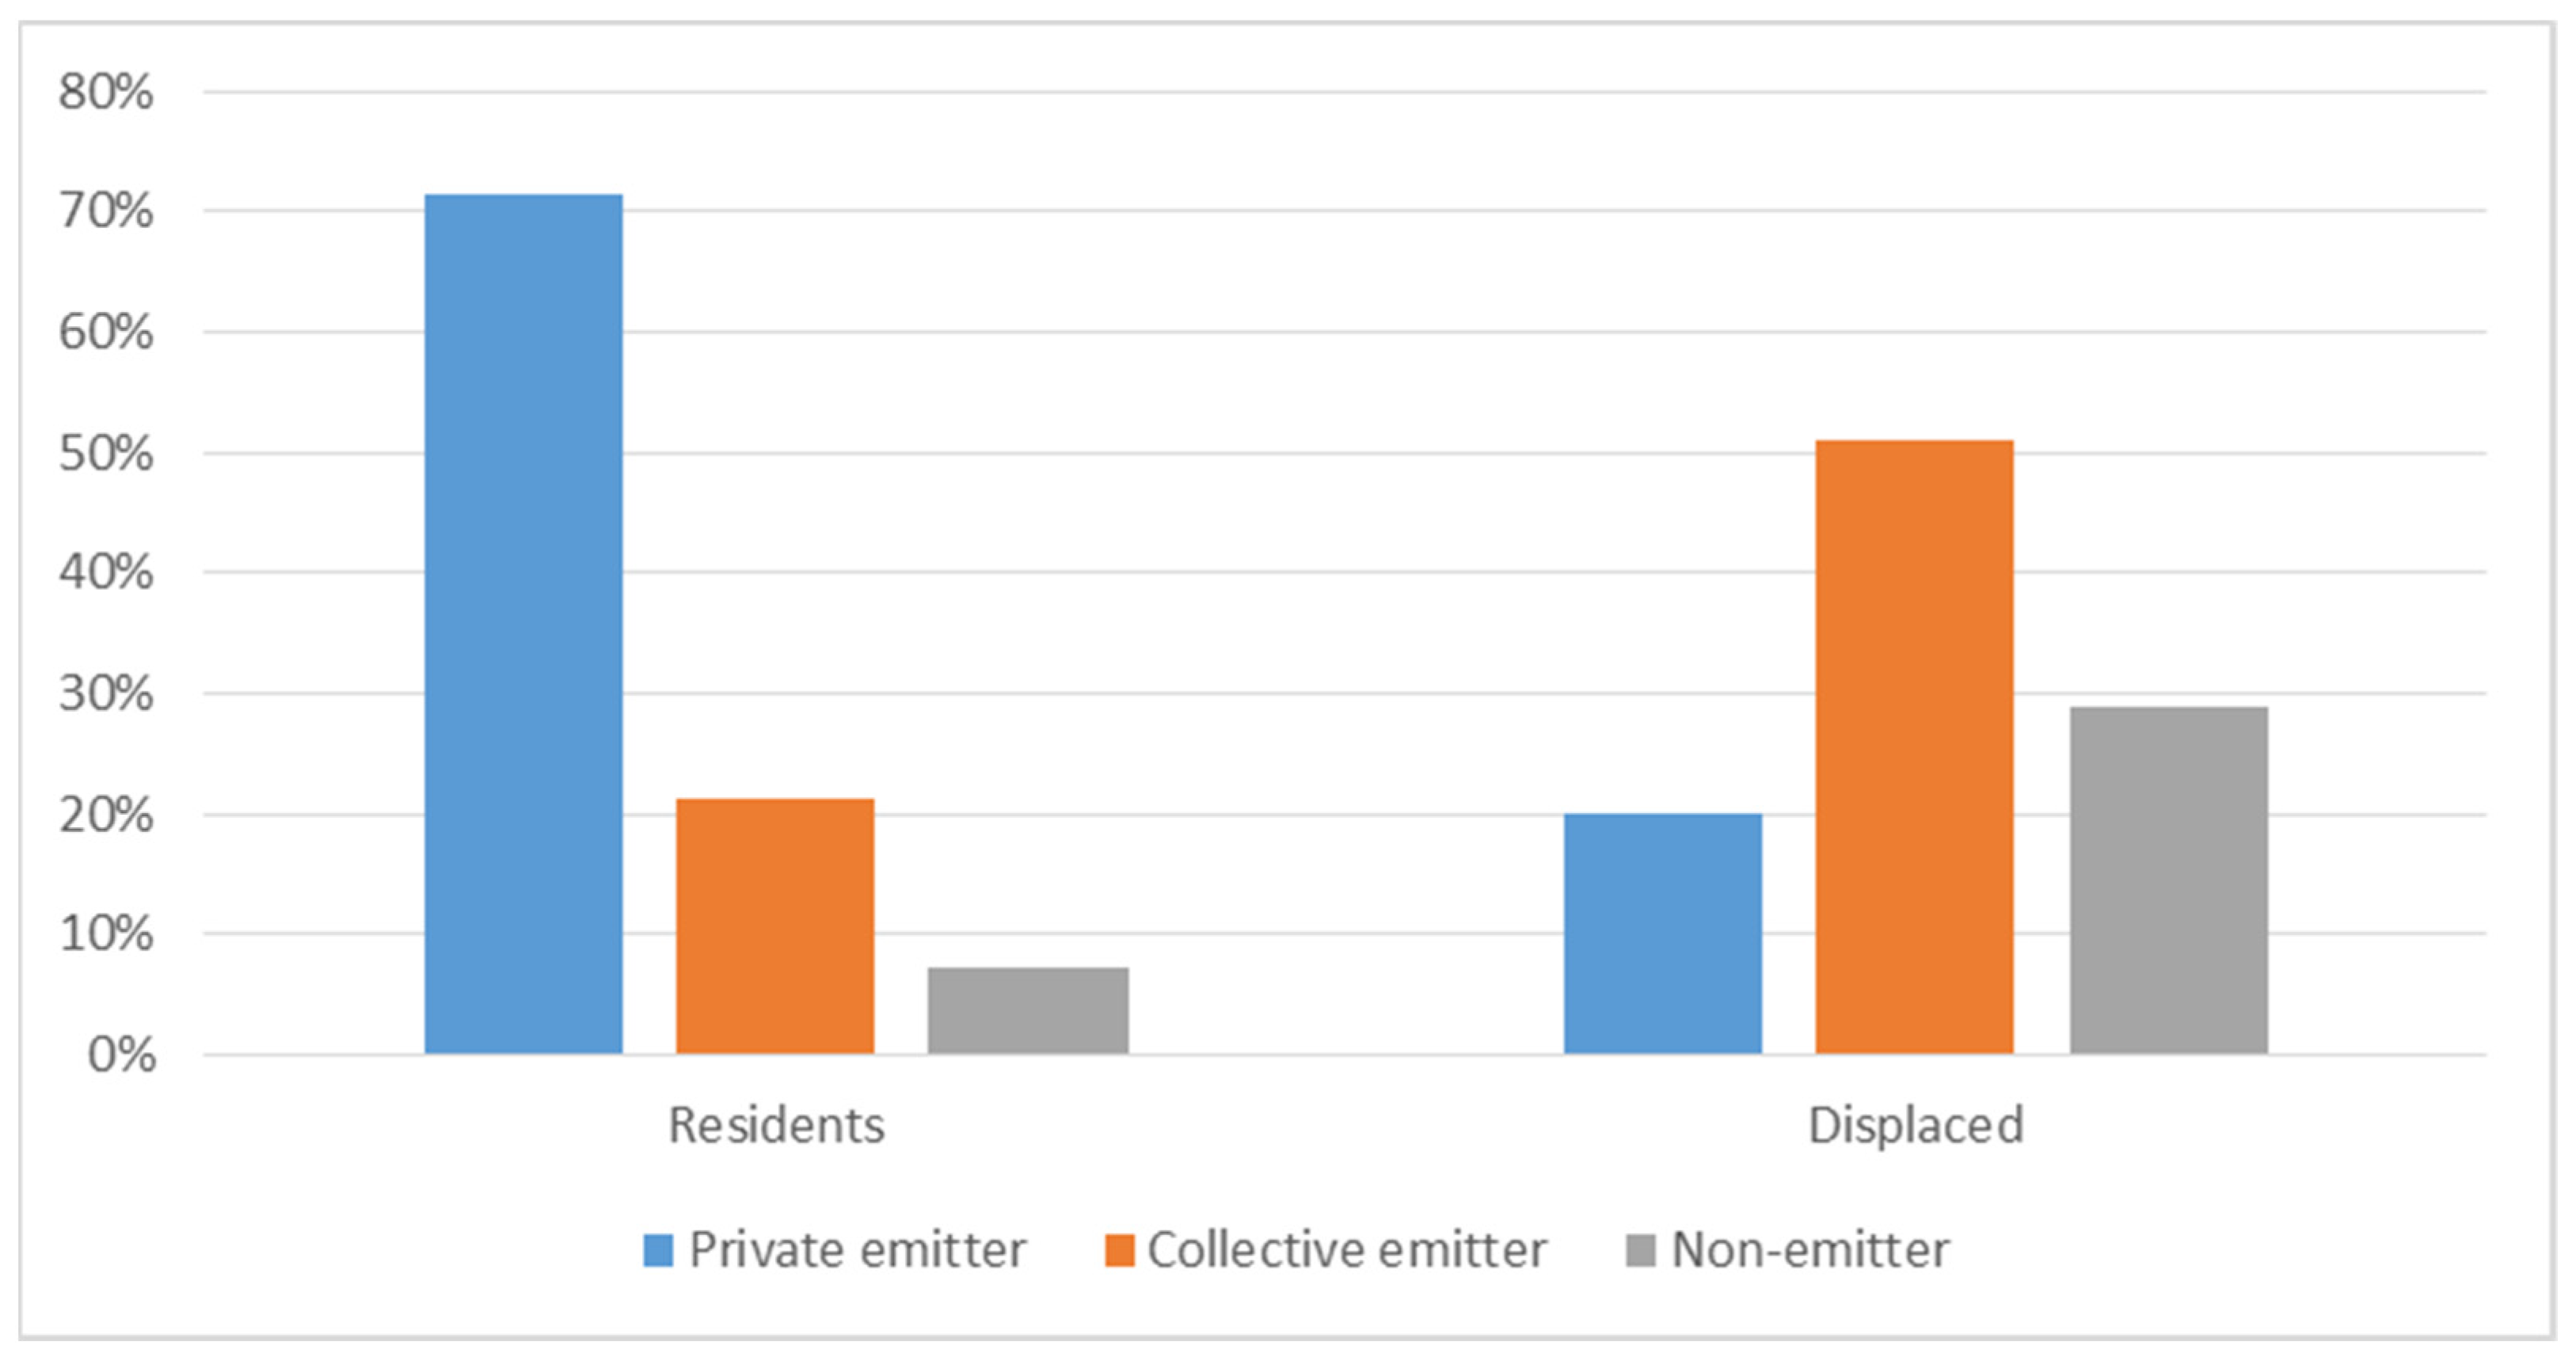
The 60% of the total population that did not change their place of residence because of their activity at the university (‘residents’—see
Table 5) produce a significantly greater EFM pc than those who did change it (‘displaced’ persons). This is true even when considering the EFM of the CH journey (EFM-CH)—the journey to the place of origin— that displaced individuals make once a week on average and that the residents do not. Residents have an EFM pc that is a factor 2.5 times greater than that of displaced people, and their EFM-CU pc is 4.2 times greater.
The reason for the smaller EFM pc values for the displaced persons is the greater proximity of their chosen place of residence to the university (median values: 4 km for displaced persons vs. 7 km for residents). This results in a less frequent use of cars for CU journeys compared to the residents. A proportion of 18% of all CU journeys are made by car in the case of displaced people; this proportion rises to 65% in the case of the residents. As shown in
Figure 8, displaced persons travel 29% of CU journeys on foot or on bicycle, compared to residents who perform 7% of CU journeys on foot or on bicycle. Displaced persons use a bus for 50.5% of CU journeys and a train for 0.5%, while residents do so for only 21% of CU journeys. Displaced persons use a car for 19% of CU journeys and a motorcycle for 1%, in contrast to 71% of CU journeys being made by car or motorcycle by the residents.
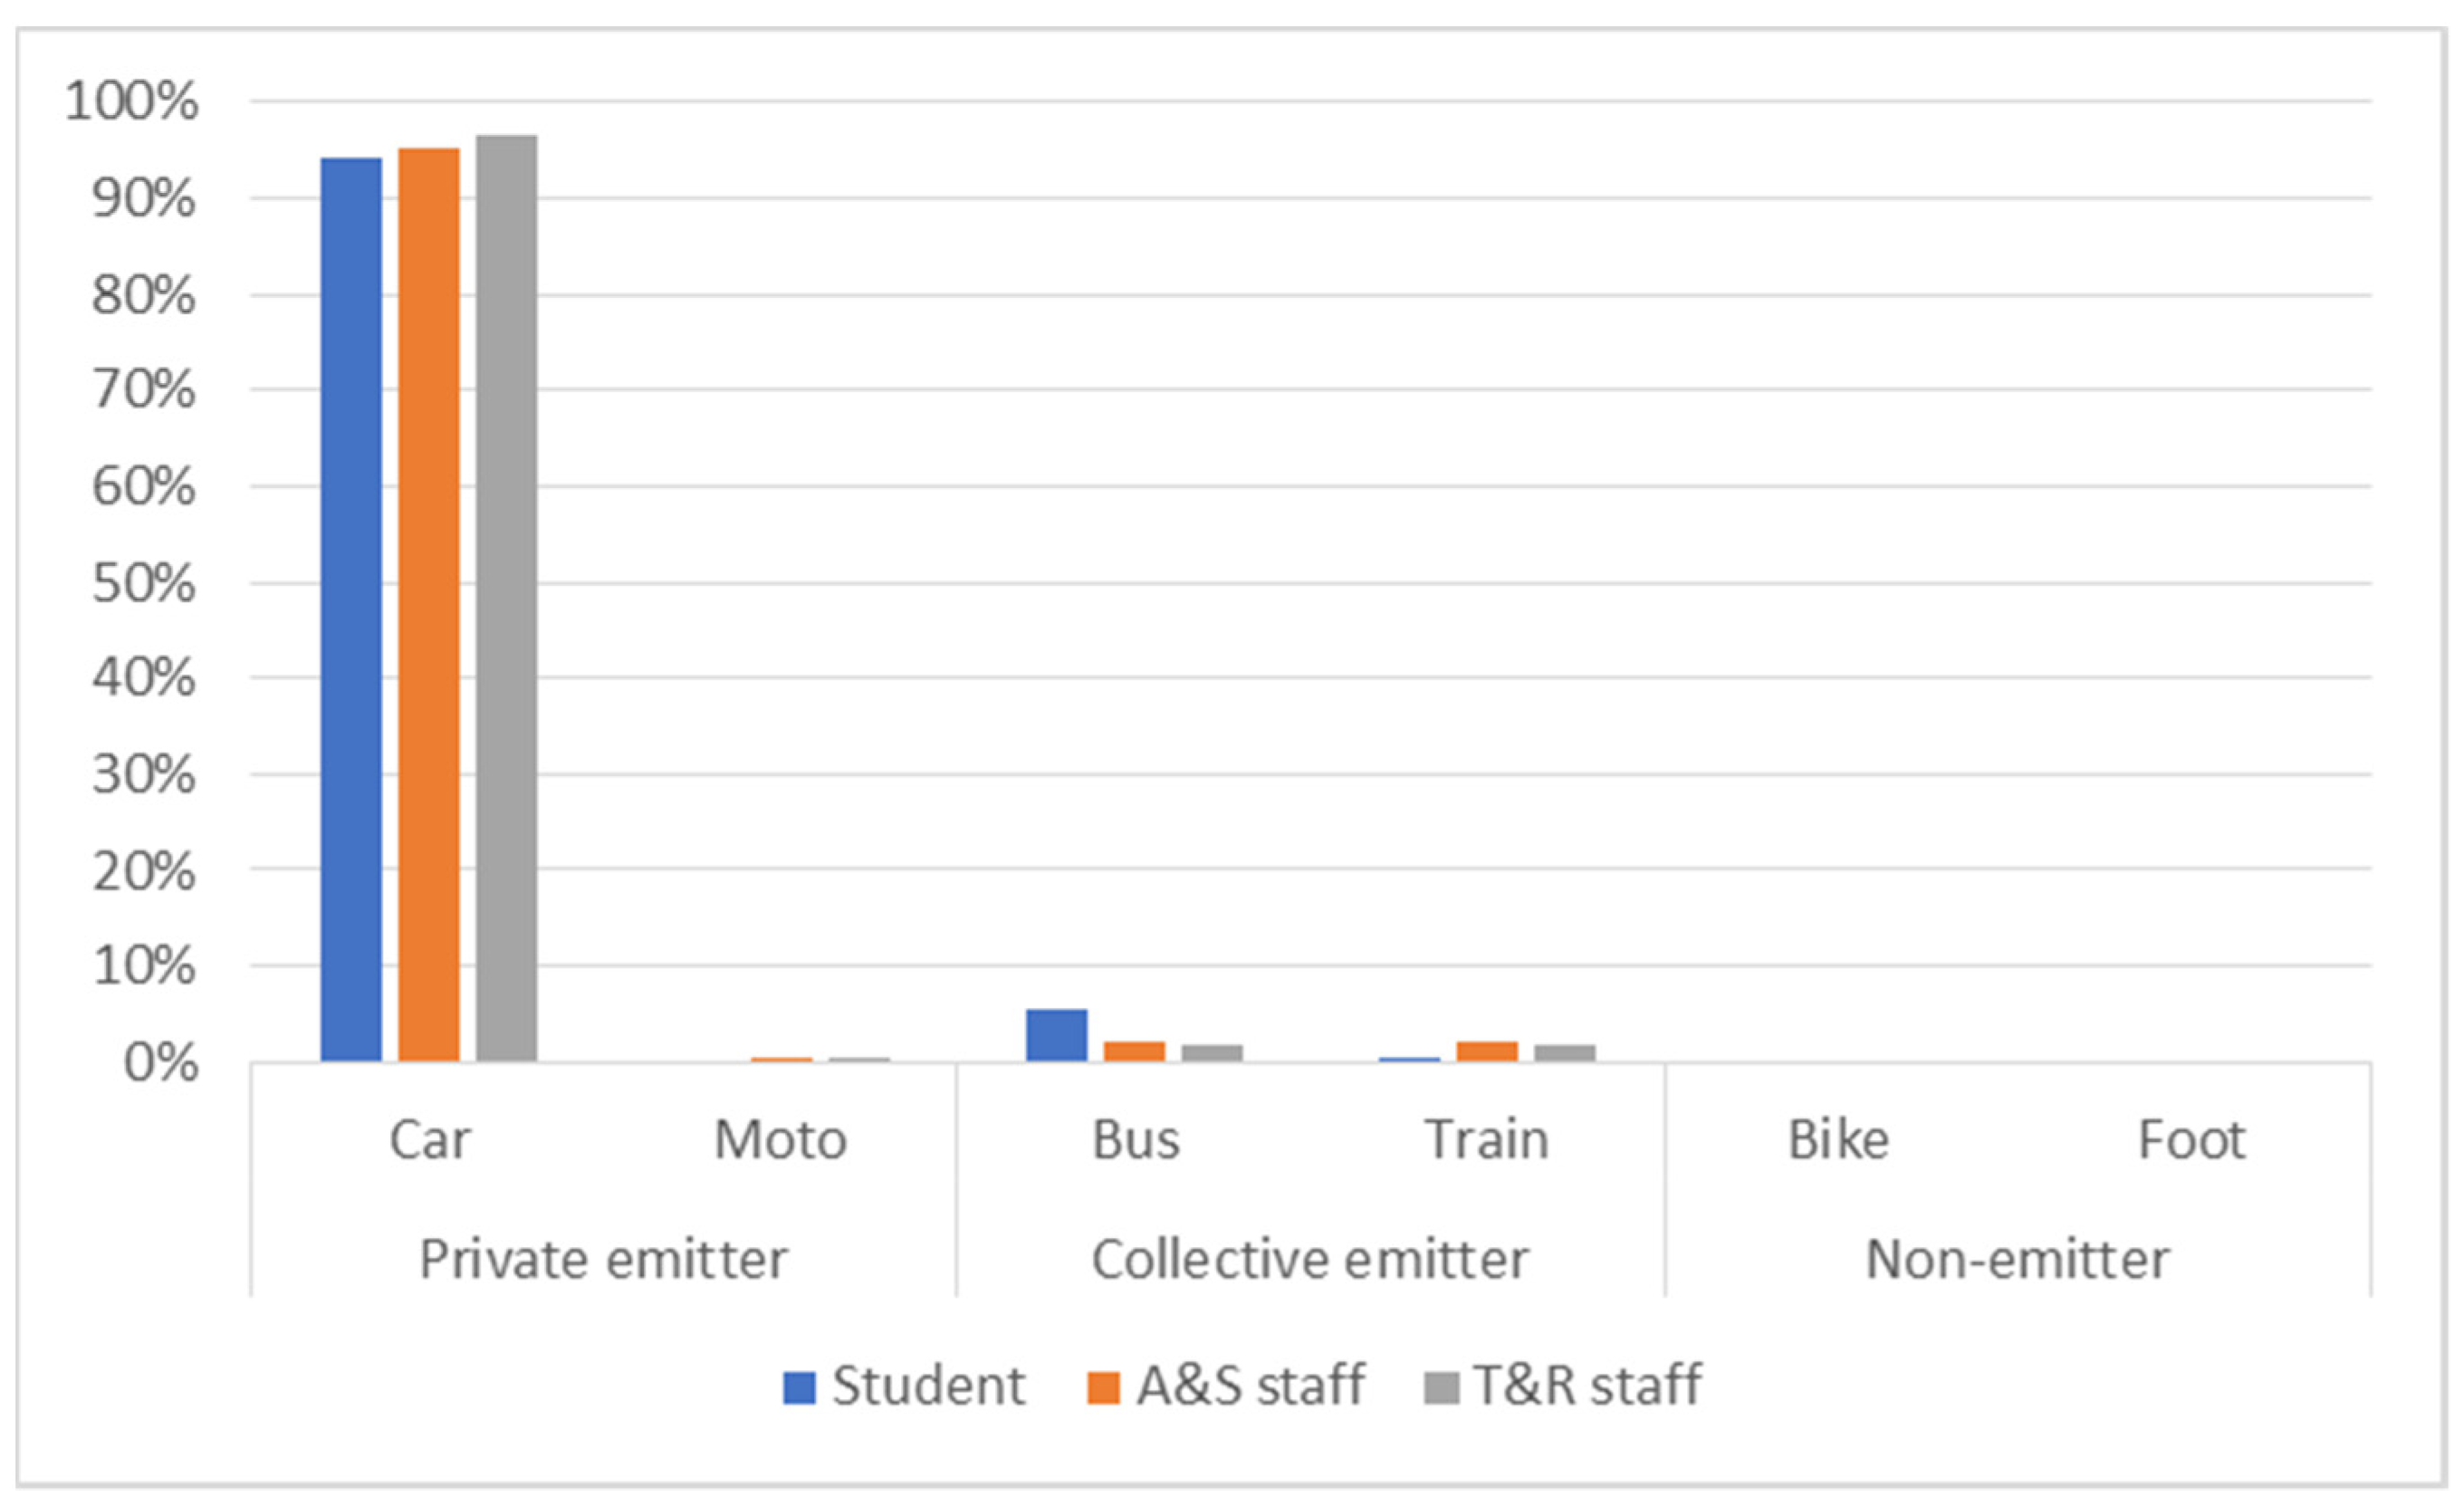
Table 6 shows that staff, who constitute 11% of the total UDC population, generate 21% of the EFM. The EFM pc is 2.2 times greater for staff than for students. However, their work calendar is longer than that of the students. In any case, the EFM pc in a given month of the school year (EFM pcm) for T&R staff is significantly greater than that for students or A&S staff at the 5% LoS. The means and variances of EFM pcm do not differ significantly between students and the A&S staff at the 5% LoS, but they do differ significantly between A&S and T&R staff. Staff use a car more frequently for CU journeys than students (74% vs. 42%). T&R staff reside further away from the campuses than A&S staff or students (7 km median value vs. 5.5 or 5.7, respectively). The EFM pc for males is 20% greater than that for females (see
Table 7), but it is not significantly different at the 5% LoS.
A total of 8% of the EFM is generated by NC (unusual journeys). This is the least frequent type of travelling, with only four journeys pc made in 2016 on average. The distances travelled in NC journeys are highly dispersed, with a standard deviation of 750 km, a mean distance of 325 km, and a median distance of 65 km. A fraction, 33%, of the UDC population made some kind of extraordinary non-commuting journey in 2016, 86% of which were students (including doctorate students), and 14% were staff, mainly T&R staff (12%). The purpose for these journeys was primarily for attending conferences, secondly for teaching or research stays for staff, and thirdly for study stays spent by the students in other universities.
Figure 9 shows that car travel is the most frequently used transport mode in NC journeys (64%). It generates 39% of the EFM-NC, with 27% of the total distance covered by NC journeys. Airplane travel is only used for 13% of NC journeys, but it generates 58% of the EFM-NC with 64% of the total distance covered by NC journeys. Bus travel is used for 13% of NC journeys, generating less than 1% of the EFM-NC with 1% of the total distance covered by NC journeys. Finally, the train is used for 10% of NC journeys, generating 2% of EFM-NC with 8% of the total distance covered by NC journeys.
4. Discussion
Universities play an important role in sustainability [
38]. Sustainability is a new paradigm affecting all areas and activities [
39]. The Sustainable Development Goals (SDGs) were set in 2015 as part of the UN 2030 Agenda for Sustainable Development. The European Union is also committed to implement SDGs in all policies and EU countries. The increasing interest of higher education institutions around the world in improving their sustainability performance can be enhanced with the use of assessment tools that allow comparison among institutions [
40,
41]. Sustainability offices at universities coordinate the institution’s efforts in sustainable development and foster awareness among students and staff of the importance of this goal. Nevertheless, the existence of sustainability offices is not as common as it should be, and they encounter key obstacles such as the lack of specific funding and the lack of support from administrations [
42].
Amaral et al. [
43] carries out a bibliographic review on the sustainability policies implemented and case studies in universities around the world reported in scientific publications. The research proposes to establish an integrated framework to disseminate and monitor the impact of key actions and their viability. They structure key actions and initiatives in 8 categories, being Transportation one of them.
In Spain, the FEE Green Campus initiative promotes the sustainability in universities as an award program. The program is an evolution of the Eco-Schools program created by the Foundation for Environmental Education to EcoCampus. It began in Russia in 2003 and it is now extended to 125 campuses in 21 countries [
44]. UDC was one of the fist participants in Spain, and five centres and the Ferrol Campus have been awarded with the green flag since 2017 in this institution. The path to a more sustainable university includes seven steps: Create an EcoCampus Committee, carry out an environmental review, create an action plan, monitor and evaluate the results, link sustainability topics to the curriculum, inform and involve the community, and produce a Green Charter. This kind of green campus initiatives can be a way to achieve the SDGs [
45].
Many universities include sustainability in their study plans, although in many cases, they do not achieve the objectives because those responsible for the courses do not follow the institutional policy of education for sustainability or because the university does not review the contents included in the courses [
46].
One of the most popular tools to audit the evolution of conditions and policies related to Green Campus and Sustainability in the universities is the UI GreenMetric World University Ranking. It compares policies related to the environment across universities worldwide. In the 2020 ranking [
47], UDC occupies position 5 of the 29 Spanish universities evaluated in this ranking (quantile 83), and position 65 of the 912 universities evaluated (quantile 93).
Table 8 compares the CU EFM pc for UDC between the studies conducted at UDC in 2008, 2016, and 2020. The CU EFM pc for UDC in 2016 is 0.0663 ha, 85% of the total EFM. In 2016, the CU EFM pc for UDC is 1.9% higher than in 2008, and there are six more points in the percentage caused by car journeys. In this period, there is also a decrease of 15.4% in the population of UDC (staff and students enrolled). The staff reduction was mainly motivated by the effect of the economic crisis, with a special impact on employment in Spain. This reduction in population led to a smaller total CU EFM, in spite of the increase of footprint per capita due to higher proportion of car use. A similar global reduction has been also observed in Spain, where Sobrino [
48] analysed the changes in mobility patterns and carbon footprint it generated during that period of economic crisis, when, for the first time, emissions from Spanish road traffic decreased due to the reduction in economic activity and, therefore, in total number of trips.
In 2020, the UDC population grew by 8% in relation to 2016, recovering 44% of the loss in the previous period. In this pilot survey, there are 1.9 points less than in 2016 in the percentage of CU EFM caused by car trips. This reduction could lead to optimism, if it indicates that the trend in mobility habits in UDC is more sustainable, which is in accordance with the activities developed as part of the Green Campus initiative. However, the CU EFM pc UDC is 15% higher than in 2016. This result may be due in part to the effect of the new georeferenced service developed at UDC and used as a test in the 2020 survey, which can lead to a more detailed specification of routes by respondents. It is of great interest to carry out a new survey in 2021 that can confirm the trend in UDC mobility habits. An annual UDC EFM calculation could monitor its evolution. This would allow the appraisal of the effectiveness of future impact reduction measures. This methodology and evaluation process could be applied to other universities or institutions.
In addition, the 2020 survey was conducted during an online teaching period due to the COVID-19 pandemic, which was particularly virulent in Spain in this period. The survey specifically referred to normal mobility habits prior to the health alarm. Nevertheless, the COVID-19 pandemic has changed mobility habits and, therefore, the EFM. During the initial period of lockdown (March-June 2020 in Spain), teaching moved from the face-to-face model to the online model. In this period, mobility is reduced, but the increase in the carbon footprint due to the transfer of the activity to an online context from home could be significant. Filimonau [
49] calculates that the carbon footprint of the University of Bournemouth in UK in this period was reduced by 30%, but that the carbon footprint generated at home by the students and staff of the university is 95% of the EFM-CU in a normal period. In addition, after lockdown, a period with fewer mobility restrictions began, which was called the “new normal”. This period has already lasted for about a year, and the ending date is not known for sure. In this period, teaching in UDC is a combination of face-to-face and online modes. Filomenau [
49] found that the campus EF is higher in this period of mixed teaching than in the classical face-to-face model. One of the reasons could be that part of the previous mobility in public transport is carried out by car in this period [
50]. Blended teaching may be less carbon friendly than teaching entirely online or on campus, and university sustainability policies should review the potential carbon footprint implications of different teaching models.
Table 9 shows the EFM-CU pc of 18 universities worldwide calculated using a similar methodology, but with possible implementation differences. The UDC sample is extracted from all the students and internal staff. Some other studies samples are restricted to student population or even only certain disciplines students. In some cases, original values in other units are transformed to gha. Although there are similar results in several studies, there are also values with relevant differences. The minimum value is from China (0.001 gha). There is other group of universities from different countries with values between 0.01 gha and 0.05 gha. The values of UDC 2008 (0.09 gha), 2016 (0.09 gha), and 2020 (0.10 gha), presented in this paper, are very similar to those of several universities across the world (0.09 gha in Thailand, Leon, and Kwantlen; 0.11 gha in Toronto), the Spanish mean (0.10), or the European mean (0.13 gha), and slightly lower than the values for Valencia (0.16 gha) and Belgium (0.15 gha). Other universities present values from 2 to 4 times greater. The higher results correspond to Willamete (0.99 gha), Panjab (1.2 gha), and, in another order of magnitude, Ohio (8.92 gha). The urban structure, social customs, proximity of students’ residences to campus, differences in population considered, and local parameters used could be the reasons for these differences.
Mobility is a key sustainability factor in universities. UDC mobility accounts for around 50% of the total UDC’s EF in 2016. Therefore, it is necessary to develop policies to reduce the environmental impact of UDC mobility. In addition, successful initiatives can serve as an example for other campuses. This study proves that distance from the residence to the centre and the use of the car to travel to campus are the factors that most influence the emitter profile of the UDC’s university population. With regard to socioeconomic profile, this study finds significant differences in EFM between staff and students, although not with other aspects such as gender or family income.
The study of transportation modes and student travel behaviour towards energy conservation in Mahasarakham University in Thailand concludes that most of the students choose their personal cars over the public transportation for journeys to campus, and that gender, age, year of study, and background knowledge did not demonstrate any significant relationship with energy-conservative attitude and behaviour [
52].
Table 10 shows the estimation results of a multiple linear regression model of the EFM-CU (in areas) for UDC 2016 survey. The predictors have been chosen through a forward stepwise process. The model is globally significant with a significance level of 5% using the F statistic of ANOVA and all coefficients are also significant with the same level of significance using t statistic of t-test. The standardized coefficients (SC) and the relative influence (RI) show that the most influential factor is the distance between the residence and the study centre, with 60.8% of the total regression. Each additional km of distance between residence and study centre increases the EFM-CU 0.5 × 10
−2 ha on average if Staff and Car remain constant. The use of the car in the journeys to campus influences 30.4% of the total regression, leading to 10.7 × 10
−2 ha more than those who use another mode of transport on average ceteris paribus. Staff is the least influential predictor, with 8.8% of the total. Each staff member generates 3.1 × 10
−2 ha more than each student on average ceteris paribus.
Although Bekaroo et al. [
53] and Wang and Zeng [
54] state that socioeconomic factors are associated with EF, and that higher-income people from the university have a higher carbon footprint, the model developed for UDC did not find evidence in this sense. The study of EFM-CU in Federal University of Technology—Paraná in Brazil [
55] finds significant differences in the EFM_CU between students and staff (7.5 times higher for staff than for students on average), because staff use cars more often than students.
In the UDC case, the difference between staff and students EF can also be partly justified by the presence of those who move their residence due to their activity at the university (mostly students in UDC). They choose residences much closer to the university (median distance of 4 km vs. 7 km in UDC as stated in
Table 5) and use cars less frequently (18% compared to 65%).
The main cause of EFM in UDC is car travel, at 92% of total. Many car trips have only one occupant, 64% in the case of the EFM-CU. In addition, the mode of transport is the factor of influence in the EFM that can most easily be modified by the institutions. For this reason, sustainability policies should focus on reducing car use. Singhirunnusorn et al. [
52] propose that the sustainability campaigns they carry out include policies to change the travel behaviour of students. Cruz et al. [
56] prove that University of Coimbra mobility policies aimed at a modal shift towards public transport and on-campus car parking control contribute to significant reductions in EFM-CU. UDC’s study also verifies that the characteristics of the on-campus car parking influences EFM, because it can be determinant in the decision of using car.
The university governance should carry out awareness campaigns on the environ-mental impact of mobility in the university, and the promotion of less emitting modes of transport, such as public transport, cycling, and walking. Giles-Corti et al. [
57], Jiang et al. [
58], and Pérez-Neira et al. [
59] showed that bicycles, electric bicycles, and walking can be used to cover short distances. Ramli et al. [
60] and Kamal et al. [
61] also stated the importance of promoting measures to facilitate cycling and walking. In the case of using a car, shared use should be encouraged. The use of mobile applications promoted by the university’s governance body or the local government can favour it, but only if they are given sufficient visibility. Kadir et al. [
62] proposed the use of car-pooling and public transportation to increase university sustainability.
An additional measure can be to gradually reduce the infrastructures dedicated to travel and car parking on campus and using this regained space for bus lanes or bicycles and walking infrastructures.
Urban transportation infrastructures and the built environment impact EFM [
55,
57]. Therefore, the university should also coordinate with the local government to align the policies of both institutions in the common goal of reducing the environmental impact of mobility in the university. It could be very useful for the objective of reducing the environmental impact of universities mobility to carry out studies to identify barriers and strengths when traveling to the university by public transport, bicycle, or walking.
5. Conclusions
Human activity on Earth is not ecologically sustainable. This work concludes that personal mobility at UDC is not sustainable either. This work shows that the UDC EFM in 2016 significantly exceeds the biocapacity for greenhouse-gas absorption in the area covered by UDC facilities. The EFM pc for UDC is similar to the mean for other universities and colleges in Europe and Canada, but much lower than corresponding values obtained in the USA. This finding implies that higher-education institutions worldwide should plan to reduce their EFM, whilst also developing strategies for increasing their biocapacity.
The data analysis presented shows that the transport mode and the distance travelled between residence and campus are the main contributors to the differences in EFM-CU pc. The main source of the UDC EFM is car travel, especially for CU journeys. Most of these car journeys (64%) involved a single occupant, particularly staff journeys (72%). The remoteness of a campus to an urban centre, as well as the presence, availability, and proximity of car-parking facilities, significantly and directly influence the choice of a car as a means of travel in CU. Policies to reduce the environmental impact of mobility should focus on reducing car use, both by university planners and the competent authorities in transport. To achieve this goal, on the one hand, they must apply policies that discourage car use and promote carpooling. On the other hand, they should encourage the use of public transport and “soft” modes, such as walking and cycling.
The EFM-CU pc of the non-urban campuses in A Coruña is 2.2 times the corresponding value for the urban campuses in the city. A better integration of campuses in the urban built environment, lower numbers of parking slots available, a shorter distance from city centres, and a better urban and interurban transit system might reduce the EFM-CU pc.
Displaced people produce a significantly lower EFM pc than residents, even when considering CH journeys, because their chosen place of residence is typically nearer the university than that of residents, and they use a car for CU journeys less frequently than residents.
A&S staff display similar EFM pc values to students. Nevertheless, EFM pc values for T&R staff are greater because their place of residence is typically more distant from the campuses and their CU journeys are more frequently performed by car.
The EFM assessment at UDC was conducted in 2008 using data obtained by a mobility-habits paper survey, while the 2016 online survey was paper-free. The online surveys are more cost-effective, more time-efficient, and carry a lower EF. They can therefore be conducted more frequently, allowing for an annual calculation and monitoring of the EFM. This would allow an appraisal of the effectiveness of future impact-reduction measures. In this period, there is also a decrease of 15.4% in the population of UDC, mainly motivated by the effect of the economic crisis. The 2020 pilot survey used a georeferenced service and was conducted during an online teaching period due to the COVID-19 pandemic.
Future studies at other universities are needed to evaluate the progress of mobility sustainability in higher-education institutions and the measures undertaken to improve it. The next steps include the preparation of a new study, with the intention of being periodic and allowing to confirm the trends identified in this one. Surveys should include georeferenced information that allows modelling the carbon footprint, focusing on the choice of car for travel. The information collected should include data that allows the identification of lifestyles, to facilitate the comparison of the studies carried out in universities around the world.


