Article

Air Ventilation Performance of School Classrooms with Respect to the Installation Positions of Return Duct

Department of Land, Water and Environmental Research, Korea Institute of Civil Engineering and Building Technology (KICT), Goyang-Si 10223, Korea
*
Author to whom correspondence should be addressed.
Sustainability 2021, 13(11), 6188; https://doi.org/10.3390/su13116188
Submission received: 5 May 2021 / Revised: 20 May 2021 / Accepted: 26 May 2021 / Published: 31 May 2021

Abstract

:
For students, who spend most of their time in school classrooms, it is important to maintain indoor air quality (IAQ) to ensure a comfortable and healthy life. Recently, the ventilation performance for indoor air quality in elementary schools has emerged as an important social issue due to the increase in the number of days of continuous high concentrations of particulate matter. Three-dimensional numerical analysis has been introduced to evaluate the indoor airflow according to the installation location of return diffusers. Considering the possibility of the cross-infection of infectious diseases between students due to the direction of airflow in the classroom, the airflow angles of the average respiratory height range of elementary school students, between 1.0 and 1.5 m, are analyzed. Throughout the numerical analysis inside the classroom, it is found that the floor return system reduces the indoor horizontal airflow that causes cross-infection among students by 20% compared to the upper return systems. Air ventilation performance is also analyzed in detail using the results of numerical simulation, including streamlines, temperature and the age of air.

1. Introduction

Considering that many people spend 60 to 90 percent of their time indoors [1,2], indoor air quality is one of the most critical factors for a healthy life. The World Health Organization (WHO) reported that 3.8 million premature deaths could be attributed to poor indoor air quality annually [3]. In particular, young students spend more than 90 percent of their daily lives indoors, including time spent at home, in daycare centers, and school classrooms. As such, they can be harmed more than adults when exposed to the same level of air pollution [4].
Many researchers have performed ventilation evaluations on control systems, including those for carbon dioxide (CO2) and temperature-based systems. Sun et al. [5] carried out CO2-based adaptive ventilation in a multi-zone office building in Hong Kong. They propose that a DCV system can save more than 52% of the energy consumed by a fan compared to that of a constant air volume (CAV) system. Mysen et al. [6] also reported that the CO2-based DCV system reduces energy consumption in Norwegian school buildings by 38% compared to a CAV. However, most of the research results are concerned with energy savings in buildings, and studies related to the health of building users are rare.
Indoor air quality (IAQ) affects both the comfort and the health of the building’s users [7]. Up to now, indoor temperature and humidity conditions have been considered in the evaluation of IAQ. It is noted that carbon dioxide concentration is also an important IAQ evaluation variable, and many other variables can affect the health of occupants.
There are central and individual supply systems for air conditioning and heating systems in school classrooms. Central air conditioning systems control indoor airflow according to the positions of the air supply and return diffusers installed in the ceiling of the classroom. Central air conditioning systems have advantages, such as easy maintenance, low energy consumption, and high recycling potential [8]. Numerical analysis is widely used for airflow evaluation inside classrooms. Ahmed et al. [9] analyzed the temperature distribution inside rooms according to air supply methods and compared it to experimental data. They introduced a displacement diffuser, a slot diffuser, a square ceiling diffuser, and grille diffuser to evaluate the airflow and room ventilation. Holmberg et al. [10] calculated the ventilation efficiency with respect to the locations of the air supply and return diffusers. They showed that the positions of both the air supply and the return diffusers are critical to the overall ventilation effectiveness in a room. In many previous studies, the dependence of indoor ventilation efficiency according to the installation location of the diffusers was considered. However, it is difficult to find research on the interference and ventilation effects of airflow to cope with the spread of infectious diseases.
In the present study, the air ventilation performance of a school in Korea has been analyzed using airflow inside the classroom by numerical simulation. The school classroom is cooled by a central air conditioning system that simultaneously supplies 10 classrooms from an air handling unit installed on each floor. The distribution of temperature and the age of air inside the classroom are also analyzed according to the installation locations of the return diffusers, while the air supply diffusers are fixed to the ceiling of the classroom. Based on the height of the respiratory line of elementary school students, the indoor air flow direction is analyzed to prevent the spread of infectious diseases, such as COVID-19, in the classroom and cross-infection among students. Detailed airflow characteristics inside the classroom are analyzed and described using the results of three-dimensional numerical analysis.
The content of the paper is described as follows. Section 1 provides a comprehensive review about the studies conducted recently on the air ventilation and IAQ for school classroom. At the end of this section research gaps are identified and purpose of the present study is mentioned. Section 2 shows state of the art research. Section 3 describes the dimension of school classrooms and methodology of air conditioning. Section 4 shows the analysis method of airflow inside the classroom. Section 5 describes the numerical analysis method. Finally, results and discussion are mentioned in Section 6.

2. State of the Art Researches

Technologies on indoor air quality can be divided into three categories: monitoring indoor pollutants, purifying indoor pollutants, and smart IAQ control systems [11]. Development of air purification technologies and optimization of ventilation systems are regarded as the main approaches to improving IAQ. Among them, the investigation of novel technologies to filter and purify indoor air pollutants has attracted great attention over the last decade. Filter technologies such as carbon-based filters, electric filters, photocatalysts, and UV filters have been developed in response to various pollutants.
Among the important indoor health-threatening agents, ultrafine dust is emerging as a concern in the United States [11]. The behavior and interference of indoor airflow is another evaluation parameter for IAQ in terms of public health. The particles floating in a room have different airflow distributions depending on the location of the diffusers for ventilation and air conditioning. The airflow direction inside building rooms is important to reduce particulate matter and to prevent the spread of viruses, such as COVID-19. Yu et al. [12] reported the relationship between airflow direction and the number of infected people when SARS struck Hong Kong in 2003. Similarly, Li et al. [13] studied the spread of COVID-19 at a restaurant in China. They showed that infection occurred in the direction of airflow imparted by an air conditioner. Virus transmission through bioaerosols is known to occur by being in the space taken by breathing, coughing, talking of infected people [14]. It is essential to design an optimal airflow system that can reduce the mutual interference of airflow based on the occupant’s breathing direction in the occupant space.
Many researchers also have studied the moving distance and direction of the droplets from breathing when exercising outdoors, such as running or cycling [15,16]. They found that the diffusion of fine droplets from breathing changes depending on the strength of the exercise and breathing, as well as the wind speed. Lu et al. [17] reported on cases of COVID-19 transmission through air conditioning in restaurants. They checked CCTV on the day of the virus infection and analyzed the virus transmission scenarios by considering the opening and closing of the entrance door and elevator, and air conditioning operation times. According to the report, nine people were infected from an asymptomatic patient eating in the same space. The location of the infection in the restaurant was related to the direction of the air conditioner wind. The outbreaks in a tour coach in Hunan province [18] and a call center in Seoul [19] also indicated the possibility of airborne transmission. It is increasingly clear and accepted that airborne transmission is an important contributor to the rapid and long-distance spreading of SARS-CoV-2 [20]. Therefore, ventilation efficiency and the direction of airflow can be important factors when evaluating IAQ when attempting to prevent the indoor spread of viruses, such as COVID-19.

3. Dimension of School Classroom and Air Conditioning Method

3.1. Standard Classroom of Elementary Schools in Korea

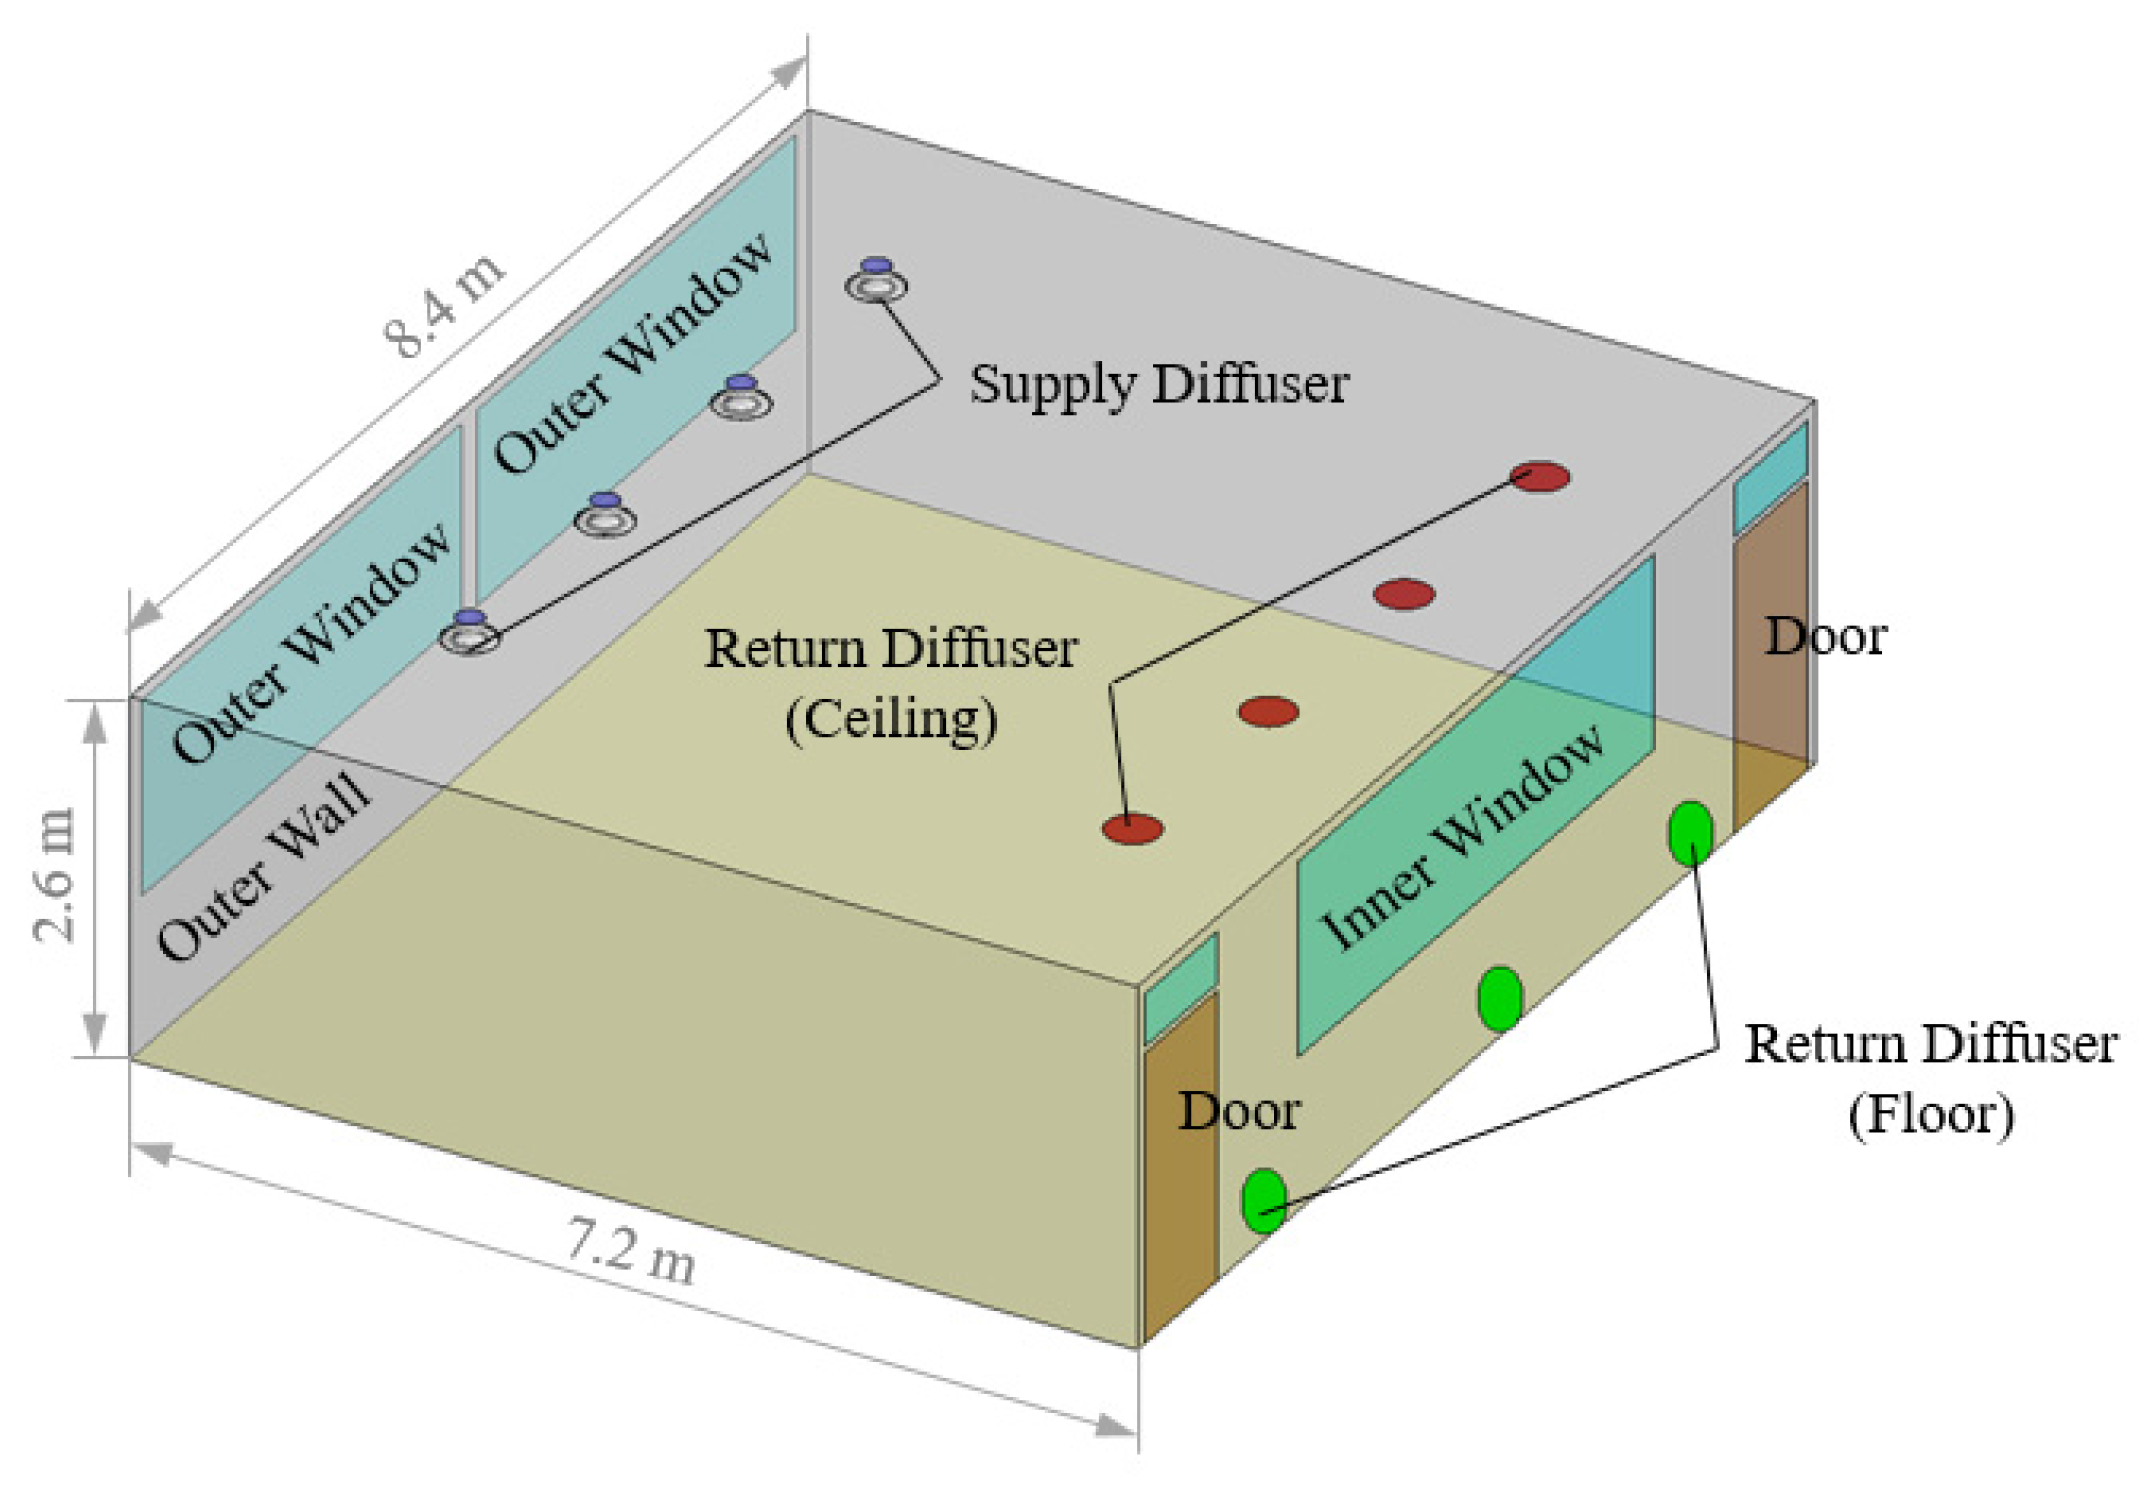
Elementary schools in Korea have various geometric designs, and the most common “U-type” structure accounts for about 27% of all classrooms [21]. The number of students in traditional elementary schools is decreasing in Korea. As of 2020, the average number of elementary school students is 23.1, with the length, width, and height of the standard classroom being 8.4 m, 7.2 m, and 2.6 m, respectively. Figure 1 shows a schematic view of a standard classroom for elementary schools in Korea.

3.2. Central Air Conditioning System

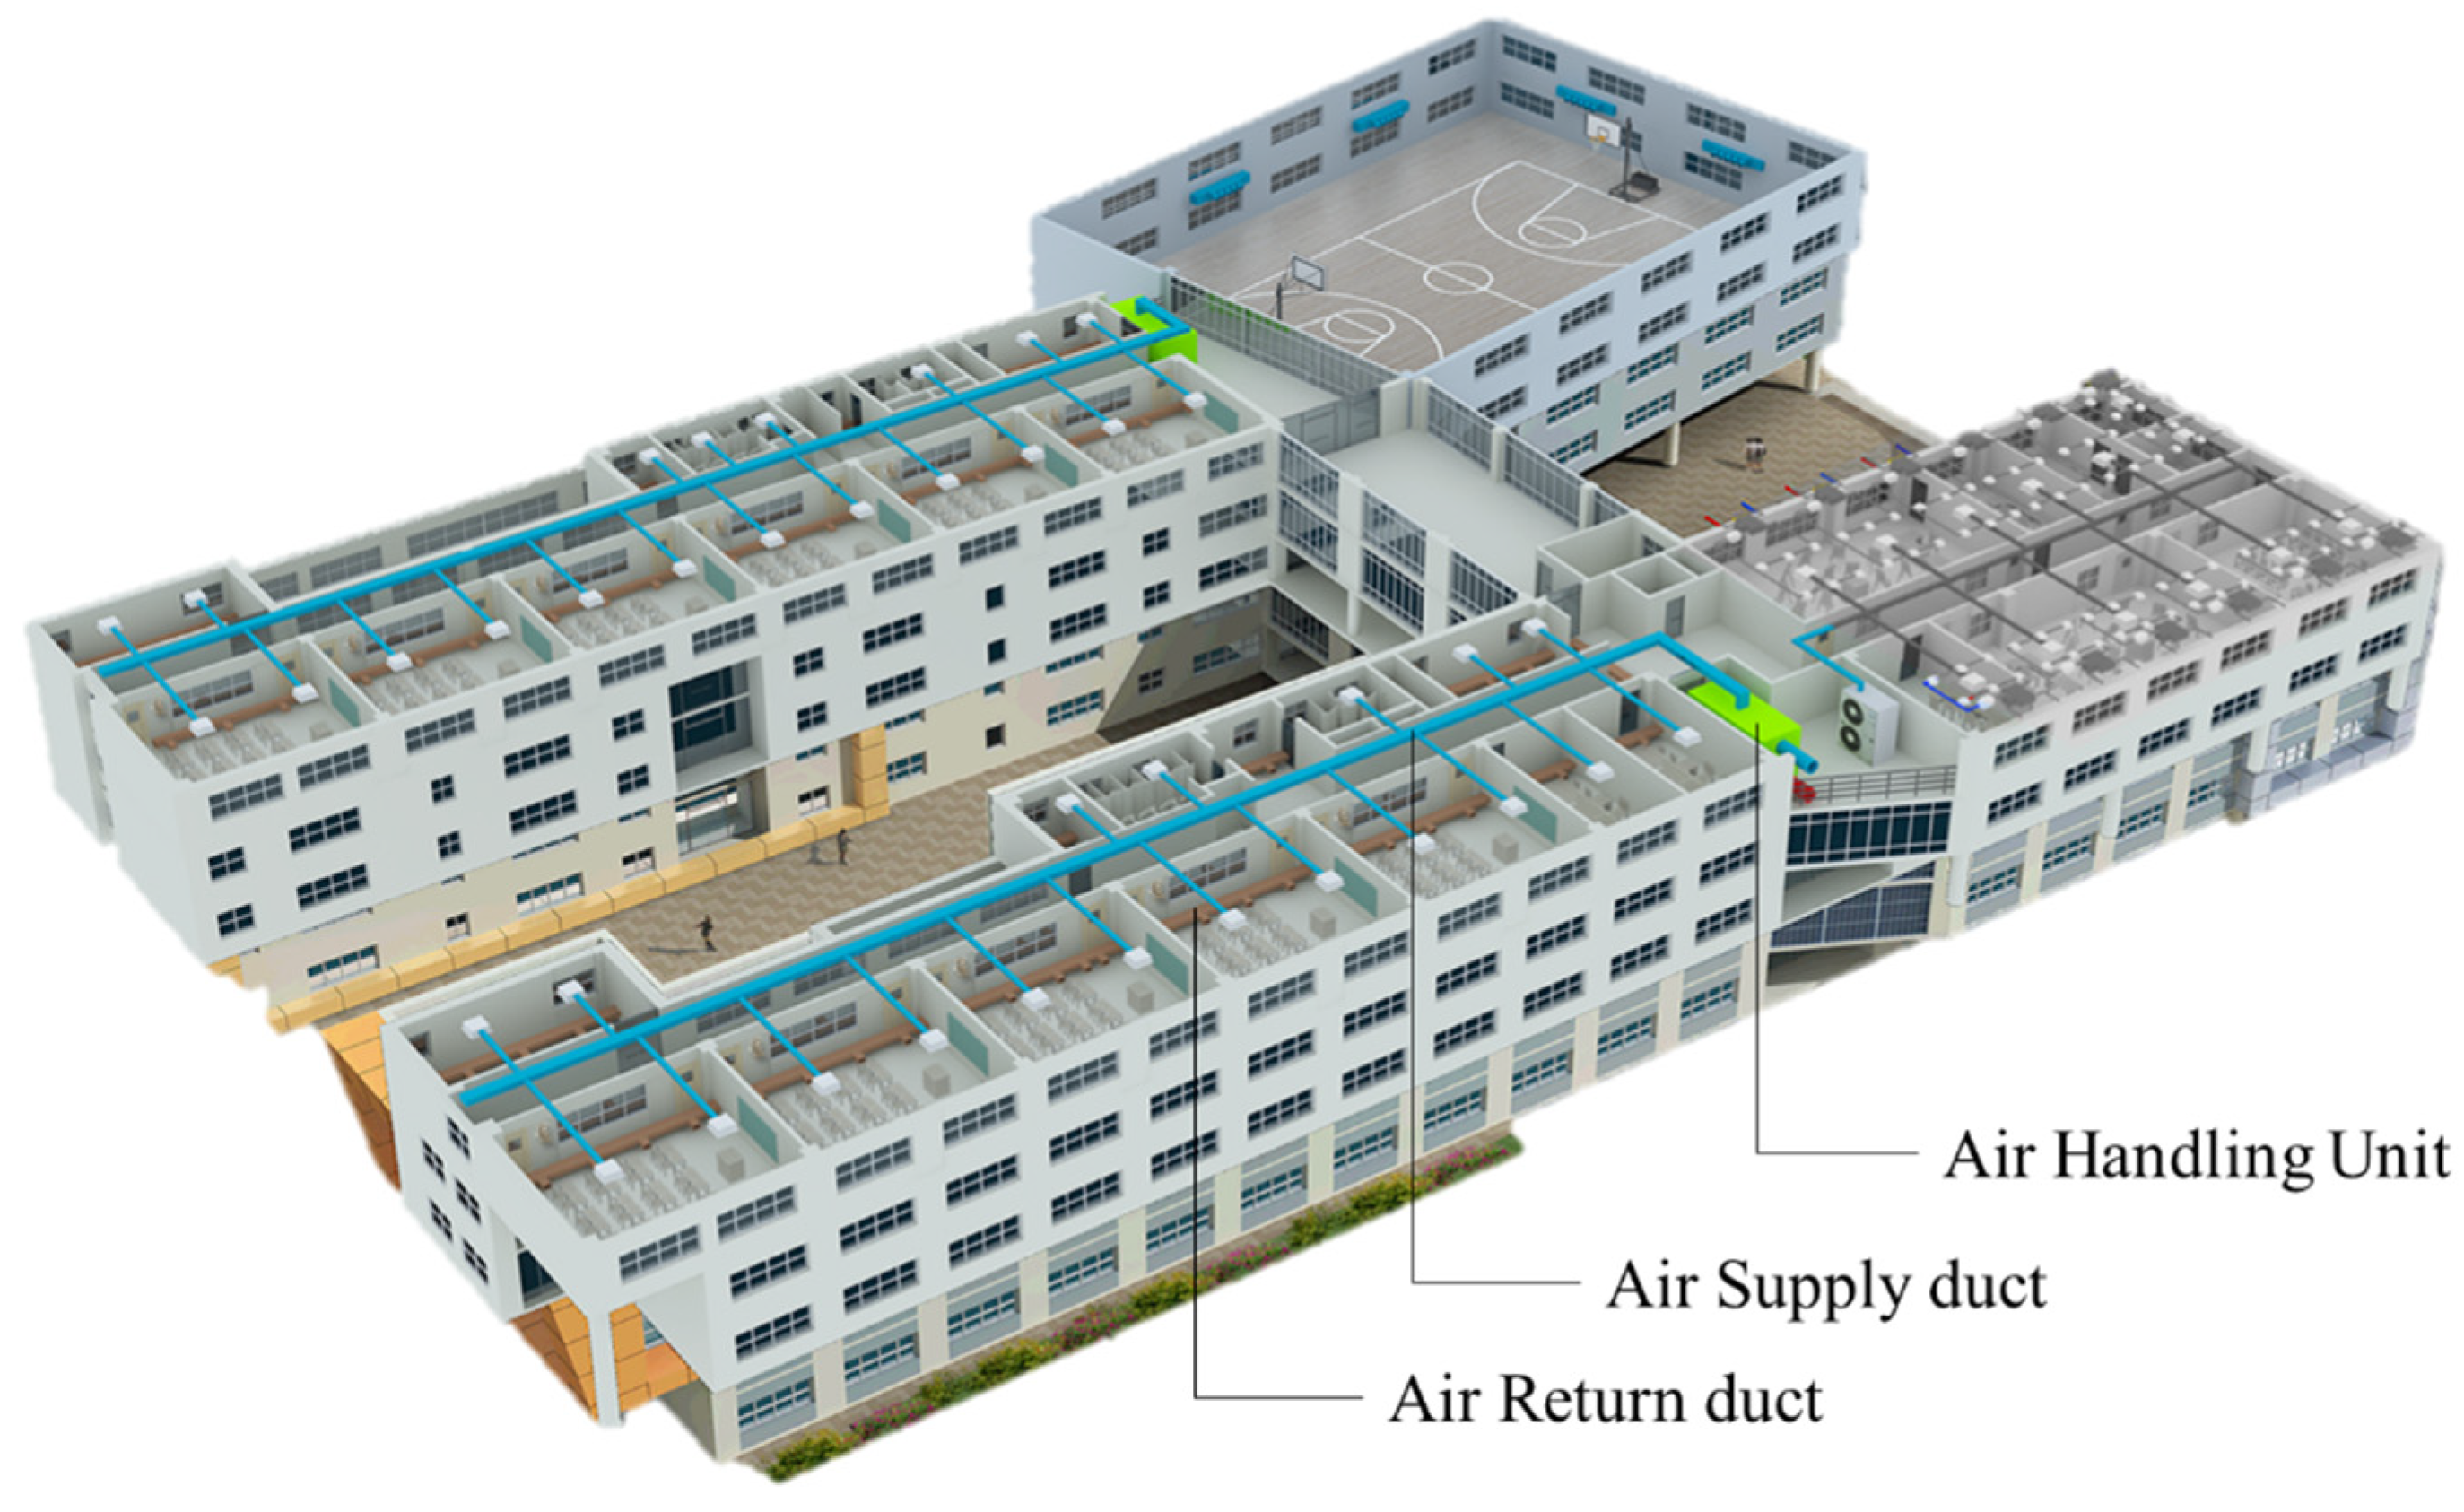
Mechanical air conditioning systems in schools can be classified into central and individual air conditioning systems. Central air conditioning systems are installed mainly in classrooms and school offices, which are spaces where the demand is constant and that are commonly used. On the other hand, individual air conditioning systems are applied to laboratories, music rooms, art rooms, etc., which are used irregularly, and air conditioning and ventilation devices are installed in a distributed manner. A central air conditioning system consists of an air handling unit (AHU) installed for each floor, an air supply duct that supplies clean/cool air to each classroom, and a return duct that recovers the circulating air inside the classroom to the AHU, as shown in Figure 2. A central air conditioning system has the advantages of effective power consumption and maintenance compared to individual systems [8]. Central air conditioning systems are also recommended as a flexible countermeasure for recent issues, such as energy consumption, fine dust, and viruses spread in public buildings such as schools. Due to relatively lower manufacturing costs, most buildings adopt upper air supply-upper air return systems that install both the air supply and return ducts on the ceiling. However, the installation of the upper supply and return diffusers causes the stratification of air and reduces the efficiency of cooling/heating and ventilation of the indoor space. As shown in Figure 2, an upper air supply-floor return system is an alternative to prevent air stratification. Although the duct system in Figure 2 is expected to increase the construction cost slightly, the system is worth considering because it can help resolve various recent issues, such as energy consumption, fine dust, and virus spread.

4. Analysis Method of Airflow inside the Classroom

4.1. Average Height of Students and Respiratory Line

Thermal comfort is closely related to the temperature and the speed of the airflow around the students, along with the metabolic rate of the person and the insulation factor imparted by clothing. ANSI/ASHRAE Standard 55-2013 recommends that the air temperature difference between the 0.1 m and 1.7 m height levels should be less than four degrees Celsius [22]. Table 1 shows the average height of elementary school students by grade in Korea [23]. Students aged 8 to 13 in elementary school generally have heights between 1.2 m and 1.5 m. Considering the influx of harmful substances, CO2, fine dust, and viruses into the oral cavity through the respiratory tract, the height of the respiratory line is particularly important for evaluating IAQ. It is important to evaluate the airflow at 1-1.5 m, the height of the students’ breathing lines.

4.2. Airflow Angle

With the recent COVID-19 pandemic, studies have found that the distance of water droplets spread from breathing out of the mouth is 1.5 m and coughs spread droplets up to 2 m [24,25]. These studies provided the basis for the social distance measures in Korea at 2 m, and many countries recommend wearing masks to prevent water droplets from splashing when people cough or sneeze.
The importance of airflow direction and ventilation can be understood due to the cross-infection caused by horizontal airflow. To satisfy both ventilation and the prevention of cross-infection simultaneously, ventilation using vertical airflow is desirable. In the present study, three types of airflow directions are defined to evaluate the effects on cross-infection among students, as shown in Figure 3. Among the upward, downward, and horizontal airflows, the horizontal airflow is defined as flow within an angle of 45 degrees relative to the horizontal. Air flow angle is defined as the flow angle of the upper and lower limits of the air flow in relation to horizontal airflow. It is noted that indoor airflow in the horizontal direction is necessary for ventilation. However, to reduce cross-infection among students, it is desirable to generate vertical airflow at least in the range of 1–1.5 m, the respiratory line of students.

4.3. Age of Air

The age of air is defined as the duration of the incoming air from the supply diffusers not replaced with fresh air, despite air circulation in the classroom. The higher the age of air, the more stagnant airflow is. This also suggests partial circulation. It is desirable to reduce the age of air inside the space to allow for uniform ventilation inside the classroom.

5. Numerical Analysis Method

Indoor air is affected by inside and outside air temperatures and air flowrates supplied by diffusers. To analyze indoor air characteristics, considering both airflow and temperatures, numerical simulation has been introduced using the commercial software FLUENT V.18.2. It solves steady Navier-Stokes equations and is discretized in space using a second-order upwind scheme. Velocity-pressure combined flow is analyzed by the SIMPLE scheme. As a turbulence model, the standard k-epsilon model is used.

5.1. Computational Domain and Boundary Conditions

The computational domain is determined based on the standard size of Korean elementary school classrooms described in Section 3.1. As shown in Figure 4, it consists of two outer windows, two doors, and an inner window. For indoor air ventilation and cooling and heating, four supply diffusers are placed in the ceiling, and return diffusers are installed in the classroom ceiling and classroom floor.
The boundary conditions are based on the airflow rate and temperature supplied through the air conditioning duct of the central air conditioning system and the insulation conditions of the outer wall and windows according to the outside temperature. The total supply airflow rate is 800 CMH, determined by the ventilation rate and cooling load of the elementary school in Korea. In the present study, 31 °C outdoor air is applied in accordance with the conditions of summer outdoor air in Seoul, specified in the building energy conservation design standards. The supplied air temperature for cooling is set at 18 °C and is evenly supplied by the four supply diffusers. The heat transmission coefficients of the outer windows and walls are applied as 1.7 W/m2 K and 0.18 W/m2 K, respectively. The effect of wall thickness is simulated using shell conduction. Detailed boundary conditions are summarized in Table 2.

5.2. Computational Grids and Grid Dependence Test

Based on the computational domain, computational grids are constructed using the ANSYS meshing program. As shown in Figure 5, a tetrahedral grid is mainly introduced. Three prism layers are applied to increase the calculation accuracy on the walls.
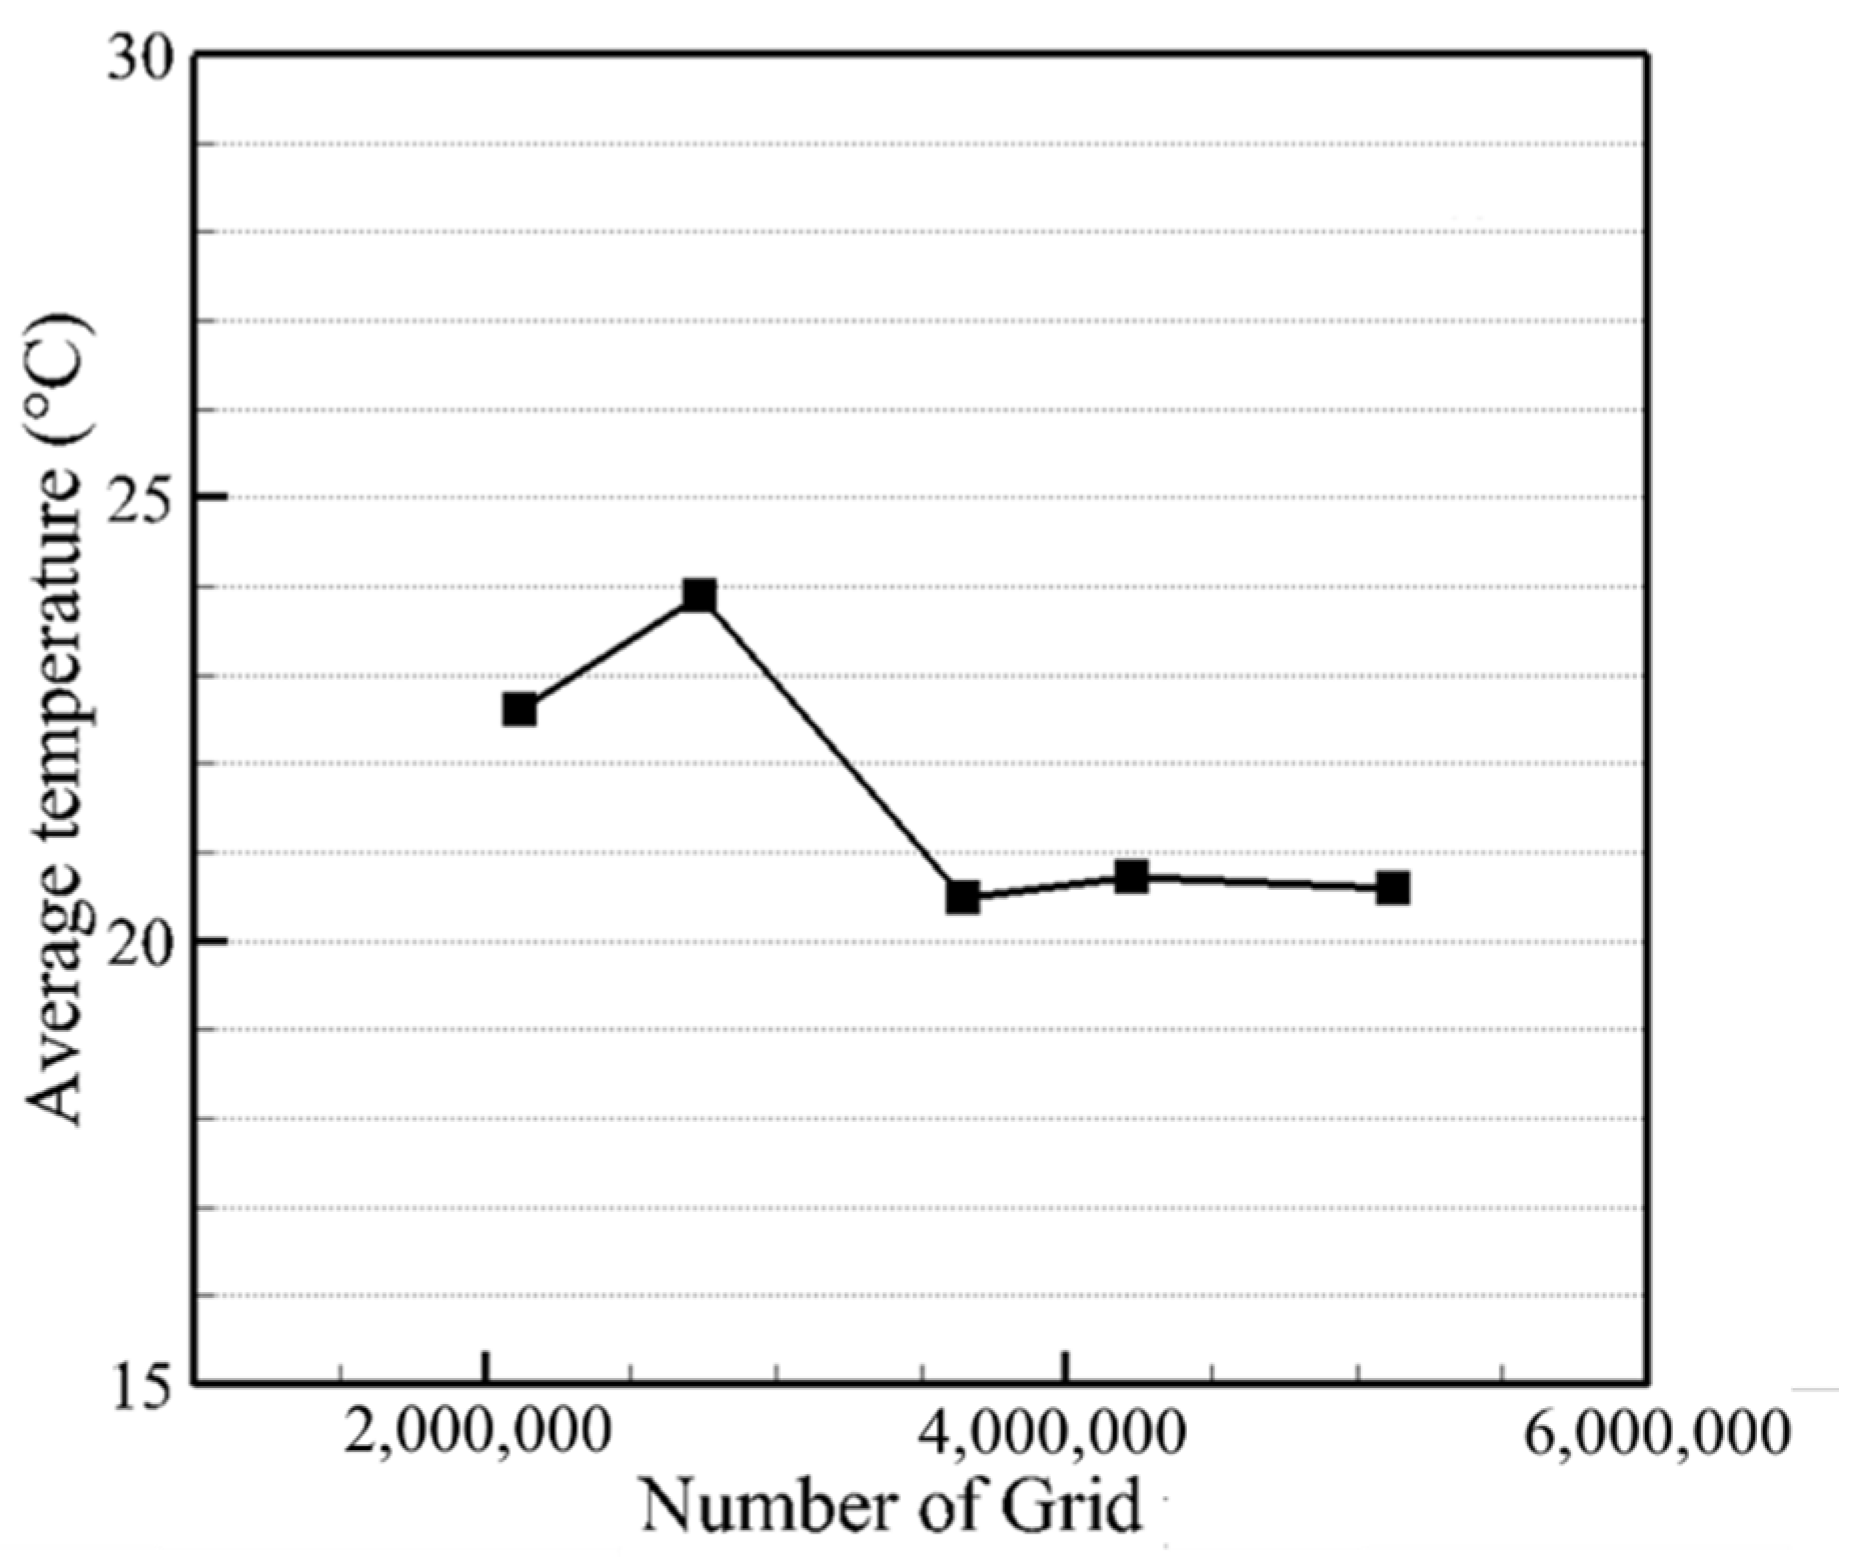
Grid dependence evaluation is performed based on the temperature, which is the main property inside the classroom. The temperature measurement location is 1 m above the floor, and as described in Chapter 3, this corresponds to the height of the respiratory line of elementary school students. As shown in Figure 6, the average temperature has a constant value when the number of grids is about 4,000,000 elements or more. Therefore, in the present study, the numerical simulation inside the school classroom has been performed using the grid numbers of 4,000,000 elements for both conditions.

6. Results and Discussion

In the present study, the internal airflow characteristics are analyzed using numerical simulation by introducing additional floor returns along with the upper (ceiling) air supply and return diffusers that are generally applied in school classrooms. Using the results of numerical simulation, distributions of streamlines, temperature, age of air, and airflow angle inside the classroom are compared with respect to the two locations of return flow, and upper and floor return diffusers.

6.1. Streamlines

Figure 7 shows the distributions of streamlines for upper and floor return diffusers. In the figure, the color of the streamlines is marked differently for each air supply diffuser. It is understood that the distribution and location of the airflow differ greatly depending on the location of the two types of return diffusers. The airflow discharged from the supply diffuser is relatively evenly distributed on the floor for the floor return in Figure 7b, while the airflow does not reach the floor and circulates only on the upper side for upper returns in Figure 7a. Under the cooling conditions of the classroom, it is noted that the floor return is more effective than the upper return for uniform flow distribution.

6.2. Temperature

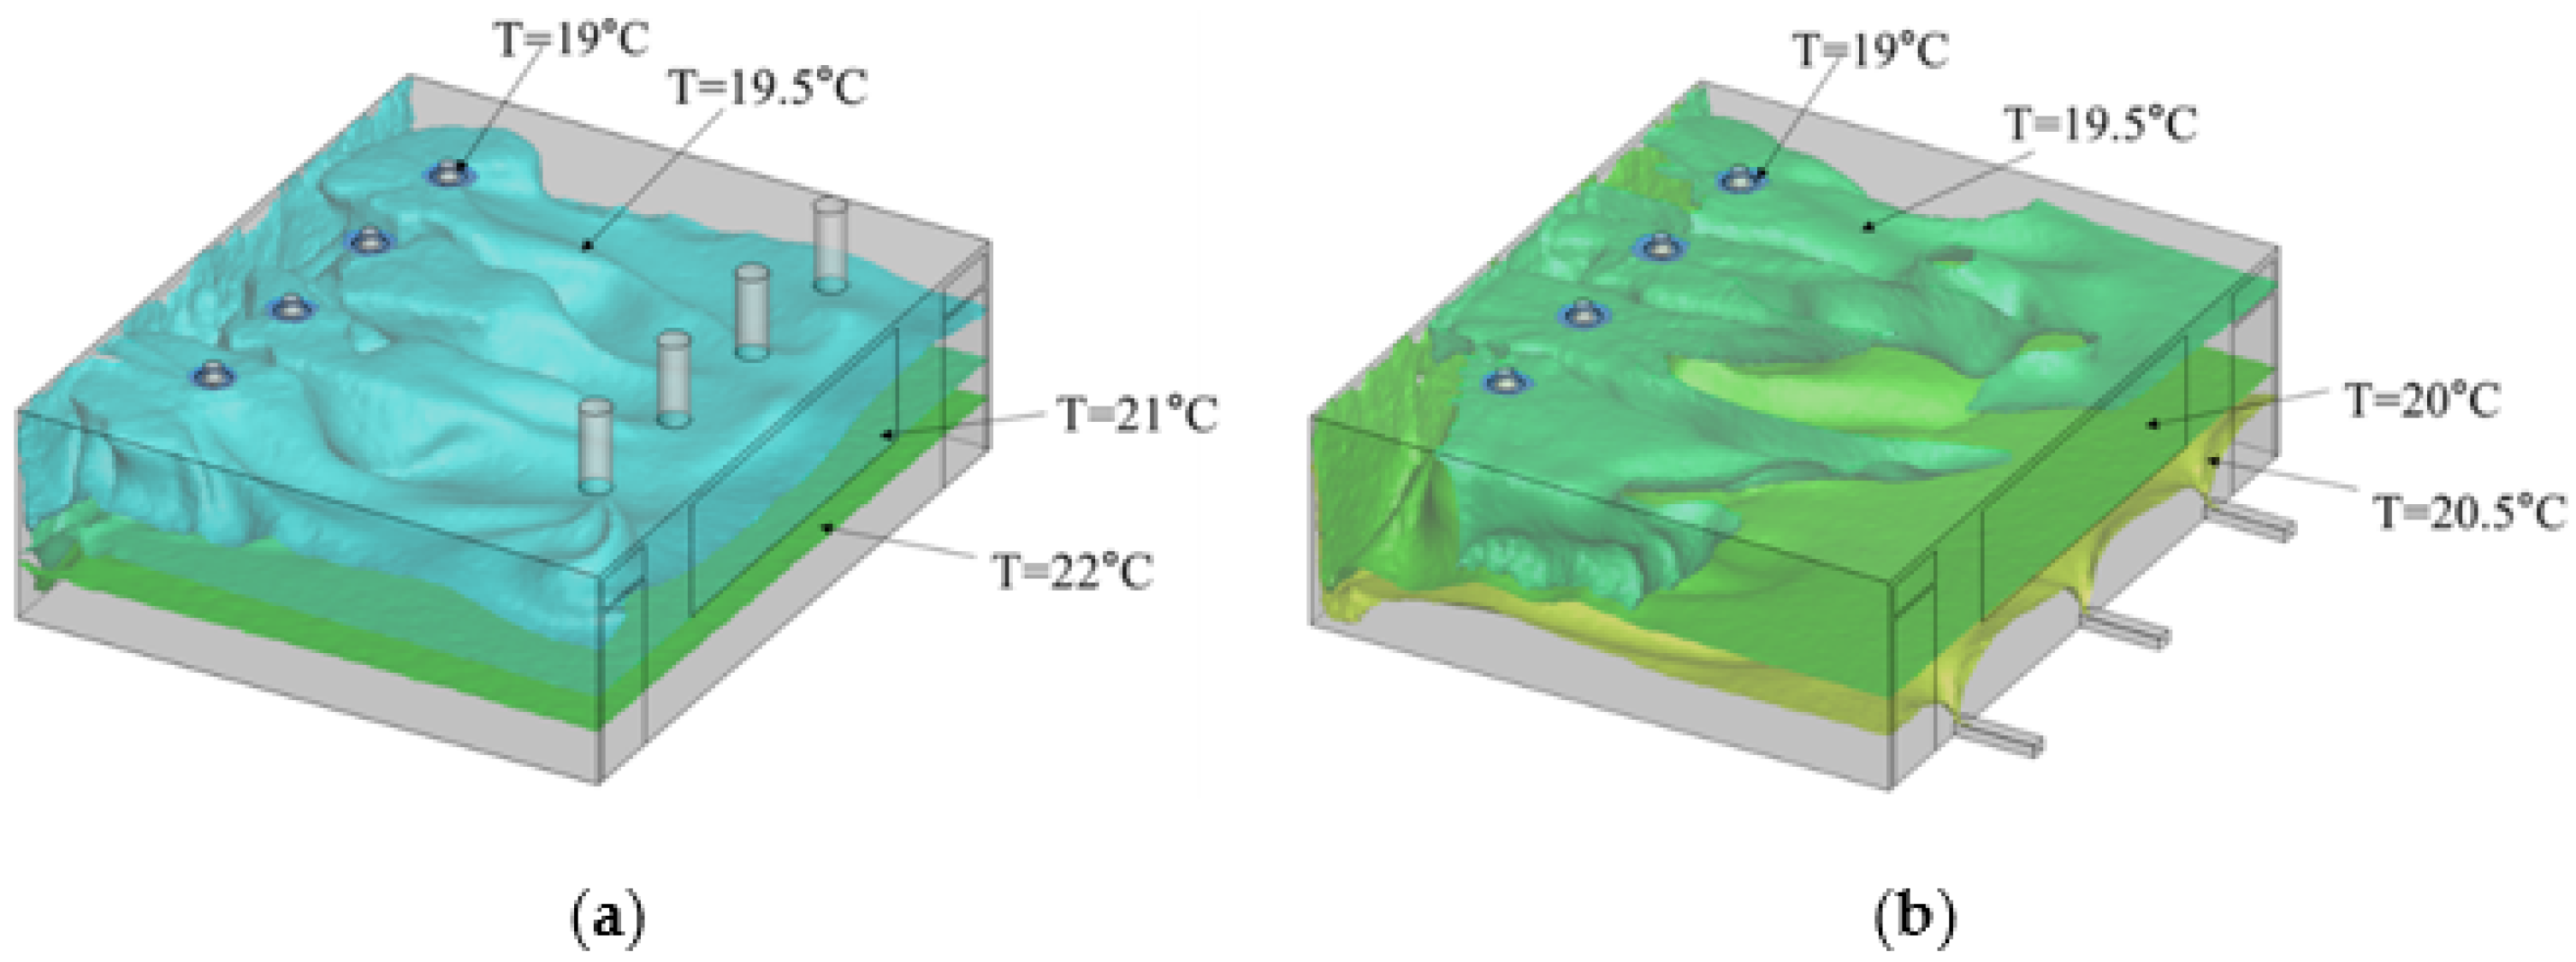
Figure 8 shows the iso-temperature for upper and floor return diffusers. In the upper return, the cold air supplied from the supply diffusers is mainly distributed above the middle height of the classroom. The temperature distribution at the upper return corresponds well to the streamline distribution in Figure 7a. As for the temperature at the floor return, it is noted that the temperature is relatively low compared to the upper return due to the airflow reaching the floor, as shown in the streamline distribution in Figure 7b.
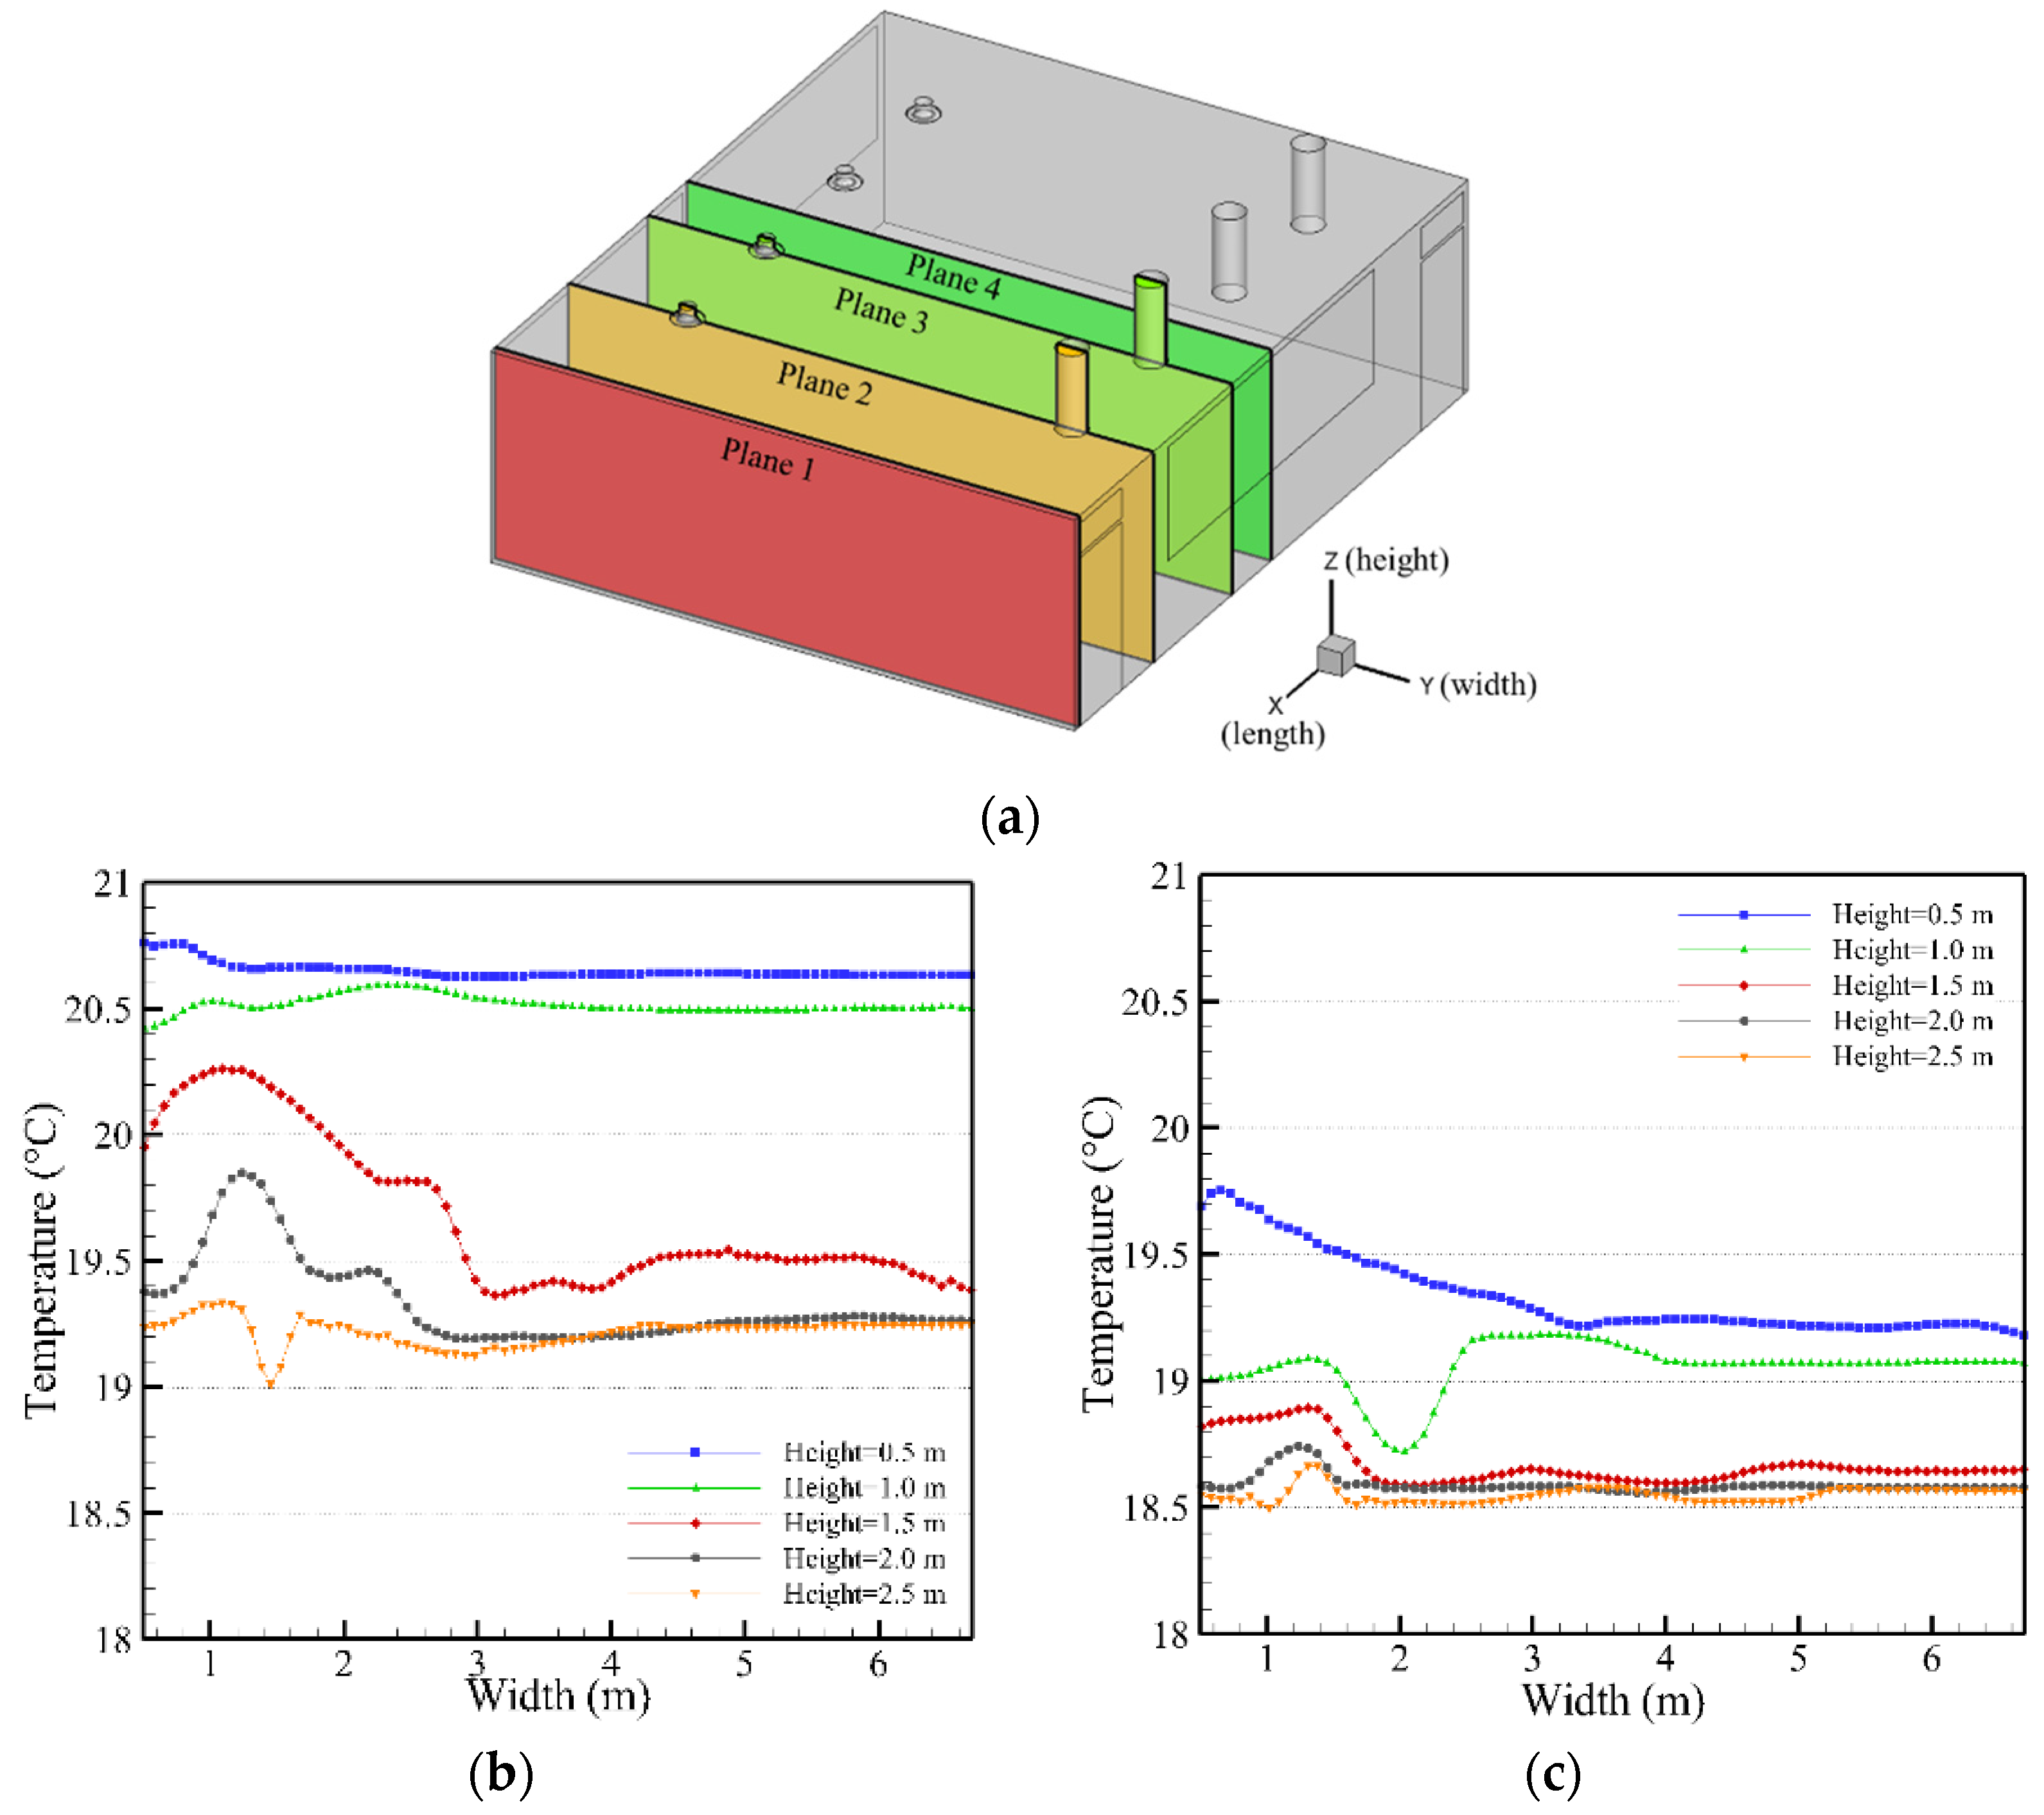
Figure 9 shows the local temperature with respect to the height from the floor at Plane 4 for the upper and floor return diffusers. As shown in Figure 9a, Plane 4 is the center position in the longitudinal direction of the classroom. In the figure, the point where the width is 0 the location of the outer wall and outer windows.
It is found that there is a temperature change in the hallway direction due to the high outside temperature and the heat transfer through the insulating outer wall and windows. The temperature change of the upper return on the window side of the outer wall is relatively large compared to that of the floor return due to the difference in airflow distribution according to the installation location of the return diffuser, as shown in Figure 7. In Figure 9b, the cooling effect of the cold air supplied by the diffuser is most dominant between heights 1.5 m and 2.5 m, which comes from the circulating flow formed between the upper supply diffusers and the upper return diffusers. The cooling effect decreases rapidly when the height is 1.0 m and 0.5 m above the floor as the rotational flow disappears, and the airflow from the upper diffuser hardly reaches. For the floor return in Figure 9c, the temperature difference according to the height is relatively small compared to the upper return, and the temperature is lower even at the height of 0.5 m. It seems apparent that this is caused by cold air reaching the floor due to the floor return.
Figure 10 shows the maximum, minimum, and average temperature according to height for an upper and a floor return diffuser system. The average temperature is determined by averaging the values in the width direction at each height. In both flow return conditions, the temperature rises from the ceiling of the classroom toward the floor, while the absolute average temperature shows that the floor return system performs better. Considering the average height of 1.2 = 1.5 m of elementary school students in Korea, shown in Table 1, the proper temperature below 1.5 m is an important aspect for the student’s comfort.

6.3. Age of Air

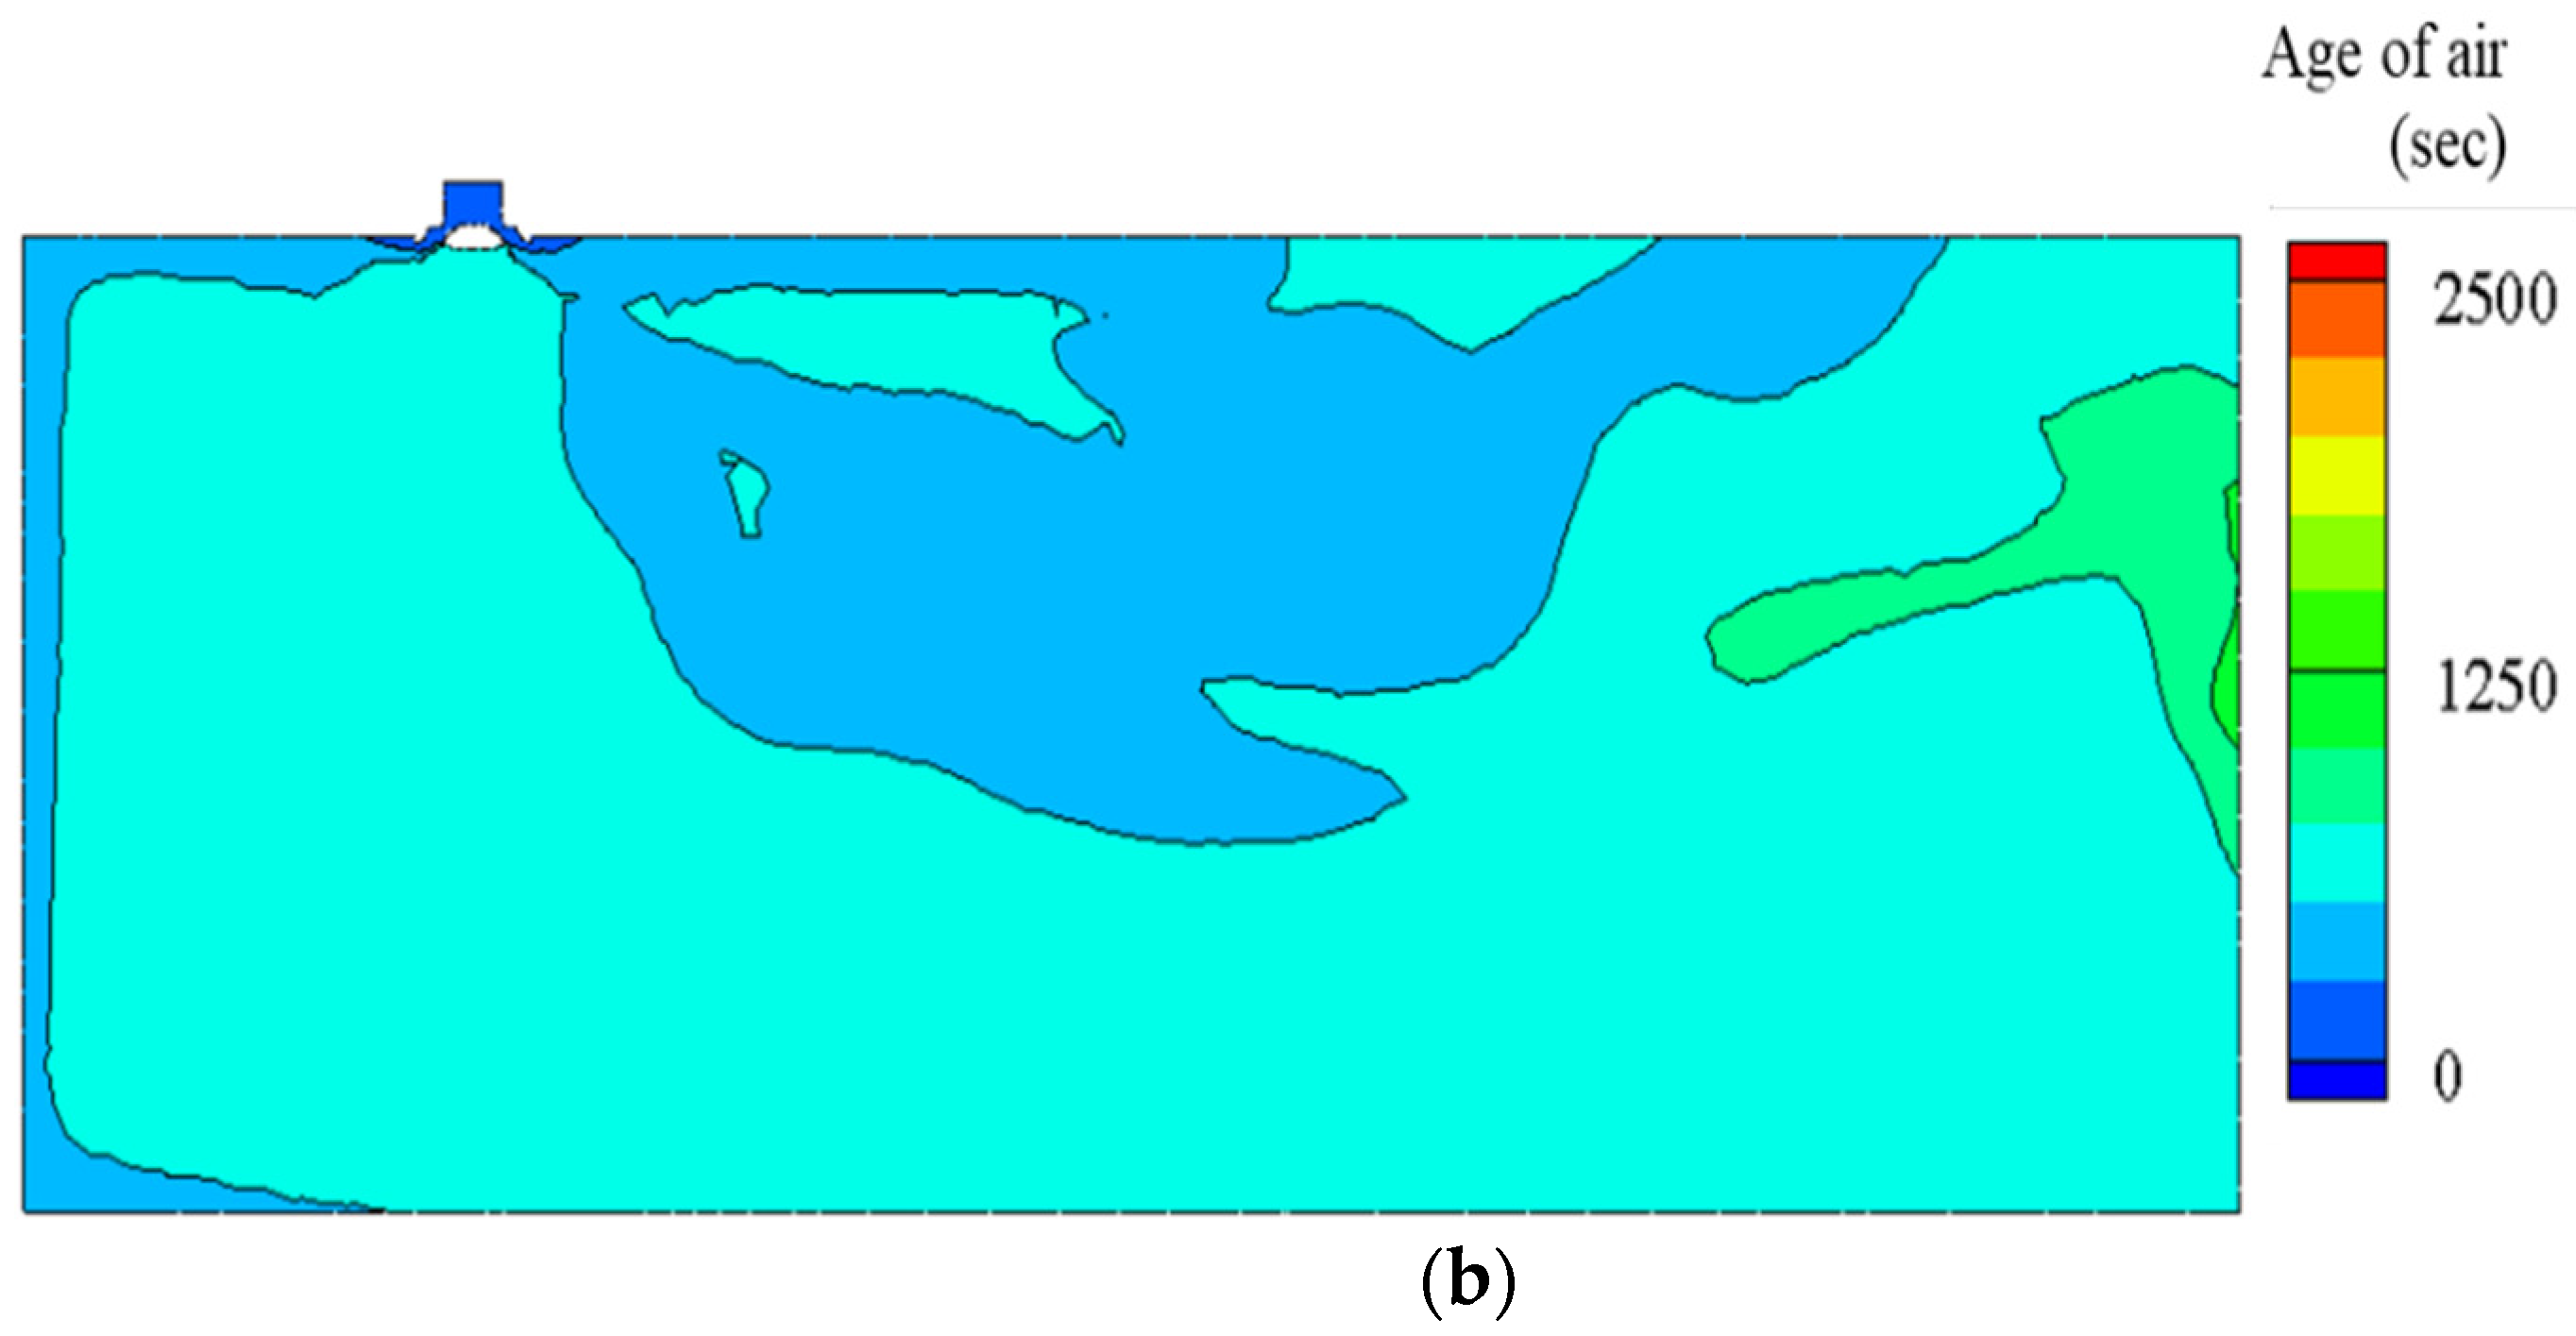
Figure 11 and Figure 12 show the age of air at Planes 2 and 4 in Figure 9a for upper and floor return diffuser systems. The age of air is lower in the floor return system than in the upper return system for both Planes. This means that the floor return allows for relatively less congestion in the classroom due to the indoor air circulation. At the outer window side, where the diffusers supply cold air, the difference in the age of air between the upper return and the floor return is not large. However, the age of air is relatively high near the floor, where airflow is small, as shown in Figure 7 for the upper return.
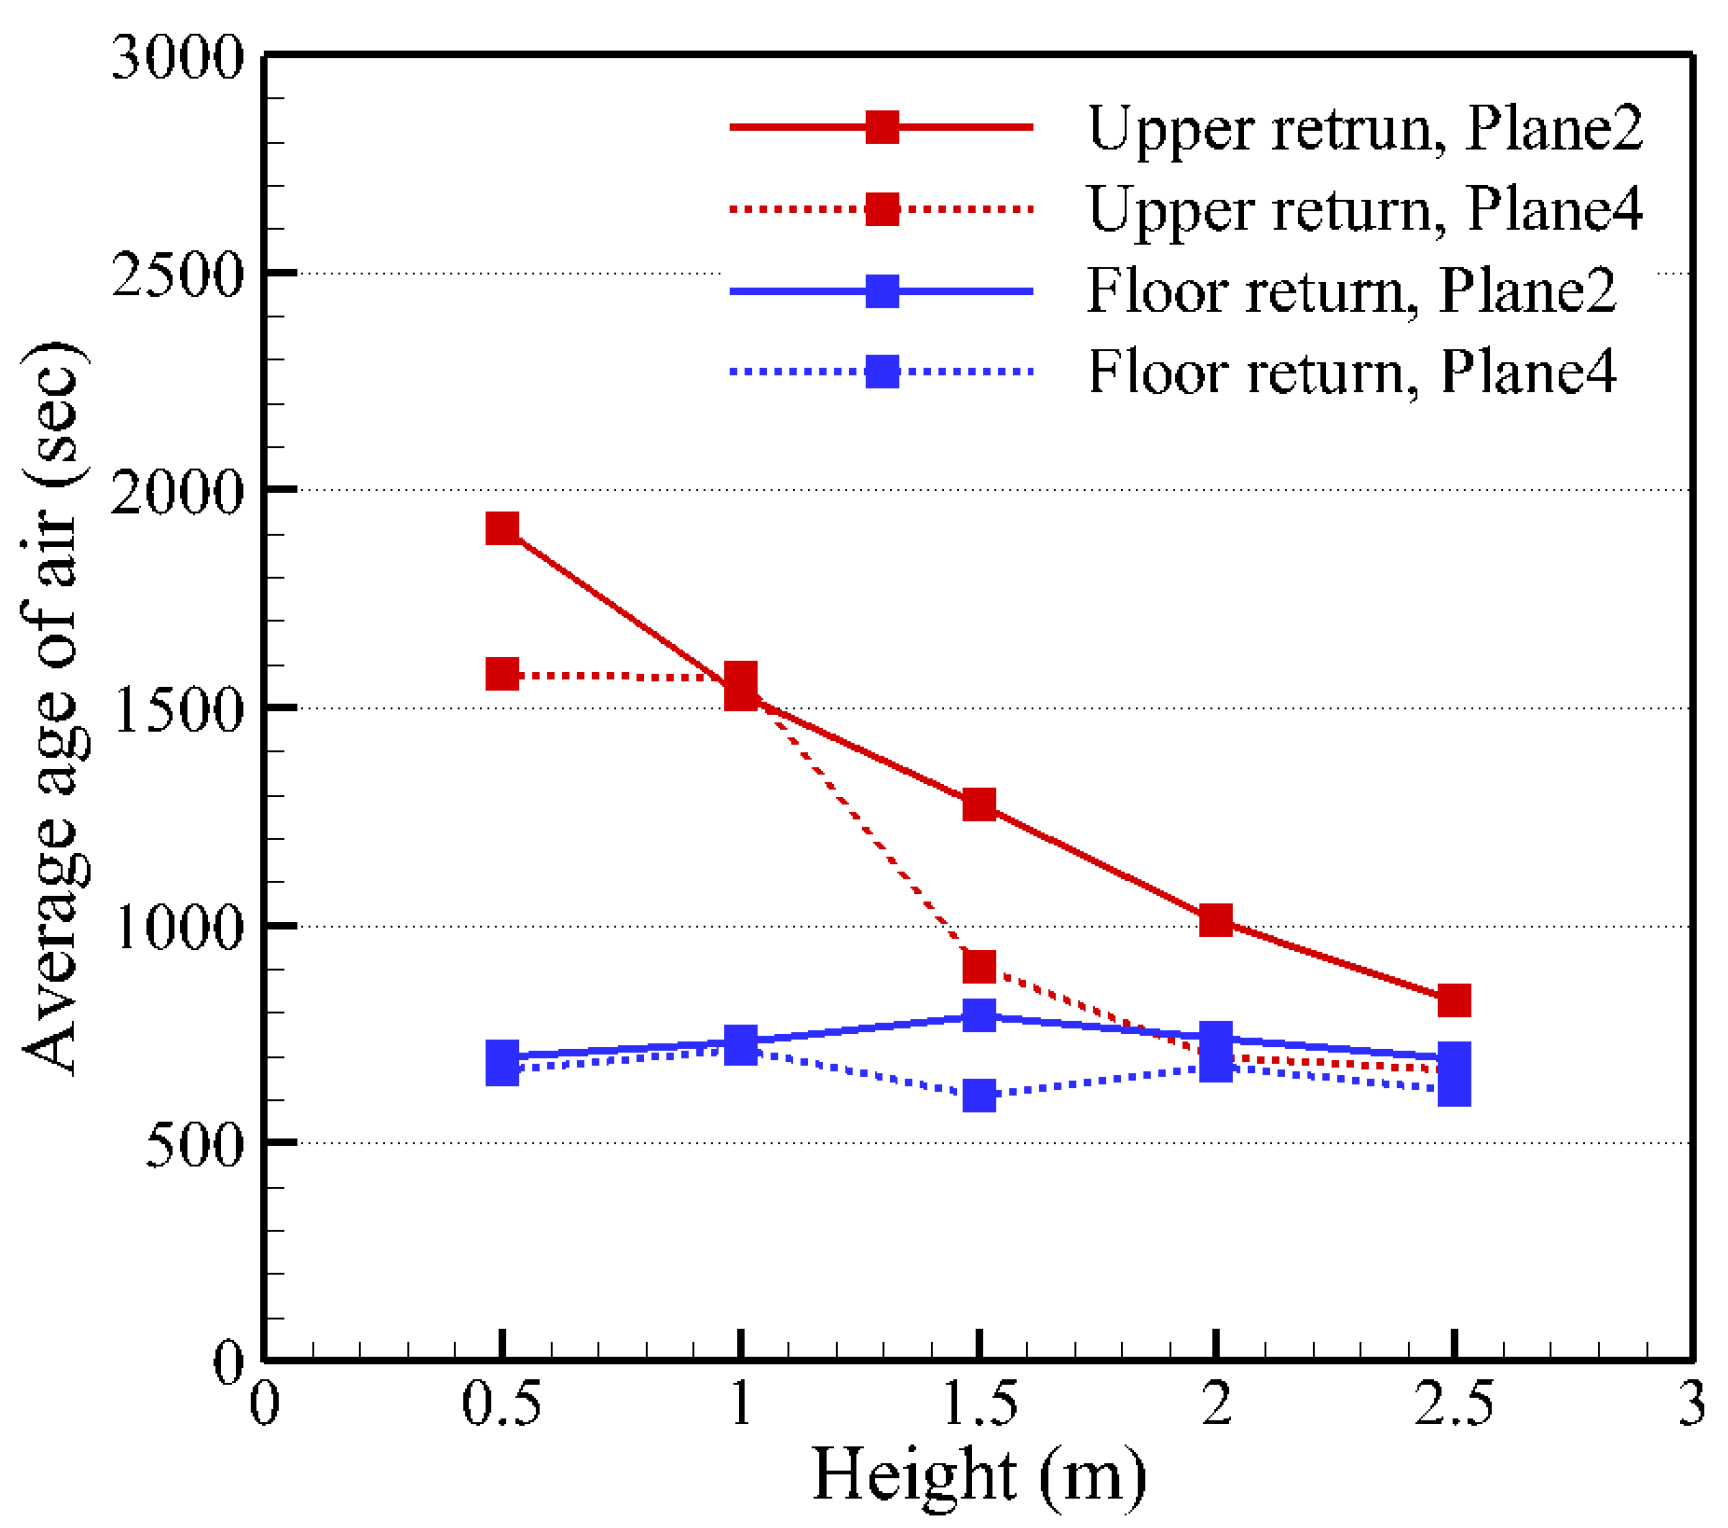
Figure 13 shows the quantitative distribution of the average age of air according to the height from the classroom floor for Planes 2 and 4. The average age of air is determined by averaging the values in the width direction at each height. The age of the air shows little difference depending on the height for the floor return system, while the age of air decreases with height for the upper return. It is noted that the age of the air in the upper return system is significantly higher than that of the floor return system at the heights of 0.5 and 1 m, where the airflow velocity is low. The age of the air dramatically increases due to the lower speed of the airflow and lessened air circulation, which has a great influence on indoor ventilation performance. In the floor return, the average age of air is significantly reduced compared to the upper return. Considering the 800 CMH of ventilation supply flow rate in school classrooms, indoor air circulates about 5.1 times per hour, which corresponds to 708 s in terms of the age of air. As shown in Figure 13, the floor return maintains about 708 s of air age for all heights. The average age of air inside the classroom is an important parameter for the optimal design of air ventilation for classrooms with the ventilation supply flow rate.

6.4. Airflow Angle

As described in Section 3.2, the airflow angle is determined by the velocity components obtained by numerical simulation. In the present study, the direction of airflow is classified into three zones to analyze the effects of the ventilation by vertical airflow without cross-infection between humans in classrooms with respect to the positions of the supply and return diffusers.
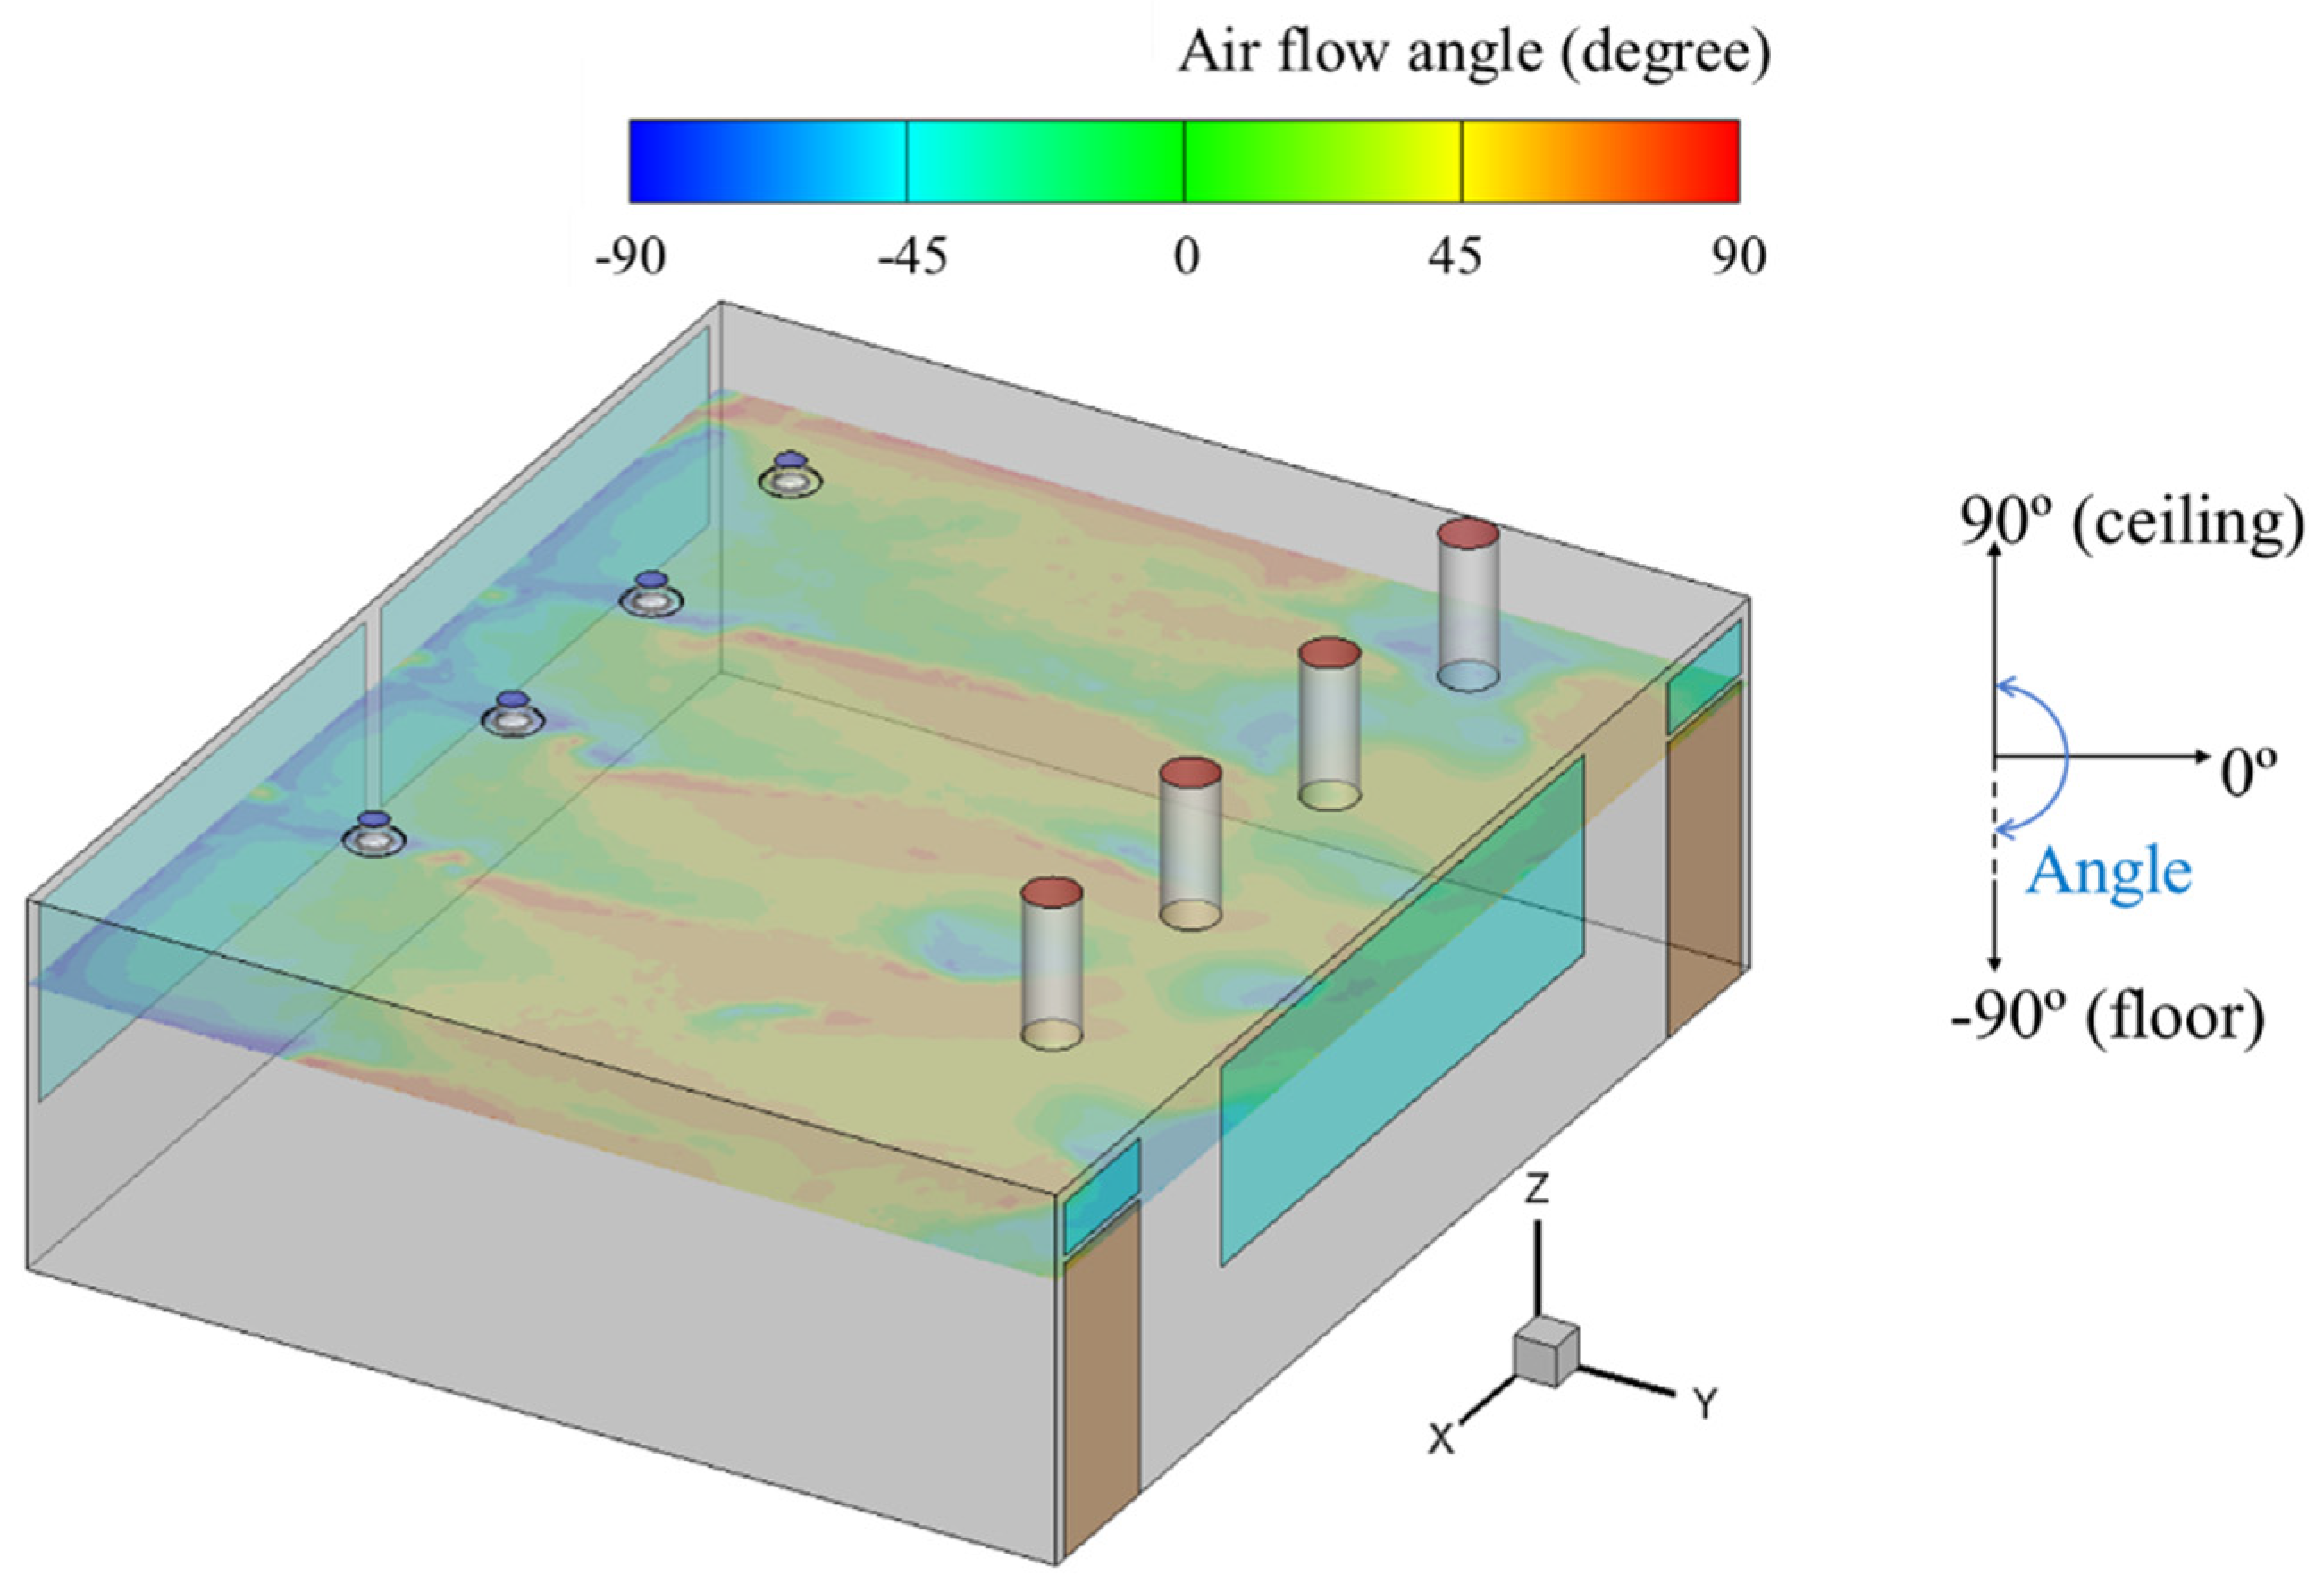
Figure 14 shows the contour of the airflow angle at the horizontal plane located at the height of 2.0 m with an upper supply and an upper return. In the horizontal plane adjacent to the classroom ceiling, the airflow discharged from the supply diffusers represents a downward airflow toward the outer wall and the outer window of the classroom, while an upward airflow appears in the vicinity of the return diffuser. In addition to the upward and downward airflow, the airflow distribution with various angles is shown in the figure. Considering the goal of preventing cross-infection between students for cases such as COVID-19, it is of no use to say that ventilation due to vertical downward flow is desirable.
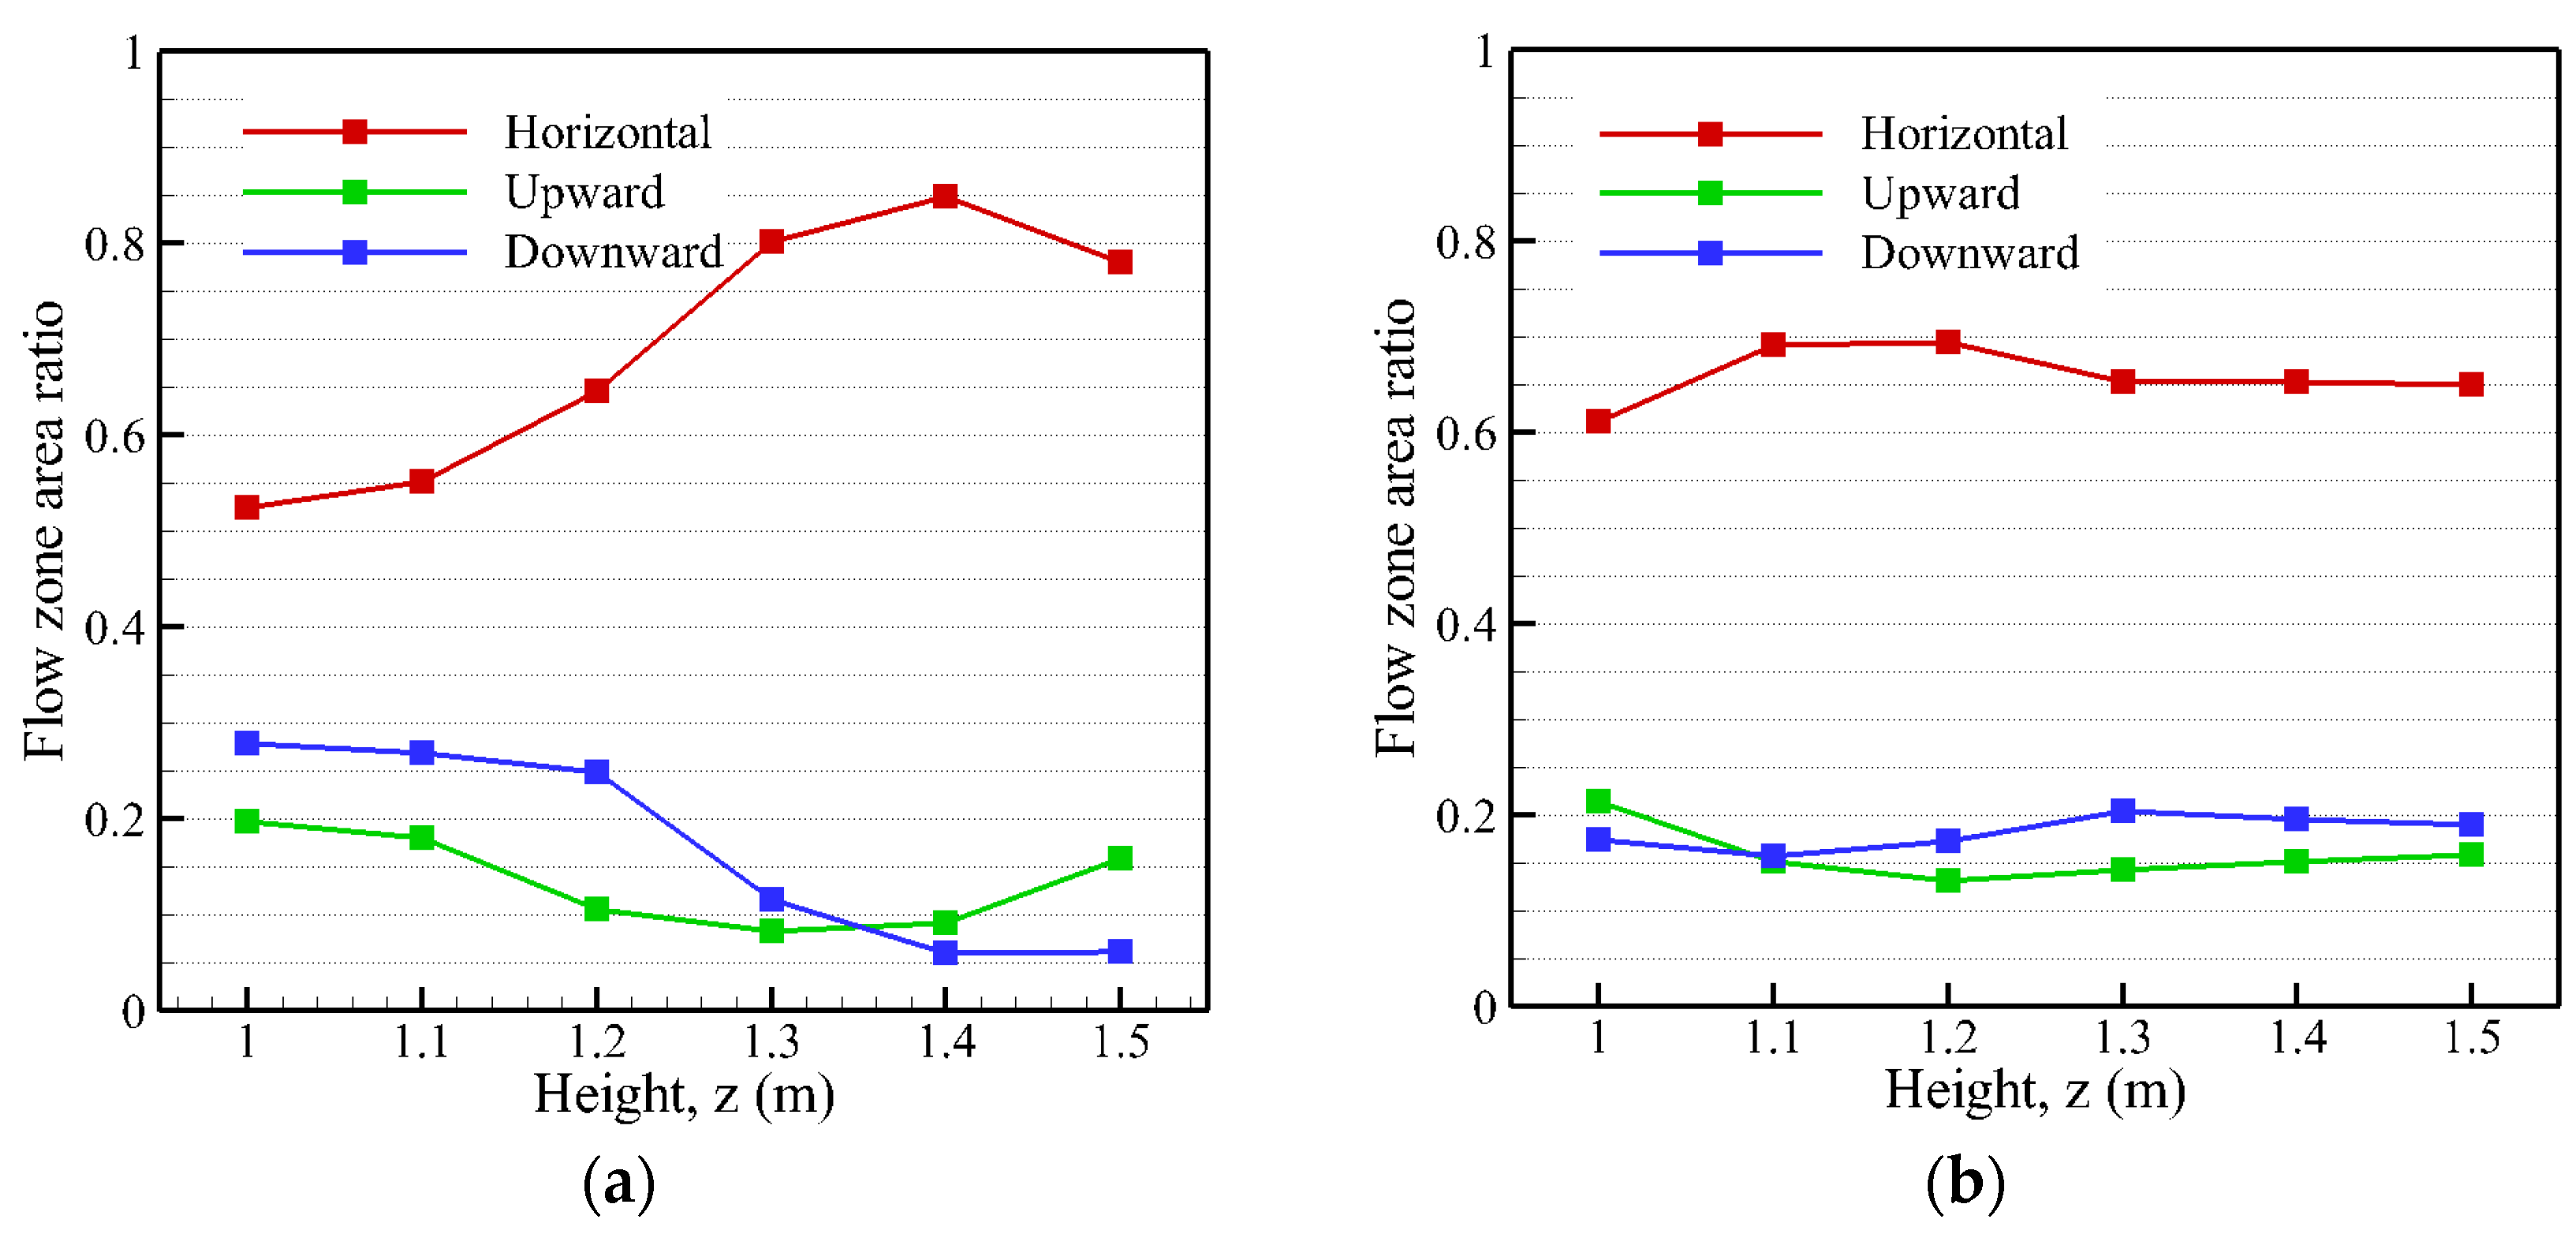
Figure 15a shows the area by flow zone classification based on airflow angle according to height for an upper return and a floor return system. The zone classification with the three types of airflow directions is defined and determined at each height, as described in Figure 3. In the ventilation method of the upper return and the floor return, the horizontal airflow, which affects cross-infection among students, shows a remarkable difference. Based on the height of the breathing line of elementary school students, between 1.3 and 1.5 m, the area of the horizontal airflow represents 80% and 60% of the upper return and the floor return, respectively. In other words, it is noted that the floor return is more effective in reducing the cross-infection of infectious diseases among students compared to the upper return. The horizontal airflow in the breathing line may transmit viruses from neighboring students. Thus, the proportion of horizontal airflow calculated at the breathing line may be an important indicator for evaluating the safety of the indoor airflow.
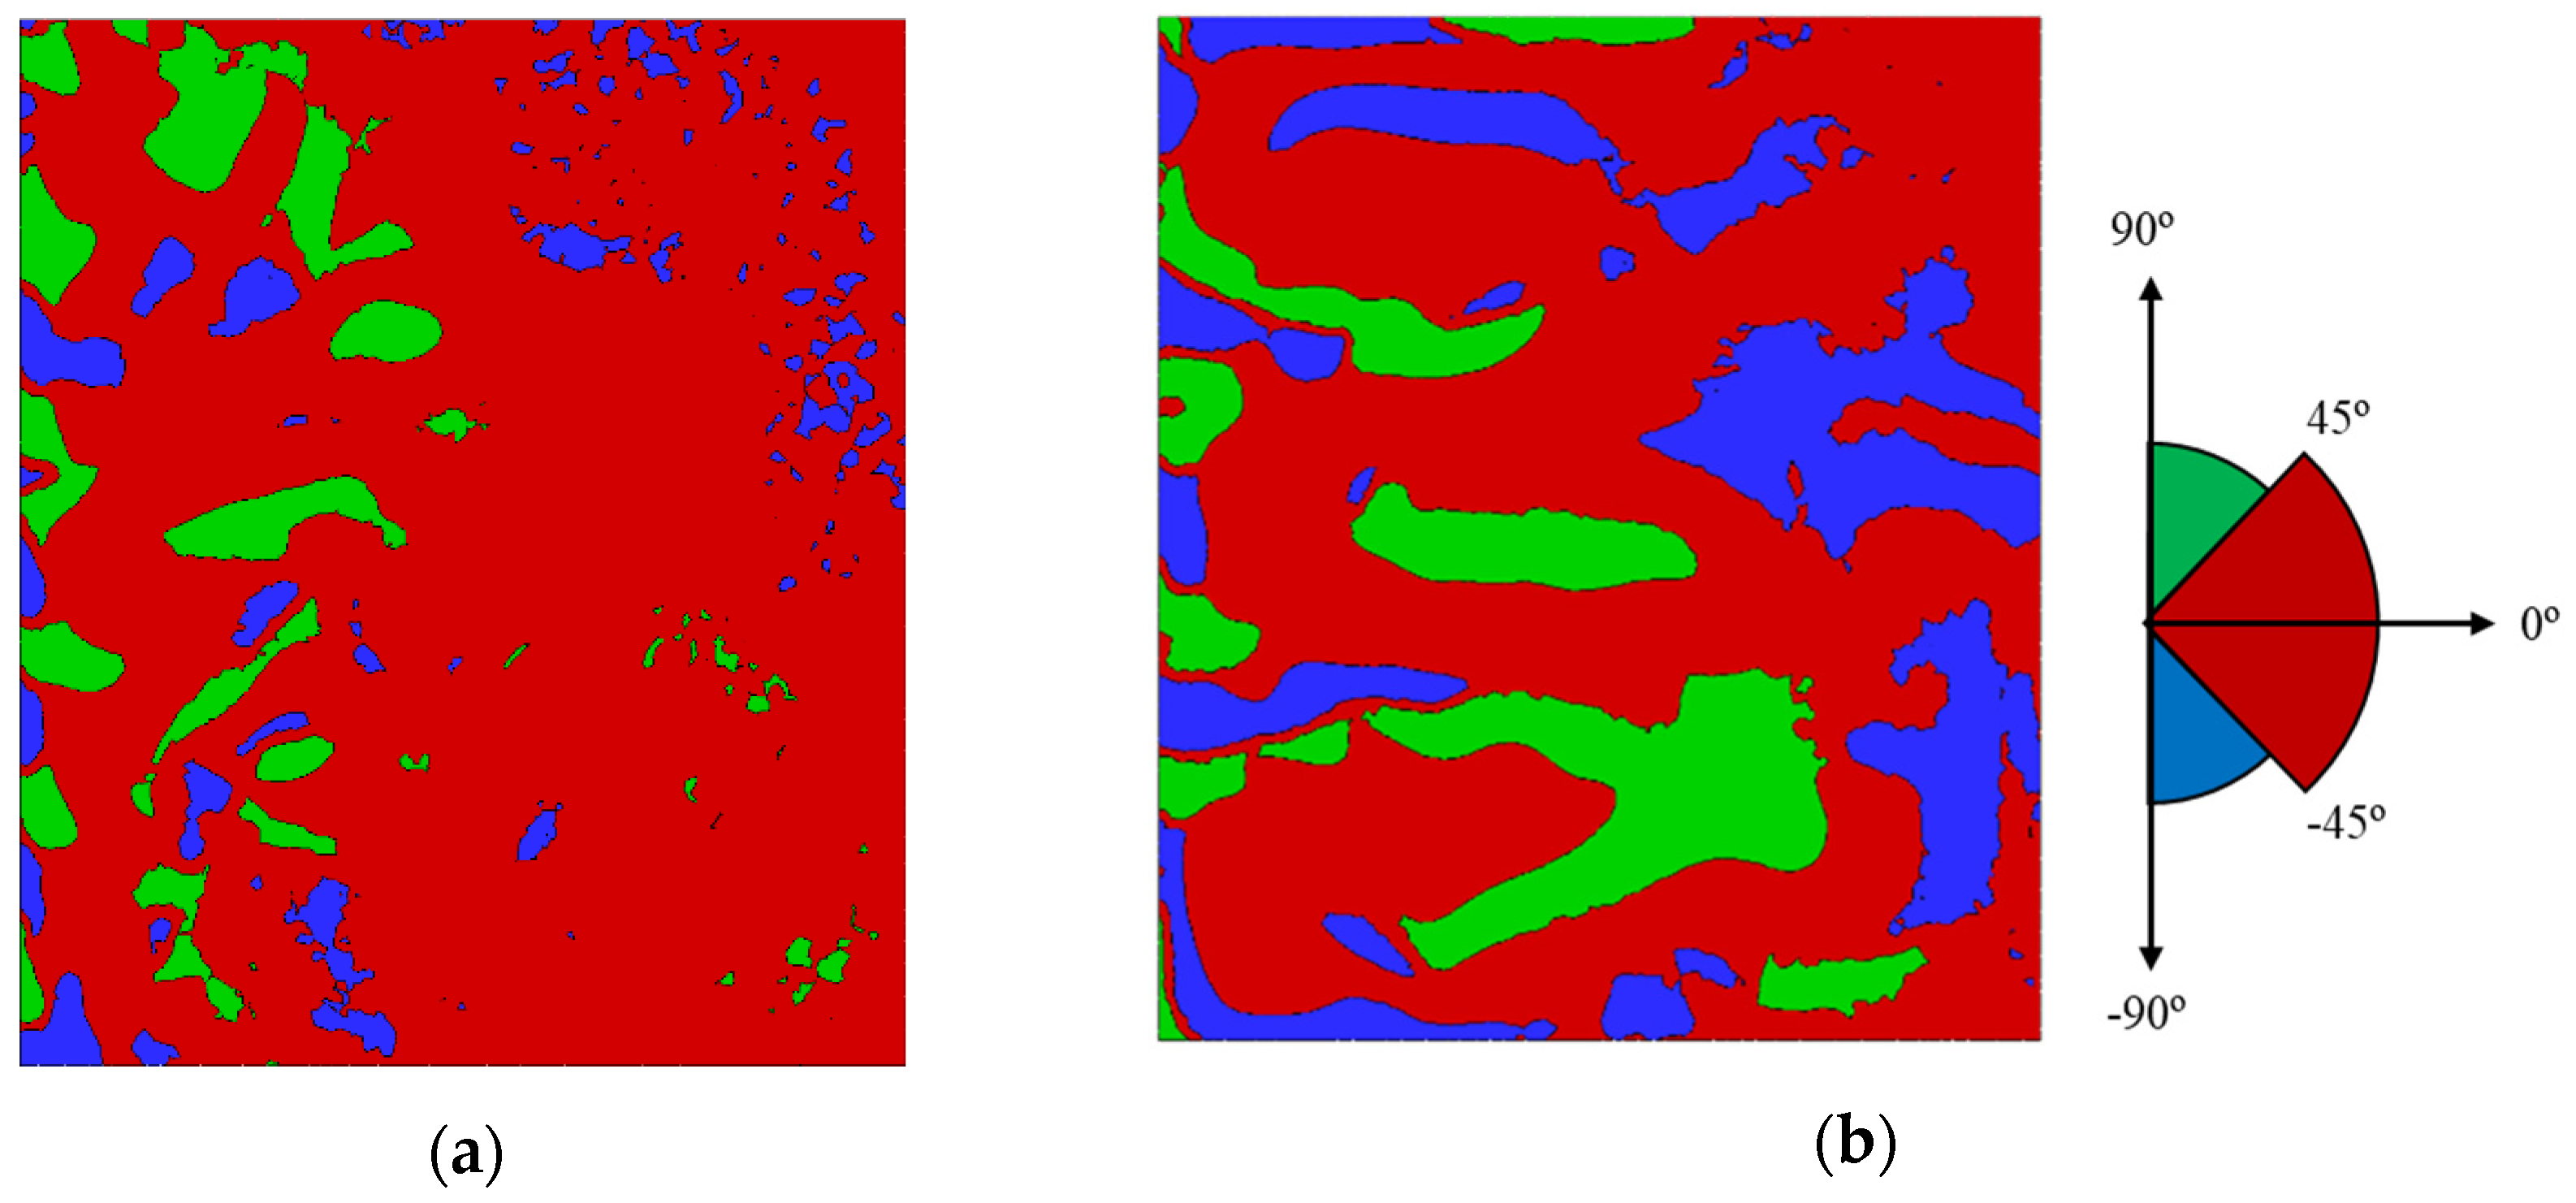
Figure 16 shows the zone classification of airflow angle at the height of 1.4 m for an upper and a floor return system. In the upper return ventilation in Figure 16a, the area of upward, downward, and horizontal flow are mixed broadly on the outer wall compared to the floor return. In the floor return, the area of horizontal airflow, which concerns students’ cross-infection, is decreased by about 20%, and the area of the three directions according to the height from the floor is shown in Table 3. Throughout the analysis of airflow inside classrooms, it is found that the floor return ventilation is more effective in preventing cross-infection as well as in ventilation performance during cooling compared to upper return ventilation.

7. Conclusions

In the present study, the indoor ventilation performance of school classrooms during cooling has been analyzed using numerical simulation. Distributions of temperature and the age of air inside the classroom have been analyzed according to the installation locations of return diffusers. Based on the height of the respiratory line of elementary school students, the indoor air flow direction has been evaluated to indicate the risk of cross-infection among students in the classroom. The results are summarized as follows:
(1)
The distribution and location of the airflow differ greatly depending on the location of the return diffusers. The airflow discharged from the supply diffuser is relatively evenly distributed for the floor return, while the airflow does not reach the floor with an upper return. It is noted that the floor return is more effective than the upper return for uniform flow distribution.
(2)
The temperature change of the upper return on the window side of the outer wall is relatively large compared to that of the floor return due to the difference in airflow distribution according to the installation location of the return diffuser. In both flow return conditions, the temperature rises from the ceiling of the classroom toward the floor, while the absolute average temperature shows that the floor return system performs better.
(3)
The floor return is relatively less congested in the classroom due to indoor air circulation. In terms of ventilation, the floor return shows relatively better performance than the upper return. The age of air with a floor return is significantly reduced compared to an upper return in low-height areas, which is important to occupants.
(4)
Based on the height of the breathing line of elementary school students, between 1.3 and 1.5 m, the area of the horizontal airflow represents 80% and 60% of the upper return and the floor return, respectively. In the floor return, the area of horizontal airflow, which concerns students’ cross-infection, is decreased by about 20%. It is found that floor return system is more effective in reducing cross-infection among students compared to upper return system.
(5)
The present study can be extended to design for optimization of airflow and prevention of cross-infection in office buildings that can adopt a central air conditioning system.
(6)
Although the floor return in space is more effective for ventilation than the upper return, additional optimal design is necessary to determine the proper position of the return diffuser.

Author Contributions

S.S. did numerical simulation and wrote manuscript. C.-M.J. performed conceptual design, supervision and editing. Both authors have read and agreed to the published version of the manuscript.

Funding

This work was supported by the National Research Foundation of Korea (NRF) with grants funded by the Korea government (MSIT, MOE) and (No. 2019 M3 E7 A1113087).

Institutional Review Board Statement

Not applicable.

Informed Consent Statement

Not applicable.

Data Availability Statement

Not applicable.

Acknowledgments

We would like to thank D. Shin of Yonsei University for technical advice on infectious diseases.

Conflicts of Interest

The authors declare no conflict of interest.

References

  1. Burroughs, H.E.; Hansen, S.J. Indoor Air Quality: An Overview-Where Are We? In Managing Indoor Air Quality, 5th ed.; The Farimont Press Inc.: Liburn, GA, USA, 2011; pp. 1–14. [Google Scholar]
  2. Frontcsak, M.; Wargocki, P. Literature survey on how different factors influence human comfort in indoor environments. Build. Environ. 2011, 44, 922–937. [Google Scholar] [CrossRef]
  3. World Health Organization. Burden of Disease from Household Air Pollution for 2012; Public Health, Social and Environmental Determinants of Health Department, World Health Organization: Geneva, Switzerland, 2014. [Google Scholar]
  4. Tong, Z.; Li, Y.; Westerdahl, D.; Freeman, R.B. The impact of air filtration unit primary school students’ indoor exposure to particle matter in China. Environ. Pollut. 2020, 266, 115107. [Google Scholar] [CrossRef] [PubMed]
  5. Sun, Z.; Wang, S.; Ma, Z. In-situ implementation and validation of a CO2-based adaptive demand-controlled ventilation strategy in a multi-zone office building. Build. Environ. 2011, 46, 124–133. [Google Scholar] [CrossRef]
  6. Mysen, M.; Berntsen, P.; Nafstad, P.; Shild, P.G. Occupancy density and benefits of demand-controlled ventilation in Norwegian primary schools. Energy Build. 2005, 37, 1234–1240. [Google Scholar] [CrossRef]
  7. Mendell, M.J.; Health, G.A. Do indoor pollutants and thermal conditions in schools influence student performance? A critical review of the literature. Indoor Air 2005, 15, 27–52. [Google Scholar] [CrossRef] [PubMed]
  8. Gheewala, S.H.; Nielsen, P.H. Central and individual air-conditioning systems—A comparison of environmental impacts and resource consumption in a life cycle perspective. Int. J. Sustain. Dev. World Ecol. Public Health 2003, 10, 149–155. [Google Scholar] [CrossRef]
  9. Ahmed, S.T.; Mahdi, A.A.; Hussein, H.M.A. Numerical simulation of cold air distribution in the room with different supply patterns. Int. J. Comput. Appl. 2013, 72, 15–23. [Google Scholar]
  10. Holmberg, S.; Hokkanen, J.; Jarmyr, R.; Dinielsson, P.O.; Bartec, L.; Holmer, I.; Nilsson, H. The Influence of Air Supply and Exhaust Locations on Ventilation Efficiency and Contaminant Exposures in Rooms. Air Infiltration and Ventilation Centre. Available online: https://www.aivc.org/influence-air-supply-and-exhaust-locations-ventilation-efficiency-and-contaminant-expusures (accessed on 15 December 2020).
  11. Tran, V.V.; Park, D.; Lee, Y. Indoor air pollution, related human diseases, and recent trends in the control and improvement of indoor air quality. Int. J. Environ. Res. Public Health 2020, 17, 2927. [Google Scholar] [CrossRef] [PubMed] [Green Version]
  12. Yu, I.T.S.; Wong, T.W.; Tam, W.; Chan, A.T.Y.; Lee, J.H.W.; Leung, Y.C.; Ho, T. Evidence of airborne transmission of the severe acute respiratory syndrome virus. N. Engl. J. Med. 2004, 350, 1731–1739. [Google Scholar] [CrossRef] [PubMed] [Green Version]
  13. Li, Y.; Qian, H.; Hang, J.; Chen, X.; Cheng, P.; Hong, L.; Wang, S.; Liang, P.; Li, J.; Xiao, S.; et al. Probable airborne transmission of SARS-CoW-2 in a poorly ventilated restaurant. Build. Environ. 2021, 196, 107788. [Google Scholar] [CrossRef] [PubMed]
  14. Carelli, P. A physicist’s approach to COViD-19 transmission via expiratory droplets. Med. Hypotheses 2020, 144, 109997. [Google Scholar] [CrossRef] [PubMed]
  15. Arias, F.J. Are runners more prone to become infected with COVID-19? An approach from the raindrop collisional model. J. Sci. Sport Exerc. 2020, 1–4. [Google Scholar] [CrossRef]
  16. Holton, J. Simulation Research Shows COVID-19 Can Spread Farther by Those Exercising Outdoors; Fox 13 News: Tampa, FL, USA, 2020. [Google Scholar]
  17. Lu, J.; Gu, J.; Li, K.; Xu, C.; Su, W.; Lai, Z.; Zhou, D.; Yu, C.; Xu, B.; Yang, Z. COVID-19 outbreak associated with air conditioning in restaurant, Guangzhou, China, 2020. Emerg. Infect. Dis. 2020, 26, 1628–1631. [Google Scholar] [CrossRef] [PubMed]
  18. Luo, K.; Lei, Z.; Hai, Z.; Xiao, S.; Rui, J.; Yang, H.; Jing, X.; Wang, H.; Xie, Z.; Luo, P.; et al. Transmission of SARS-CoV-2 in public transportation vechicles: A case study in human province, China. Open Forum Infect. Dis. 2020, 7, ofaa430. [Google Scholar] [CrossRef]
  19. Park, S.Y.; Kim, Y.M.; Yi, S.; Lee, S.; Na, B.J.; Kim, C.B.; Kim, J.I.; Kim, H.S.; Kim, Y.B.; Park, Y.; et al. Coronavirus disease outbreak in call center, South Korea. Emerg. Infect. Dis. 2020, 6, 1666–1670. [Google Scholar] [CrossRef] [PubMed]
  20. Korea Ministry of Land, Infrastructure and Transport of Korea. Energy Conservation Design Criteria for Buildings; Department of Green Architecture: Sejong, Korea, 2018.
  21. Ryu, H.S. A study on the kind of space and equipment situations of elementary school facilities. Archit. Inst. Korea 2002, 18, 51–62. [Google Scholar]
  22. ANSI/ASHRAE Standard 55. Thermal Environmental Conditions for Human Occupancy; American Society of Heating, Refrigerating and Air-Conditioning Engineers, Inc.: Atlanta, GA, USA, 2013. [Google Scholar]
  23. Korea Ministry of Education. Student Health Examination Sample Statistics; Department of Student Health Policy: Sejong, Korea, 2020.
  24. Rothamer, D.A.; Sanders, S.; Reindl, D.; Bertram, T.H. Strategies to minimize SARS-CoV-2 transmission in classroom settings. medRxiv 2020. Available online: https://www.medrxiv.org/content/10.1101/2020.12.31.20249101v1 (accessed on 25 March 2021). [CrossRef]
  25. Jayweera, M.; Perera, H.; Gunawardana, B.; Manatunge, J. Transmission of COVID-19 virus by droplets and aerosols: A critical review on the unresolved dichotomy. Environ. Res. 2020, 188, 109819. [Google Scholar] [CrossRef] [PubMed]
Figure 1. Schematic view of a standard elementary school classroom.
Sustainability 13 06188 g001
Figure 2. Central Air Conditioning System in School Building.
Sustainability 13 06188 g002
Figure 3. Definition of Airflow angle (a) Airflow angle, (b) Flow classification.
Sustainability 13 06188 g003
Figure 4. Computational domain.
Sustainability 13 06188 g004
Figure 5. Computational grid system for upper supply and upper return diffusers.
Sustainability 13 06188 g005
Figure 6. Grid dependency test.
Sustainability 13 06188 g006
Figure 7. Streamline (a) Upper return, (b) Floor return.
Sustainability 13 06188 g007
Figure 8. Iso-temperature surface (a) Upper return, (b) Floor return.
Sustainability 13 06188 g008
Figure 9. Local temperature with respect to the height from floor at Plane 4 (a) Positions, (b) Upper return, (c) Floor return.
Sustainability 13 06188 g009
Figure 10. Temperature according to height from floor at Plane 4 (a) Upper return, (b) Floor return.
Sustainability 13 06188 g010
Figure 11. Age of air at Plane 2 (a) Upper return, (b) Floor return.
Sustainability 13 06188 g011aSustainability 13 06188 g011b
Figure 12. Age of air at Plane 4 (a) Upper return, (b) Floor return.
Sustainability 13 06188 g012
Figure 13. Average age of air according to height from the classroom floor for Planes 2 and 4.
Sustainability 13 06188 g013
Figure 14. Contour of airflow angle at the height of 2.0 m for the upper supply and upper return.
Sustainability 13 06188 g014
Figure 15. Area ratio by flow zone classification based on airflow angle. (a) Upper return, (b) Floor return.
Sustainability 13 06188 g015
Figure 16. Zone classification of airflow angle at the height of 1.4 m (a) Upper return, (b) Floor return.
Sustainability 13 06188 g016
Table 1. Average height of Korean elementary school students [23].
GradeAge
[Years]
Height [cm]
MaleFemaleAverage
18122.2120.6121.4
29128.2126.9127.6
310134.1132.8133.5
411139.8139.1139.5
512145.3146.0145.7
613152.1152.3152.2
Table 2. Boundary conditions.
NameBoundary Condition
Inlet (Supply Diffusers)Flowrates (800 CMH), Temperature (18 °C)
Outlet (Return Diffusers)Pressure (Atmosphere)
Outer WallHeat transmission coefficient (0.18 W/m2 K),
Temperature (31 °C)
Outer WindowHeat transmission coefficient (1.7 W/m2 K),
Temperature (31 °C)
Ceil, Floor, Walls Except Outer WallAdiabatic wall
Table 3. Area of three airflow zone for upper and lower return.
Height
[m]
Area [m2]
UpwardDownwardHorizontal
UpperLowerUpperLowerUpperLower
1.011.9212.9516.8610.5531.7036.98
1.110.909.1716.229.5233.3641.79
1.26.397.9815.0010.4939.0942.01
1.34.998.637.0212.3548.4739.50
1.45.509.123.6711.8351.3139.53
1.59.629.633.6811.5247.1939.33
Publisher’s Note: MDPI stays neutral with regard to jurisdictional claims in published maps and institutional affiliations.