Communication

Metrics to Accelerate Private Sector Investment in Sustainable Development Goal 2—Zero Hunger

Department of Geographical Sciences, University of Maryland, College Park, MD 20742, USA
Sustainability 2021, 13(11), 5967; https://doi.org/10.3390/su13115967
Submission received: 23 March 2021 / Revised: 17 May 2021 / Accepted: 20 May 2021 / Published: 25 May 2021

Abstract

:
Substantial investment from both the private and public sectors will be needed to achieve the ambitious Sustainable Development Goal 2 (SDG2), which focuses on ending poverty and achieving zero hunger. To harness the private sector, high quality, transparent metrics are needed to ensure that every dollar spent reaches the most marginalized segments of a community while still helping institutions achieve their goals. Satellite-derived Earth observations will be instrumental in accelerating these investments and targeting them to the regions with the greatest need. This article proposes two quantitative metrics that could be used to evaluate the impact of private sector activities on SDG2: measuring increases in yield over baseline and ensuring input availability and affordability in all markets.

1. Introduction

The Sustainable Development Goals (SDGs) were adopted by all United Nations Member countries in 2015 as a universal call to end poverty and protect the planet by 2030. SDG2 aims to end hunger, achieve food security, improve nutrition and promote sustainable agriculture [1]. The focus of SDG2 is to double agricultural productivity and incomes for smallholder farmers, and to ensure access to food for farming households. United Nations estimates for investment to achieve these goals for low income countries range from $3 to $5 trillion per year [2]. This level of investment requires the engagement of the private sector. Key players in the private sector include agriculture technology companies producing high yielding seeds and the inputs needed to sustain them, as well as retailers, agronomists and agro-dealers involved in last-mile delivery to small growers [3].
To achieve the food security and poverty goals of SDG2, private sector investment needs to increase by a factor of four [4]. Large and small-scale businesses, microenterprises, wholesalers and retail stores as well as large multi-national corporations all have a role to play in lifting people out of poverty and hunger through responsible and productive investment, innovation, enhanced efficiency and employment creation [5,6]. However, not all investment results in reductions in poverty or food insecurity.
Displacement of small, disenfranchised growers [7], increased inequality [8] or increased indebtedness [9] due to inability to repay loans for agricultural inputs may also occur from agricultural investment. Research has shown that increases in the total amount of calories produced by agriculture has progressively reduced its nutrient content through displacement of locally grown, low yielding but highly nutritious food [10]. We need quantitative metrics to ensure that private sector investments result not only in increased availability of nutritious food, but also preserves biodiversity [11] and works well in smallholder agricultural systems that support the majority of rural communities [12].
To harness the private sector, high quality, transparent metrics are needed to ensure that every dollar spent reaches the most marginalized segments of a community while still helping institutions achieve their goals (Figure 1) [13]. Strong direction from stakeholders such as governments and cross-sectoral institutions such as healthcare and education as they seek to achieve SDG2 will be required to ensure progress. For example, in the area of transportation investment, SDG metrics are required to credibly link activities of a company to changes in local social and environmental conditions. These metrics should be uniform, internally consistent, transparent and match the geographical resolution of financial data that companies often disclose [14]. Unfortunately, metrics on the performance of investments in the agriculture sector are extremely variable, and often only weakly evaluate the impact a particular activity has on achieving broader societal goals articulated in SDG2 [15]. Here I propose several metrics that, together, can guide private sector investment relevant to SDG2.

2. Earth Observation Data on Agriculture

The ever-growing archive of new and historical satellite-derived Earth observation data provides an opportunity to underpin metrics that demonstrate which investments enhance global food security (Table S1) [16]. Although we are in a ‘golden age’ of satellite-driven Earth observation [17], transforming these datasets into information that can be used to change food security outcomes has proven challenging [18].
For example, non-climatic drivers of yield decline need moderate to high resolution satellite data to capture field-level decline in leaf area index resulting from infestation [19]. The impact of pests such as the desert locust [20] and fall armyworm [21] can be countered with cost-effective solutions such as integrated pest management [22] coupled with new resistant crop varieties and targeted biological control agents, such as the use of Metarhizium flavoviride fungus as a control agent for the desert locust [20]. Metrics focused on raising yields must be able to capture climatic, economic and social outcomes of investment and changes of policy through time [23], and show clearly how new agriculture management strategies, technology and interventions can counter these pests while still reducing poverty and food insecurity (Table S1) [12].
Satellite remote sensing data can be used at each stage of the agriculture value chain, but needs to be connected with high quality, spatially explicit, regularly updated field data obtained from growers that captures agricultural activities to transform it into useful metrics [24]. New initiatives such as the EO4SD, funded by the European Space Agency, are focused on supporting the uptake of remote sensing data in sustainable development [25]. Big data approaches provide the opportunity to combine satellite remote sensing with legal, economic and food security outcomes in new and novel ways, particularly leveraging improved computing power and machine learning techniques [26].

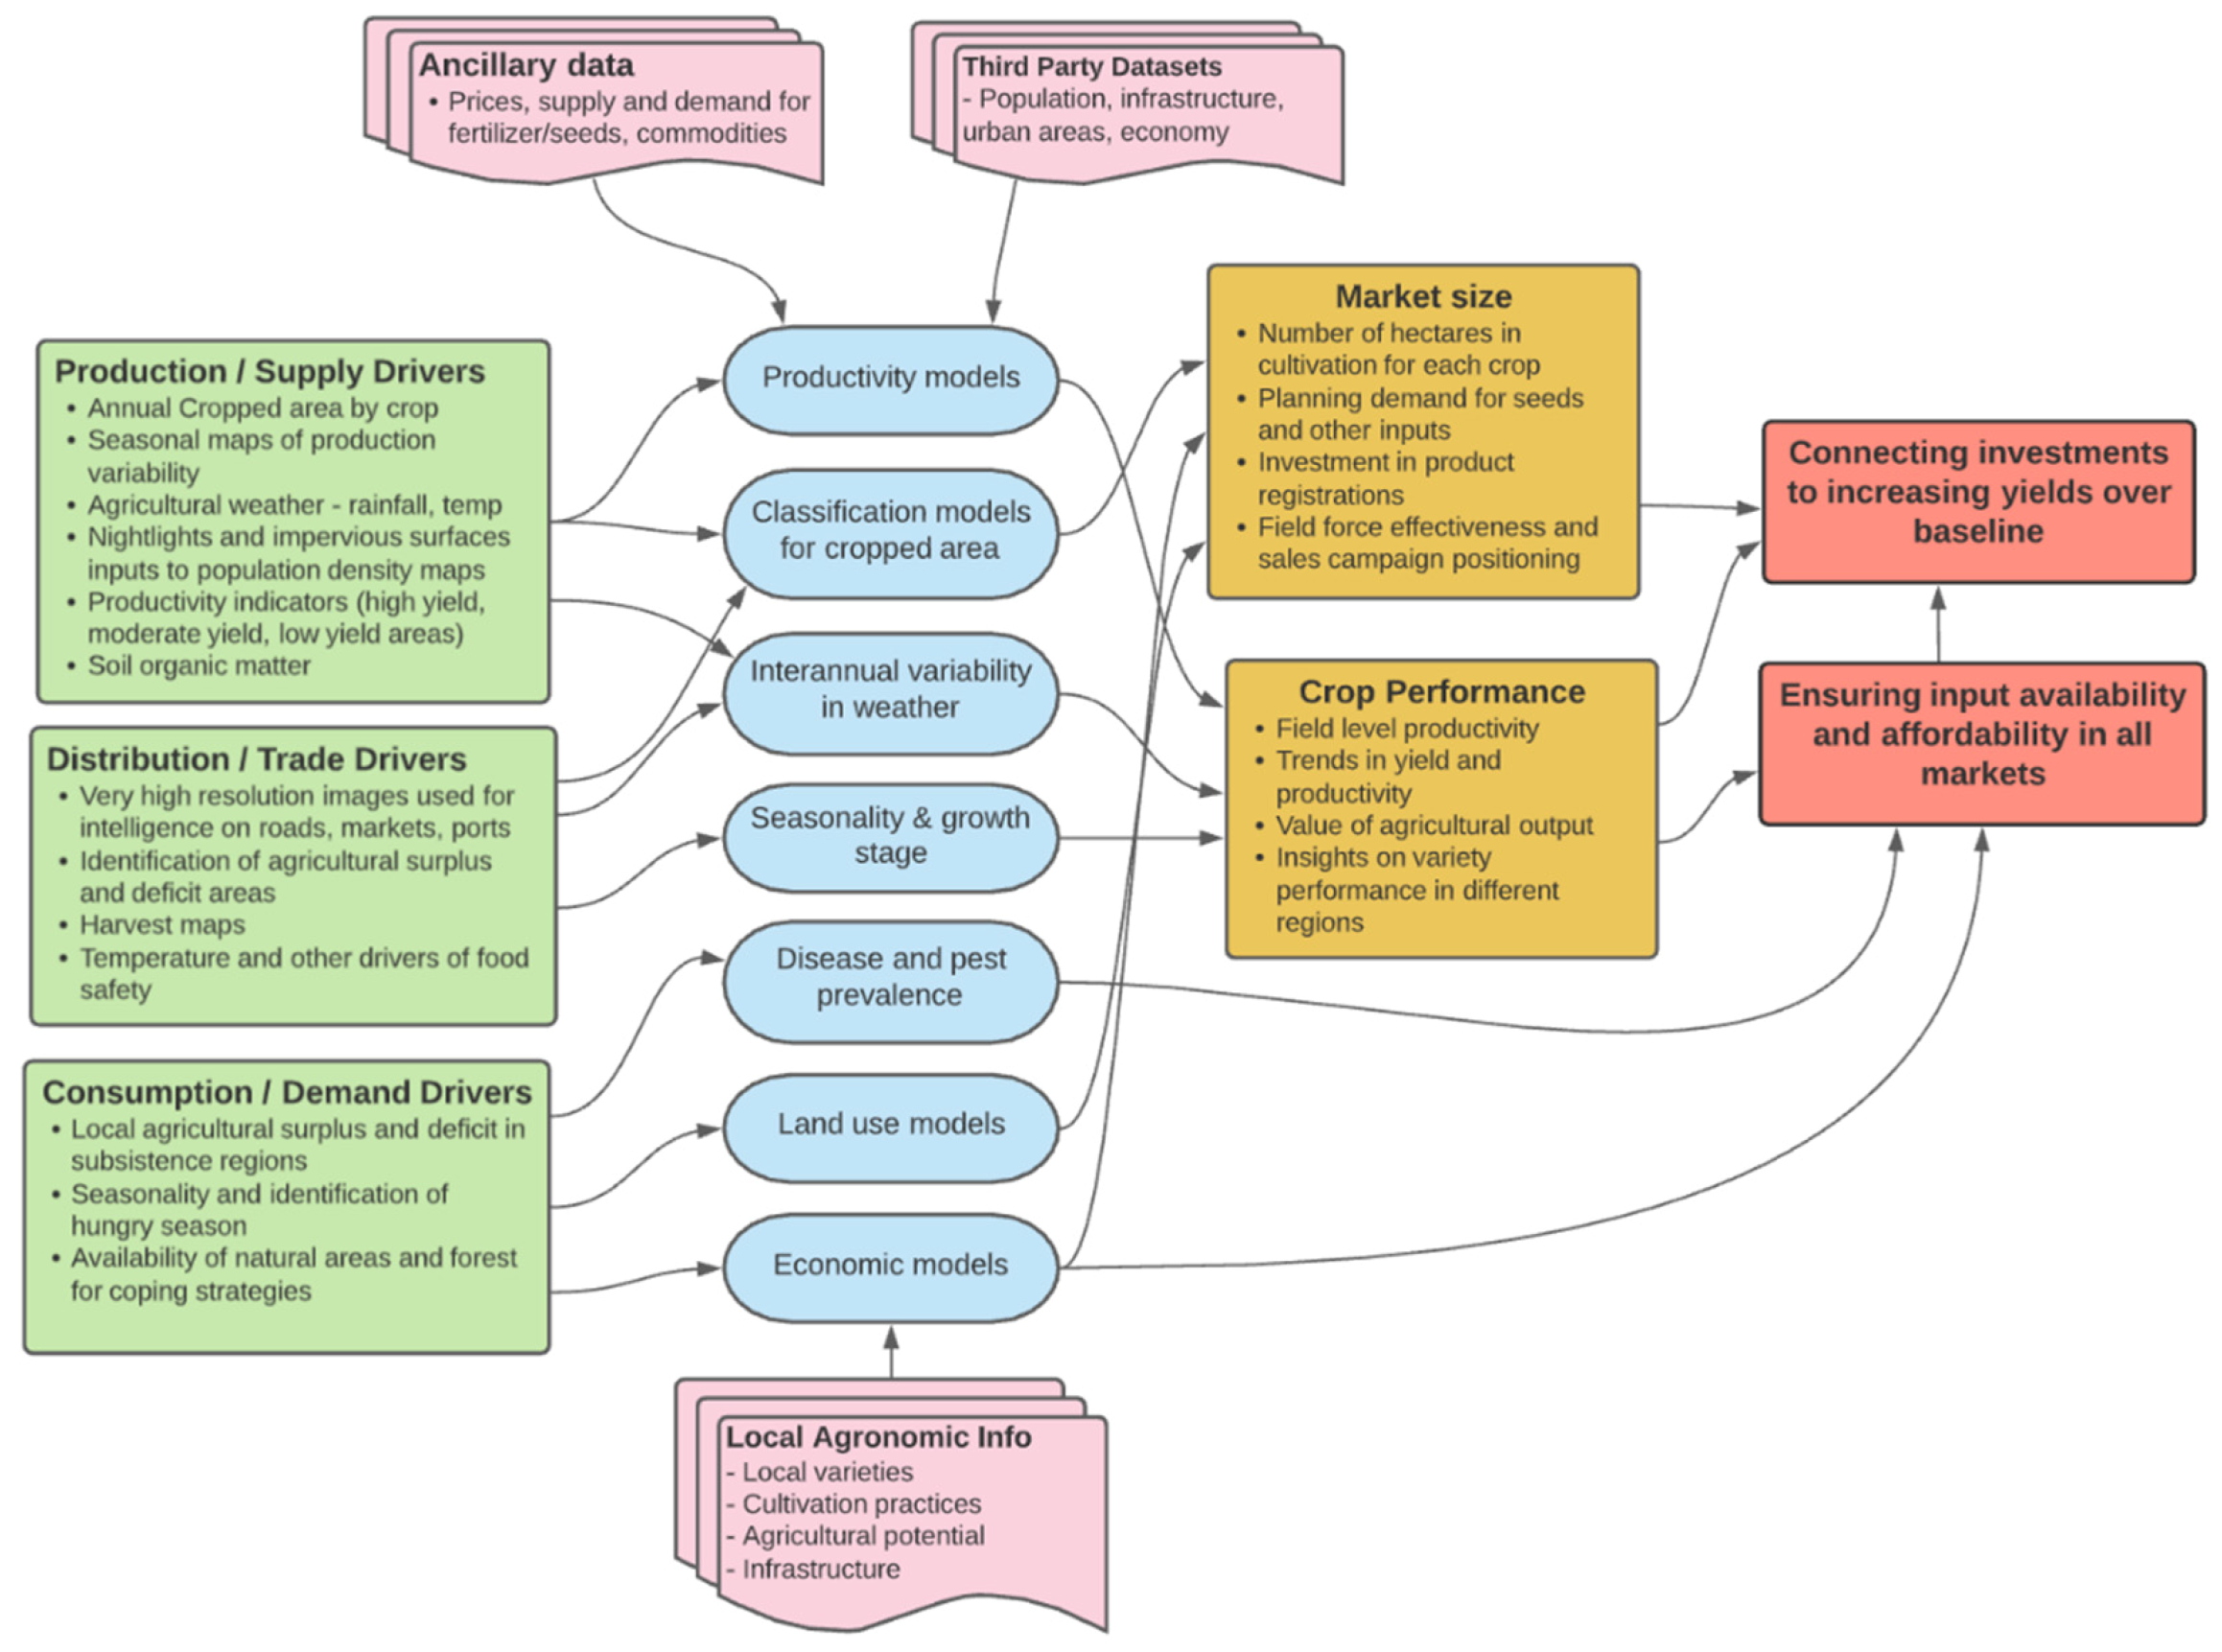
3. Metric to Estimate Market Size to Guide Investment

Market size is the approximate number of individuals in a certain market segment who are potential buyers of a product. In regions with dated or only national-level agricultural statistics, the size of the market for high yielding varieties and fertilizer blends designed to meet the needs of specific crops is often unknown [27]. Improvements in computer power and massive reductions in cost mean that, in the near future, the scientific community should be able to create annual global maps of rainfed agriculture for the major crop types of maize, wheat, soybean and sugarcane (Figure 2). Using the spectral, spatial, temporal and agronomic information about crop cultivation practices, the research community can now create high quality cultivated annual area maps for each crop in Africa and Asia in near-real time [28,29].
For example, development and use of operational 10 m annual maize maps in Zambia in 2019 showed a significant market opportunity in underserved communities across the border in the Katanga region of the Democratic Republic of Congo. This has resulted in the investment in new distribution centers, retail outlets, and hybrid seed and crop protection product distribution by a large agtech company in 2019. Without a well-established channel to deliver sufficient quantities of high-quality seeds or fertilizer, unadulterated inputs, growers may experience higher input prices or late delivery that may interfere with yield improvements [30]. Private sector companies can use cropped area maps to ensure that small scale subsistence farmers have the same access to crop inputs and agronomic advice via retailers as large commercial growers to high yielding varieties, fertilizers and agronomic advice.

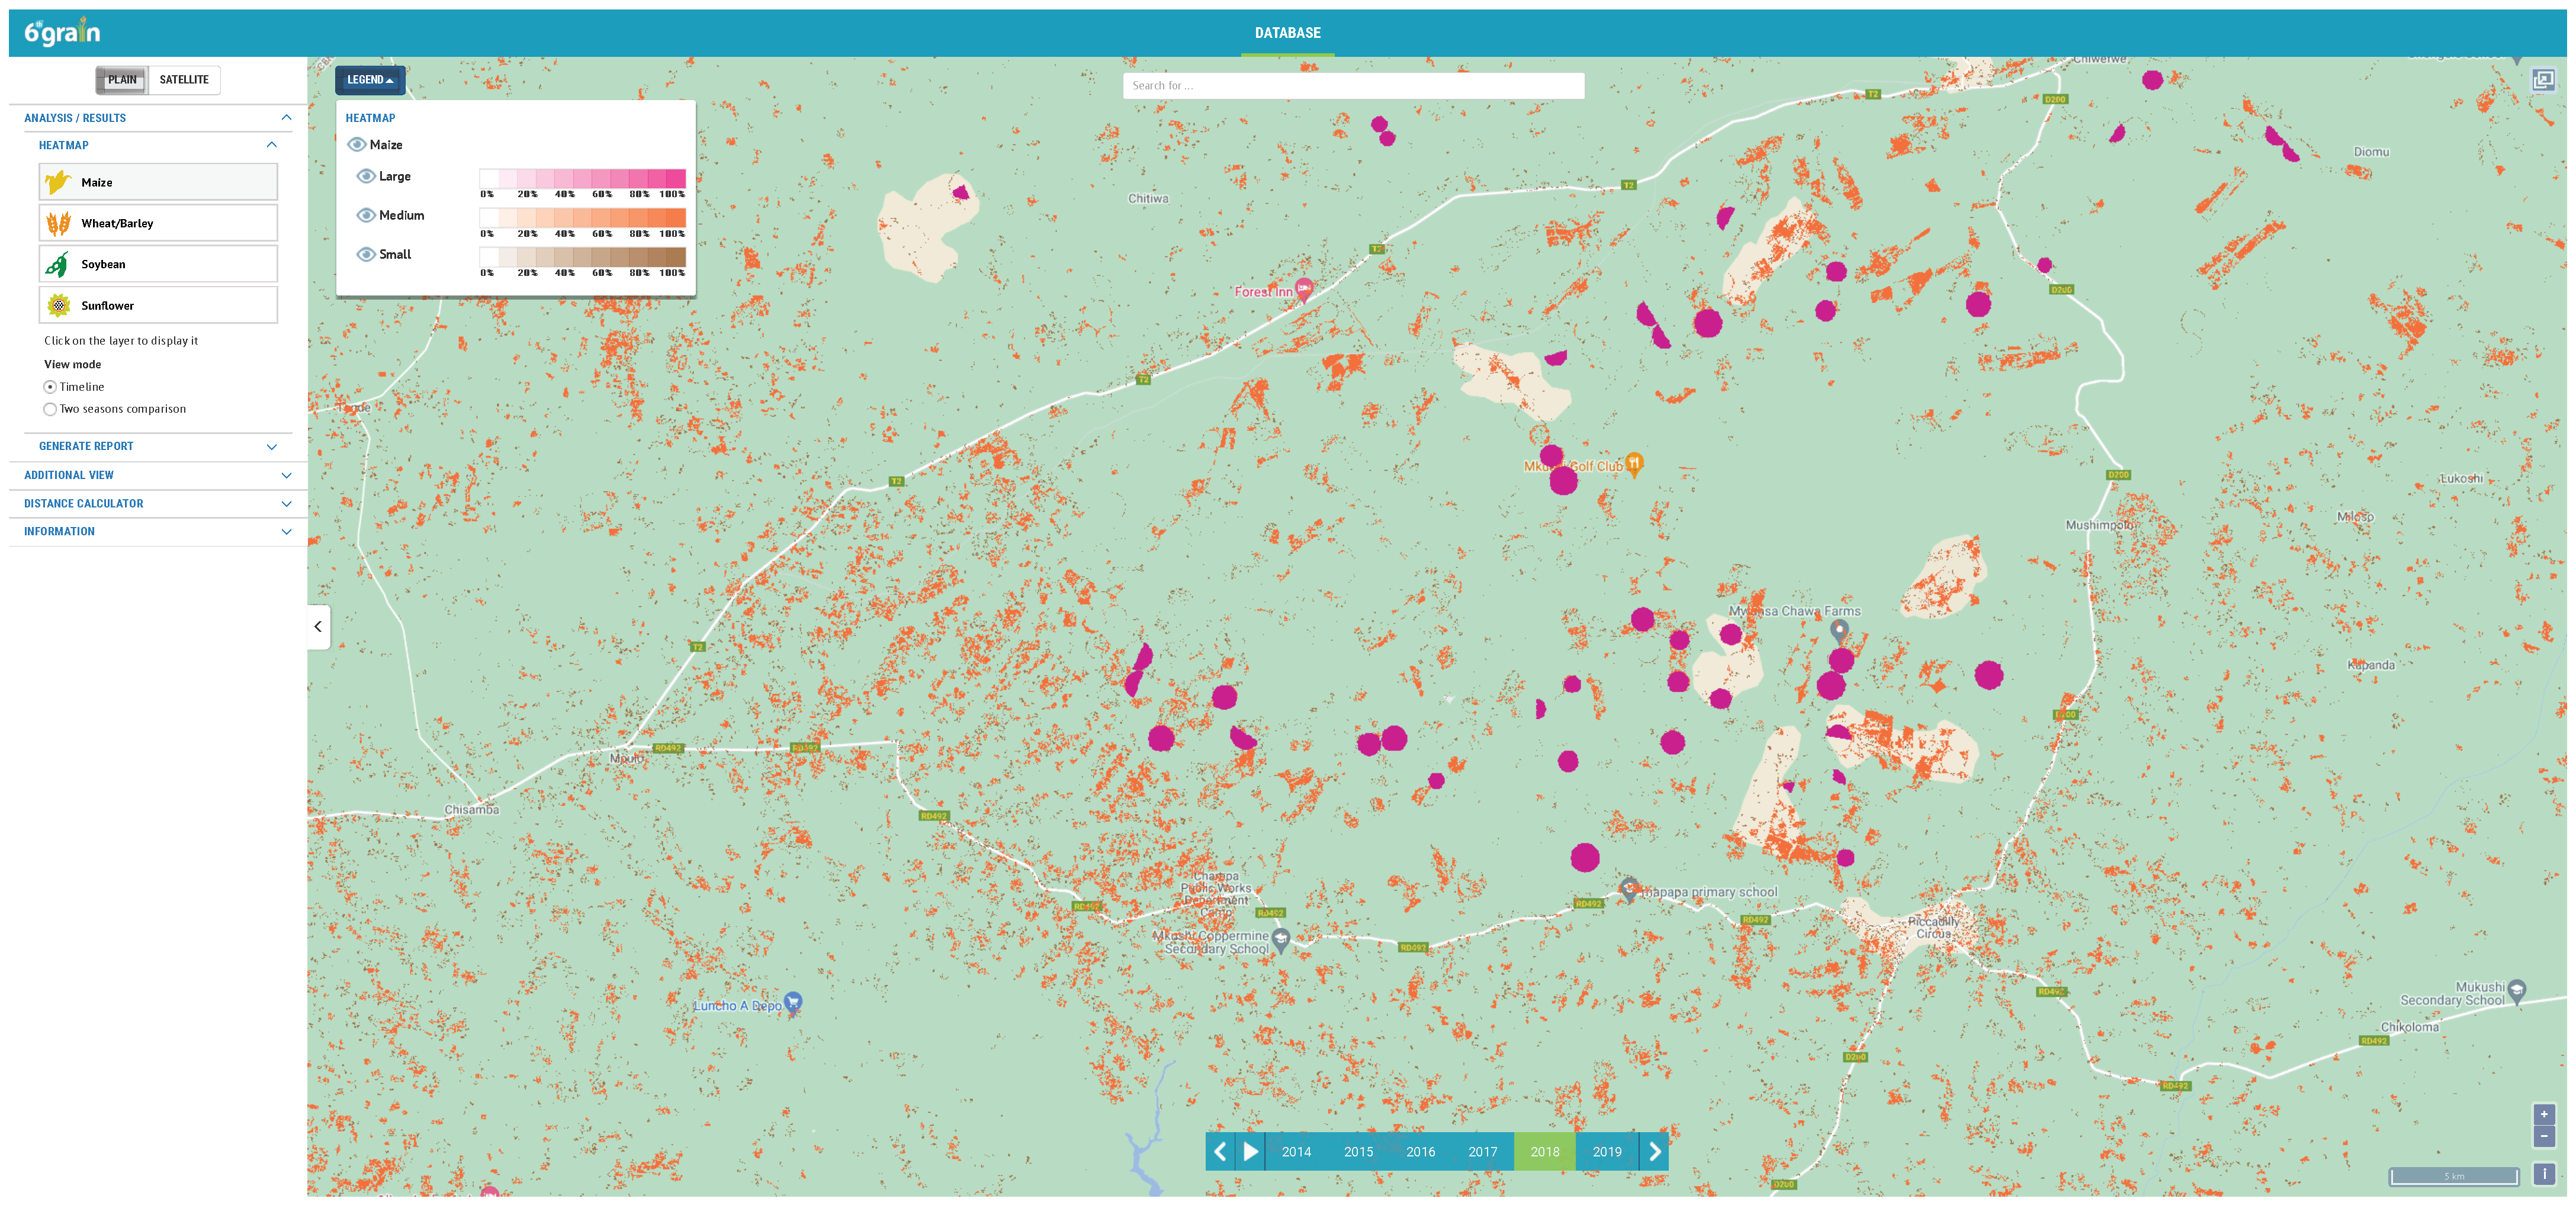
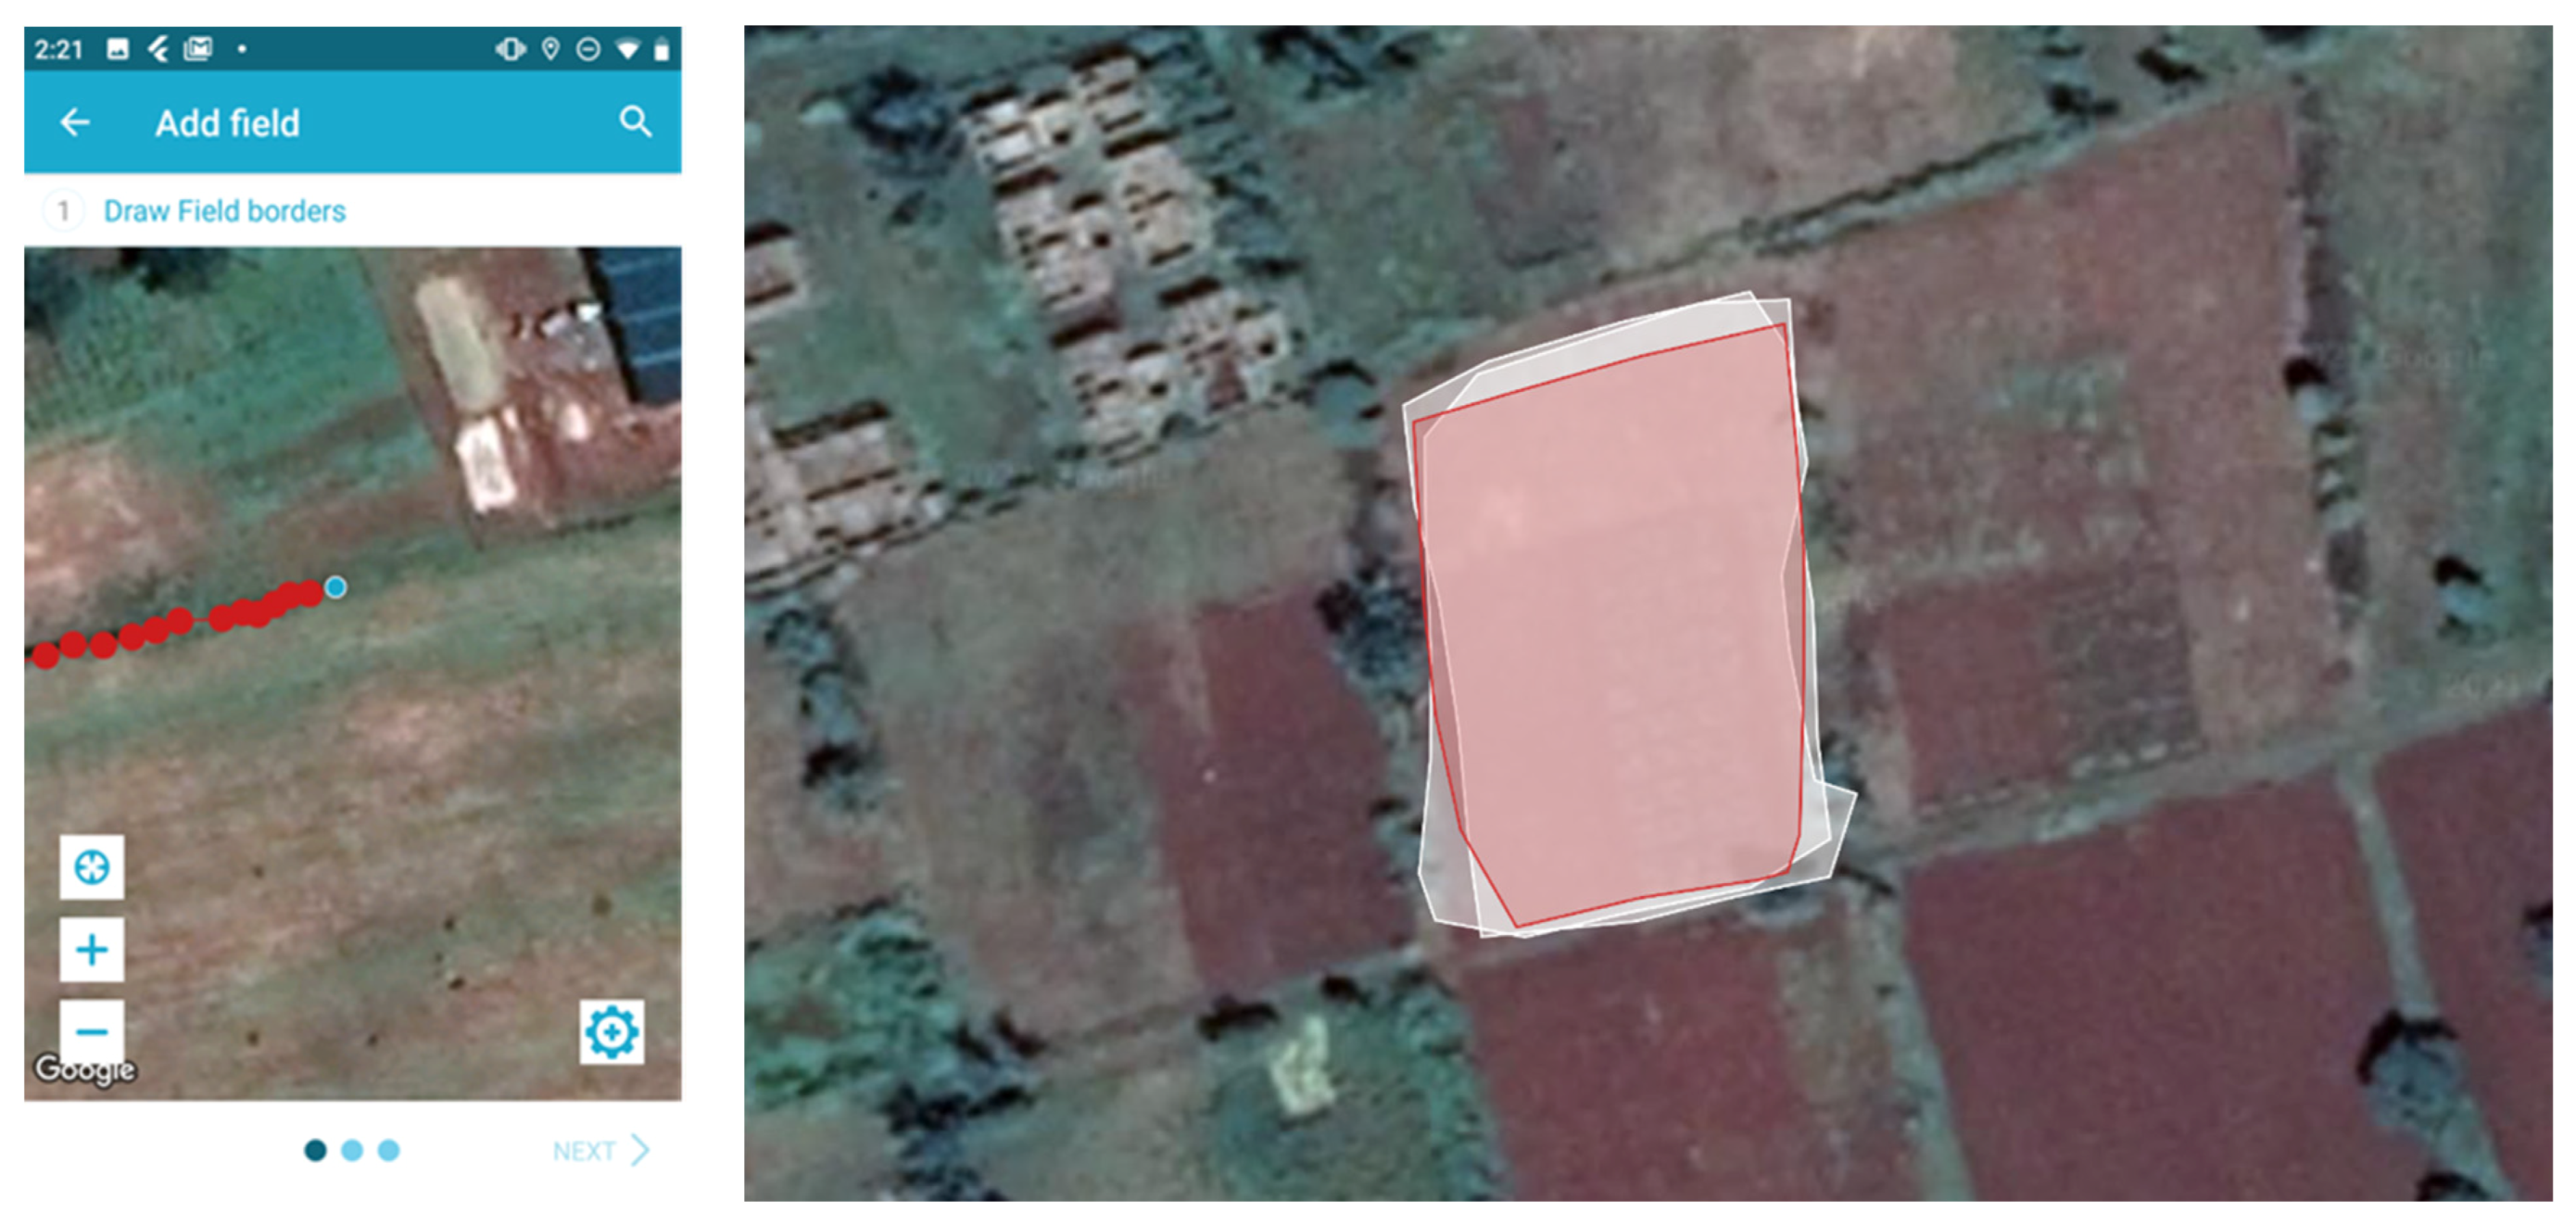
4. Metric for Measuring Crop Performance and Field-Level Productivity

High quality, accurate, annually updated information on crop production combined with field size is necessary to estimate yield. These data need to capture not only crop type and variety, but also management strategy, such as information on fertilizer timing and quantity, planting density, weeding protocols, and pest and disease prevalence. Given the hundreds of millions of small growers around the world, the large number of varieties available and the need to continuously update the information, keeping the cost per data point as low as possible is essential. High quality yield estimates underpin financing which then provides access to additional technology [31], as well as insurance products needed by millions of farmers facing increasingly uncertain weather [32]. Using insurance to transfer the risk of buying high quality seeds and inputs to the private sector allows for the expanded use of inputs [33]. This transfer of risk also provides information to evaluate whether these inputs provide substantially higher yields year over year.
Assessing yield affordably will require the use of Earth observing data, social media and innovative mobile chatbot technologies. The private sector can train a large base of smartphone-owning farmers around the world to create field boundaries to estimate field size. New yield models are needed to estimate the likely impact of weather shocks on outcome. Small growers can digitize their field by walking around it, capturing GPS points which are sent to a server, together with crop, variety and date planted information (Figure 3). An example of this is shown in Figure 3, provided by 6th Grain and its partner Tetra Tech, funded by the Bill and Melinda Gates Foundation. It was found that when fields were digitized by an untrained small grower and an agronomist with Android phones, they can reproduce field boundaries to within 10% of area and centroid distance of 2 m of each other, well below the geospatial accuracy of Sentinel 2a/b [34].

5. Conclusions

Although technology has driven increases in agricultural yields during the past half century, quantitative metrics, which are used to measure the impact of private sector investments in the provision of improved seeds, better agronomic advice and increased productivity, are still lacking. There is substantial complexity in measuring area cultivated, variety planted and yields across millions of farmers in low-income settings [35]. Establishing a structured database of information from the private sector on field size, crop planted, planting date and inputs used on that field will help actors identify smallholder farmers that can benefit from their goods and services if they choose to do so, as well as reduce barriers to access to agricultural technology. Digital tools and Earth observation data together can provide critical metrics that can both spur investment and measure their impact.

Supplementary Materials

The following are available online at https://www.mdpi.com/article/10.3390/su13115967/s1, Table S1: Data Sources used in Remote Evaluation of Food Production and Agriculture.

Funding

This research received no external funding.

Institutional Review Board Statement

Not applicable.

Informed Consent Statement

Not applicable.

Data Availability Statement

The data referred to in Figure 2 of this article are available upon request from the author or can be accessed via URL at http://zambia.cropmap.6grain.com/Database.

Acknowledgments

I would like to thank Alex FitzGerald and Kathryn Grace for reading earlier versions of this article.

Conflicts of Interest

Dr. Brown works as the Chief Science Officer for 6th Grain Corporation, more details on which can be found at https://www.6grain.com. 6th Grain has contracts to digitize fields and create annual cropped area maps over the past five years, which are the source of Figure 2 and Figure 3.

References

  1. United Nations Sustainable Development Knowledge Platform. Available online: https://sustainabledevelopment.un.org/index.html (accessed on 19 March 2021).
  2. United Nations. Investing in the SDGs: An Action Plan; United Nations Conference on Trade and Development: Geneva, Switzerland, 2014. [Google Scholar]
  3. Rutsaert, P.; Donovan, J. Sticking with the Old Seed: Input Value Chains and the Challenges to Deliver Genetic Gains to Smallholder Maize Farmers. Outlook Agric. 2020, 49, 39–49. [Google Scholar] [CrossRef] [PubMed] [Green Version]
  4. Aust, V.; Morais, A.I.; Pinto, I. How Does Foreign Direct Investment Contribute to Sustainable Development Goals? Evidence from African Countries. J. Clean. Prod. 2020, 245, 118823. [Google Scholar] [CrossRef]
  5. Mason-D’Croz, D.; Sulser, T.B.; Wiebe, K.; Rosegrant, M.W.; Lowder, S.K.; Nin-Pratt, A.; Willenbockel, D.; Robinson, S.; Zhu, T.; Cenacchi, N.; et al. Agricultural Investments and Hunger in Africa Modeling Potential Contributions to SDG2—Zero Hunger. World Dev. 2019, 116, 38–53. [Google Scholar] [CrossRef]
  6. Gerpacio, R. V The Roles of Public Sector versus Private Sector in R&D and Technology Generation: The Case of Maize in Asia. Agric. Econ. 2003, 29, 319–330. [Google Scholar]
  7. Rao, N.D.; Min, J.; DeFries, R.; Ghosh-Jerath, S.; Valin, H.; Fanzo, J. Healthy, Affordable and Climate-Friendly Diets in India. Glob. Environ. Chang. 2018, 49, 154–165. [Google Scholar] [CrossRef]
  8. Zwart, S.J.; Busetto, L.; Boschetti, M.; Diagne, M. Assessing the Impact of National Food Security Policies on Irrigated Rice Cultivation in Senegal Using Advanced Remote Sensing and Modelling Technologies. In Proceedings of the Free and Open Source Software for Geospatial, FOSS4G 2018; ScholarWorks@UMass Amherst: Amherst, MA, USA, 2018. [Google Scholar]
  9. Kaur, M.; Mehra, A. Regional Patterns in Farm Suicides in India: A Critical Analysis. Available online: http://jndmeerut.org/wp-content/uploads/2020/09/Vol.-27-No.-2-2018.pdf#page=23 (accessed on 12 March 2021).
  10. DeFries, R.; Fanzo, J.; Remans, R.; Palm, C.; Wood, S.; Anderman, T.L. Metrics for Land-Scarce Agriculture. Science 2015, 349, 238–240. [Google Scholar] [CrossRef]
  11. Tscharntke, T.; Clough, Y.; Wanger, T.C.; Jackson, L.; Motzke, I.; Perfecto, I.; Vandermeer, J.; Whitbread, A. Global Food Security, Biodiversity Conservation and the Future of Agricultural Intensification. Biol. Conserv. 2012, 151, 53–59. [Google Scholar] [CrossRef]
  12. Thornton, P.K.; Loboguerrero, A.M.; Campbell, B.M.; Mercado, L.; Shackleton, S.; Kavikumar, K.S. Rural Livelihoods, Food Security and Rural Transformation under Climate Change; Global Commission on Adaptation, World Resources Institute: Washington, DC, USA, 2019. [Google Scholar]
  13. Rashed, A.H.; Shah, A. The Role of Private Sector in the Implementation of Sustainable Development Goals. Environ. Dev. Sustain. 2021, 23, 2931–2948. [Google Scholar] [CrossRef]
  14. Buonocore, J.J.; Choma, E.; Villavicencio, A.H.; Spengler, J.D.; Koehler, D.A.; Evans, J.S.; Lelieveld, J.; Klop, P.; Sanchez-Pina, R. Metrics for the Sustainable Development Goals: Renewable Energy and Transportation. Palgrave Commun. 2019, 5, 1–14. [Google Scholar] [CrossRef]
  15. Rankin, M.; Nogales, E.G.; Santacoloma, P.; Mhlanga, N.; Rizzo, C. Public–Private Partnerships for Agribusiness Development; Food and Agriculture Organization of the United Nations: Rome, Italy, 2016. [Google Scholar]
  16. Whitcraft, A.K.; Becker-Reshef, I.; Killough, B.D.; Justice, C.O. Meeting Earth Observation Requirements for Global Agricultural Monitoring: An Evaluation of the Revisit Capabilities of Current and Planned Moderate Resolution Optical Earth Observing Missions. Remote Sens. J. 2015, 7, 1482–1503. [Google Scholar] [CrossRef] [Green Version]
  17. Painter, T.H.; Famiglietti, J.S.; Stephens, G.L. Leveraging This Golden Age of Remote Sensing and Modeling of Terrestrial Hydrology to Understand Water Cycling in the Water Availability Grand Challenge for North America. Available online: https://ui.adsabs.harvard.edu/abs/2016AGUFM.H43P..01P/abstract (accessed on 19 February 2021).
  18. Whitcraft, A.K.; Becker-Reshef, I.; Justice, C.O.; Gifford, L.; Kavvada, A.; Jarvis, I. No Pixel Left behind: Toward Integrating Earth Observations for Agriculture into the United Nations Sustainable Development Goals Framework. Remote Sens. Environ. 2019, 235, 111470. [Google Scholar] [CrossRef]
  19. Prabhakar, M.; Gopinath, K.A.; Kumar, N.R.; Thirupathi, M.; Sravan, U.S.; Kumar, G.S.; Siva, G.S.; Meghalakshmi, G.; Vennila, S. Detecting the Invasive Fall Armyworm Pest Incidence in Farm Fields of Southern India Using Sentinel-2A Satellite Data. Geocarto Int. 2020, 1–16. [Google Scholar] [CrossRef]
  20. Githae, E.W.; Kuria, E.K. Biological Control of Desert Locust (Schistocerca Gregaria Forskål). CAB Rev. 2021, 16, 1–8. [Google Scholar] [CrossRef]
  21. Tambo, J.A.; Day, R.K.; Lamontagne-Godwin, J.; Silvestri, S.; Beseh, P.K.; Oppong-Mensah, B.; Phiri, N.A.; Matimelo, M. Tackling Fall Armyworm (Spodoptera Frugiperda) Outbreak in Africa: An Analysis of Farmers’ Control Actions. Int. J. Pest Manag. 2020, 66, 298–310. [Google Scholar] [CrossRef] [Green Version]
  22. Abrahams, P.; Bateman, M.; Beale, T.; Clottey, V.; Cock, M.; Colmenarez, Y.; Corniani, N.; Day, R.; Early, R.; Godwin, J.; et al. Fall Armyworm: Impacts and Implications for Africa. Outlooks Pest Manag. 2017, 28, 196–201. [Google Scholar]
  23. Jewiss, J.; Brown, M.; Escobar, V. Satellite Remote Sensing Data for Decision Support in Emerging Agricultural Economies. IEEE Geosci. Remote Sens. Mag. 2020. [Google Scholar] [CrossRef]
  24. Liakos, K.G.; Busato, P.; Moshou, D.; Pearson, S.; Bochtis, D. Machine Learning in Agriculture: A Review. Sensors 2018, 18, 2674. [Google Scholar] [CrossRef] [PubMed] [Green Version]
  25. Sarti, F.; Gómez, A.C.; Stewart, C. Earth Observation Capacity Building at ESA. In Space Capacity Building in the XXI Century; Springer: Berlin, Germany, 2020; pp. 233–250. [Google Scholar]
  26. Runting, R.K.; Phinn, S.; Xie, Z.; Venter, O.; Watson, J.E.M. Opportunities for Big Data in Conservation and Sustainability. Nat. Commun. 2020, 11, 1–4. [Google Scholar] [CrossRef]
  27. Gascon, F.; Cadau, E.; Colin, O.; Hoersch, B.; Isola, C.; Fernández, B.L.; Martimort, P. Copernicus Sentinel-2 Mission: Products, Algorithms and Cal/Val. In Proceedings of the Earth Observing Systems XIX; International Society for Optics and Photonics: Bellingham, WA, USA, 2014; Volume 9218, p. 92181E. [Google Scholar]
  28. Grace, K.; Husak, G.; Harrison, L.; Pedreros, D.; Michaelsen, J. Using High Resolution Satellite Imagery to Estimate Cropped Area in Haiti and Guatemala. Appl. Geogr. 2012, 32, 433–440. [Google Scholar] [CrossRef]
  29. Defourny, P.; Bontemps, S.; Bellemans, N.; Cara, C.; Dedieu, G.; Guzzonato, E.; Hagolle, O.; Inglada, J.; Nicola, L.; Rabaute, T.; et al. Near Real-Time Agriculture Monitoring at National Scale at Parcel Resolution: Performance Assessment of the Sen2-Agri Automated System in Various Cropping Systems around the World. Remote Sens. Environ. 2019, 221, 551–568. [Google Scholar] [CrossRef]
  30. Poulton, C.; Dorward, A.; Kydd, J. The Future of Small Farms: New Directions for Services, Institutions, and Intermediation. World Dev. 2010, 38, 1413–1428. [Google Scholar] [CrossRef]
  31. Goldman, L.; Tsan, M.; Colina, R.D.C.; Daga, S.; Woolworth, V. Inflection Point: Unlocking Growth in the Era of Farmer Finance. 2016. Available online: https://www.raflearning.org/post/inflection-point-unlocking-growth-the-era-farmer-finance (accessed on 12 March 2021).
  32. Tadesse, M.A.; Shiferaw, B.A.; Erenstein, O. Weather Index Insurance for Managing Drought Risk in Smallholder Agriculture: Lessons and Policy Implications for Sub-Saharan Africa. Agric. food Econ. 2015, 3, 26. [Google Scholar] [CrossRef] [Green Version]
  33. Clement, K.Y.; Botzen, W.J.W.; Brouwer, R.; Aerts, J.C.J.H. A Global Review of the Impact of Basis Risk on the Functioning of and Demand for Index Insurance. Int. J. Disaster Risk Reduct. 2018, 28, 845–853. [Google Scholar] [CrossRef]
  34. Yan, L.; Roy, D.P.; Li, Z.; Zhang, H.K.; Huang, H. Sentinel-2A Multi-Temporal Misregistration Characterization and an Orbit-Based Sub-Pixel Registration Methodology. Remote Sens. Environ. 2018, 215, 495–506. [Google Scholar] [CrossRef]
  35. Lobell, D.B.; Azzari, G.; Burke, M.; Gourlay, S.; Jin, Z.; Kilic, T.; Murray, S. Eyes in the Sky, Boots on the Ground Assessing Satellite- and Ground-Based Approaches to Crop Yield Measurement and Analysis in Uganda. Available online: https://documents.worldbank.org/en/publication/documents-reports/documentdetail/556261522069698373/eyes-in-the-sky-boots-on-the-ground-assessing-satellite-and-ground-based-approaches-to-crop-yield-measurement-and-analysis-in-uganda (accessed on 15 June 2020).
Figure 1. Drivers, models and indicators that result in business metrics that can measure the impact of investment in SDG2 goal attainment (shown in red boxes).
Sustainability 13 05967 g001
Figure 2. Example of an operational maize cultivated area map in Zambia created by 6th Grain from Sentinel 2a/b and crop identification models (see at http://zambia.cropmap.6grain.com/Database, accessed on 21 March 2021).
Sustainability 13 05967 g002
Figure 3. Image on left shows the ‘follow me’ function, introduced by 6th Grain in its FieldFocus Light application, which enables users to walk around their fields to digitize the area. On right, three digitized outlines near Kimbimbi, Kenya of the field showing a difference of less than 2 m of the centroids of the three fields. A full-scale validation of the area and centroids of the data captured in this way is forthcoming. Author provided images.
Sustainability 13 05967 g003
Publisher’s Note: MDPI stays neutral with regard to jurisdictional claims in published maps and institutional affiliations.

