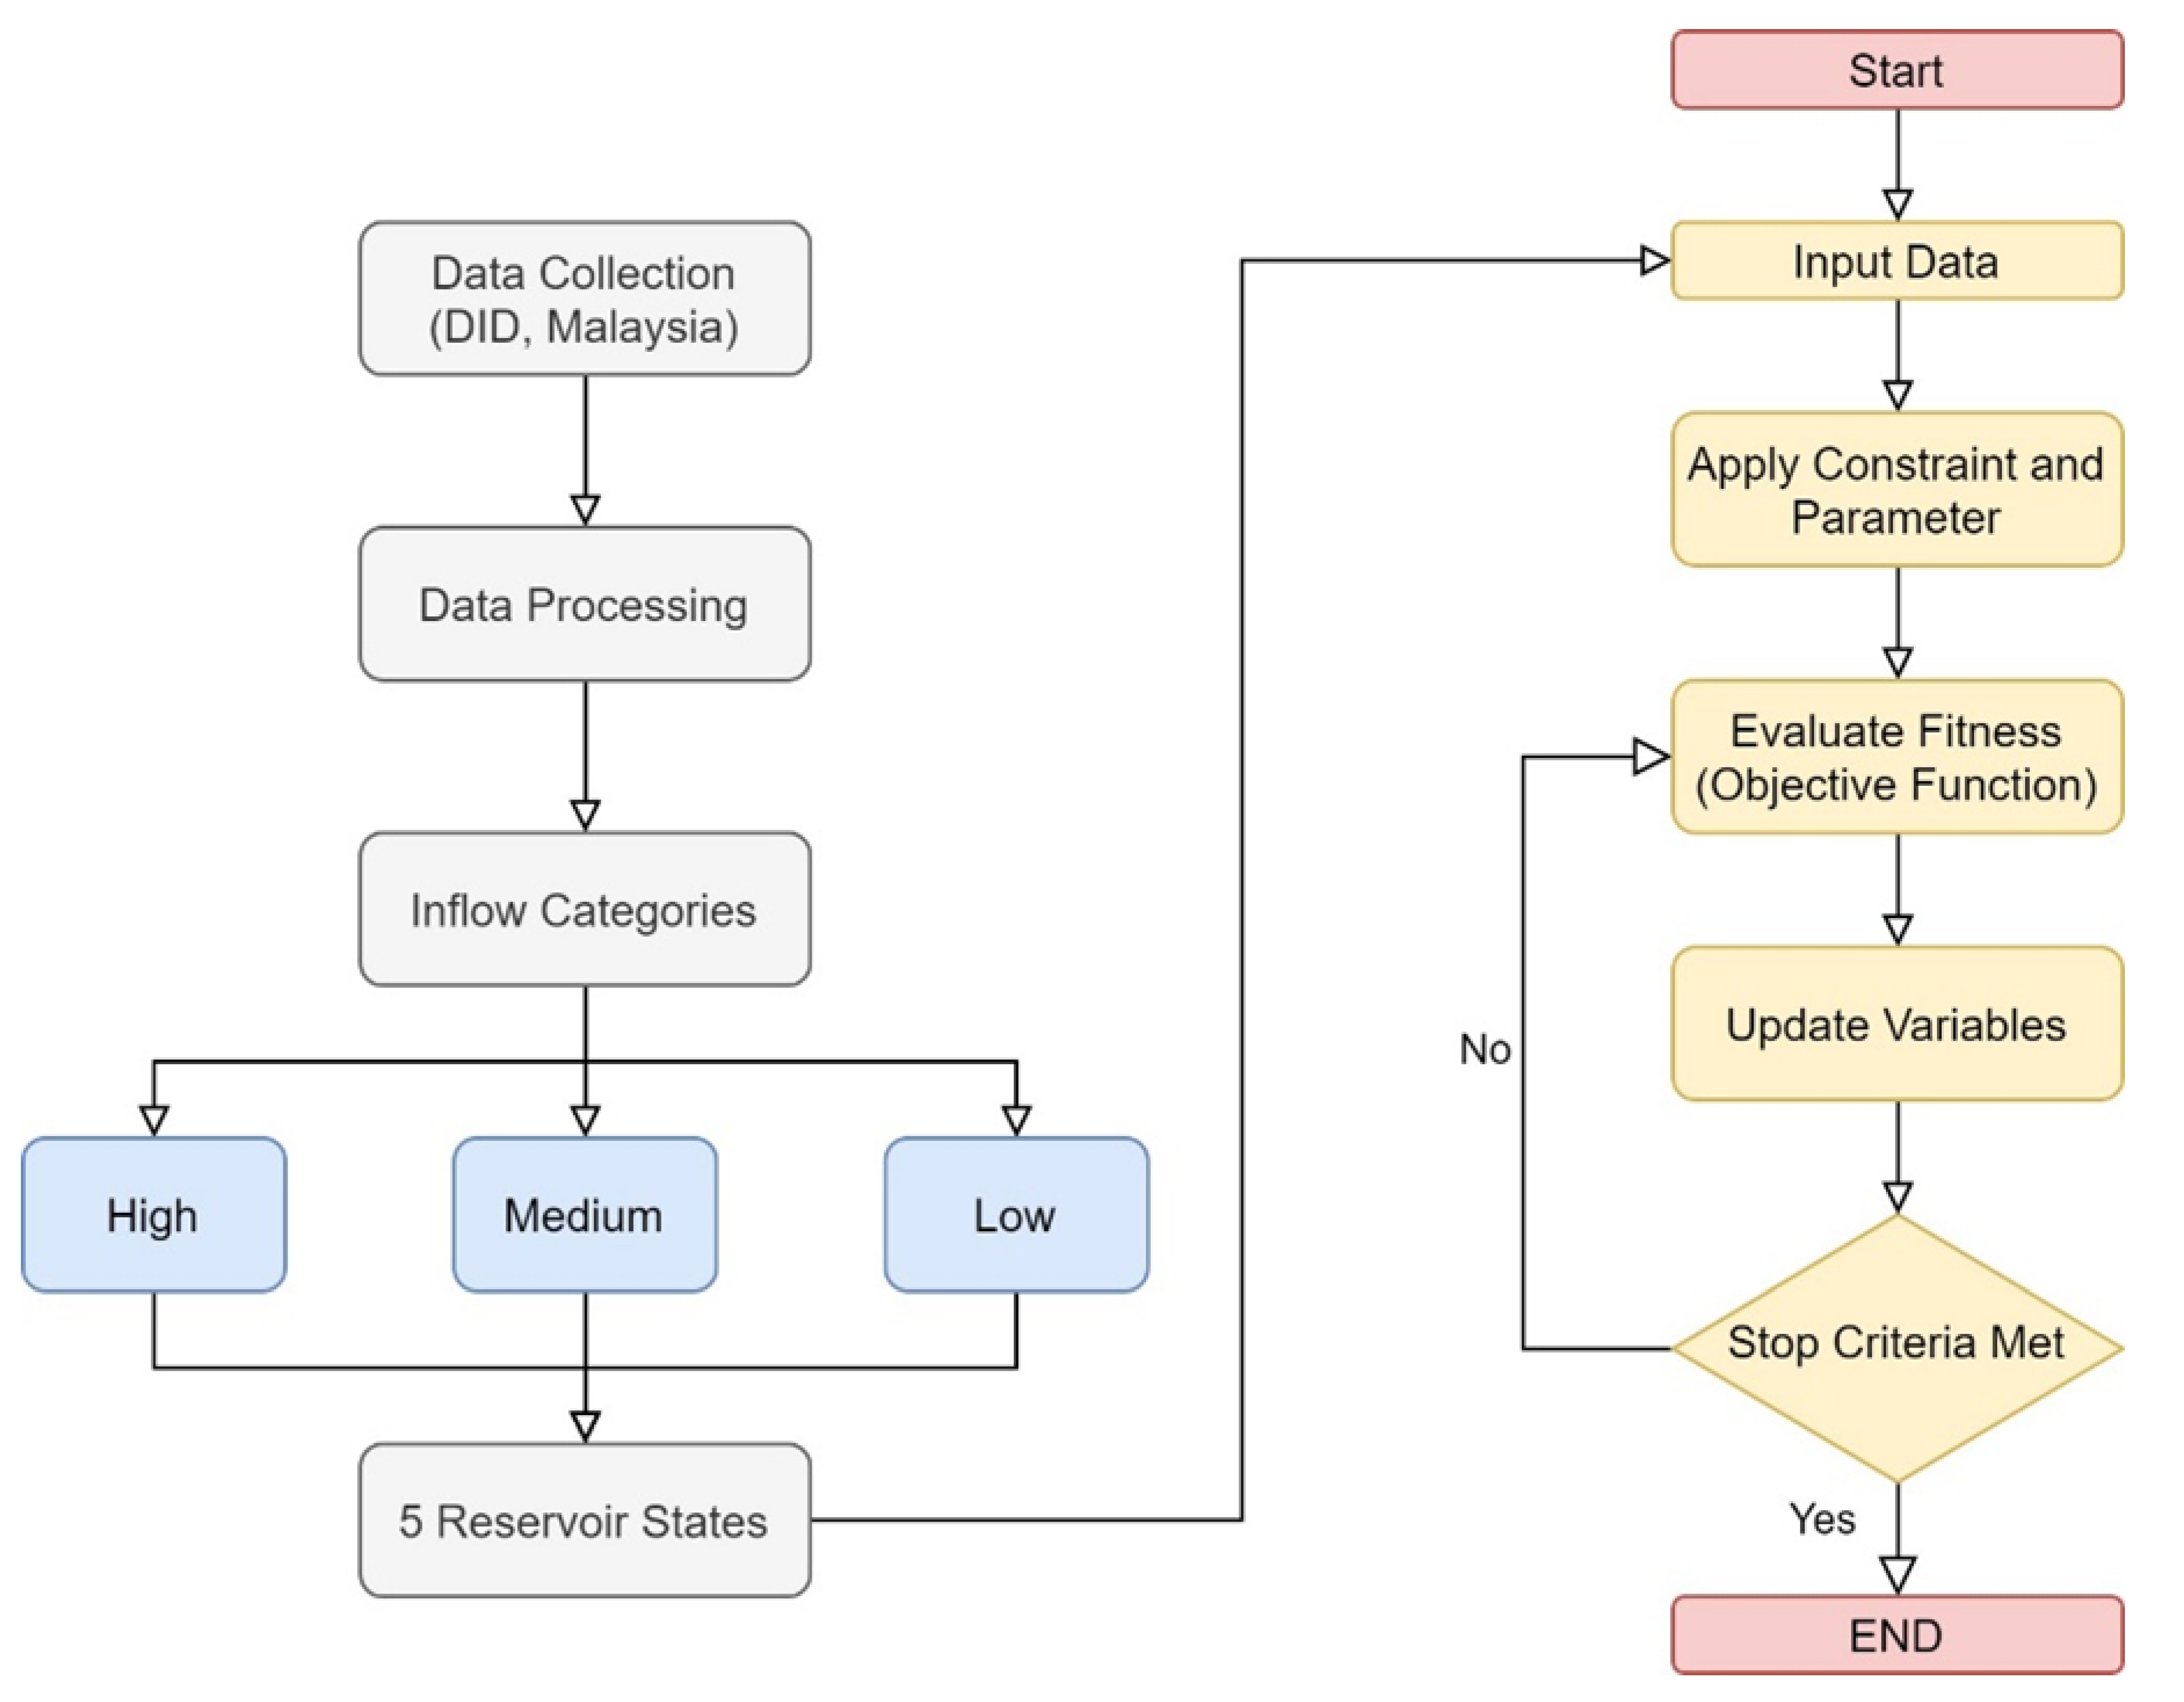
Article

Optimizing the Operation Release Policy Using Charged System Search Algorithm: A Case Study of Klang Gates Dam, Malaysia

1
Civil Engineering Department, College of Engineering, Komar University of Science and Technology, Sulaimany 46001, Kurdistan Region, Iraq
2
Institute of Energy Infrastructure (IEI), Universiti Tenaga Nasional (UNITEN), Kajang 43000, Malaysia
3
School of Energy, Geoscience, Infrastructure, and Society, Heriot-Watt University, Putrajaya 62200, Malaysia
4
Civil and Environmental Engineering Department, College of Engineering, United Arab Emirates University, Al Ain P.O. Box 15551, United Arab Emirates
5
National Water and Energy Center, United Arab Emirates University, Al Ain P.O. Box 15551, United Arab Emirates
6
Department of Civil Engineering, Faculty of Engineering, University of Malaya, Kuala Lumpur 50603, Malaysia
*
Author to whom correspondence should be addressed.
Sustainability 2021, 13(11), 5900; https://doi.org/10.3390/su13115900
Submission received: 12 April 2021 / Revised: 14 May 2021 / Accepted: 18 May 2021 / Published: 24 May 2021
(This article belongs to the Special Issue Urban Water Metabolism and Water-Energy-Pollution Nexus)

Abstract

:
In planning and managing water resources, the implementation of optimization techniques in the operation of reservoirs has become an important focus. An optimal reservoir operating policy should take into consideration the uncertainty associated with uncontrolled reservoir inflows. The charged system search (CSS) algorithm model is developed in the present study to achieve optimum operating policy for the current reservoir. The aim of the model is to minimize the cost of system performance, which is the sum of square deviations from the distinction between the release of the target and the actual demand. The decision variable is the release of a reservoir with an initial volume of storage, reservoir inflow, and final volume of storage for a given period. Historical rainfall data is used to approximate the inflow volume. The charged system search (CSS) is developed by utilizing a spreadsheet model to simulate and perform optimization. The model gives the steady-state probabilities of reservoir storage as output. The model is applied to the reservoir of Klang Gates for the development of an optimal reservoir operating policy. The steady-state optimal operating system is used in this model.

1. Introduction

Dams are classified according to construction type and materials, such as gravity, arch, buttress, and embankment. The first three are usually of concrete construction. For stability, a gravity dam relies on its weight and is generally straight in plane, although often slightly curved. Arch dams transmit most of the water’s horizontal thrust behind them through arch action to the abutments and have thinner cross-sections than comparable gravity dams. The simplest of the many types of support dams is the slab form, which consists of sloping concrete slabs backed by buttresses at intervals. Embankment dams are built of soil and/or rock with vertical control provision using an impermeable core or upstream cover. A single structure may include more than one type of dam [1,2,3].
Dams are among the main components of water supply networks. Water managed by and stored in dams is essential in many places to meet the development goals of water supply, agriculture (i.e., irrigation and livestock), manufacturing, energy production, and other sectors [4]. Dams are a dividing barrier to waters. Dams typically serve the primary function of water control, whereas other systems such as floodgates, levees, and dikes are used to prevent water from flowing into different regions of the country [5,6,7,8,9,10,11].
Greater desire for flood control and water supply follows rapid economic and population growth in Malaysia. Additionally, the flow requirements for wildlife protection, fish, and the preservation of freshwater flows into the reservoir have gained attention recently. Moreover, the state’s climate is characterized by intense floods; therefore, the highly variable streamflow is controlled and utilized by reservoirs. However, building an additional new reservoir project is now much more complicated than in the past. Therefore, the optimization of the beneficial usage of current reservoirs is becoming more relevant [12,13,14].
Until construction, reservoirs’ storage capacity and operating policies are commonly established and remain unchanged afterward. Nevertheless, the operation of existing reservoirs is influenced by new reservoirs and other similar forms, such as conveyance systems and flood control levees. The objectives of public interests and various factors influencing the productivity of reservoirs change dramatically over time. The increasing need to make the limited storage capacity as effective as possible warrants periodic re-evaluations of operating policies. Technological developments in hydrological data collection, streamflow prediction, system modeling, and interpretation give opportunities to optimize operational procedures [15,16].
The optimal operation of multireservoir and multipurpose reservoirs has attracted growing attention among water management planners over the last three decades. Various mathematical techniques have been developed and implemented, with long-term goals and real-time operation of these reservoirs [17]. In general, the proper functioning of the reservoir is not a simple task due to the high uncertainty involved in hydrology and the contradictions between its uses. Such conflicts can arise, for instance, between conservation purposes and flood control or conservation purposes themselves. In addition, they may occur in the same beneficial use, such as the distribution of water storage. Therefore, the operating cycle of the reservoir should be seen as a complex stochastic control problem [18].
One of the earlier methods used by Christensen and Soliman [19] was integrating the multi-reservoir hydro-plant into a single complex equivalent reservoir and solution by SDP. They stated that such a depiction of the reservoir could not take all local reservoir material constraints, water flows, and hydro-plant generation into account. For systems where reservoirs and inflow characteristics are ‘identical’ enough to justify integration into a hydro-plant model and single reservoir only, this method can be used satisfactorily.
A water supply, irrigation, or hydroelectric project that draws water directly from a stream may not meet its consumers’ demands during low flows. This stream, which can hold little to no water during portions of the year, frequently becomes a raging river after heavy rains and a threat to all activities along its banks. Storage or a reservoir can retain this excess water for use during periods of drought from high flow periods. Aside from conserving water for later use, floodwater storage can also reduce flood damage under the reservoir. Whatever the size of the reservoir or the ultimate usage of water, a reservoir’s primary purpose is to regulate water flow, either by controlling a varying supply in a natural stream or by fulfilling a variable demand from the users. Since the reservoir’s primary function is to provide water, storage capacity is its most important physical characteristic. The efficiency of a standard-shape reservoir can be determined with the formulae for substantial volumes. Topographic surveys usually determine the reservoir’s capacity at natural sites [20].
The usual level of the pool is the average depth to which the surface of the reservoir rises under ordinary operating conditions. The spillway crest level or the top of the spillway gates is determined for most reservoirs as a normal lake. The minimum level of the pool is the lowest elevation. The pool level should be controlled under the normal conditions. This degree may be determined by raising the lowest outlet in the dam or, in the case of hydroelectric reservoirs, by the operating conditions for the turbines. Storage between the minimum levels and normal levels of the pool is called useful storage. Dead storage is water that is kept below the minimum depth of the tank. According to the operating plan adopted for multipurpose reservoirs, the usable storage can be subdivided into conservation storage and flood control storage [19].
The operation of reservoirs is an important factor for the planning and management of water supplies [21]. It consists of several control variables that specify the operational strategies to direct a sequence of releases to satisfy many stakeholders’ demands with specific objectives, such as flood management, hydropower generation, and water distribution to different users. Conflicting and unequal goals are also a significant problem in the operation of reservoirs. Therefore, optimizing reservoir operation is vital in determining balanced solutions between the competing objectives [22].
Various optimization techniques have been used to optimize the policy of water release [23]. Metaheuristic techniques proved to be more reliable for dam operation [24,25]. However, some of the developed optimization algorithms have some limitations, such as a low rate of converging, and require extensive parameters for isolating and preventing problems [26]. Hence, there is a need to investigate reliable optimization techniques, overcoming the drawbacks of other optimization techniques, to ensure no overdraw from dams occurs and improve flood control planning and design requirements for the respective basins; optimizing operation release management strategies for dams must be achieved to resolve the issue.
Therefore, the primary purpose of this study is to examine the robustness of a charged system search (CSS) optimization model to obtain an optimal operating strategy for a reservoir located in Malaysia, aiming at minimizing the water deficit and mitigating the risk of flooding.

2. Material & Methods

2.1. Study Area and Data Acquisition

The Klang Gates Dam was designed to supply 168 million liters of raw water per day since 1959 to the Bukit Nanas treatment plant only. However, a treatment plant was built in Wangsa Maju during the 1998 water crisis, drawing 45 million liters of water per day from the same dam. This overdrawing has resulted in the dam drying up fast. Rather than blaming the environment, the authorities should carry out a thorough analysis of dams’ safe yields and ensure that water is not overdrawn from these dams beyond the revised safe yields [27].
Malaysia also has an equatorial climate, with consistently high temperatures and high relative humidity. For Peninsular Malaysia, the average annual rainfall is 2420 mm. Flood reports suggest that flood events are a seasonal phenomenon. These storms produce short but hefty rainfall, which overloads drainage systems heavily and causes localized flooding. For example, devastating flooding occurred in the Federal Capital of Kuala Lumpur in 1971, the worst flooding event in Malaysia in recent times. The Klang Gates Dam is an example of a dam built to supply water and as a flood mitigation dam [28]. Figure 1 shows the Klang Gates Dam and Klang River location, and Table 1 represents the physical characteristic of the Klang Gates Dam.
The data are collected from the Department of Drainage and Irrigation (DID) located in Kuala Lumpur, Malaysia. The data include rainfall data and the dam level record for the past 21 years 1987 to 2007 and storage data for the year 2002. The collected data were the following:
i.
History, profile, and introduction of Klang Dam;
ii.
Data on the water demand/supply of Klang Dam;
iii.
Data on the inflow of Klang Gates Dam;
iv.
Data on the outflow of Klang Gates Dam;
v.
Soil moisture in the irrigated area.
The inflow volume of the Klang Gates reservoir is calculated as the following equation.
I n f l o w = 0.5 × R a i n f a l l × C a t c h m e n t   A r e a   o f   R e s e r v o i r  
Rainfall in the catchment area does not necessarily go into the reservoir. In this case, it is considered that 50% of rainfall goes into the reservoir and catchment area of the reservoir (74.46 km2). Based on the historical rainfall data from the year 1897 to the year 2007, the volume of inflows per month is shown in Figure 2.
Losses of the reservoir depend entirely on the reservoir volume of inflow. The higher the value of the inflow, the more loss will be caused by the leak of groundwater of the dam or by evaporation. Positive values for the loss mean that the leak of groundwater is more than the evaporation, and vice versa for a negative value for the loss. From these data, the value of loss can be found by referring to the range of the inflow volume of the reservoir, as shown in Table 2.
From the 21-year data observed (1987 to 2007), the initial storage volumes were discrete in five states per month. By having the minimum storage, Smin, and the maximum storage, Smax of the reservoir, get the difference between these two storages and divide it into an N-1 interval with N is the state option. Therefore, the storage discretization is solved. The discrete values are used as target storage in the analysis of the simulation and optimization model (Table 3).
In this study, the average of past eleven years of release data from 1897 to 2007 was considered the demand of the reservoir (Table 4).

2.2. Optimization Model

2.2.1. Charged System Search (CSS)

The charged system search is developed following the laws governing electrostatics in motion and Newtonian physics mechanics, as explained by Kaveh and Talatahari [30]. Charged particles (CPs) are various solution candidates or agents used in the CSS, and every CP is known to be a charged sphere. Under Coulomb and Gauss’s electrostatics law, the charged sphere can apply electric forces on other charged particles, as explained by Precup et al. [31].
The law of Newton is then used in calculating the value of acceleration influenced by force reacting on each CP. Finally, using Newtonian mechanics, each CP’s position at any time can be determined by its previous acceleration, velocity, and position in the quest space [30]. Every CP can be regarded as a radius-a charged sphere, having a uniform volume of load density (qi) equivalent to:
q i = f i t   ( i ) f i t w o r s t f i t b e s t f i t w o r s t   ,     i = 1 ,   2 ,   ,   N
N is the total number of CPs, fit (i) is particle i’s fitness, and fit worst and fit best are the worst and best fitness values of all particles. The CPs’ initial position is allocated randomly within limits determined by the problem in the search space. Zero is taken as initial CP velocity.
In the quest space, the CPs are distributed, and electrical forces can be placed on others. In or outside of the area, the strength of the CP force is calculated differently. The electrical force produced is defined by the CP within or beyond the sphere:
F i = q i   i ,   i j (   q i a 3 r i j i 1 + q i r i j 2 i 2 ) p i j ( X i X j )   j = 1 ,   2 ,   ,   N i 1 = 1 ,   i 2 = 0 r i j < a                   i 1 = 0 , i 2 = 1 r i j a
where Fj is the resulting jth CP force. Rij is the degree to which the two particles are separated:
r i j = X i X j X i + X j 2 X b e s t + ε
where Xi and Xj are the Ith and Jth CP co-ordinates and where Xbest is the best existing CP location. The pij calculates the probability that every CP will enter the other as follows:
p i j = { 1 f i t ( i ) f i t b e s t f i t ( j ) f i t   ( i ) > r a n d o r   f i t ( i ) > f i t ( i ) 0 o t h e r w i s e
In Equation (3), the sphere’s force on a CP is proportional to the distance between particles. However, the separation distance for CPs outside the sphere is inversely proportional to the cube. Based on the output powers and the legislation on motion, the new positions of the CPs are defined. At the present point, each CP travels to its new location according to the resulting forces and its previous speed:
X j , n e w = r a n d j , 1 · k a · F j m j · t 2 + r a n d j 2 · k v · V j , o l d · t + X j , o l d
V j , n e w = X j , n e w X j , o l d t
where randj2 and randj1 are two random numbers uniformly distributed (0,1). mj here is the CP jth mass, which resembles qj. The time phase is Dt and unification is to be established. Ka is the acceleration coefficient; kv is the velocity coefficient that governs the preceding speed effect, which can be held constant or differ in the following steps:
k a = α × ( 1 + i t e r i t e r m a x ) , k v = β × ( 1 i t e r i t e r m a x )
where the itermax is the number of iters set for the algorithm to be run, and the iter is the number of iterations currently performed. kv decreases linearly to zero, while ka rises to 2α as the number of iterations increases, retaining the balance between discovery and convergence [30]. Equation (8) parameters can be modified, and these parameters are defined to decide the coefficients of acceleration and speed (ka and kv). The value of 0.5 was indicated for both parameters α and β in the CSS algorithm’s reference text by Kaveh and Talatahari [30]. Substituting Equation (8), Equations (6) and (7) for ka and kv can be rewritten as:
X j , n e w = α × r a n d j 1 · ( 1 + i t e r i t e r m a x ) · i , i j ( q t a 3 r i j i 1 + q t r t j 2 i 2 ) p i j ( X i X j )   + β × r a n d j 2 · ( 1 i t e r i t e r m a x ) · V j , o l d + X j , o l d
V j , n e w = X j , n e w X j , o l d
A memory, called charged memory (CM), is often recommended to store the best output. As a CP leaves the search field, its positioning is probabilistically corrected by the harmonic search-based handling mechanism by generating or selecting a new value from the CM. It should be highly advised that the primary referencing be referred to in paper [30] so that the CSS algorithm’s concepts and functions are better defined.
The current location for each CP is determined after an iteration is finished just before the new iteration starts. Ignoring this assumption, Kaveh and Talatahari [30] suggested the enhanced CSS algorithm, in which all updating processes are conducted after evaluating each CP. The new location of each agent will influence the related CP’s travel process, using this updating method in the CSS algorithm, while no new positions will be used in standard CSS before the iteration is complete. This modified algorithm improves the algorithm’s performance by automatically using the data gathered by the CPs, although it does not require additional computation time relative to the original CSS. However, the original CSS retains information obtained by the agents for a pre-determined time, which results in a break in the optimization process as the information about each agent’s current position is included in the improved CSS algorithm during the next search, which enhances the optimization potential of the algorithm and increases convergence speeds [32].

2.2.2. Water Supply Optimization Model

The aim is to collect reservoir releases for the given inflow duration so that a pre-defined pattern of requirements is met in a reservoir water supply operation. This ensures that the released flow must meet the demand level as quickly as possible and that surplus supplies from the reservoirs must be minimized. Therefore, the mathematically defined optimum activity of the water reservoir is as follows [23]:
M i n i m i z e   F =   t = 1 N T ( D ( t ) R ( t ) D m a x ) 2
Subject to equations of continuity at each stage:
S ( t + 1 ) = S ( t ) + I ( t ) R ( t ) L o s s ( t )
S m i n S ( t ) S m a x  
R m i n R ( t ) R m a x  
Loss ( t ) = E v ( t ) × A ( t ) 1000  
A ( t ) = x 0 + x 1 × S ( t ) + x 2 × s ( t ) 2 + x 3 × S ( t ) 3  
where R(t) (reservoir release in MG), D(t) (demand in MG) for time, I(t) (inflow), and S(t) (storage). Loss(t) is the cumulative loss and gain of a reservoir in time step t of the evaporation and precipitation. During t, time phase, Ev(t) is the height of evaporation, and the constant values x0, x1, x2, and x3. Loss(t) in cases where the loss of evaporation is not taken into account in Equation (12) is omitted from the equation.

2.3. Reliability and Risk Analysis

2.3.1. Root Mean Square Error (RMSE)

RMSE is used to find the nearest release curve to demand for all types of the inflow. RMSE can be expressed as Equation (17).
RMSE   = m e a n ( ( R i D i ) 2 )
where, i is the state of storage, R is the release at storage i, and D is demand at storage i.

2.3.2. Reliability (Rv and Rp)

For a reservoir optimization process, the most crucial index for checking the model’s performance to meet the goals is reliability. For this cause, the water scarcity level was determined. The concept of volumetric (Rv) and periodic (Rp) reliability from [33] is incorporated into Equations (18) and (19). Reliability is the key index of the efficiency check of a model in order to meet the goals for a reservoir optimization model, as explained by Zio [34]. The level of water deficiency was assessed for this reason. The idea of stability of the volumetric (Rv) and periodic (Rp) from [29] is given as Equations (18) and (19).
R e l i a b i l i t y ,   R v = ( v / V )   ×   100 %
R p = ( n / N )   ×   100 %  
where v is water discharge volume (model output), V is the target demand volume and n is the total time for satisfying the desired demand (months), and N is the total time period (in months).

2.3.3. Resilience (Rs)

For a reservoir optimization process, the most crucial index for checking the model’s performance to meet the goals is reliability. For this cause, the water scarcity level was determined. Then it incorporated into Equations (18) and (19) as the concept of volumetric (Rv) and periodic (Rp) reliability [35].
R s = N S / N T
where NS is the amount of the (zero shortage) fulfilled time after the shortage and NT is the cumulative deficiency period.D. VULNERABILITY (V)
Vulnerability tests the severity of a reservoir structure model’s malfunction parameters. This is the highest likelihood of failure. According to Sandoval-Solis et al. [36], vulnerability (V) can be calculated as Equation (21) from any simulation data.
V = 1 m × t = 1 N [ max ( 0 , D t R t ) ]

2.3.4. Sustainability Index (SI)

The SI is suggested to measure the sustainability of water supply systems to promote the measurement and evaluation of water management policies [21]. The SI is a summary index that measures water resource systems’ sustainability [36]. Differentiating the various proposed water policies index can be implied to approximate water consumers’ sustainability and create an improvement in sustainability. The SI can be expressed as Equation (22).
S I = [ R p × R s × ( 1 V ) ] 1 3
where, Rp is the periodic reliability, Rs is the resilience, and V is the vulnerability.
The simulation was carried out for 12 months for 21 years of rainfall data, from 1987 to 2007. Figure 3 shows the simulation framework of the optimized approach for the operation of a reservoir release curve, from data collection to the end process of the model algorithm, charged system search (CSS).

3. Results and Discussion

3.1. Release Curves

The optimum release options for the different storage have been determined using the developed CSS algorithm as shown in 
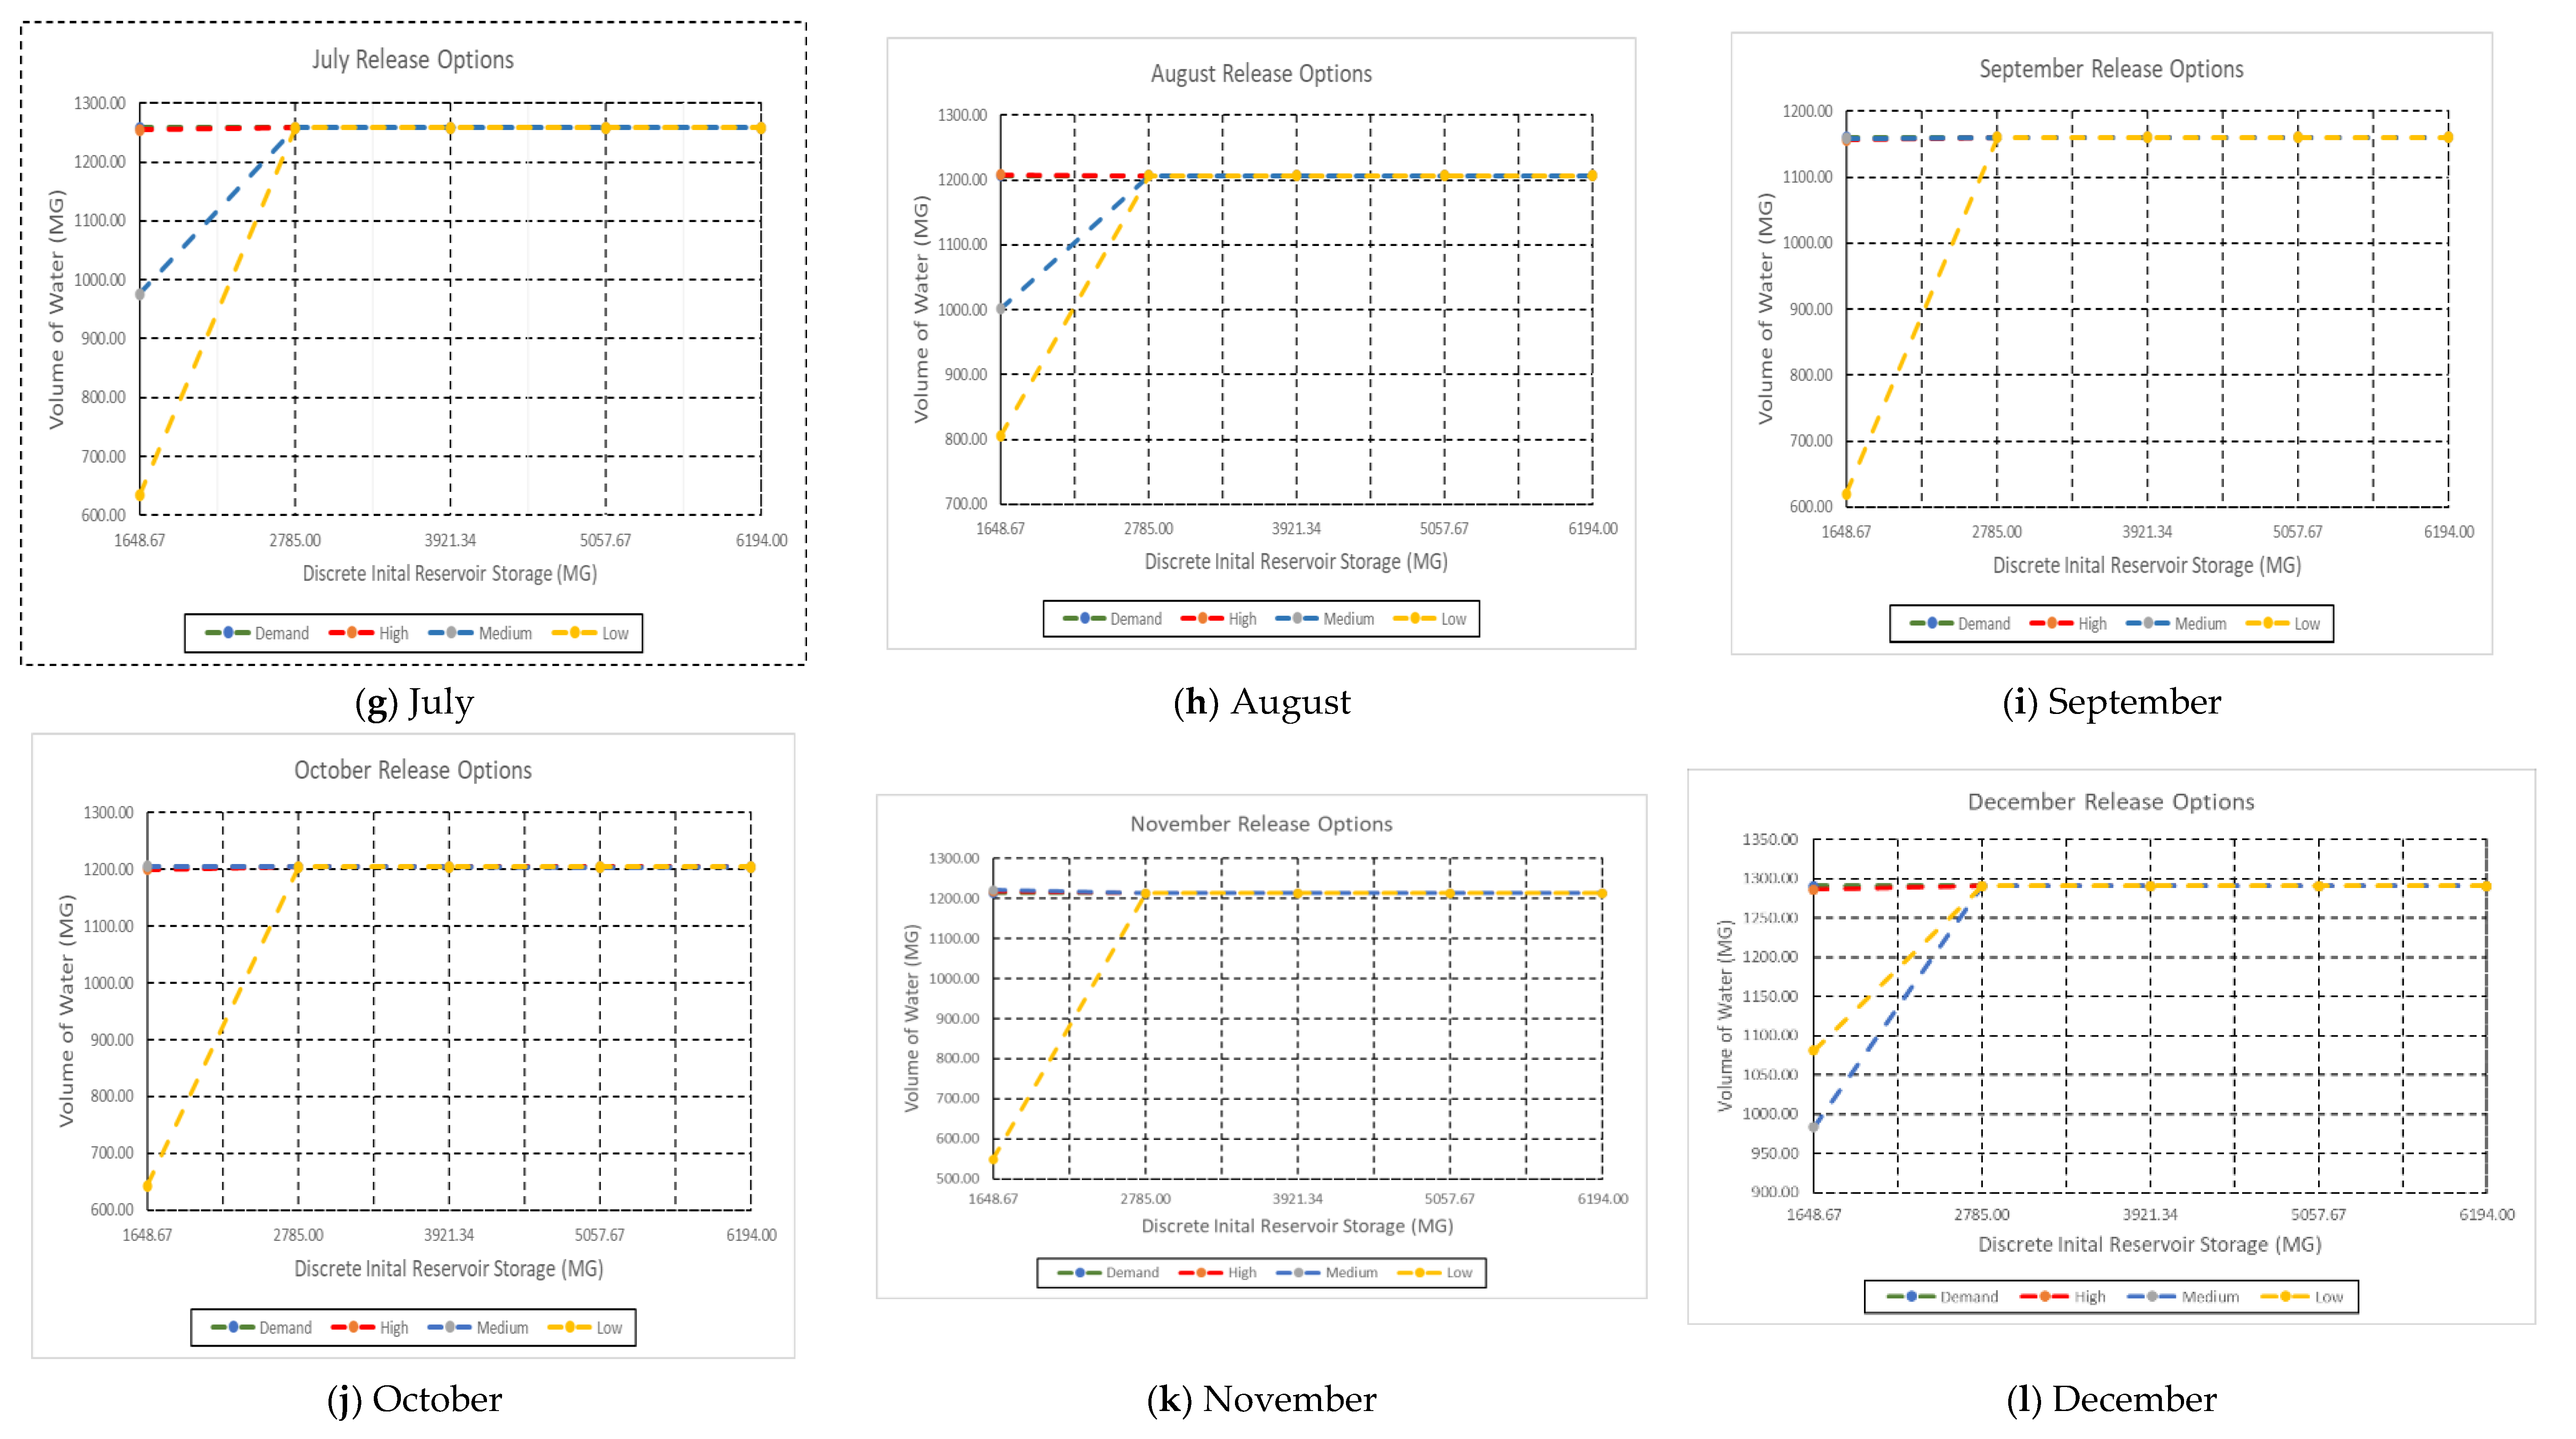
Figure 4 for each month of the year. The main aim is to develop a release curve depicting the best release policy based on the changes in the inflow. The policy is seen as the operating policy of the steady state. The optimum results in terms of reservoir storage volume and release are shown in the figures that aim to minimize the expected device output. The graphs plotted with the initial storage of reservoir versus the release per unit of demand for each month in different states are for a high, medium, and low state.
Figure 4a shows the optimal release policies for January. In the figure, the model failed to meet the demand during high, medium, and low inflow at a low storage level, 1648.67 MG. The demand is then met when the storage level is 2785 MG for all inflow categories. The release only failed to meet the demand at 1648.67 MG storage for all inflow categories for January. For February, the optimal release policies are shown in Figure 4b. The release only failed to meet the demand during the medium and low inflow at 1648.67 MG storage from the figure. The rest of the figure shows that the release managed to fulfill the demand needed.
Following the obtained results from Figure 4, it can be concluded that the developed optimization technique proposed a reliable decision to release water to meet the demand for the entire twelve months and during different inflow scenarios. However, during high and medium inflow, the proposed model exhibits high performance in optimizing the release of water to meet the demand downstream. With regards to low inflow, the optimized release policy did not always meet the demand, especially during the initial storage, which is naturally hard to supply water up to the demand level when there is low storage.
To validate the reliability of the proposed model, a comparison between the findings and the different optimization algorithms was carried out. Hossain and El-shafie [37] developed different optimization techniques using the same current study area. Therefore, the following section demonstrates the performance of the proposed SCC model with the findings from the published study by Hossain and El-shafie [37].
In order to compare the RMSE of the release curve between the model algorithms, an equation was used to denote the release policy error for all inflow groups. Errors are represented as a percentage of demand in Figure 5. The values of RMSE are taken to measure the mean error of the release curves in terms of demand. The mean error is defined in Equation (23).
R M S E a v g = t = 1 12 R M S E t t = 1 12 D e m a n d t × 100 %
Figure 5 shows the optimal operating policies from January to December. In this paper, the inflow is categorized into high, medium, and low inflow types. This inflow is obtained from average rainfall from the year 1987 to the year 2007. The inflow is measure using Equation (1) and calculated into monthly inflow for 12 months. For each inflow category, five different states of reservoir storage level are applied for this model algorithm. The model algorithm in this study is charged system search (CSS).
Overall, Figure 5 shows that the release only failed to meet the demand when the storage level was low, at 1648.47 MG. Some of the inflow in high and medium categories managed to fulfill the demand during low storage level; however, there are times when high and medium inflow could not meet the demand, especially for a low category. Other than that, the reservoir met the demand for the rest of the storage level for all inflow categories.
As a result, it indicates that the reservoir is able to fulfill the demand needed for all inflow categories at a storage level of 2785 MG within the reservoir constraints.
Figure 5 shows the error of the release policies for all inflow categories. The charged system search (CSS) algorithm has the lowest error in high inflow compared with ABC, PSO, real coded GA, and binary GA algorithms. For medium inflow, CSS has the highest error of release than other algorithms. The CSS algorithm has the third-lowest error rate, while the real coded GA and ABC algorithm has lower error rates than CSS. It can be seen that charged system search (CSS) is the most accurate model with the closest values to demand for high inflow and the less accurate model for medium inflow.

3.2. Reliability and Risk Analysis

The simulation results were examined from different points of view in order to perform risk analysis and model comparison. The following section provides information about the root mean square error (RMSE), reliability, resilience, and vulnerability of each optimized release policy according to the proposed model results compared with the other previously published models.
The calculated RMSE values for every month are obtained by using Equation (17) as shown in the methodology section. The RMSE values are calculated for three types of inflows: high, medium, and low for CSS, ABC, PSO, real coded GA, and binary GA.
The RMSE values for each of the optimizers for the three pre-defined inflows can be seen in Table 5. It can be seen that the lowest average RMSE value among all optimizers was found to be associated with the proposed CSS model during high inflow events. Such findings suggest that CSS can be more reliable in dealing with extreme events such as heavy rainfall events, which is very common in Malaysia. Is also can be concluded that the proposed algorithm outperformed all other models scientifically for the high inflow. However, overall, all the models have similar performances during the three different inflow classes combined, which is still acceptable.
Reliability indicates the frequency of a model’s success and failure, with regard to meeting the demands. In the case of the KGD, in 12 months, five storage states and three inflow types were considered as the total operational period. A total of 180 results (release amounts) were obtained from each optimization model. The periodic reliability was measured by using Equation (19).
The number of releases fulfilled the demand required for high, medium, and low inflow, which each consist of five states of storage. Overall, the reservoir can meet the demand of about 81.67% from 180 total releases in 12 months, as shown in Table 6. It can be seen from the obtained results that the proposed model for low inflow met the demand more than 80% and never exceeded the demand. For medium inflow, similar performance was achieved when the proposed model met more than 80% of the water demand downstream of the reservoir. Similar robust performance was achieved during the high inflow events. Such performance confirms the reliability of the proposed model for optimizing the release policy to achieve the demand without violating any defined constraints.
Finally, we gauged the robustness of the proposed model using a different set of measures. In this study, performance measurements were conducted to check the reliability, resiliency, sustainability, and vulnerability of the model algorithm, charged system search (CSS), for overall performance for KGD, as can be seen in Table 7. In terms of reliability, the proposed model exhibits a high-reliability percentage for the three different inflow scenarios, which ranges between 93.75% and 99.43%. In terms of resiliency, it can be seen that the proposed release policy from the CSS model is capable of recovering from failure during different inflow events. A low vulnerability indicator was found when the proposed model was used to optimize the release policy in this case study. Finally, in terms of how sustainable the proposed model is, a sustainability index measurement was calculated for the different defined inflow classes, which shows that the proposed model is reliable in dealing with any inflow changes that occur and can be used as sustainable tools for optimizing the release from the reservoir efficiently.
In summary, based on the release curves, reliability, and risk analysis, charged system search (CSS) proves to be applicable in optimizing the dam’s operation. Charged system search generates the operating rule in monitoring the reservoir’s release in order to meet the demand. The CSS algorithm resulted in lower error rates for release policies in high inflow than ABC, PSO, real coded GA, and binary GA algorithms. By using charged system search (CSS), about 81.67% of the demands are met in all inflow categories for 180 releases in 12 months. The reliability (Rv) and reliability (Rp) for the CSS algorithm are high, proving that the algorithm has high stability. Overall, the charged system search (CSS) algorithm is applicable in minimizing the release policy to obtain a minimum difference between target release and actual demand.
Therefore, it can be concluded that the charged system search (CSS) algorithm can be adopted as a reliable tool for operating the Klang Gates dam since it outperformed the previously developed algorithms. However, there is a need to investigate other optimization techniques that were recently developed by other researchers and exhibit promising results. For instance, the Jaya algorithm (JA) was recently proposed to optimize the operation policy of a hydropower reservoir [24]. They found that the JA technique outperformed other selected algorithms compared with searching for the best solution. In addition to that, recently, different advanced optimization techniques are proposed as robust techniques to be used in searching for the best solution in dealing with water resources issues [26]. For example, the waterdrop optimization technique [38], the whale optimization algorithm [39], the ant lion optimization algorithm [40], the nomadic people optimization algorithm [41], the Harris hawks optimization algorithm [42], and the grey wolf optimization technique [27]. Therefore, future work could be carried out to develop these recent optimization techniques and explore their performances in optimizing the release from the reservoir to meet the downstream demand.

4. Conclusions

This study investigated the efficiency of the charged system search (CSS) algorithm as an alternative tool to optimize the reservoir operation policy in order to minimize the deficit of water at Klang Gates dam. The robustness of the proposed algorithm is validated and compared with four different optimization algorithms. The study’s findings reveal that the CSS algorithm is more accurate in simulating the release policy and outperformed other algorithms in terms of reliability, resistance, and sustainability. Moreover, the results reveal that the CSS algorithm is much faster in approaching the optimal state and less complicated compared with other algorithms. In addition, the proposed algorithm exhibits a high level of reliability in minimizing the deficit, especially during low flow season. However, future work is needed to explore the reliability of more advanced optimization algorithms, such as hybrid optimization techniques. In addition to that, more recent data could be included to validate the robustness of these models, and the impact of future climate changes and extreme weather events such as floods and droughts need to be considered.

Author Contributions

Data curation, M.S.H. and A.N.A.; formal analysis, S.M. and S.D.L.; methodology, M.S., A.S.; writing—original draft, A.E.-S., S.D.L., M.S.H. and A.N.A.; writing—review & editing, M.S., A.S.; funding: A.S.; supervision: A.N.A. and A.E.-S. All authors have read and agreed to the published version of the manuscript.

Funding

This research received no external funding.

Institutional Review Board Statement

Not applicable.

Informed Consent Statement

Not applicable.

Data Availability Statement

Not applicable.

Acknowledgments

The authors would like to thank the Department of Irrigation and Drainage (DID) for providing us with the data.

Conflicts of Interest

The authors declare no conflict of interest.

Abbreviation

CSSCharged System Search
CPCharged Particle
CMCharged Memory
ABCArtificial Bee Colony
GAGenetic Algorithm
PSOParticle Swarm Optimization

References

  1. Jia, J.; Lino, M.; Jin, F.; Zheng, C. The Cemented Material Dam: A New, Environmentally Friendly Type of Dam. Engineering 2016, 2, 490–497. [Google Scholar] [CrossRef]
  2. Alvanchi, A.; Bajalan, Z.; Iravani, P. Emission assessment of alternative dam structure types, a novel approach to consider in new dam projects. Constr. Innov. 2020, 21, 203–217. [Google Scholar] [CrossRef]
  3. Zhang, S.; Pang, B.; Zhang, Z. Carbon footprint analysis of two different types of hydropower schemes: Comparing earth-rockfill dams and concrete gravity dams using hybrid life cycle assessment. J. Clean. Prod. 2015, 103, 854–862. [Google Scholar] [CrossRef]
  4. McCartney, M.P. Decision Support Systems for Large Dam Planning and Operation in Africa; IWMI Working Papers, H040225; International Water Management Institute: Cairo, Egypt, 2007. [Google Scholar]
  5. Kibret, S.; Ryder, D.; Wilson, G.G.; Kumar, L. Modeling reservoir management for malaria control in Ethiopia. Sci. Rep. 2019, 9, 1–11. [Google Scholar] [CrossRef] [Green Version]
  6. Abadía, B.D.; Boelens, R.; Du Pré, L. Mobilizing Water Actors and Bodies of Knowledge. The Multi-Scalar Movement against the Río Grande Dam in Málaga, Spain. Water 2019, 11, 410. [Google Scholar] [CrossRef] [Green Version]
  7. Shuai, P.; Chen, X.; Song, X.; Hammond, G.E.; Zachara, J.; Royer, P.; Ren, H.; Perkins, W.A.; Richmond, M.C.; Huang, M. Dam Operations and Subsurface Hydrogeology Control Dynamics of Hydrologic Exchange Flows in a Regulated River Reach. Water Resour. Res. 2019, 55, 2593–2612. [Google Scholar] [CrossRef] [Green Version]
  8. Fraser, G.C.G.; Hill, M.; Martin, J.A. Economic evaluation of water loss saving due to the biological control of water hyacinth at New Year’s Dam, Eastern Cape province, South Africa. Afr. J. Aquat. Sci. 2016, 41, 227–234. [Google Scholar] [CrossRef]
  9. Abdulgaffar Doddamani, A.D. Automated Gallery Lighting System and Seepage Water Control in Dam. Int. J. Electr. Electron. Eng. Res. 2018, 8, 1–10. [Google Scholar] [CrossRef]
  10. Jackson, L.M.; Parbhakar-Fox, A. Mineralogical and geochemical characterization of the Old Tailings Dam, Australia: Evaluating the effectiveness of a water cover for long-term AMD control. Appl. Geochem. 2016, 68, 64–78. [Google Scholar] [CrossRef]
  11. Degtyareva, O.; Degtyarev, G.; Togo, I.; Terleev, V.; Nikonorov, A.; Volkov, Y. Analysis of Stress-strain State Rainfall Runoff Control System—Buttress Dam. Procedia Eng. 2016, 165, 1619–1628. [Google Scholar] [CrossRef]
  12. Karami, H.; Farzin, S.; Jahangiri, A.; Ehteram, M.; Kisi, O.; El-Shafie, A. Multi-Reservoir System Optimization Based on Hybrid Gravitational Algorithm to Minimize Water-Supply Deficiencies. Water Resour. Manag. 2019, 33, 2741–2760. [Google Scholar] [CrossRef]
  13. Tukimat, N.N.A.; Harun, S. Comparison performances of the optimisation models for the multi-objectives reservoir. Int. J. Environ. Eng. 2020, 10, 198–208. [Google Scholar] [CrossRef]
  14. Tayebiyan, A.; Mohammad, T.A.; Al-Ansari, N.; Malakootian, M. Comparison of Optimal Hedging Policies for Hydropower Reservoir System Operation. Water 2019, 11, 121. [Google Scholar] [CrossRef] [Green Version]
  15. Chang, J.; Guo, A.; Wang, Y.; Ha, Y.; Zhang, R.; Xue, L.; Tu, Z. Reservoir Operations to Mitigate Drought Effects with a Hedging Policy Triggered by the Drought Prevention Limiting Water Level. Water Resour. Res. 2019, 55, 904–922. [Google Scholar] [CrossRef]
  16. Fayaed, S.S.; Fiyadh, S.S.; Khai, W.J.; Ahmed, A.N.; Afan, H.A.; Ibrahim, R.K.; Fai, C.M.; Koting, S.; Mohd, N.S.; Jaafar, W.Z.B.; et al. Improving Dam and Reservoir Operation Rules Using Stochastic Dynamic Programming and Artificial Neural Network Integration Model. Sustainability 2019, 11, 5367. [Google Scholar] [CrossRef] [Green Version]
  17. Moradkhani, H.; Abbass, A. Optimum Storage Reallocation and Gate operation in Multipurpose Reservoirs. In North American Water and Environment Congress & Destructive Water; American Society of Civil Engineers: Reston, VA, USA, 2002. [Google Scholar]
  18. Mohammadi, M.; Farzin, S.; Mousavi, S.-F.; Karami, H. Investigation of a New Hybrid Optimization Algorithm Performance in the Optimal Operation of Multi-Reservoir Benchmark Systems. Water Resour. Manag. 2019, 33, 4767–4782. [Google Scholar] [CrossRef]
  19. Christensen, G.S.; Soliman, S.A. Optimal Long-Term Operation of Electric Power Systems. In Mathematical Concepts and Methods in Science and Engineering; Springer Nature Switzerland AG: Cham, Switzerland, 1988. [Google Scholar]
  20. Sapitang, M.; Ridwan, W.M.; Kushiar, K.F.; Ahmed, A.N.; El-Shafie, A. Machine Learning Application in Reservoir Water Level Forecasting for Sustainable Hydropower Generation Strategy. Sustainability 2020, 12, 6121. [Google Scholar] [CrossRef]
  21. Latif, S.D.; Ahmed, A.N.; Sherif, M.; Sefelnasr, A.; El-Shafie, A. Reservoir water balance simulation model utilizing machine learning algorithm. Alex. Eng. J. 2021, 60, 1365–1378. [Google Scholar] [CrossRef]
  22. Ngo, L.I. Optimising Reservoir Operation: A Case Study of the Hoa Binh Reservoir, Vietnam; DTUEnvironment: Lyngby, Denmark, 2007. [Google Scholar]
  23. Chong, K.L.; Lai, S.H.; Ahmed, A.N.; Zaafar, W.Z.W.; Rao, R.V.; Sherif, M.; Sefelnasr, A.; El-Shafie, A. Review on Dam and Reservoir Optimal Operation for Irrigation and Hydropower Energy Generation Utilizing Meta-Heuristic Algorithms. IEEE Access 2021, 9, 19488–19505. [Google Scholar] [CrossRef]
  24. Chong, K.L.; Lai, S.H.; Ahmed, A.N.; Jaafar, W.Z.W.; El-Shafie, A. Optimization of hydropower reservoir operation based on hedging policy using Jaya algorithm. Appl. Soft Comput. 2021, 106, 107325. [Google Scholar] [CrossRef]
  25. Yaseen, Z.M.; Allawi, M.F.; Karami, H.; Ehteram, M.; Farzin, S.; Ahmed, A.N.; Koting, S.B.; Mohd, N.; Jaafar, W.Z.B.; Afan, H.A.; et al. A hybrid bat–swarm algorithm for optimizing dam and reservoir operation. Neural Comput. Appl. 2019, 31, 8807–8821. [Google Scholar] [CrossRef]
  26. Ahmed, A.N.; Van Lam, T.; Hung, N.D.; Van Thieu, N.; Kisi, O.; El-Shafie, A. A comprehensive comparison of recent developed meta-heuristic algorithms for streamflow time series forecasting problem. Appl. Soft Comput. 2021, 105, 107282. [Google Scholar] [CrossRef]
  27. Tikhamarine, Y.; Souag-Gamane, D.; Ahmed, A.N.; Kisi, O.; El-Shafie, A. Improving artificial intelligence models accuracy for monthly streamflow forecasting using grey Wolf optimization (GWO) algorithm. J. Hydrol. 2020, 582, 124435. [Google Scholar] [CrossRef]
  28. Rezaie-Balf, M.; Attar, N.F.; Mohammadzadeh, A.; Murti, M.A.; Ahmed, A.N.; Fai, C.M.; Nabipour, N.; Alaghmand, S.; El-Shafie, A. Physicochemical parameters data assimilation for efficient improvement of water quality index prediction: Comparative assessment of a noise suppression hybridization approach. J. Clean. Prod. 2020, 271, 122576. [Google Scholar] [CrossRef]
  29. Santos, C.A.G.; Silva, R.M.; Akrami, S.A. Rainfall analysis in Klang river basin using continuous wavelet transform. J. Urban Environ. Eng. 2016, 10, 3–10. [Google Scholar] [CrossRef]
  30. Kaveh, A.; Talatahari, S. A novel heuristic optimization method: Charged system search. Acta Mech. 2010, 213, 267–289. [Google Scholar] [CrossRef]
  31. Precup, R.-E.; David, R.-C.; Petriu, E.M.; Preitl, S.; Rădac, M.-B. Novel Adaptive Charged System Search algorithm for optimal tuning of fuzzy controllers. Expert Syst. Appl. 2014, 41 Pt 1, 1168–1175. [Google Scholar] [CrossRef]
  32. Kaveh, A.; Talatahari, S. An enhanced charged system search for configuration optimization using the concept of fields of forces. Struct. Multidiscip. Optim. 2010, 43, 339–351. [Google Scholar] [CrossRef]
  33. Allawi, M.F.; Othman, F.B.; Afan, H.A.; Ahmed, A.N.; Hossain, S.; Fai, C.M.; El-Shafie, A. Reservoir Evaporation Prediction Modeling Based on Artificial Intelligence Methods. Water 2019, 11, 1226. [Google Scholar] [CrossRef] [Green Version]
  34. Zio, E. Computational Methods for Reliability and Risk Analysis; World Scientific Publishing Company: Singapore, 2009; Volume 14. [Google Scholar]
  35. Jain, S.K.; Bhunya, P.K. Reliability, resilience and vulnerability of a multipurpose storage reservoir. Hydrol. Sci. J. 2008, 53, 434–447. [Google Scholar] [CrossRef]
  36. Sandovalsolis, S.; McKinney, D.C.; Loucks, D.P. Sustainability Index for Water Resources Planning and Management. J. Water Resour. Plan. Manag. 2011, 137, 381–390. [Google Scholar] [CrossRef] [Green Version]
  37. Hossain, M.S.; El-Shafie, A. Evolutionary techniques versus swarm intelligences: Application in reservoir release optimization. Neural Comput. Appl. 2013, 24, 1583–1594. [Google Scholar] [CrossRef]
  38. Pham, Q.B.; Afan, H.A.; Mohammadi, B.; Ahmed, A.N.; Linh, N.T.T.; Vo, N.D.; Moazenzadeh, R.; Yu, P.-S.; El-Shafie, A. Hybrid model to improve the river streamflow forecasting utilizing multi-layer perceptron-based intelligent water drop optimization algorithm. Soft Comput. 2020, 24, 18039–18056. [Google Scholar] [CrossRef]
  39. Banadkooki, F.B.; Ehteram, M.; Ahmed, A.N.; Teo, F.Y.; Fai, C.M.; Afan, H.A.; Sapitang, M.; El-Shafie, A. Enhancement of Groundwater-Level Prediction Using an Integrated Machine Learning Model Optimized by Whale Algorithm. Nat. Resour. Res. 2020, 29, 3233–3252. [Google Scholar] [CrossRef]
  40. Banadkooki, F.B.; Ehteram, M.; Ahmed, A.N.; Teo, F.Y.; Ebrahimi, M.; Fai, C.M.; Huang, Y.F.; El-Shafie, A. Suspended sediment load prediction using artificial neural network and ant lion optimization algorithm. Environ. Sci. Pollut. Res. 2020, 27, 38094–38116. [Google Scholar] [CrossRef]
  41. Mohamadi, S.; Sammen, S.S.; Panahi, F.; Ehteram, M.; Kisi, O.; Mosavi, A.; Ahmed, A.N.; El-Shafie, A.; Al-Ansari, N. Zoning map for drought prediction using integrated machine learning models with a nomadic people optimization algorithm. Nat. Hazards 2020, 104, 537–579. [Google Scholar] [CrossRef]
  42. Tikhamarine, Y.; Souag-Gamane, D.; Ahmed, A.N.; Sammen, S.S.; Kisi, O.; Huang, Y.F.; El-Shafie, A. Rainfall-runoff modelling using improved machine learning methods: Harris hawks optimizer vs. particle swarm optimization. J. Hydrol. 2020, 589, 125133. [Google Scholar] [CrossRef]
Figure 1. Location of Klang Gates Dam and Klang River [29].
Sustainability 13 05900 g001
Figure 2. Inflow volume of each month.
Sustainability 13 05900 g002
Figure 3. Framework of the proposed methodology.
Sustainability 13 05900 g003
Figure 4. Optimal release policies for January to December from 1987 to 2007.
Sustainability 13 05900 g004aSustainability 13 05900 g004b
Figure 5. Error of the release policies for all inflow categories.
Sustainability 13 05900 g005
Table 1. The physical characteristics of Klang Gates Dam.
ItemDescription
LocationTaman Melawati, Hulu Kelang
Function
  • Water supply by Wangsa Maju Water Treatment Plants and Puncak Niaga (M) Sdn Bhd for Bukit Nanas
  • Flood mitigation by Drainage and Irrigation Department
Year Operation1959
TypeArch gravity concrete
Height36.88 m
Catchment Area74.46 km2
Impounded Area2.70 km2
Capacity28,150 ML (6194 MG)
Maximum Level95.22 m ODL
Table 2. Range of inflow and value of the loss.
Inflow (MG)Loss (MG)
0 < I ≤ 500740.199
500 < I ≤ 1000−11.405
1000 < I ≤ 1500−472.402
1500 < I ≤ 2000−643.010
2000 < I ≤ 2500−758.122
2500 < I ≤ 3000−1327.168
I > 3000−2186.554
Table 3. Storage options.
StateStorage (MG)
16194.00
25057.67
33921.34
42785.00
51648.67
Table 4. The monthly demand of the reservoir.
MonthDemand (MG)
January1298.64
February1083.09
March1152.45
April1173.00
May1198.73
June1271.73
July1258.14
August1206.41
September1160.05
October1204.14
November1213.09
December1290.59
Table 5. RMSE of the release curves (in MG) for KGD.
MonthsCSSABCPSOReal Coded GABinary GA
High InflowJanuary194.4473.1578.3868.6783.86
February0.4179.4882.5285.62109.72
March0.9467.0262.2377.9483.56
April1.4864.0560.0561.2169.28
May0.5571.4659.2160.3870.93
June0.8938.0246.1135.5644.72
July1.5544.6646.6442.8638.92
August0.6659.9657.6666.3972.20
September1.7966.1467.0961.4682.39
October1.7455.2859.0152.4863.29
November2.0854.6457.1664.2667.48
December1.940.000.1440.1094.89
Total208.47673.86676.20716.94881.24
Medium InflowJanuary245.6195.5697.33102.11118.60
February237.4857.1661.4667.1663.49
March66.7170.6562.9163.6775.56
April1.3346.9056.1258.4780.26
May24.5862.3656.7540.65101.96
June173.9651.7757.1568.5841.41
July126.2265.1756.1966.0796.61
August91.6653.9754.9855.8468.21
September0.290.000.148.1950.81
October0.680.001.8120.4844.48
November3.810.000.4717.7549.48
December137.450.001.8816.4956.61
Total1109.78503.53507.20585.46847.48
Low InflowJanuary194.71205.70199.42209.16214.70
February37.43145.25145.43137.61124.48
March107.63175.74169.76171.76153.93
April188.94163.05180.99170.23190.11
May124.51203.28178.76175.12197.38
June37.45204.43205.79203.31190.84
July279.04193.23201.16201.41204.17
August179.37182.73180.85173.43202.38
September241.64159.39171.02166.46155.29
October251.00199.35180.21175.06186.07
November296.82161.80182.41197.87168.63
December93.790.0143.586.8288.27
Total2032.341993.952039.391988.242076.26
SUM3350.593171.333222.793290.643804.98
Table 6. Periodic reliability of the release curves (in MG) for KGD.
InflowMore than DemandLess than DemandMeet the DemandTotal Release (12 Months)
Low0.00%20.00%80.00%60
(0 times)(12 times)(48 times)
Medium1.67%16.67%81.67%60
(1 times)(10 times)(49 times)
High5.00%11.67%83.33%60
(3 times)(7 times)(50 times)
Total2.22%16.11%81.67%180
(4 times)(29 times)(147 times)
Table 7. Performance checking measures (in MG) for KGD.
InflowReliability, Rv (%)Reliability, Rp (%)Resiliency, RsResilience (months)Vulnerability, VulSustainability Index, SI
High99.4388.330.116777.25278.04
Medium96.6383.330.1667109.15305.75
Low93.7580.000.2000127.26319.98
Total96.6183.890.1611297.89301.26
Publisher’s Note: MDPI stays neutral with regard to jurisdictional claims in published maps and institutional affiliations.

