Article

The Impact of Sustainability Awareness and Moral Values on Environmental Laws

1
Sustainable Real Estate Research Center, Hong Kong Shue Yan University, Hong Kong
2
Hastings & Co., Gloucester Tower, 11, Hong Kong
3
Wolfson College, Oxford University, Oxford OX2 6UD, UK
4
Institute of Biomedical and Environmental Science and Technology, University of Bedfordshire, Luton LU1 3JU, UK
5
School of Life Science, Shanxi University, Taiyuan 030006, China
6
Romanian Academy, Center for Financial and Monetary Research, Victor Slăvescu, 050711 Bucharest, Romania
7
Romania Victor Slăvescu, Romanian American University, 050711 Bucharest, Romania
8
Department of Architecture, Built Environment and Construction Engineering, Politecnico di Milano, 20133 Milan, Italy
*
Author to whom correspondence should be addressed.
Sustainability 2021, 13(11), 5882; https://doi.org/10.3390/su13115882
Submission received: 27 March 2021 / Revised: 12 May 2021 / Accepted: 18 May 2021 / Published: 24 May 2021

Abstract

:
We argue that environmental legislation and regulation of more developed countries reflects significantly their moral values, but in less developed countries it differs significantly from their moral values. We examined this topic by using the keywords “sustainability” and “sustainable development”, studying web pages and articles published between 1974 to 2018 in Web of Science, Scopus and Google. Australia, Zimbabwe, and Uganda were ranked as the top three countries in the number of Google searches for sustainability. The top five cities that appeared in sustainability searches through Google are all from Africa. In terms of academic publications, China, India, and Brazil record among the largest numbers of sustainability and sustainable development articles in Scopus. Six out of the ten top productive institutions publishing sustainable development articles indexed in Scopus were located in developing countries, indicating that developing countries are well aware of the issues surrounding sustainable development. Our results show that when environmental law reflects moral values for betterment, legal adoption is more likely to be successful, which usually happens in well-developed regions. In less-developed states, environmental law differs significantly from moral values, such that changes in moral values are necessary for successful legal implementation. Our study has important implications for the development of policies and cultures, together with the enforcement of environmental laws and regulations in all countries.

1. Introduction

Value-belief-norm theorists have suggested that the intention to perform pro-environmental behaviors is affected by the awareness of adverse environmental consequences [1]. Applying the same principle, sustainability awareness is the first step in achieving sustainability. Our working definition of sustainability is that it is a long-term goal to achieve a more sustainable world, while sustainable development refers to the many processes and pathways to achieve it e.g., sustainable agriculture and forestry, sustainable production and consumption, good government and governance, research and technology transfer, education and training. Social media in higher education [2] can enhance sustainability and sustainable development, exemplified by implementing a smart home system to induce users’ awareness [3]. Larger companies’ construction practices in Chile demonstrated a higher environmental aspect of sustainability awareness [4]. Ola Bergeå et al. studied the perception of sustainability awareness among Spanish-speaking consumers [5]. Visual representation of a Venn diagram, three concentric circles, and the Planning Hexagon can be useful in raising sustainability awareness [6].
While the traditional Environmental Kuznets curve has suggested that the level of economic development affects the extent of environmental degradation [7], our research postulates that this is explained by the closer relationship between moral values and laws among more developed nations. This is an important contribution to the field.
Because needs theory is mainly used to predict individuals’ behavior, it is natural to inquire whether it can be extended to describe sustainability and sustainable development awareness at the country or city level [8], i.e., wealthier countries or cities may have higher awareness of sustainability or sustainable development. To ascertain awareness for all countries worldwide, we used the number of searches in Google as a proxy of the awareness.
Google Search provides an excellent platform for observing individuals’ information-seeking activities. It reflects individuals’ needs, wants, demands, and interests [9]. The search volume index is generated based on the number of keyword search queries submitted through the Google search box [10]. Rajeev Goel [11] has used this approach to study corruption awareness via Internet hits about corruption and bribery [11]; Rita Li [12] has studied the global interests in various construction safety informatics tools. Apart from these techniques, academic publications indexed in the Web of Science and Scopus can be used to reveal awareness of sustainability issues (see Section 4.1.2 and Section 4.1.3 for details).
Web of Science’s Core Collection Database is considered one of the most complete academic databases with 20,000 of the highest impact, quality scientific international journals [13,14] and 1.4 billion cited references dating to the year 1900 [14]. Having emerged in November 2004, Scopus now is the largest database for scientific literature in the market [15]. It currently comprises more than 23,700 peer-reviewed journals with more than 1.4 billion cited references after 1970 [16].

2. Theoretical Framework

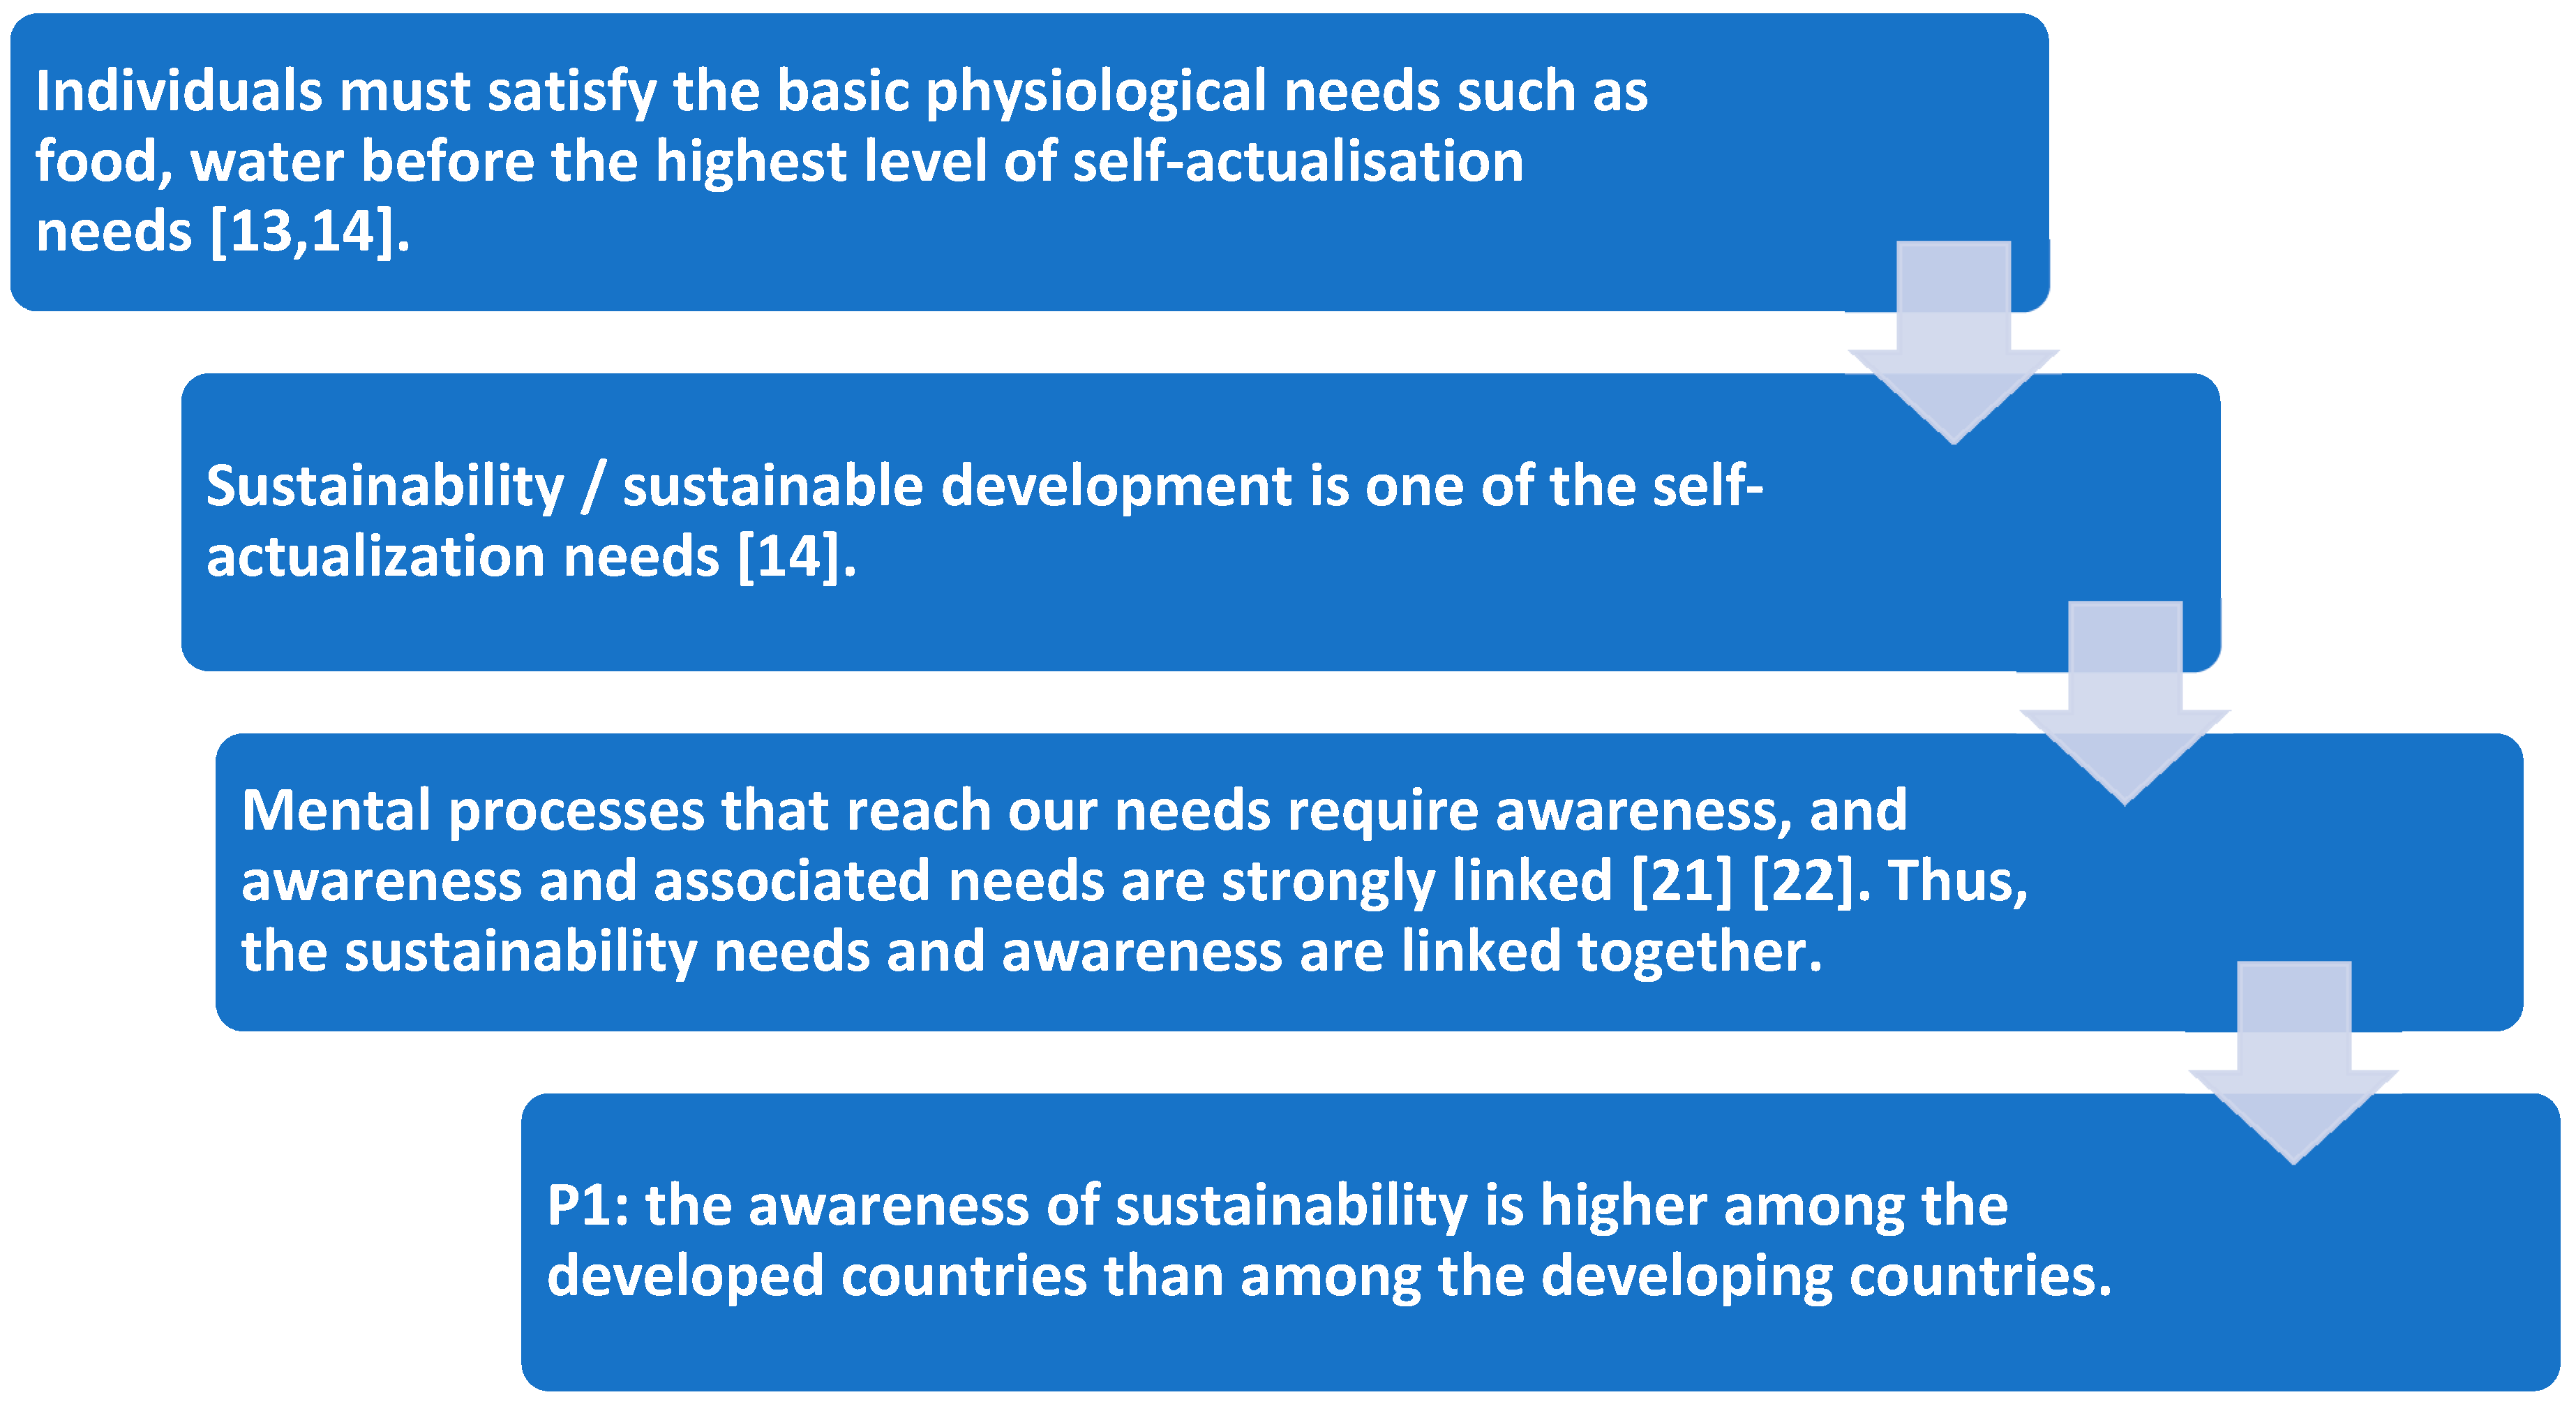
2.1. Maslow’s Hierarchy of Needs Theory and Awareness

Abraham Maslow is among the most prominent psychologists of the 20th century and the hierarchy of needs, accompanied by the pyramid representing how human needs are ranked, is an image familiar to most business students and managers. Maslow’s theory is based on a simple premise: human beings have needs that are hierarchically ranked. There are some needs that are basic to all human beings, and in their absence, nothing else matters. As we satisfy these basic needs, we start looking to satisfy higher-order needs. Once a lower-level need is satisfied, it no longer serves as a motivator; humans then move step by step to fulfill higher needs such as safety, social, and then esteemed goals [17]. After fulfilling the “lower” level of needs, people finally satisfy their self-actualization. The indispensable needs of people in developing countries are food, shelter, clothing, and jobs; and sustainable development requires meeting all basic needs before extending to an aspiration for a better life [14]. In this study we used Maslow’s hierarchy as it is the fundamental methodology for ranking needs; others such as Douglas McClelland’s Acquired Needs Theory, which argues that individuals possess stable and dominant motives to achieve, acquire power, or affiliate with others, is a derivative, and may be suitable for further analysis at a later date (See Section 6).
The most popular self-actualization measurement is the Personal Orientation Inventory [18], developed in 1963 in the US [19]. It measures the behavior and values related to positive mental health and the growth process of psychological optimization, exhibited in the self-actualizing person. Endorsed by Maslow, the Personal Orientation Inventory comprises 150 two-choice comparative behavior and value judgments [18]. In 1999, Michael Hagerty used annual quality of life-time series in 88 countries from 1960 to 1994 to test the validity of the needs theory and study all five levels of Maslow’s needs. The results displayed significant agreement with Maslow’s predictions about the sequence of need achievement. For example, fastest progress in democracy (one of the elements in the highest level of the needs theory) happens after 12 years of the fastest growth in GDP per capita [8].
Many mental processes that reach our needs require awareness, and we often act to realize desired outcomes or goals [20]. A strong link between emotional awareness and type of needs has been demonstrated [21]. We speculate that sustainability needs and awareness are strongly linked and both belong to self-actualisation, i.e., the highest level in Maslow’s theory of needs pyramid (Figure 1).
Following this theoretical framework, we may speculate that compared to developing nations, wealthier developed nations have fewer people struggling with basic physiological needs, such as occasional food crises or lack of clean water resources. These people from wealthier nations may move up to the higher level of needs (e.g., the self-actualization of sustainability and sustainable development). Thus, they have a higher level of sustainable development or sustainability awareness. This leads to our first proposition, P1: The awareness of sustainability and sustainable development is higher within developed countries than within developing countries (see Figure 2).

2.2. Principle-Based Jurisprudence

Legal positivism is a stream of principle-based jurisprudence. The focal point of positivism is the degree of separation between law and morals. Many legal systems embody the enforcement of ethical and moral values; hence, the purpose of law may sometimes be confused with morals [23]. Individuals may consider themselves to have high moral identity internalization and devote efforts to follow and exhibit moral behavior [24] rather than law. However, another school of thought distinguishes law and morals as two separate issues. In view of these differences, scholars classify them into classic and modern positivism according to their perspectives on the separation between law and morals.

2.2.1. Classic Positivism

As law and culture have different stages of development [25], classic positivists insist on the absolute separation of law and morals [26]. Jeremy Bentham advocated (1) the separation of law and morals and (2) the need to distinguish the concept of “law as it is” and “law as it ought to be” [27]. John Austin proposed that “the existence of law is one thing; its merit or demerit another” [28,29]. Like Bentham, he suggested distinguishing between “what law is” and “what law ought to be.” A virulent critic and opponent of legal positivism, Friedrich Hayek conceded that law should be distinguished from morals [30]. Others regard law as a unified system of rules which emanate from the will of the nation-state [25].

2.2.2. Modern Positivists

Modern positivists argue for certain levels of correlations between morals and law [26]. More recent modern positivists concede that law is whatever follows from the moral principles that offer the best justification and explanation of law [31]. Hence, modern positivism aims to study “to what extent law and morals are separated.” In general, three scenarios may be observed in modern society: (1) law and morals are completely separated, (2) law and morals are completely the same, and (3) law and morals overlap to some extent. Hans Kelsen held the view that law should be separated from other disciplines. All Natural Law, morals, and other social accretions should be eliminated [28]. Herbert Hart believed that the existence and content of law should depend on social facts but not on morals. Nonetheless, given the “gap” originating from the lack of clarity of statutes and foreseeability of future case facts, judges may have discretion to make law in moral considerations [32]. A “minimum content of natural law and morals” may exist in all legal systems. Therefore, Hart is classified as a soft positivist [33]. Joseph Raz agreed that law and morals are related. However, he insisted that the existence and content of law can always be determined with reference to its sources without recourse to a argument about morals [34]. He is thus also known as a “hard positivist” [33]. Ronald Dworkin suggested that judges cannot merely follow the law because there is nothing to follow. They must produce a principle that justifies and fits the existing legal materials. We should follow the moral principles that provide the best justification and explanation of the pre-existing positive law. Thus, no one may really know what the law is, as no one may have identified the moral principle that provides the best justification and explanation of the earlier law [31]. Nevertheless, Kimberley Brownlee and Richard Child considered a close relationship between law and moral. They were of the view that law is a moral advisor, a moral example and a moral motivator [35].

2.2.3. Morals and Environmental Laws

In developed countries, such as the US, those of the EU, and Australia, there is a call for improvement in laws that aim at reducing negative environmental externalities [36]. Environmental health law is regarded as “a logical, non-contestable consequence of the imperative need for the immediate protection of the planetary ‘environment’ from accelerated human degradation” [26].
These laws, however, may not fit well with the nation’s morals standard and culture. Morals, according to the Cambridge Dictionary, is defined as a “social set of standards for good or bad behavior and character, or the quality of being right, honest or acceptable”. Hence, activities that are classified as moral from our perspective may not be considered to have moral behaviors by other ethnic groups. Human rights issues in Islamic countries, such as “an eye for an eye” criminal punishment [37], is one of the vivid examples. There is no doubt that no matter how well environmental laws are designed, compliance and adoption by people is important. One of the major factors that determine the level of compliance may lie in motivation [38,39]; others may include positivism, referring to the degree of separation between law and morals.
A complete separation of law from a nation’s standard of morals may lead to non-compliance, and the law becomes void and empty. Previous research on positivism mainly focused on judges’ decision making because of different perceptions on the separation between the legal and moral [40] application of environmental laws [41]. Our research study sheds light on the country/city perspective.
Because research on the relationship between positivism and environmental health regulations on sustainability is scarce, this paper first highlights case studies in the US (a more developed area), China (a less developed area), and India (the least developed area).
This leads to our second proposition, P2: Positivism (i.e., the degree of separation between law and morals) affects the adoption of environmental health regulations.

3. Materials and Methods

3.1. Google Search Volume Research Method

We studied the first proposition by using the search volume in Google as a proxy for general laypersons’ awareness and appropriate websites, together with academic publications as a proxy for academic awareness on sustainability and sustainable development. We used the English language. Google Trends is a web-crawling engine [42] that provides Google query data from January 2004 to the present on a weekly basis. It reports on a search index that shows the frequency of a search query that has been searched relative to the total search volume in different languages and areas [43]. The search interest was calculated by Google Search interest, meaning the number of queries for keyword/total Google Search queries. The results were then indexed and normalized in relative values ranging from 0 to 100 by taking all the interest data for keywords divided by the highest point of interest for that date range. In terms of regional analysis, it is a normalized indication of search interest within each country. For example, if there is an index of 100 in Australia and 66 in Kenya, more people are searching for this particular keyword in Australia than in Kenya [44]. However, the calculation does not reflect the impact of the Internet population on the number of searches. Thus, it does not take into account the number of people in developing countries who may be interested in sustainability but do not have computers or access to the Internet. One drawback of this method is that it underestimates the population in developing countries that is interested in the topic [10] (i.e., the data are affected by nonrepresentative sampling bias) [45]. Another is that we just used one language, English.
Despite these drawbacks, however, Francesco Brigo et al. researched the changes in web search behavior in English-speaking countries over time for terms related to epilepsy and epileptic seizures. They found that the greatest search volume for the term “epilepsy” was in South Africa, Kenya, and Ghana. Fears and worries are the major factors that affect online search behavior [45]. Previous research applied Google Trends to predict some economic indicators in countries Turkey, the US and India [10].
We used the keywords “sustainability” and “sustainable development” in the keyword search box of Google and selected the longest time frame it covered. As the longest time frame of search records in Google was 1 January 2004 to 2 July 2018 (the date the research took place), we selected all to include in our study to avoid the sudden increase or decrease at one time period that could lead to bias.

3.2. Articles Indexed in Scopus and Web of Science

We used systematic analysis and mapping [46]. Apart from the number of times that the public searches keywords, we also studied the number of publications from each country, which reflects academic awareness of and interest in the issue. Because Web of Science and Scopus are two authoritative academic sources, we included them in our study. In Scopus, we searched for articles containing the keyword “sustainable development” for the period 1982–2019 and for “sustainability” for the period 1981–2019. In Web of Science, we searched for articles with the keyword “sustainability” for the period 1974–2018 and “sustainable development” for the period 1981–2018. We included all articles from these periods.
Further, as with previous sustainability awareness researchers [1,2], we intended only to ascertain whether public users and academic researchers were aware of the issue but not how deeply they understood it. Thus, we did not set any further exclusion criteria on specific aspects of sustainability, such as the three dimensions of sustainability (environmental, economic, and social) or one dimension (environment only), in this research.

3.3. Multiple Case Studies

To study the second proposition, we adopted multiple case studies. Case studies are the best tool for research analysis when the research focuses on a real-life context [47]. Integrating multiple sources of data and adopting a case study design can bring new insights to the existing knowledge [48]. Unlike a single case study, multiple case studies may be more representative [49].
Whereas case studies are common in social science research, empirical legal studies until 1998 used quantitative data and statistical analyses to identify patterns in judicial decisions. These included “judicial opinion coding or case content analysis, descriptive and inferential” while excluding empirical legal research that used other qualitative techniques. Since then, legal scholars have been encouraged to employ and develop other empirical methodologies in empirical legal research. For instance, proponents of qualitative research methods advocate using only qualitative empirical legal research, as opposed to quantitative research, which epistemologically belongs to the research tradition of positivism [50].
In the following section, we will use three case studies to identify the level of separation between law and morals in modern environmental law, starting with a developed country (the US), followed by two countries which are still developing (China and India). According to the latest Environmental Performance Index 2018 released by Yale University, the US ranks 27th, China ranks 120th, and India ranks 177th out of 180 countries [51].

4. Results

4.1. Sustainability Awareness Results

The Google Trends search volume results quantify interest in topics at the population level for a specific term among laypeople in general [52]. However, modern literature reviews of quality publications require awareness not just of the overall direction and achievements in a field of inquiry but also of the latest studies [53]. Thus, results of our keyword search among the publications indexed in the academic databases Scopus and Web of Science represent academic circle awareness on sustainability or sustainable development.

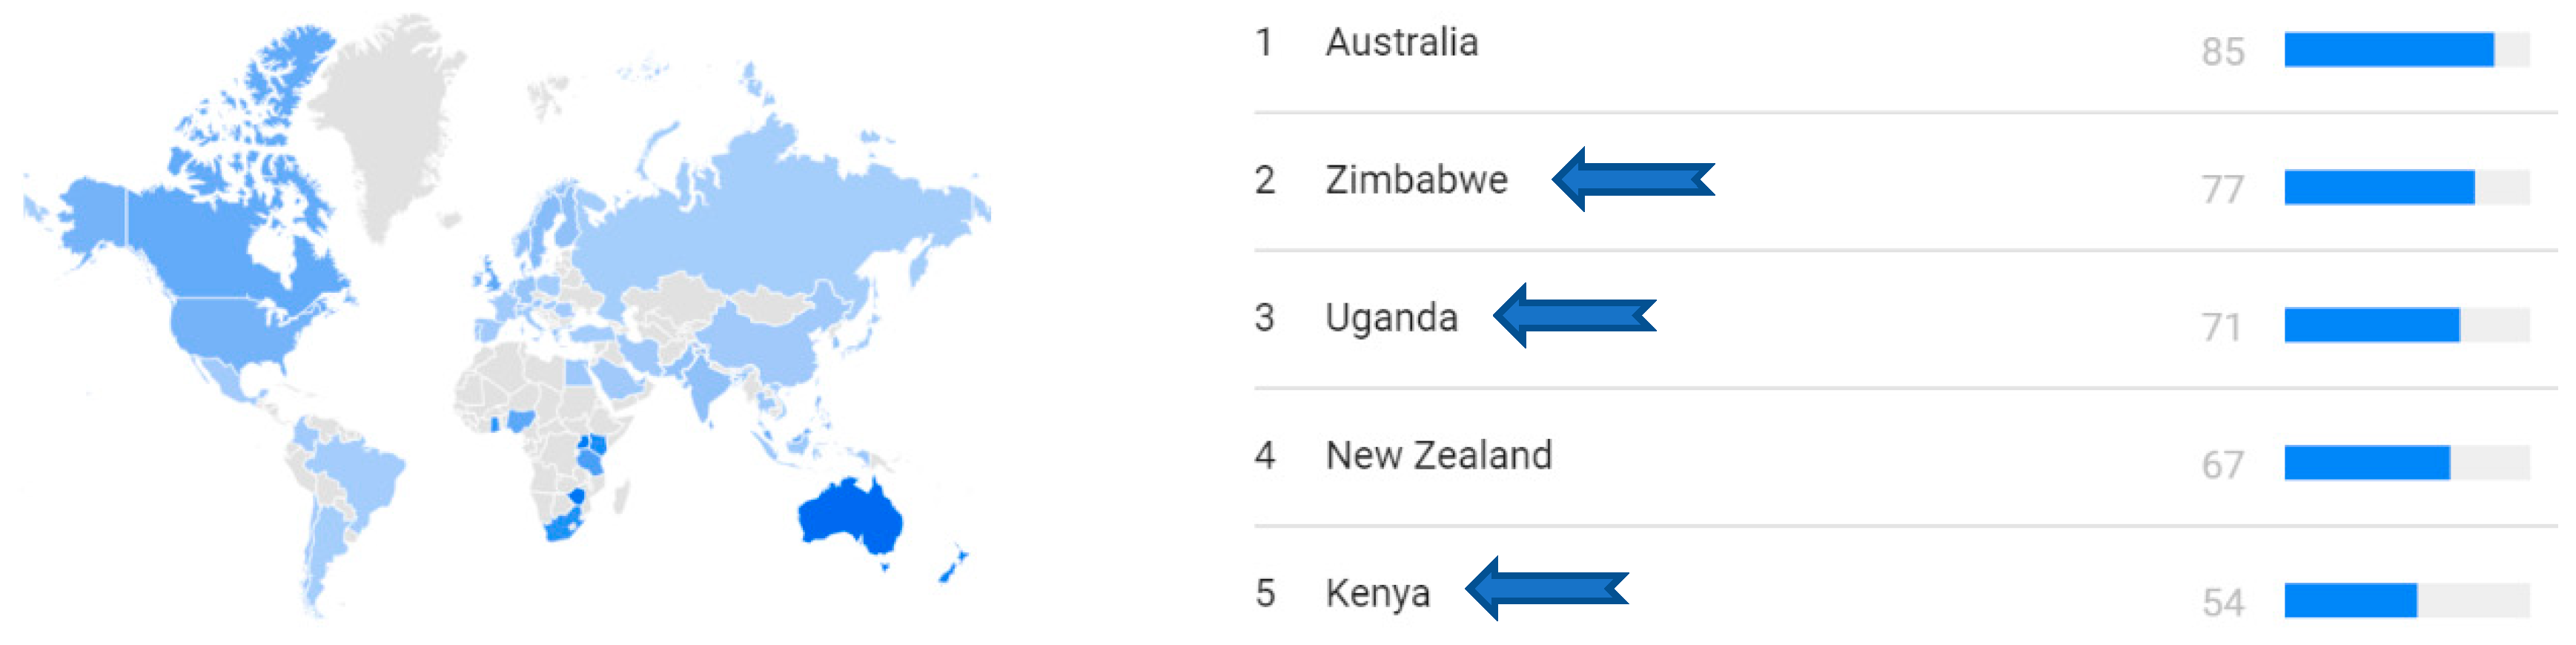
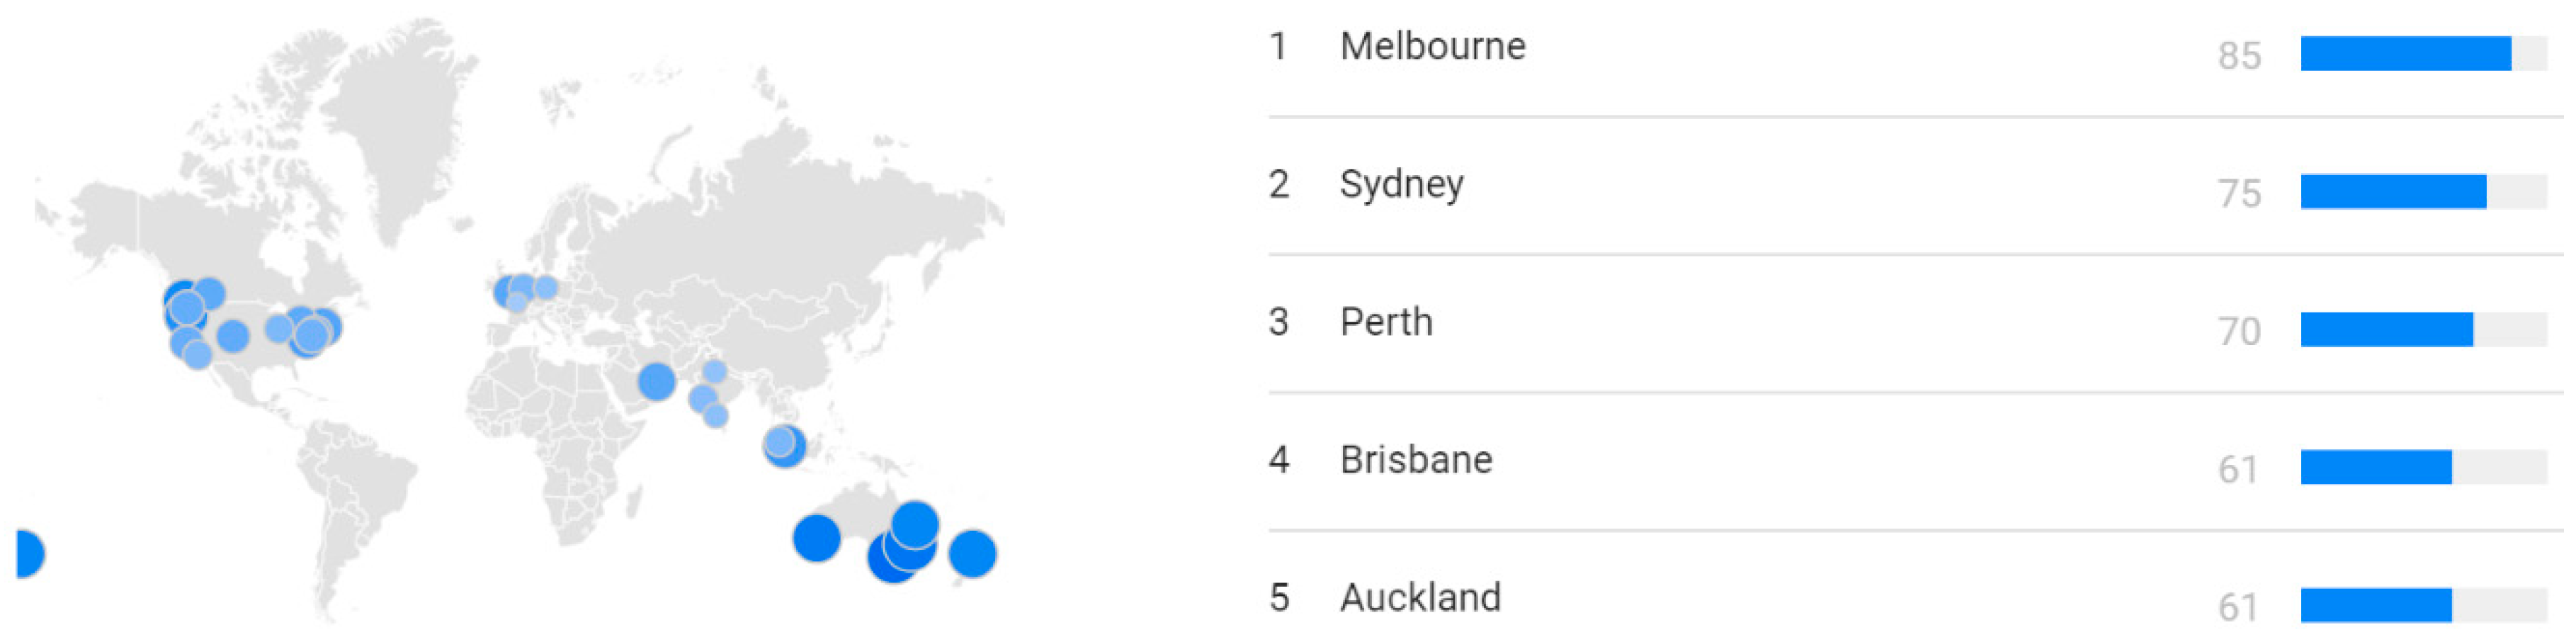
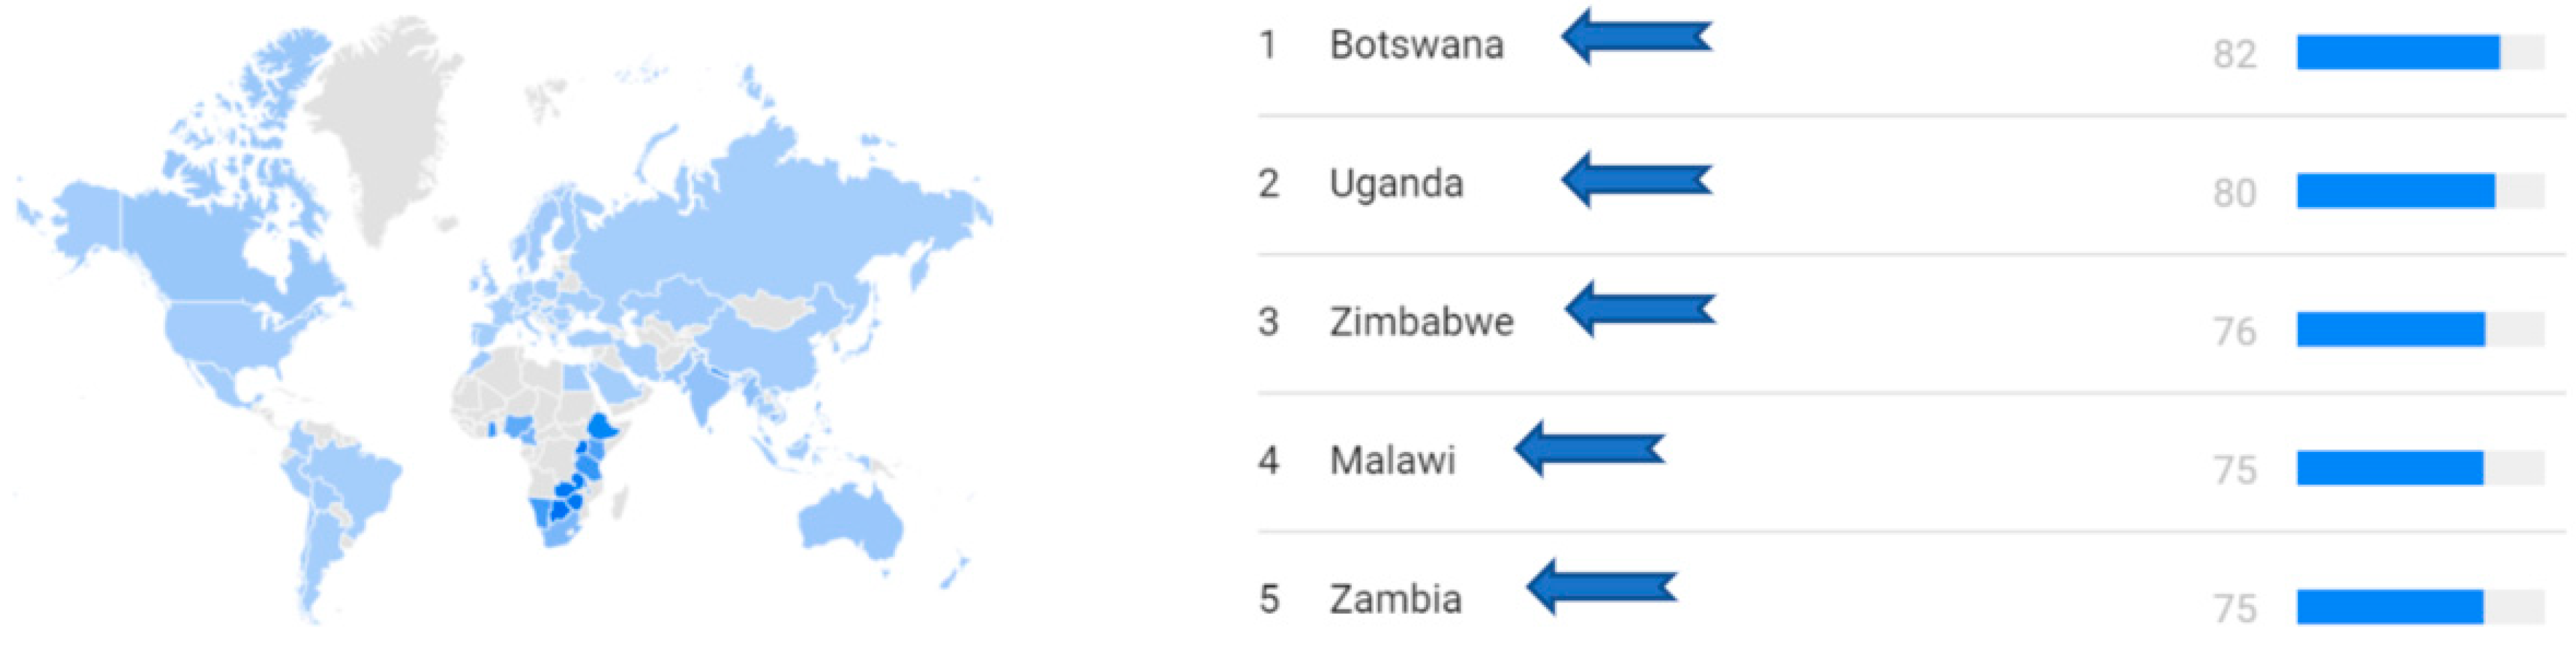
4.1.1. Web Data Analytics in Google

Web data analytics and visualization for the keyword “sustainability” for 15 years from 2004 to 2018 in Google Trends showed that the largest number of searches came from Australia, followed by Zimbabwe and Uganda (Figure 3). Regarding cities/towns, the top three cities are all located in Australia: Melbourne, Sydney, and Perth (Figure 4). We then searched for another similar term, “sustainable development”; the top three searches all came from countries in Africa: Botswana, Uganda, and Zimbabwe (Figure 5). Furthermore, the top three searches in terms of cities came from Kampala, Addis Ababa, and Dar es Salaam (Figure 6). Although the number of searches in Google may not reflect one hundred percent whether one nation is keen on the topic, given that its population may search the same issue with other search engines such as AOL or Yahoo, it is an indicator that shows people’s interest in the topic because Google is one of the most popular search engines around the world. The results imply that the sustainability/sustainable development issue is important in both developed and developing countries. Underdeveloped cities such as Kampala had the second-highest search rates from 2004 to 2018 for sustainable development. That indicates that many of their residents are aware of the issue despite comprising only a small number of Internet users because of lack of education, training in Internet use, and the high cost of technology.

4.1.2. Scopus

In total, we found 77,382 “sustainability” articles published from 1982 to 2019 indexed in Scopus. After that, we searched by using the keyword “sustainable development” to study the number of articles indexed by Scopus and published between 1981 and 2019. There are 130,334 articles altogether.
Table 1 shows the number of “sustainability” articles by country. The top 10 countries are the US, the UK, Australia, China, Germany, Italy, Canada, Spain, the Netherlands, and Brazil. Among these countries, China and Brazil are developing countries and the rest are developed countries. The US published the largest number of sustainable development articles, followed by China, the UK, Germany, Australia, Italy, India, Canada, France, and the Netherlands.
The most productive institutions in sustainability are the Chinese Academy of Sciences and Universidade de Sao Paulo, located in the Least Developed Countries (LDC). Further, six of the top ten most productive institutions in “sustainable development” are in developing countries, with the Chinese Academy of Sciences having published the most and the Ministry of Education in China the second most. Another two are in Malaysia and Brazil. This suggests that higher education institutions in China are aware of sustainable development (Table 2).

4.1.3. Web of Science

Web of Science yielded 125,790 publications from 1974 to 2018 containing the keyword “sustainability.” China was the fourth most productive country. Regarding “sustainable development,” 104,599 articles were published between 1981 and 2018; again, the most productive country was China. The Chinese Academy of Science ranked first and fourth in sustainability and sustainable development in terms of the number of publications indexed in Web of Science (Table 3). As LDC, India and Brazil were the top ten most productive countries publishing sustainable development and sustainability articles, respectively. The top ten most productive institutions publishing articles containing the keyword “sustainability” from 1974 to 2018 and “sustainable development” from 1981 to 2018 in the Web of Science are shown in Table 4.
The results of Google Trends, Scopus, and Web of Science indicate that some developing nations such as China, India, and Brazil are also aware of sustainable development/sustainability. That implies that Maslow’s theory may not hold true in this area. However, we observe that the implementation of environmental law is smoother in developed countries than in developing countries. What is the major reason for this? The following case studies provide a means of testing proposition 2, successful implementation of environmental regulation is related to positivism (i.e., the degree of separation between law and morals).

5. Case Studies

We chose three countries for our case studies, one, the USA, to represent a country which has been highly economically developed for some time, and two-China and India –to represent countries formerly economically relatively undeveloped, but which are currently on trajectories to much greater economic development.

5.1. Case Study 1: The United States of America (“the US”) (MDC)

Although the two World Wars transformed the US into an industrial hegemony, they also led to environmental degradation. Nevertheless, as US residents consider “environmental protection” an important moral value [54], polluting activities should be reduced [55]. The adverse impact of industrial production and pollution has been one of the major concerns of US residents since the 1970s [56]. The general public called for stricter environmental laws to prevent any further environmental degradation [55]. In the 20 years between 1973 and 1992, the percentage of interviewees who thought that the adequacy of existing environmental regulations was “too little” rose significantly from 33% to 62% [55]. Meanwhile, other evidence showed that pro-environmental voting, measured by “scores” assigned to the members of Congress by the League of Conservation Voters, increased in the whole country (e.g., in south Atlantic states, the number rose from an average of 7.7 points in the 1970s to 32 points in 1989) [57]. In another study conducted later, 97% of people in the US agreed that they must protect the environment for their children and grandchildren even if it reduces their standard of living today [58]. In a survey conducted by the Pew Research Center in 2014, 71% of those surveyed agreed that the country “should do whatever it takes to protect the environment” [59].
Election results have also reflected support for environmental regulations among US citizens. As the influence of environmental values increases, members of Congress and congressional candidates also increasingly support legislation intended to protect the environment. Moreover, government agencies must solicit the public’s views before issuing environmental regulations, all citizens have the right to seek judicial reviews, and NGOs and ordinary citizens may file lawsuits to enforce environmental laws in the US [60].
At the same time, the US Congress has enacted more environmental health laws (e.g., the California Environmental Quality Act 1970 proposed that government agencies should not approve projects that fail to mitigate their negative environmental impact). The penalty provisions of the Clean Air Act (42 U.S.C. 7413(c) (Supp. V 1993), Clean Water Act (U.S.C. 1319(c) (1988 & Supp. V 1993), and Resource Conservation and Recovery Act (42 U.S.C. 6928(d) (1988) incorporated by Congress were designed and implemented to satisfy the public objectives (or tastes) of Americans since the 1960s to criminalize polluting behaviors [55] (see more in Section 5.4).
Law and morals strongly overlap regarding US environmental health laws (public standard of rightness). The public standard of good morals is to preserve the environment from pollution. This view forces all elected officials to pass new laws to satisfy public demand. Conspicuously, no candidate acts against the general public’s need to enact environmental health legislation. From this perspective, law and public views of morals cannot be separated.

5.2. Case Study 2: China, The Rising Dragon and the Greatest LDC

Traditional Chinese culture is eco-friendly-oriented and reveres nature as a deity itself [61]. Confucianism, Taoism, and Buddhism heavily influence Chinese citizens’ environmental perspectives [62]. All of these religions promote environmental protection. Confucianism posits that humans should peacefully coexist with nature but not exploit it. Taoism’s focal idea is similar: Zhuang Zi professed that “man and nature are combined.” Buddhism respects lives and nature. Beyond doubt, acting against the god of nature is immoral from the traditional Chinese point of view.
Nevertheless, modern China’s pollution problems have worsened and are the by-products of rapid development. Environmental problems include the use of counterfeit agricultural inputs and poor industrial waste management throughout villages, towns, and cities [63]. China’s unprecedented economic growth, which results from technological upgrading [64] and industrial development [65] at the expense of environmental deterioration, is contradictory to traditional Chinese moral standards. The implementation of environmental health laws to a certain extent reflects the needs of modern Chinese to find ways to punish wrongdoers who deprive others of the right to clean air and water. Nonetheless, environmental health laws in different regions have different sets of standards and implementation dates. Interestingly, there is a strong correlation between environmental health legal development and morals in wealthier cities in China. Shanghai and Beijing, the largest and the second-largest economies in terms of city scale, usually enforce up-to-date eco-regulations concerning auto emission standards sooner than other regions. That actually coincides with the individual willingness to pay to combat the air pollution problem in China; the higher household income group is willing to pay more to combat air pollution [66]. Table 5 shows the implementation dates for the China 5/V and China 6/VI regulations in different regions. China V’s particulate matter (PM) limit for diesel and gasoline light-duty vehicles is 0.00475 g/km [67], and China VI tightens PM emission limits by 30% based on the Stage V Standard [68]. The following illustrates the four levels of requirement:
  • Current: No additional progress beyond the standards already in place in mid-2014.
  • Baseline: Future standards which have been announced and implemented. Otherwise, no additional progress would be expected.
  • Improved: International best practices are implemented according to a conservative schedule.
  • World Class: International best-practice standards are implemented following an accelerated schedule.
In other words, there is a two-year difference in the implementation of China 6/VI emission standards between Beijing and Guangzhou [21].
The 12th Five-Year Plan committed to experimenting with carbon markets as a means to combat climate change. Beijing planned to establish carbon markets before the national scheme was implemented [70]. In the case of industrial water-waste emissions, although both Shangdong and Sichuan Provinces are famous for making paper, Shangdong’s standard for chemical oxygen demand (COD) is 100 mg/L, while Sichuan’s is 200 mg/L [71]. (Note: Shangdong’s GDP is 240% greater than that of Sichuan).
Rural senior government officials can emphasize economic growth over environmental value, whereas government officials in urban areas are more supportive of environmental health regulations. The slogan “pollute first and pay later” prevails more among urban senior government officials than among those in rural areas [72]; rural leaders usually have looser regulations. In other words, the degree of “overlap” between moral values and laws is greater in well-developed cities than in less-developed rural areas. Is this sufficient to conclude that environmental health regulations have a positive relationship with economic development? Below we look at the final example in India.

5.3. Case Study 3: India, a Rising Elephant with a GDP Two-Thirds Less Than the Dragon

“The preservation of environment is an economic consideration since it is closely related to depletion, restoration and increase of resources. In any policy decision, and its interpretation we must balance present gains with likely damages in the not too distinct future.” [73].
In India, Prime Minister Indira Gandhi’s 1983 speech confirmed the senior Indian officials’ support for the enactment of environmental health regulations. The green movement, however, is considered a “judge-driven reform” because the new green courts were established according to the needs of the judiciary [73]. Starting from the independence of India in 1949, the Indian central government launched many water conservation regulations to improve hygiene and sanitary conditions. The first attempt was the 1956 River Board Acts, which regulated development in river valleys. Other examples included the 1970 Maharashtra Prevention of Water Pollution Act, which stressed the importance of negotiating effluent standards with industry. Further, the Indian Penal Code (1974) includes provisions to punish “whoever voluntarily corrupts or fouls the water of any public spring or reservoir, so as [to] render it less fit for the purpose for which it is ordinarily used.” If everyone follows these regulations strictly, water pollution should not be a problem in India.
Nevertheless, this inference is wrong. Some travelers sarcastically refer to India as “I’ll Never Do It Again” after travelling to the River Ganga, where every year, 200 tons of half-burnt human dead bodies end up. Water pollution and the resulting diseases often make the country disappointing. Thus, one may ask, “Why are the anti-pollution provisions ineffective?” The truth is that these regulations are moral in the eyes of high-ranking officials and judges only, but they contradict traditional Hindu moral values. Therefore, the general public disobeys the laws.
Many high-ranking Indian officials, including prime ministers Nehru, Indira Gandhi, and Singh, graduated from universities overseas and were educated in Western moral values such as sustainable development and environmental health protection. Water pollution laws are important in society in their eyes. In 1985, the Indian federal government launched the Ganga Action Plan with the primary aim to clean the river. Nevertheless, characterized by centralized planning and little public participation, it had limited impact. In 2011, the government launched the National Ganga River Basin Project with support from the World Bank. However, locals have a different set of moral values. They believe that the “Ganga can never be impure because she has the ability to cleanse herself” [74] and that bathing there can purify people’s bodies and souls [75]. Throwing corpses into the river enables their relatives to attain Nirvana and leave the cycle of birth and death. In recent years, there is increasing concern about water pollution in the Ganga; but for the faithful the Ganga is holy, and the polluted water is viewed as the blessing of the river goddess. The environmental laws of Ganga states like Uttar Pradesh contravene the public culture. From this perspective, the water pollution laws in India deviate from the general public’s views on what constitutes morally acceptable behaviors.

5.4. Emission and Regulations in the US, China, and India

In the US, the Clean Air Act was last amended in 1990. It requires the United States Environmental Protection Agency (US EPA) to set National Ambient Air Quality Standards (40 CFR part 50) for pollutants classified as harmful to public health and the environment. The Act is classified into two major standards. The primary standards provide public health protection for the health of sensitive populations such as children, the elderly, and asthmatics. The secondary standards provide public welfare protection against decreased visibility, damage to crops, animals, vegetation, and buildings. Data from the US EPA shows a continuous improvement in the three periods 1980 vs. 2013, 1990 vs. 2013, and 2000 vs. 2013 [76] (Table 6; note that the negative sign refers to reduction in pollutants).
The Clean Water Act (CWA) regulates the water pollutant discharge and regulates quality standards for surface waters. The CWA was enacted in 1948 as the Federal Water Pollution Control Act and was significantly expanded in 1972 to become the “Clean Water Act.” It is suggested that the level of dissolved oxygen in good-quality water should exceed 5 mg/L and that the pH value should fall between 6.0 and 9.0 [77]. We obtained data from the National Water Information System characterizing more than 1856 water sites. As some water sites only have either pH value or dissolved oxygen (DO) values, we include only 396 water sites that have both of these two values (some rivers may have multiple samples; we take the average for them). According to this suggested standard, 57.6% of the rivers reach a satisfactory level (see Table A1 in Appendix A).
In China, where the economy grows quickly, the PRC government also tightened the vehicle emission standards on a national scale gradually (Table 7). For example, the standard of sulphur content has been tightened from over 1000 ppm in 2003 to 500 ppm in 2005 and 50 ppm in 2014 [78]. It is quite common in China to tighten some well-developed/richer provinces’ regulations first as a testing point before the others. With economically affluent areas such as Shanghai implementing the regulations first, the average emission in Shanghai for sulphur dioxide is 24 μg/m3 and for PM10 is 84 μg/m3, while the sulphur dioxide emission in the relatively poor province of Shijiazhuang is 105 μg/m3 and PM10 is 305 μg/m3.
With regard to water pollutant emissions, the Environmental Protection Central Unit and Quality Control Central Unit state the requirements for dissolved oxygen and pH value. Pollutants in some wealthy provinces such as Shanghai are lower despite more economic activity (if there is no or little economic activity, there should be zero pollution). Figure A1, Figure A2, Figure A3 and Figure A4 in the Appendix A show the relationship between pollutant load per capita and per capita GDP in Shanghai and Beijing and three other critical provinces in China in 2014.
Apart from the acts mentioned earlier in the case studies, India also has implemented the Water (Prevention and Control of Pollution) Act 1974 [79,80]. In short, the Central Pollution Control Board, Ministry of Environment and Forests, Government of India states the water quality criteria as shown in Table 8. Nevertheless, the Swatcha Ganga Research Laboratory in Varanasi, which conducts water quality tests, revealed that fecal coliform counts (FCC) range between 16,000 and 60,000 MPN per 100 mL of water, which far exceeds the permissible limit for bathing at 500 mpn per 100 mL as stipulated by the Central Pollution Control Board. Similarly, biological oxygen demand (BOD) values are higher (4.4 to 7.6 mg/L) than the water quality standard, especially between Kannauj and Varanasi [74]. Only 2 of 124 rivers meet the BOD criteria as drinking water sources, and 3 of 124 rivers meet the outdoor bathing use (see Table 6 and Table 7). Nevertheless, many people drink and bathe in these rivers.
Apart from poor water quality, the air quality in India is bad. Although the Central Pollution Control Board has established the National Ambient Air Quality Standards (as shown in Table 9), the Environmental Information System Central Pollution Control Board has identified 95 cities that violate the air quality standard (NAAQS) (see Table A1), despite India’s having implemented a number of laws governing air quality [81]. Note that the data used for the US, India, and China are the most current official data (some of them have data dating back only to 2013).
Although the countries mentioned above have different official measurement methods for air and water quality, we can compare and rank the three countries’ air quality using data from the Yale Research Center. It uses the percentage of anthropogenic wastewater that receives treatment [82] to rank the water quality in India, China, and the US. In the US, 63.665% of wastewater is treated, 18.18% of wastewater in China is treated, and 10.5% of wastewater in India is treated. The population using an improved water source is the highest in the US, followed by China and India. That includes piped water on premises (e.g., piped household water connection in residents’ dwellings) and other improved drinking water sources (tube wells or boreholes, protected dug wells, protected springs, public taps or standpipes, and rainwater collection). The rate of daily diarrhea per 1000 capita per year is highest in India, followed by China and the US. Regarding air quality, the US’s PM10 was the lowest, China was worse than the US, and India was significantly over target with the poorest PM10 record. That means that US air quality was the best among all three countries, followed by China and India [83].

5.5. Results

We found that Australia, Zimbabwe, and Uganda ranked as the top three countries in the number of searches for sustainability in Google. China, India, and Brazil ranked in the top ten in the number of sustainability/sustainable development articles in Scopus, indicating that developing nations are aware of sustainability/sustainable development. Nevertheless, their environmental quality, such as the water in India’s River Ganges, is poor despite the existence of environmental regulations.
Therefore, we took one step further to answer why relatively high-level sustainability and sustainable development awareness is associated with poor water and air quality. We attempted to answer the question by elucidating the relationship between people’s adoption of environmental regulations and principle-based jurisprudence, an “ideological” positivism theory. It assumes a legal compliance obligation link with morals compliance: people may not follow laws if they are against their moral standards [84]. This is important as it extends the scope specifically to environmental regulation adoption.
Our research suggests that the closer relationship between moral values and laws among the more developed nations provides the explanation for this (e.g., Central Pollution Control Board laws have set the National Ambient Air Quality Standards, yet violation of local environmental law is common; the PRC government in China has tightened some richer provinces’ regulations first; and Americans, through their elections, exert pressure on members of Congress to support implementing environmental protection legislation). An improvement in air quality recorded over the years shows that Americans comply with the law.
Furthermore, although the three countries have their own laws that govern water quality, there is a huge difference between water quality in the US and India. If we assess US water quality according to the India standard (DO and pH value), 80.6% of rivers reach this standard. In India, only 1.6% of the rivers in India meet the country’s own BOD standard (see Appendix A). That may be because the law in India conflicts with Indians’ moral standards as per case studies and because the likelihood of compliance with the law is low. Regarding air quality, 95 cities violate the law in India. In China, environmental law has been tightened substantially since 2000 in times of strong economic growth. Richer provinces/cities usually tighten the environmental law first as a testing point before the poorer ones. Some economically depressed provinces record higher pollutant emissions than richer ones. That supports Proposition 2 with regard to positivism (i.e., the degree of separation between law and morals affects the adoption of environmental health regulations), as per our case studies (Table 10).

6. Discussion

There has been little research regarding the impact of the level of economic development on awareness of either sustainability or sustainable development. This paper fills this gap through its finding that many developing nations have a higher level of sustainability or sustainable development awareness, overthrowing our proposition based on Maslow’s need theory. Note that sustainability includes economic, environmental, and social aspects. Zambia, Uganda, and Zimbabwe are three countries that suffer the most from a lack of clean water. Zambia has long struggled with scarce water resources, and 40% of the population does not have access to clean water. Although Uganda borders the largest lake in Africa, approximately 20% of Ugandans do not have access to improved water sources; that percentage is even higher in rural areas. Around 32% of rural Zimbabweans do not have access to clean water. Contaminated water often causes illness and is a foremost cause of death in Zimbabwe. In 2008, a cholera epidemic swept across the nation, affecting nearly 100,000 people [85].
Thus, these African nations perceive the sustainable development issue as a life-and-death matter. To apply the analogy of Francesco Brigo et al. [45], fears and worries become the major driving force in searching for the relevant information. Our work indicates that while the developed nations have a high level of awareness, having already satisfied their basic needs, they notice the importance of safeguarding their natural environments for future generations and have a higher level of awareness of sustainability issues. This has important implications for policy development, as policy makers will need to continue to ensure safeguarding by ongoing publicity of both sustainability and sustainable development processes.
Previous research on positivism has focused mainly on judges’ decision making on environmental laws [41], whereas this study concentrates on the perspectives of a country/city. It highlights the impact of the separation between law and general moral standards on environmental law regulations. However, we recognize that there are some limitations to this study. We have concentrated on Maslow’s hierarchy of needs; future studies could include more analysis in respect of ERG theory, where Maslow’s 5 needs are collapsed into 3 (Existence, Relatedness and Growth), and Douglas McClelland’s Acquired Needs Theory, which argues that individuals possess stable and dominant motives to achieve, acquire power, or affiliate with others. In addition, future studies could analyze a greater range of countries on the economic development spectrum, for example countries in South America and Russia, and others such as Bhutan, where the development process has a more holistic purpose than economic development alone.
Although the number of stakeholders in the decision-making process makes enhancing sustainability and sustainable development a challenge [86,87], the case study results provide a practical contribution to showing how environmental law and environmental regulation can be implemented with more satisfactory results. They demonstrate that policy makers and drafters of regulations and laws should consider citizens’ moral standards when they propose environmental laws and regulations; this would benefit the major stakeholders’ decision-making processes [88]. Successful legal implementation may need to be associated with relevant education that can alters stakeholders’ traditional moral values if the laws to be implemented conflict with their moral standards. Absolute separation of law and morals in the eyes of classical positivists does not work well in environmental regulation in a modern society: in such cases laws are there but nobody follows them, leading to implementation failure.

7. Conclusions

7.1. Proposition 1: The Awareness of Sustainability Is Higher within Developed Countries Than Within Developing Countries

As a lack of sustainability and sustainable development awareness is a major barrier to pro-environmental behavior [89] and environmental benefits awareness affects consumer decision making [90], knowing more about Proposition 1 helps us understand the sustainability issue in developing and developed countries.
By conducting data analytics for keywords “sustainability” and “sustainable development” in Google for the 11-year period 2004–2015, we found that most of the searches for “sustainability” came from Australia, Uganda, and New Zealand. When we searched for the other keyword “sustainable development,” the top three searches came from the African countries Zambia, Uganda, and Zimbabwe. Zambia, Uganda, and Zimbabwe are developing countries, whereas Australia and New Zealand are developed countries. Notwithstanding that many of these developing nations do not have Internet access, the high number of searches implies that they have higher sustainability and sustainable development awareness, thus overthrowing Proposition 1.

7.2. Proposition 2: The Successful Implementation of Environmental Regulation Is Related to Positivism, i.e., the Degree of Separation between Law and Morals

Interestingly, the degree of separation between law and morals is positively related to economic development in our case studies, upholding Proposition 2. Among the three countries, the US is the richest, and India is the poorest. In a more developed country such as the US, there is a higher degree of overlap between laws and morals. Since the 1960s, the US Congress has designed and implemented environmental laws and regulations to satisfy the American public’s objectives. Shanghai and Beijing, two of the most economically well-developed cities in China, usually enforce up-to-date eco-regulations earlier than the other regions. In India, people continue to throw corpses into the River Ganga, believing that “Ganga can never be impure because she has the ability to cleanse herself,” leading to the existence of environmental laws with which nobody complies.

7.3. Academic and Practical Contributions

Maslow’s needs theory is traditionally used to predict individuals’ behavior, where people fulfill their needs step by step from basic physiological needs to the highest-level needs. This paper aims to extend its application to study whether wealthier countries or cities may have higher awareness of sustainability or sustainable development given that people in these countries usually have a higher proportion of individuals who have already satisfied the basic needs. The results show that people from developing countries are aware of the idea of sustainability/sustainable development whether they are laypeople (Google searches) or academics (Web of Science and Scopus databases). Our study also provides a rich field for future research, including investigations through empirical studies and on-site data collection. We are aware that other methods than Google Search could be used to identify samples, including questionnaires and workshops with appropriate stakeholders. These have been used successfully in a number of environmental situations, for example involving modified nominal group and Delphi techniques [91].
Our research also contributes to successful legal implementation and policy and cultural development. Our results show that when environmental law reflects moral values for betterment, legal adoption is more likely to be successful, which usually happens in well-developed regions. In less-developed states, environmental law differs significantly from moral values, such that changes in moral values are necessary for successful legal implementation. These changes may involve both institutional and individual psycho-structural coordination toward sustainable outcomes [92,93]. Such synchronization of policies and cultures, together with the enforcement of environmental laws and regulations in all countries, may, however, take more than one generation to accomplish.

Author Contributions

Conceptualization, R.Y.M.L. and Y.L.L.; Formal analysis, Y.L.L. and M.J.C.C.; Investigation, Y.L.L.; Methodology; Validation, R.Y.M.L. and M.J.C.C.; Visualization, M.S.; Writing–original draft, R.Y.M.L. and Y.L.L., O.M.; Writing–review & editing, M.J.C.C. All authors have read and agreed to the published version of the manuscript.

Funding

This research received no external funding.

Institutional Review Board Statement

Not applicable.

Informed Consent Statement

Not applicable.

Data Availability Statement

Not applicable.

Conflicts of Interest

The authors declare no conflict of interest.

Appendix A

Table A1. List of 95 cities that violate the air quality standard according to the Environmental Information System Central Pollution Control Board [70].
State Sl. No.State/Union TerritoryCities Sl. No.CityMajor Sources of PollutionPollutants of Concern
1Andhra Pradesh1HyderabadVehicles, IndustriesPM10
2KurnoolIndustries, VehiclesPM10
3PatencheruVehicles, IndustriesPM10
4RamagundamVehicles, IndustriesPM10
5VijaywadaVehicles, IndustriesPM10
6VishakhapatnamVehicles, IndustriesPM10
2Assam7GolaghatIndustries, VehiclesPM10
8GuwahatiVehicles, IndustriesPM10
9TezpurIndustries, VehiclesPM10
3Bihar10PatnaVehicles, IndustriesPM10
4Chandigarh11ChandigarhVehicles, IndustriesPM10
5Chattisgarh12BhillaiIndustries, VehiclesPM10
13KorbaIndustries, VehiclesPM10
14RaipurIndustries, VehiclesNO2, PM10
6Delhi15DelhiNatural Dust, Vehicles, IndustriesNO2, PM10
7Gujarat16AhmedabadVehicles, IndustriesPM10
17AnklesvarIndustries, VehiclesPM10
18JamnagarVehicles, IndustriesPM10
19RajkotVehicles, Natural dustPM10
20SuratVehicles, IndustriesPM10
21VadodaraVehicles, IndustriesPM10
22VapiIndustries, VehiclesPM10
8Haryana23FaridabadVehicles, IndustriesPM10
24HissarVehicles, IndustriesPM10
25YamunanagarVehicles, IndustriesPM10
9Himachal Pradesh26BaddiVehicles, IndustriesPM10
27DamtalVehicles, Industries, Natural DustPM10
28ParwanooIndustries, Vehicles, Natural DustPM10
29Paonta SahibVehicles, Industries, Natural DustPM10
10Jammu & Kashmir30JammuVehicles, Industries, Natural DustPM10
11Jharkhand31DhanbadIndustries, VehiclesPM10
32JamshedpurIndustries, VehiclesNO2, PM10
33JhariaIndustries, Vehicles, Natural DustPM10
34RanchiVehicles, IndustriesPM10
35SindriIndustries, Vehicles, Natural DustPM10
12Karnataka36BangaloreVehicles, IndustriesPM10
37GulburgaVehicles, Industries, Natural DustPM10
38Hubli-DharwadVehicles, Industries, Natural DustPM10
13Madhya Pradesh39BhopalVehicles, IndustriesPM10
40DewasVehicles, IndustriesPM10
41GwaliorVehicles, IndustriesPM10
42IndoreVehicles, IndustriesPM10
43JabalpurVehicles, IndustriesPM10
44NagdaIndustries, VehiclesPM10
45SagarVehicles, IndustriesPM10
46SatnaIndustries, VehiclesPM10
47UjjainVehicles, IndustriesPM10
14Maharashtra48AmravatiVehicles, IndustriesPM10
49AurangabadVehicles, IndustriesPM10
50ChandrapurIndustries, VehiclesPM10
51KolhapurVehicles, IndustriesPM10
52PuneVehicles, IndustriesPM10
53MumbaiVehicles, IndustriesPM10
54NagpurVehicles, IndustriesPM10
55NashikVehicles, IndustriesPM10
56Navi MumbaiVehicles, IndustriesPM10
57SolapurVehicles, Natural DustPM10
15Meghalaya58ShillongVehiclesPM10
16Nagaland59DimapurVehiclesPM10
17Orissa60AngulIndustries, Vehicles, Natural DustPM10
61BhubneshwarVehicles, IndustriesPM10
62CuttackVehicles, IndustriesPM10
63RourkelaIndustries, VehiclesPM10
64TalcherIndustries, VehiclesPM10
18Punjab65GobindgarhIndustries, VehiclesPM10
66JalandarVehicles, IndustriesPM10
67KhannaVehicles, IndustriesPM10
68LudhianaIndustries, VehiclesPM10
69Naya NangalVehicles, IndustriesPM10
19Rajasthan70AlwarVehicles, Industries, Natural DustPM10
71JaipurVehicles, IndustriesPM10
72JodhpurVehicles, Industries, Natural DustPM10
73KotaVehicles, Industries, Natural DustPM10
74UdaipurVehicles, Industries, Natural DustPM10
20Tamilnadu75CoimbatoreVehicles, IndustriesPM10
76SalemVehicles, IndustriesPM10
77TuticorinVehicles, IndustriesPM10
21Uttar Pradesh78AgraVehicles, IndustriesPM10
79AllahabadVehicles, IndustriesPM10
80AnparaIndustries, VehiclesPM10
81FerozabadIndustries, VehiclesNO2, PM10
82GhaziabadVehicles, IndustriesPM10
83JhansiVehicles, IndustriesPM10
84KanpurVehicles, IndustriesPM10
85KhurjaIndustries, VehiclesPM10
86LucknowVehicles, IndustriesPM10
87MeerutVehicles, IndustriesNO2, PM10
88NoidaVehicles, Industries, Natural DustPM10
89VaranasiVehicles, IndustriesPM10
22Uttarakhand90DehradunVehicles, Industries, Natural DustSO2, PM10
23West Bengal91AsansolVehicles, IndustriesNO2, PM10
92HaldiaIndustries, VehiclesNO2
93DurgapurIndustries, VehiclesNO2, PM10
94HowrahVehicles, IndustriesNO2, PM10
95KolkataVehicles, Industries, Natural DustNO2, PM10
Table A2. River quality in India measured by BOD [69].
RiverB.O.D. (mg/L)TrendRiverB.O.D. (mg/L)TrendRiverB.O.D. (mg/L)Trend
201120102011201020112010
Kala Amb5351025DecreasingKalu154IncreasingKolar818Decreasing
Savitri5255.4IncreasingRam Rekha153.5IncreasingBori812Decreasing
Kali (W)369287IncreasingPenganga159IncreasingBurai812Decreasing
Damanganga35432IncreasingPurna (Tapi)1414SameGomai810Decreasing
Vasista3405IncreasingVel1411IncreasingHiwara89Decreasing
Mithi17575IncreasingIndrayani1346DecreasingTambiraparani83.1Increasing
Kalinadi (E)161146IncreasingNira (Krishna)1328DecreasingDamodar7.85.8Increasing
Musi145110IncreasingRamganga12.48.6IncreasingPurna (Godavari)7.714Decreasing
Wardha11025IncreasingDwarka12.215.4DecreasingManjira7.614Decreasing
Betwa10478IncreasingSina12.28.4IncreasingUrmodi7.528.7Decreasing
Matha Bhanga905.4IncreasingKundalika12250DecreasingRapti7.518Decreasing
Sarabanga855.6IncreasingWainganga1228DecreasingKharkhla7.57.8Decreasing
Thirumanimuthar83.754IncreasingHarbora123.5IncreasingBindusar7.47Increasing
Ghaggar6870DecreasingWena1213.6DecreasingCauvery7.227Decreasing
Panchaganga67.528IncreasingDarna1210IncreasingRihand7.22.9Increasing
Churni643.7IncreasingGanga1115DecreasingMor714Decreasing
Hindon50278DecreasingKanhan1114DecreasingSurya74.4Increasing
Bharalu5058DecreasingTansa114IncreasingDigboi74.3Increasing
Pedhi4616.4IncreasingGhod10.513.5DecreasingChuntkol73.8Increasing
Chambal4248DecreasingGomti10.512DecreasingBrahmani6.85.6Increasing
Yamuna4184DecreasingChandrabhaga10.59.2IncreasingDhansiri6.82.4Increasing
Suswa3830IncreasingVenna1030DecreasingMorna6.620Decreasing
Godavari3760DecreasingPanzara1018DecreasingMahananda6.65.5Increasing
Satluj3240DecreasingKan1016DecreasingKuakhai6.55Increasing
Nambul30.519IncreasingTapi1016DecreasingDeepar Bill6.410.4Decreasing
Jalangi281.9IncreasingTitur1014DecreasingDisang6.33.2Increasing
Kshipra2825IncreasingManusmar102.7IncreasingBhavani6.293Decreasing
Varuna27.654DecreasingAmravati (Tapi)1012DecreasingTeesta6.24.4Increasing
Vindyadhari26.86.6IncreasingGirna1012DecreasingKansi6.14.9Increasing
Mutha23.568DecreasingWaghur108IncreasingKarola6.13.1Increasing
Bhima2238.5DecreasingVaitarna103.5IncreasingSonai64.5Increasing
Budhabalanga222.2IncreasingBhatsa103.4IncreasingPennar64.4Increasing
Mula-Mutha21.579DecreasingBurhidihing9.87.8IncreasingKalisot5.46.4Decreasing
Mula19.588.5DecreasingManer9.56IncreasingKali (M&M)4.38.4Decreasing
Pawana19.558DecreasingKadambayar9.43.4IncreasingMindhola48Decreasing
Dhadar1922DecreasingBrahmaputra9.26.3IncreasingShivna47Decreasing
Karmana1820.4DecreasingKoyna97.5IncreasingKathajodi3.922.5Decreasing
Nakkavagu1815IncreasingUmtrew8.88.5IncreasingBicholim3.98.1Decreasing
Patalganga1611IncreasingNira (Godavari)8.59.2DecreasingMahanadi3.614.3Decreasing
Krishna1610IncreasingBichia8.58IncreasingAssonora2.37Decreasing
Sirsa158IncreasingTungabhadra8.23IncreasingKhan1.3120Decreasing
Malei1.26Decreasing
Figure A1. The relationship between per capita GDP and COD per capita.
Sustainability 13 05882 g0a1
Figure A2. The relationship between per capita GDP and ammonia per capita.
Sustainability 13 05882 g0a2
Figure A3. The relationship between per capita GDP and sulphur dioxide.
Sustainability 13 05882 g0a3
Figure A4. The relationship between per capita GDP and nitrogen oxide per capita.
Sustainability 13 05882 g0a4

References

  1. Hansla, A.; Gamble, A.; Juliusson, A.; Gärling, T. The Relationships between Awareness of Consequences, Environmental Concern, and Value Orientations. J. Environ. Psychol. 2008, 28, 1–9. [Google Scholar] [CrossRef]
  2. Suraya, H.; Taha, I.M.; Hidayah, S.; Rina, M.A.; Anir, N.A. Social Media for Environmental Sustainability Awareness in Higher Education. Int. J. Sustain. High. Educ. 2017, 18, 474–491. [Google Scholar]
  3. Oyedeji, S.; Seffah, A.; Penzenstadler, B. A Catalogue Supporting Software Sustainability Design. Sustainability 2018, 10, 2296. [Google Scholar] [CrossRef] [Green Version]
  4. Durdyev, S.; Zavadskas, E.; Thurnell, D.; Banaitis, A.; Ihtiyar, A. Sustainable Construction Industry in Cambodia: Awareness, Drivers and Barriers. Sustainability 2018, 10, 392. [Google Scholar] [CrossRef] [Green Version]
  5. Bergeå, O.; Karlsson, R.; Hedlund-Åström, A.; Jacobsson, P.; Luttropp, C. Education for Sustainability as a Transformative Learning Process: A Pedagogical Experiment in Ecodesign Doctoral Education. J. Clean. Prod. 2006, 14, 1431–1442. [Google Scholar] [CrossRef]
  6. Lozano, R. Envisioning Sustainability Three-Dimensionally. J. Clean. Prod. 2008, 16, 1838–1846. [Google Scholar] [CrossRef]
  7. Stern, D.I.; Common, M.S.; Barbier, E.B. Economic Growth and Environmental Degradation: The Environmental Kuznets Curve and Sustainable Development. World Dev. 1996, 24, 1151–1160. [Google Scholar] [CrossRef]
  8. Hagerty, M.R. Testing Maslow’s Hierarchy of Needs: National Quality-of-Life across Time. Social Indic. Res. 1999, 46, 249–271. [Google Scholar] [CrossRef]
  9. Jun, S.-P.; Yoo, H.S.; Choi, S. Ten Years of Research Change Using Google Trends: From the Perspective of Big Data Utilizations and Applications. Technol. Forecast. Soc. Chang. 2018, 130, 69–87. [Google Scholar] [CrossRef]
  10. Li, X.; Shang, W.; Wang, S.; Ma, J. A Midas Modelling Framework for Chinese Inflation Index Forecast Incorporating Google Search Data. Electron. Commer. Res. Appl. 2015, 14, 112–125. [Google Scholar] [CrossRef]
  11. Goel, R.K.; Nelson, M.A.; Naretta, M.A. The Internet as an Indicator of Corruption Awareness. Eur. J. Political Econ. 2012, 28, 64–75. [Google Scholar] [CrossRef]
  12. Li, R.Y.M. An Economic Analysis on Automated Construction Safety: Internet of Things, Artificial Intelligence and 3D Printing; Springer: Singapore, 2018. [Google Scholar]
  13. Zyoud, S.e.H.; Waring, W.S.; Al-Jabi, S.W.; Sweileh, W.M. Global Cocaine Intoxication Research Trends during 1975–2015: A Bibliometric Analysis of Web of Science Publications. Subst. Abuse Treat 2017, 12, 6. [Google Scholar] [CrossRef] [PubMed] [Green Version]
  14. Clarivate Analytics. Web of Science Core Collection; Clarivate Analytics: Boston, MA, USA, 2018; Available online: https://clarivate.com/products/web-of-science/web-science-form/web-science-core-collection (accessed on 4 September 2018).
  15. De Moya-Anegón, F.; Chinchilla-Rodríguez, Z.; Vargas-Quesada, B.; Corera-Álvarez, E.; Muñoz-Fernández, F.J.; González-Molina, A.; Herrero-Solana, V. Coverage Analysis of Scopus: A Journal Metric Approach. Scientometrics 2007, 73, 53–78. [Google Scholar] [CrossRef] [Green Version]
  16. Elsevier. Scopus. Available online: https://www.elsevier.com/__data/assets/pdf_file/0008/208772/ACAD_R_SC_FS.pdf (accessed on 5 September 2018).
  17. Lee, J.M.; Hanna, S.D. Savings Goals and Saving Behavior from a Perspective of Maslow’s Hierarchy of Needs. J. Financ. Couns. Plan. 2015, 26, 129–147. [Google Scholar] [CrossRef]
  18. Ivtzan, I.; Thompson, H.; Bernard, I.; Sekhon, M.; Hart, R. Wellbeing through Self-Fulfilment: Examining Developmental Aspects of Self-Actualization. Humanist. Psychol. 2013, 41, 119–132. [Google Scholar] [CrossRef]
  19. Shostrom, E.L. Personal Orientation Inventory; Educational and Industrial Testing Service: San Diego, CA, USA, 1963. [Google Scholar]
  20. Custers, R.; Aarts, H. The Unconscious Will: How the Pursuit of Goals Operates Outside of Conscious Awareness. Science 2010, 329, 47. [Google Scholar] [CrossRef]
  21. Dizén, M.; Berenbaum, H.; Kerns, J. Emotional Awareness and Psychological Needs. Cogn. Emot. 2005, 19, 1140–1157. [Google Scholar] [CrossRef]
  22. Yawson, D.; Armah, F.; Pappoe, A.N. Enabling Sustainability: Hierarchical Need-Based Framework for Promoting Sustainable Data Infrastructure in Developing Countries. Sustainability 2009, 1, 946. [Google Scholar] [CrossRef] [Green Version]
  23. Doherty, M. Jurisprudence: The Philosophy of Law (Sourcebook.); Old Bailey Press: London, UK, 2003. [Google Scholar]
  24. Yen, G.-F.; Yang, H.-T. Does Consumer Empathy Influence Consumer Responses to Strategic Corporate Social Responsibility? The Dual Mediation of Moral Identity. Sustainability 2018, 10, 1812. [Google Scholar] [CrossRef] [Green Version]
  25. Romdn, E. A Race Approach to International Law (Rail): Is There a Need for Yet Another Critique of International Law? UC Davis Law Rev. 1999, 33, 1519–1546. [Google Scholar]
  26. Tarlock, A.D. Is There a There in Environmental Law? J. Land Use Environ. Law 2004, 19, 213–254. [Google Scholar]
  27. Leiter, B. Positivism, Formalism, Realism. Columbia Law Rev. 1999, 99, 1138–1164. [Google Scholar] [CrossRef] [Green Version]
  28. Kelsen, H. Pure Theory of Law; University of California Press: Berkeley, CA, USA, 1934. [Google Scholar]
  29. Nalbandian, E.G. Early Legal Positivism: Bentham & Austin. Mizan Law Rev. 2008, 2, 147–155. [Google Scholar]
  30. Berggren, N. Legal Positivism & Property Rights: A Critique of Hayek & Peczenik. Const. Political Econ. 2006, 17, 217–235. [Google Scholar]
  31. Leiter, B. Marx, Law, Ideology, Legal Positivism. Virginia Law Rev. 2015, 101, 1179–1196. [Google Scholar] [CrossRef] [Green Version]
  32. Hart, H.L.A. The Concept of Law; Oxford University Press: Oxford, UK, 1961. [Google Scholar]
  33. Coleman, J.L.; Leiter, B. Legal Positivism. In A Companion to the Philosophy of Law and Legal Theory; Patterson, D., Ed.; Wiley-Blackwell: Hoboken, NJ, USA, 1996. [Google Scholar]
  34. Raz, J. About Morality and the Nature of Law. Am. J. Jurisprud. 2003, 48, 1–15. [Google Scholar] [CrossRef] [Green Version]
  35. Brownlee, K.; Child, R. Can the Law Help Us to Be Moral? Jurisprudence 2018, 9, 31–46. [Google Scholar] [CrossRef] [Green Version]
  36. Coase, R.H. The Problem of Social Costs. J. Law Econ. 1960, 3, 1–44. [Google Scholar] [CrossRef]
  37. Powers, P.R. Offending Heaven and Earth: Sin and Expiation in Islamic Homicide Law, Powers. Islam. Law Soc. 2007, 14, 42. [Google Scholar] [CrossRef]
  38. Li, R.Y.M. Achieving Compliance with Environmental Health-Related Land Use Planning Conditions in Hong Kong: Perspectives from Traditional Motivation Theories. J. Environ. Health 2009, 71, 177–188. [Google Scholar]
  39. Li, R.Y.M. Building Our Sustainable Cities; Common Ground Publishing: Champaign, IL, USA, 2011. [Google Scholar]
  40. Schauer, F. The Path Dependence of Legal Positivism. Va. Law Rev. 2015, 101, 957–976. [Google Scholar]
  41. Warren, C.K. Blowing the Whistle on Environmental Law: How Congress Can Help the EPA Enlist Private Resources in the Fight to Save the Planet. Boston Coll. Environ. Aff. Law Rev. 2015, 42, 195–228. [Google Scholar]
  42. Proulx, R.; Massicotte, P.; Pepino, M. Googling Trends in Conservation Biology. Conserv. Biol. 2014, 28, 44–51. [Google Scholar] [CrossRef] [PubMed]
  43. Yang, X.; Pan, B.; Evans, J.A.; Lv, B. Forecasting Chinese Tourist Volume with Search Engine Data. Tour. Manag. 2015, 46, 386–397. [Google Scholar] [CrossRef]
  44. Yagi, M. How Do You Interpret Google Trends’s Search Volume Index? Available online: https://www.quora.com/How-do-you-interpret-Google-Trendss-search-volume-index (accessed on 2 July 2018).
  45. Brigo, F.; Igwe, S.C.; Ausserer, H.; Nardone, R.; Tezzon, F.; Bongiovanni, L.G.; Trinka, E. Why Do People Google Epilepsy?: An Infodemiological Study of Online Behavior for Epilepsy-Related Search Terms. Epilepsy Behav. 2014, 31, 67–70. [Google Scholar] [CrossRef] [PubMed]
  46. Bovea, M.D.; Powell, J.C. Developments in Life Cycle Assessment Applied to Evaluate the Environmental Performance of Construction and Demolition Wastes. Waste Manag. 2016, 50, 151–172. [Google Scholar] [CrossRef] [PubMed]
  47. Bonet, M.; Fernández-Quijada, D.; Ribes, X. The Changing Nature of Public Service Radio: A Case Study of ICAT-FM. Convergence 2011, 17, 177–192. [Google Scholar] [CrossRef]
  48. Appleton, J.V.; Cowley, S. Health Visiting Assessment Processes under Scrutiny: A Case Study of Knowledge Use During Family Health Needs Assessments. Int. J. Nurs. Stud. 2008, 45, 682–696. [Google Scholar] [CrossRef]
  49. Li, R.; Li, H. Have Housing Prices Gone With the Smelly Wind? Big Data Analysis on Landfill in Hong Kong. Sustainability 2018, 10, 341. [Google Scholar] [CrossRef] [Green Version]
  50. Argyrou, A. Making the Case for Case Studies in Empirical Legal Research. Utrecht Law Rev. 2017, 13, 95–113. [Google Scholar] [CrossRef] [Green Version]
  51. Environmental Performance Index. Country Rankings; Yale University: New Haven, CT, USA, 2018; Available online: https://epi.envirocenter.yale.edu/epi-topline (accessed on 15 September 2018).
  52. Bloom, R.; Amber, K.T.; Hu, S.; Kirsner, R. Google Search Trends and Skin Cancer: Evaluating the Us Population’s Interest in Skin Cancer and Its Association with Melanoma Outcomes. JAMA Dermatol. 2015, 151, 903–905. [Google Scholar] [CrossRef] [PubMed] [Green Version]
  53. Pautasso, M. Ten Simple Rules for Writing a Literature Review. PLoS Comput. Biol. 2013, 9, e1003149. [Google Scholar] [CrossRef] [PubMed]
  54. Green, A. You Can’t Pay Them Enough: Subsidies, Environmental Law, and Social Norms. Harvard Environ. Law Rev. 2006, 30, 407–440. [Google Scholar]
  55. Spence, D.B. Paradox Lost: Logic, Morality, and the Foundations of Environmental Law in the 21st Century. Columbia J. Environ. Law 1995, 20, 145–160. [Google Scholar]
  56. Hays, S.; Hays, B. Beauty, Health, and Performance: Environmental Politics in the United States, 1955–1985; Cambridge University Press: Cambridge, UK, 1989. [Google Scholar]
  57. Hays, S. Environmental Political Culture and Environmental Political Development: An Analysis of Legislative Voting, 1971-1989. Environ. Hist. Rev. 1974, 16, 1–22. [Google Scholar] [CrossRef]
  58. Kempton, W.M.; Boster, J.S.; Hartley, J.A. Environ. Values Am. Cult; The MIT Press: Cambridge, MA, USA, 1996. [Google Scholar]
  59. Drake, B. How Americans View the Top Energy and Environmental Issues. Pew Research Center. Available online: http://www.pewresearch.org/key-data-points/environment-energy-2 (accessed on 2 July 2018).
  60. Percival, R.V.; Zhao, H. Role of Civil Society in Environmental Governance in the United States and China. Duke Environ. Law Policy 2014, 24, 141–182. [Google Scholar]
  61. Cao, M. Current and Future Trends in Chinese Environmental and Energy Law and Policy. Pace Int. Law Rev. 2006, 18, 253–268. [Google Scholar] [CrossRef] [Green Version]
  62. Lam, K.Y.; Wong, Y.L.; Lam, K.M. Chinese Culture Issues; Hong Kong Educational Publishing Company: Hong Kong, 1998. [Google Scholar]
  63. Nyambok, E.; Kastner, J. United States Import Safety, Environmental Health, and Food Safety Regulation in China. J. Environ. Health 2012, 74, 28–34. [Google Scholar]
  64. Prodi, G.; Nicolli, F.; Frattini, F. State Restructuring and Subnational Innovation Spaces Across Chinese Prefectures. Environ. Plan. C Politics Space 2017, 35, 94–112. [Google Scholar] [CrossRef]
  65. Prodi, G.; Frattini, F.; Nicolli, F. The Diffusion and Embeddedness of Innovative Activities in China. Econ. Politica 2018, 35, 71–106. [Google Scholar] [CrossRef]
  66. Sun, C.; Yuan, X.; Xu, M. The Public Perceptions and Willingness to Pay: From the Perspective of the Smog Crisis in China. J. Clean. Prod. 2016, 112, 1635–1644. [Google Scholar] [CrossRef]
  67. International Council on Clean Transportation. Early Adoption of China 5/V Vehicle Emission Standards in Guangdong Province; International Council on Clean Transportation: San Francisco, CA, USA, 2015; Available online: http://www.theicct.org/sites/default/files/publications/ICCTupdate_Guangdong-China5V_20150508.pdf (accessed on 15 September 2018).
  68. Liu, A. China’s Stage Vi Emission Regulation Will Be Published By the End of 2016. En.TireWorld.Com. 15 September 2015. Available online: http://en.tireworld.com.cn/Industry/2015915/2739.html (accessed on 2 July 2018).
  69. Shao, Z.; Wagner, D.V. Costs and Benefits of Motor Vehicle Emission Control Programs in China; International Council on Clean Transportation: Washington, DC, USA, 2015. [Google Scholar]
  70. Ryan, E. The Elaborate Paper Tiger: Environmental Enforcement and the Rule of Law in China. Duke Environ. Law Policy 2013, 24, 183–239. [Google Scholar]
  71. Government. D.S.P.S. Sichuan Province Dazhou City’s Government’s Target on Reducing the Major Pollutants. Available online: http://www.chinalawedu.com/news/1200/22598/22624/22999/2008/10/li535445513712201800228490-0.htm (accessed on 2 July 2018).
  72. Edmons, R.L. Studies on China’s Environment. China Q. 1998, 156, 725–732. [Google Scholar] [CrossRef]
  73. Amirante, D. Environmental Courts in Comparative Perspective: Preliminary Reflections on the National Green Tribunal of India. Pace Environ. Law Rev. 2012, 29, 441–535. [Google Scholar]
  74. Das, P.; Tamminga, K.R. The Ganges and the Gap: An Assessment of Efforts to Clean a Sacred River. Sustainability 2012, 4, 1647. [Google Scholar] [CrossRef] [Green Version]
  75. Tomalin, E. Bio-Divinity and Biodiversity: The Limits to Religious Environmentalism for India; Ashgate Publishing Group: Faham, UK, 2009. [Google Scholar]
  76. United States Environmental Protection Agency. Laws & Regulations. Available online: http://www.epa.gov (accessed on 8 August 2015).
  77. Kentucky Water Watch. Water Quality Parameters. Available online: http://www.state.ky.us/nrepc/water/ramp/rmtests.htm (accessed on 2 July 2018).
  78. Yue, X.; Wu, Y.; Hao, J.; Pang, Y.; Ma, Y.; Li, Y.; Li, B.; Bao, X. Fuel Quality Management Versus Vehicle Emission Control in China, Status Quo and Future Perspectives. Energy Policy 2015, 79, 87–98. [Google Scholar] [CrossRef]
  79. Environmental Protection Central Unit and Qualtiy Control Central Unit. In Environmental Quality Standard for Surface Water. Available online: http://english.mep.gov.cn/standards_reports/standards/water_environment/quality_standard/200710/W020061027509896672057.pdf (accessed on 2 July 2018).
  80. Central Pollution Control Board Ministry of Environment and Forests Government of India. Environmental Standard. Available online: http://cpcb.nic.in/index.php (accessed on 2 July 2018).
  81. Government of India Ministry of Environment & Forests Environmental Information System Central Pollution Control Board. National Air Quality Monitoring Programme (N.A.M.P). Available online: http://cpcbenvis.nic.in/airpollution/finding.htm (accessed on 2 July 2018).
  82. Malik, O. Global Database of National Wastewater Treatment; Yale Center for Environmental Law & Policy: New Haven, CT, USA, 2013. [Google Scholar]
  83. World Health Organization. Data. Available online: http://www.who.int/en (accessed on 2 July 2018).
  84. Pino, G. The Place of Legal Positivism in Contemporary Constitutional States. Law Philos. 1999, 18, 513–536. [Google Scholar] [CrossRef]
  85. Stumme, A. A Snapshot of Water in Africa. WorldHelp. 20 March 2018. Available online: https://worldhelp.net/a-snapshot-of-water-in-africa (accessed on 31 August 2018).
  86. Ban, J.; Zhou, L.; Zhang, Y.; Brooke Anderson, G.; Li, T. The Health Policy Implications of Individual Adaptive Behavior Responses to Smog Pollution in Urban China. Environ. Int. 2017, 106, 144–152. [Google Scholar] [CrossRef]
  87. Li, R.Y.M.; Cheng, K.Y.; Shoaib, M. Walled Buildings, Sustainability, and Housing Prices: An Artificial Neural Network Approach. Sustainability 2018, 10, 1298. [Google Scholar] [CrossRef] [Green Version]
  88. Bovea, M.D.; Powell, J.C. Alternative Scenarios to Meet the Demands of Sustainable Waste Management. J. Environ. Manag. 2006, 79, 115–132. [Google Scholar] [CrossRef] [PubMed]
  89. Nguyen, T.N.; Lobo, A.; Nguyen, H.L.; Phan, T.T.H.; Cao, T.K. Determinants Influencing Conservation Behaviour: Perceptions of Vietnamese Consumers. J. Consum. Behav. 2016, 15, 560–570. [Google Scholar] [CrossRef]
  90. Nguyen, T.T.H.; Yang, Z.; Nguyen, N.; Johnson, L.W.; Cao, T.K. Greenwash and Green Purchase Intention: The Mediating Role of Green Skepticism. Sustainability 2019, 11, 2653. [Google Scholar] [CrossRef] [Green Version]
  91. Crabbe, M.J.C.; Martinez, E.; Garcia, C.; Chub, J.; Castro, L.; Guy, J. Is capacity building important in policy development for sustainability? A case study using action plans for sustainable Marine Protected Areas in Belize. Soc. Nat. Resour. 2010, 23, 181–190. [Google Scholar] [CrossRef]
  92. Wakeman, S.W.; Tsalis, G.; Jensen, B.B.; Aschemann-Witzel, J. Seeing the Issue Differently (Or Not at All): How Bounded Ethicality Complicates Coordination Towards Sustainability Goals. J. Bus. Ethics 2021, 1–14. [Google Scholar]
  93. Kristian, S.; Nielsen, K.S.; Hofmann, W. Motivating sustainability through morality: A daily diary study on the link between moral self-control and clothing consumption. J. Environ. Psychol. 2021, 2021. 73, 101551. [Google Scholar] [CrossRef]
Figure 1. Maslow’s theory of needs from a nation’s perspective [17,22].
Sustainability 13 05882 g001
Figure 2. Relationship between sustainability and sustainable development awareness, Maslow’s needs theory, and level of economic development.
Sustainability 13 05882 g002
Figure 3. Top five searches for the keyword “sustainability” by country from 2004 to 2018. Developing countries have blue arrows next to their names (on 2 July 2018).
Sustainability 13 05882 g003
Figure 4. Top five searches for the keyword “sustainability” by town/city from 2004 to 2018 on 2 July 2018).
Sustainability 13 05882 g004
Figure 5. Top five searches for the keyword “sustainable development” by country from 2004 to 2018. Developing countries have blue arrows next to their names (on 2 July 2018).
Sustainability 13 05882 g005
Figure 6. Top five searches for the keyword “sustainable development” by town/city from 2004 to 2018; developed countries have blue arrows beside their names (on 2 July 2018).
Sustainability 13 05882 g006
Table 1. Top 10 most productive countries with regard to “sustainability” and “sustainable development” publications indexed in Scopus database from 1981 to 2019.
Country Sustainability (# Publications)CountrySustainable Development (# Publications)
United States17,813United States23,145
United Kingdom9176China20,681
Australia5673United Kingdom10,911
China4564Germany5793
Germany4526Australia5516
Italy4448Italy4973
Canada4247India4965
Spain3356Canada4955
Netherlands3307France3630
Brazil2758Netherlands3499
Note: Developing countries appear in bold. # = number of.
Table 2. Top 10 institutions producing “sustainability” and “sustainable development” publications indexed in Scopus database from 1981 to 2019.
InstitutionSustainability (# Publications)InstitutionSustainable Development (# Publications)
Wageningen University Research907Chinese Academy of Sciences2153
Chinese Academy of Sciences897Ministry of Education China1073
Arizona State University554University of California System937
The University of British Columbia544Wageningen University Research Centre676
Universidade de Sao Paulo456Delft University of Technology644
Delft University of Technology449Tsinghua University635
University of Queensland427Beijing Normal University525
University of Cambridge369Universiti Technologi Malaysia500
University of California, Berkeley365Universidade de Sao Paulo496
ETH Zurich348The University of British Columbia470
Note: Institutions located in developing countries appear in bold. # = number of.
Table 3. Top ten most productive countries publishing articles containing the keyword “sustainable” from 1974 to 2018 and “sustainable development” from 1981 to 2018 in Web of Science.
CountrySustainability (# Publications)CountrySustainable Development (# Publications)
United States29,659China18,818
United Kingdom11,983United States14,771
Australia9357United Kingdom8477
China7867Australia5472
Canada7046Germany5143
Germany6996Canada4313
Spain5951Italy4168
Italy6757India3638
Netherlands5124Netherlands3568
Brazil4794Spain3522
Note: Developing countries appear in bold. # = number of.
Table 4. Top ten most productive institutions publishing articles containing the keyword “sustainability” from 1974 to 2018 and “sustainable development” from 1981 to 2018 in Web of Science.
InstitutionSustainability (# Publications)InstitutionSustainable Development (# Publications)
University of California2070Chinese Academy of Sciences2010
University of London1375University of London1084
Wageningen University Research1367University of California System937
Chinese Academy of Sciences1307Wageningen University Research878
State University System of Florida1166Centre National De La Recherche Scientifque Cnrs734
United States Department of Agriculture1144Helmholtz Association585
University of British Columbia913State University System of Florida 558
Institut National De La Recherche Agronomique Inra
Centre National De La Recherche
881University of Queensland540
Scientifque Cnrs864University of Chinese Academy of Sciences
CAS
524
University of North Carolina864Institut National De La Recherche Agronomique Inra492
Note: Institutions from developing countries appear in bold. # = number of.
Table 5. Environmental laws (motor emission regulations) are implemented at different times in different regions [69].
Region of ChinaBeijingShanghaiGuangzhou, ShenzhenNationwide
Name of the environmental lawChina VChina VIChina VChina VIChina VChina VIChina VChina VI
Current2013N/A2014N/AN/AN/AN/AN/A
Baseline201320162014N/A2015N/A2018N/A
Improved20132016201420182015201820182021
World Class20132016201420162015201620162018
Table 6. Improvement in air quality in the three periods 1980 vs. 2013, 1990 vs. 2013, and 2000 vs. 2013 in the US [76].
Pollutants1980 vs. 20131990 vs. 20132000 vs. 2013
Carbon Monoxide (CO)−84−76−59
Ozone (O3) (8-hr)−33−23−18
Lead (Pb)−92−87−60
Nitrogen Dioxide (NO2) (annual)−58−50−40
Nitrogen Dioxide (NO2) (1-h)−60−46−29
PM10 (24-hr)---−34−30
PM2.5 (annual)------−34
PM2.5 (24-hr)------−34
Sulfur Dioxide (SO2) (1-h)−81−76−62
Table 7. Environmental Protection Central Unit and Quality Control Central Unit’s standard in China [79].
UnitIIIIIIIVV
Dissolved oxygen (mg/L)7.56532
pH value6–9
COD (mg/L)1515203040
Table 8. Water quality criteria in China and India (Central Pollution Control Board, Ministry of Environment and Forests, Government of India) [79,80].
Designated-Best-Use (Mentioned in India Only)Class of Water (China/India)Criteria in China
Dissolved Oxygen (mg/L)/
COD (mg/L)
Criteria in India
pH Value/BOD/Dissolved Oxygen/Total Coliforms Organism/Free Ammonia etc
Drinking water sourceI/A7.5/15pH value Between 6.5 and 8.5
5 days 20 degree Celsius 2 mg/L or less
Total Coliforms Organism MPN/100 mL at 50 or less
Outdoor bathing (organized)II/B6/15pH value between 6.5 and 8.5 or
Total Coliforms Organism MPN/100 mL at 500
Dissolved Oxygen 5 mg/L or more
Biochemical Oxygen Demand (BOD) 5 days 20 degree Celsius 3 mg/L or less
Drinking water source after disinfection and treatmentIII/C5/20Total Coliforms Organism MPN/100 mL at 5000 or less
pH between 6 and 9
Dissolved Oxygen 4 mg/L or more
Biochemical Oxygen Demand 5 days 20 °C 3 mg/L or less
Propagation of fisheries and wildlifeIV/D3/30Free Ammonia (N) 1.2 mg/L or less
pH between 6.5 and 8.5
Dissolved Oxygen at 4 mg/L or more
Industrial cooling, irrigation, controlled waste disposalV/E2/40pH between 6.0 and 8.5
Sodium absorption Ratio maximizes at 26
Electrical Conductivity at 25 °C micro mhos/cm max2250
Boron maximizes at 2 mg/L
Table 9. Air Quality Standards Clean Air Act in the US and India [69,76].
PollutantIndiaLevel in the US/Averaging Time
(Primary #, Secondary ##, Primary and Secondary ###)
Carbon Monoxide2/ 8 h (mg/m3)
4/1 h (mg/m3)
9 ppm/8-h #
35 ppm/ 1-h #
Lead0.5/annual (μg/m3)
1/24 h (μg/m3)
0.15 μg/m3 / Rolling 3 month average ###
Nitrogen Dioxide40/annual (μg/m3)
80/24 h(μg/m3)
100 ppb/1-h #
53 ppb/ Annual ###
Ozone100/8-h (μg/m3)
180/1 h(μg/m3)
0.075 ppm/8-h ###
ParticulatePM2.540/annual
60/24 h
12 μg/m3 Annual #
15 μg/m3 Annual ##
35 μg/m3/24-h ###
PM1060/annual
100/24-h
150 μg/m324-h ###
Sulfur Dioxide50/annual
80/24 h
75 ppb/1-h #
0.5 ppm/3-h ##
Note: #, Primary standards; ##, Secondary standards; ###, Primary and Secondary standards. # Primary standards provide public health protection to “sensitive” populations (e.g., asthmatics, the elderly, and children). ## Secondary standards provide public welfare protection (e.g., crops, damage to animals, vegetation, buildings, and decreased visibility).
Table 10. Air and water pollution in China, India, and the US [65].
Water PollutionAir Pollution
CountryPopulationImprovedImprovedDiarrhea Daily/1000 Capita per YearAnnual PM10 [mg/m3]AnnualUrban
Population
(%)
(Thousands)Water (%)Sanitation (%)PM2.5 [mg/m3]
The US296,8441001000.2241272
China1,304,98377442.5804137
India1,116,985863314845919
Publisher’s Note: MDPI stays neutral with regard to jurisdictional claims in published maps and institutional affiliations.

