Article

Effects of Dual Credit Policy and Consumer Preferences on Production Decisions in Automobile Supply Chain

School of Business, East China University of Science and Technology, Shanghai 200237, China
*
Author to whom correspondence should be addressed.
Sustainability 2021, 13(11), 5821; https://doi.org/10.3390/su13115821
Submission received: 14 April 2021 / Revised: 16 May 2021 / Accepted: 18 May 2021 / Published: 21 May 2021

Abstract

:
New energy vehicles have a significant advantage in energy saving and environmental pollution reduction in the transportation industry; however, they are still at a disadvantage in the market competition. The Chinese government has introduced lots of policy measures to promote the mass adoption of new energy vehicles (NEVs), specifically the dual credit policy. Moreover, consumer’s preferences are vital factors in their purchase decision making. This study focuses on the production decisions of automobile manufacturers under the decentralized and centralized supply chain, considering the factors of both consumer preferences and dual credit policy. First, under the centralized decision mode, higher demand drives the manufacturer to expand production; however, retailers’ profits are harmed. With the increase in consumers’ environmental preference and cognition of endurance ability, market pricing and demand increase under the decentralized decision mode. The cross effects of preferences bring more profits for manufacturers and retailers. Second, the difference in prices and profits widens, under the two decision modes, as increases in consumer preferences’ value. When consumers have higher environmental preferences, manufacturers and retailers should increase the new energy vehicle pricing. Otherwise, they should decrease pricing to increase the market penetration ratio. In addition, the impacts of one preference on the profit difference are related to the other preference.

1. Introduction

The transportation industry is the major contributor to greenhouse gas emissions and the resulting global climate crisis [1], owing to new energy vehicles’ potential of ensuring travel, reducing harmful gas emissions, and significant advantages of health and environment. It has become an important direction of the transformation of the global automotive industry [2,3]. Nation and local governments have introduced policy measures to support the development of the new energy vehicle industry, i.e., product subsidies, free of purchase tax, etc. Fiscal subsidies and taxation policies promote the diffusion of new energy vehicles [4]. Financial subsidies for research and development investment reduce the manufacturer’s burden and encourage automobile manufacturers to focus on core technology research. It is beneficial to promote the development and market application for new automobile technologies [5]. However, according to the China Association of Automobile Manufacturers, in 2019, the productions and sales for new energy vehicles were only 1.242 million and 1.206 million, respectively. The passenger car market is still dominated by conventional fuel vehicles. By the end of 2020, the market share of new energy vehicles is only 5.4%. Thus, the realization of auto industries’ transformation and upgrading is a complicated task.
Financial subsidy plays an important role in the promotion of electric vehicle adoption; however, it also results in a great financial burden for the government and weakens the technology innovation incentive of automobile manufacturers [6,7]. To upgrade the new energy vehicle technology and reduce the fuel consumption of traditional vehicles, the “Measures for the Parallel Management of Average Fuel Consumption and EV Credits for Passenger Car Companies (Dual-Credit Policy)” is introduced in 2017 [8]. With the policy release, the market share of new energy vehicles is continuously improving [9]. Furthermore, in 2020, a new version of the dual credit policy is issued to better drive technological innovation and improve energy saving.
The dual credit policy has indeed guided manufacturers to produce new energy vehicles. However, demand still depends on the consumers’ acceptance [10,11]. When consumers consider purchasing electric vehicles, the price may be significantly affected electric vehicles’ adoption. However, if the price is second, consumers mind other attributes of electric vehicles [12], such as cruising capability, colors, and environmental friendliness, etc. These internal and external factors have greatly affected new energy vehicles’ acceptance [13,14]. Electric vehicles are environment-friendly products, and driving an electric vehicle is regarded as an environment-friendly behavior [15]. The pride, positive feeling, and environmental friendliness have a positive impact on the new energy vehicles’ adoption. In some studies, however, noneconomic attributes have been weakened or even ignored. Under the new policy, we analyze the impact on consumer adoption and supply chain operation decisions, combining economic and noneconomic factors.
The remainder of the paper is structured as follows: In Section 2, relevant literature is reviewed. Section 3 introduces the assumptions and formulates the decision models of this paper. Section 4 and Section 5 deal with the game results, proof, and analysis; Section 6 deals with numerical simulation; and Section 7 provides a summing up.

2. Literature Review

This paper studies the effects of consumer preferences in the supply chain, which consists of one manufacture and two retailers, under the dual credit policy. As explained earlier, prior studies related to this paper consider only one of the two sensitivities. Thus, we combine two factors in a new scenario and review them. The first stream deals with production decisions of the auto supply chain under dual credit policy. The second stream deals with operational decisions considering consumer preferences of demand.

2.1. Production Decisions of Auto Supply Chain under Dual Credit Policy

Typical supply chain decisions are considered by this paper, such as production and pricing. Moorthy studies consumer preferences, costs, and price competition in the competitive product strategy of a firm, and the results show that the firm equilibrium strategy should be to differentiate its product from its competitor [16]. Prior literature mainly focuses on production [17,18], pricing [4,19], recycling of vehicles [20,21], sale efforts, etc. Under the pressure of environmental factors, the Chinese government publishes the support policy to develop the new electric vehicles and encourage automobile manufacturers and infrastructure service providers willing to develop EV business streams on a large scale [22,23]. Research on battery recycling also is rising [17,24,25,26,27].
Incentive policies play an important role in the early stage of new electric vehicle promotion. Some studies confirm that subsidy policy is effective [5,28]. Liu et al. analyze the policy data about the Chinese new energy vehicles industry from 2006 to 2018. The results suggest that this policy is effective, especially subsidy schemes [29]. Wang et al. analyze the effectiveness of electric vehicle policies based on the system dynamics model. The results show that the subsidy policy leads to a sharp increase in the electric vehicle market share in China. Subsidy policies for electric vehicles promote the adoption of electric vehicles in the market by reducing production costs or prices and are widely used by governments to promote the large-scale adoption of electric vehicles [30]. Shao et al. compare the subsidy and price discount scheme; the results show that the government has lower expenditures under the subsidy incentive scheme [4]. Subsidy policy accelerates the deployment of new energy vehicles to higher market penetration rates [31].
Subsidy policy widens the deployment of new energy vehicles, but it also causes a greater financial burden [32]. Hence, the government promulgated the dual credit policy (DCP), which is the substitution of subsidy incentive policies, to guide the vehicle industry development. The manufacturer needs to make new production and pricing strategies to achieve NEV credits. Yu et al. analyze the policy substitution influences for the production and pricing strategies. Under both the subsidy and credit policy, the benefits of EV increase, while the benefits of fuel vehicles reduce. Manufacturers and retailers are more motivated to produce and sell electric vehicles [33]. Cheng et al. study the optimal strategies for both fuel vehicle automaker and new energy vehicle (NEV) automaker in a stable credit and with credit trading risk market. The results show that the unified production strategy is always the most profitable in a stable credit market, and cooperation has proved to be the best strategy for dealing with risks in unstable credit markets. Furthermore, maintaining relatively high credit prices is usually conducive to promote the expansion of new energy vehicles [34]. Li et al. analyze the impacts of dual credit policy and subsidy policy on NEVs and conventional vehicles production decisions from an across-chain perspective, and the results suggest that the increase in profits of new energy vehicles supply chain under the dual credit policy but the decrease in profits of fuel vehicles supply chain [3]. The survival pressure prompts automobile manufacturers to improve fuel efficiency [35]. Policies have contributed to the emergence of new technologies. The dual credit policy not only improves fuel economy and promotes the diffusion of new energy vehicles but also promotes the development of energy-saving technologies and increases consumers’ interest in energy saving and emission reduction [36].
The new policy significantly complicates the production and pricing optimization problem for both the manufacturer and the retailer. The outstanding point is that new energy vehicles have changed the market product structure. Hence, the operation decision research is necessary under dual credit policy.

2.2. Operational Decisions Considering Consumer Preferences of Demand

Consumers may have no hesitation to choose fuel vehicles before new energy vehicles promotion. However, they need to determine choosing a fuel vehicle or a new energy vehicle now. When the new energy vehicle is adopted, they not only mind product quality and price but also are affected by the product’s environmental attributes [37]. As consumers have become more aware of energy conservation and environmental protection, it is widely acknowledged that consumers prefer green products [38]. Hence, one important factor to consider in studying new energy vehicles is the interaction between heterogeneous consumers and the secondary market [39,40].
From the consumer’s perspective, many studies have verified the impact of consumer preferences. Hardman S. [41] analyzes the nonfinancial policy for the new energy vehicles’ adoption, and the results suggest that policymakers should consider consumer preferences to identify the regional policy. Moons and Pelsmacker confirm factors in determining consumer’s use of electric vehicles. The research finds that attitude and emotion are firstly important factors that affect the adoption of new energy vehicles, and subjective factors are second [42]. Perceived value [43], proenvironmental attitude, and environmental concerns affect the consumers’ electric vehicles’ purchase intention positively [44]. As consumers become more aware of the reliability of electric vehicles, the overall acceptance of electric vehicles increase [45].
With environmental protection and low-carbon awareness increasing in consumers, some scholars have considered the impacts of consumer low-carbon preference in the supply chain [46,47,48]. Consumer green preferences can significantly affect the products’ green level of manufacturers and retailers [49]. Xia et al. found that manufacturers and retailers need do great efforts for the green level of products when the consumers’ low-carbon awareness level increases [50]. Zhang et al. discuss the effects of consumer environmental awareness and retailer’s fairness concerns on pricing and quality decision for green products. The results suggest that the environmental friendliness of products increases following consumer’s environmental awareness increases [51]. Gong et al. consider green consumption and analyze the impact of the heterogeneous consumer’s market size change on supply chain profits. As the growth of environmental consumer groups, the market penetration rate of green products increases [52]. The growth in green consumption drives the innovation of green technologies. The increase in the market share of green products drives the technological progress of nongreen products [53]. Debabrata et al. show that consumers’ green sensitivity has an impact on the cost sharing of the supply chain. The cost-sharing contract can improve supply chain efficiency [54]. The right strategy can create a win–win result for supply chain members [55].
Differing with prior studies that consider only one of the two sensitivities, this paper comprehensively considers the dual preferences which are the cruising capability and environmental preference.

2.3. Literature Review Summary

In the papers reviewed above, some scholars have studied the operational decisions in supply chains. Consumers have become more aware of energy conservation and environmental protection and the attention and preference of green products. Moreover, manufacturers and retailers face new development challenges under tightened dual credit policies [56]. To fill the gap, under the new industry environment, we comprehensively analyze the impacts of consumers’ product performance preferences and environmental preferences in the supply chain production decisions; the cross-effects of preferences are also analyzed.

3. Assumptions, Notations and Models

We study a two-stage supply chain consisting of a manufacturer and two retailers (see Figure 1) and give the optimal solutions under the decentralized and centralized decision model. The manufacturer produces two types of vehicles under the dual credit policy, and different retailers sell them. The consumer not only cares about the price but also pays more attention to the cruising capability and environmental friendliness of vehicles. Thus, we make some assumptions and build the basic model.

3.1. Assumptions

Assumption 1.
The two factors of cruising capability and environmental preferences are mainly considered by this paper. The consumer income, educational background, and other factors will be ignored.
Assumption 2.
The cruising capability and environmental friendliness represent inside and outside characteristics of vehicles. Recognition for cruising capability represents the internal preference of consumers for the product. The degree of environmental friendliness is the consumer’s external preference for during the product use, which represents the consumer’s concern for the environment. The vehicles of cruising capability h , h [ 0 , 1 ] . Recognition for cruising capability  δ ,   δ [ 0 , 1 ] . Consumers’ willingness to pay for green  η , η ~ U ( 0 , 1 ) [57].
Assumption 3.
The unit cost of fuel vehicles is c f , and the unit cost of new energy vehicles is c n . There is the unit cost of new energy vehicles is greater than fuel vehicles, that is,  c f < c n [3,58].
Assumption 4.
According to the dual credit policy for passenger vehicles, manufacturers produce new energy vehicles to obtain positive credit, and the NEV credit coefficient is λ n . Manufacturers produce fuel vehicles to obtain negative credit, and the credit coefficient is  λ f . (The pressure of dual credit policy on enterprises is still greater. We focus on excessive emissions from conventional energy vehicles.) Let q f , q n be the production quantities of fuel vehicles and new energy vehicles, respectively. Thus, the credit amount of new energy vehicles is  λ n q n , and the credit amount of fuel vehicles is λ f q f . The government’s requirement for the new energy vehicle credit ratio is   ξ , and the new energy vehicle credit required to produce fuel vehicles are   ξ q f .
Assumption 5.
Let w f , w n be the wholesale prices for fuel vehicles and new energy vehicles, respectively; Let p f , p n be the retailer prices for fuel vehicles and new energy vehicles, respectively, there is  p f < p n [58].
Assumption 6.
Let k n ,   k f be the average fuel consumption of new energy vehicles and fuel vehicles, the standard value is k 0 , and there is   k f < k 0 < k n . Among them, let (   k 0 k f ) be the environmental friendliness of fuel vehicles, and there is e f = (   k 0 k f ) ; Let   (   k 0 k n ) be the environmental friendliness of new energy vehicles, and there is e n = (   k 0 k n ) . We assume new energy vehicles are more environmentally friendly than fuel vehicles, that is  (   k 0 k n ) > (   k 0 k f ) [32,58].
We discuss some of the main parameters, analyze their practical significance, and summarize the parameters and decision variables in Table 1.

3.2. The Basic Model

Some key factors are considered by the demand model [59]. Following the prior literature [60,61,62,63], we assume that the demand function is linear under self- and cross-price effects. There are different parameters for each vehicle, i.e., the demand functions are formulated as follows:
q f = ( 1 θ ) Q α f p f + β f p n
q n = θ Q α n p n + β n p f
Consumer preferences are considered as demand functions [64,65]. The demand functions include all three decision factors, i.e., the price, cruising capability, and environmental preferences. The demand is adjusted by consumers’ willingness to pay for green and cruise capability. The consumers’ preference for new energy vehicles is θ. Q is the potential market size. We have assumed the demands functions are linear, i.e., the demand functions are as follows:
q f = ( 1 θ ) Q α f p f + β f p n + h + η ( k 0 k f )
q n = θ Q α n p n + β n p f + δ h + η ( k 0 k n )
Price is still the factor affecting consumers’ decisions [66]. The self-price sensitivity coefficient of fuel vehicles and new energy vehicles is α f = α n = 1 [67]. The cross-price sensitivity coefficient of fuel vehicles and new energy vehicles is β f = β n = β , β [ 0 , 1 ] ; it represents the degree of mutual substitution between fuel vehicles and new energy vehicles. Generally,   α f , α n are larger than β f , β n ; that is, the self-price sensitivities are greater than cross-price sensitivities. The market demand function is:
q f = ( 1 θ ) Q p f + β p n + h + η ( k 0 k f )
q n = θ Q p n + β p f + δ h + η ( k 0 k n )
At this point, the consumer demand function is given, and in the next section, we discuss the optimal decisions for the supply chain.

4. Analysis of the Automobile Supply Chain

Since the new credit policy promotion, the optimization problem about production and pricing becomes complex for both the manufacturer and the retailer. In this section, we analyze optimal decisions for the decentralized and centralized supply chain, in which consumers are sensitive to cruise capability and environmental friendliness, under the new credit policy. Moreover, we analyze the impacts of consumer preferences and dual credit policy in production and pricing. The results provide management advice for government and enterprises.

4.1. Analysis of the Decentralized Automobile Supply Chain

We have known that the negative credits from fuel vehicles need to be offset by positive credits. Two ways can obtain positive credits, i.e., production NEV or purchasing from the external market, under dual credit policy. Profit maximization is the goal for both manufacturers and retailers. Revenues of fuel vehicle retailers and new energy vehicle retailers come mainly from vehicle sales. The manufacturer’s income includes vehicle sales and credit transactions. Except for the wholesale price paid by the retailer to the manufacturer, other costs are not included [50]. Therefore, the profit functions for the manufacture, traditional vehicle retailer, and new energy vehicle retailer are as below:
π M = q f ( w f c f ) + q n ( w n c n ) + p λ ( λ n q n λ f q f ξ q f )   π f = q f ( p f w f )
π n = q n ( p n w n )
Depending on the profit function, the optimal pricing, production, and profits in the supply chain can be obtained, as shown in Table 2.
Some propositions are as below, and all proof details are in the appendices.
Proposition 1.
The impact of new energy vehicle recognition for cruise capability δ on price and demand are as follows:  w f * δ > 0 , w e * δ > 0 , p f * δ > 0 , p e * δ > 0 , q f * δ > 0 , q e * δ > 0 , π f * δ > 0 , π e * δ > 0 . The proof of Proposition 1 can be found in Appendix A.
According to proposition 1, the recognition for cruise capability has a positive effect on the growth of market demand and sales price under the decentralized decision model, i.e., the increase in market demand of the new energy vehicles is following the increase in the recognition for cruise capability, and its trend is faster than the increase in demand of fuel vehicles. The increase in profits of supply chain members is following demand growth. Consumers have a positive adoption when there is an improvement of product performance and quality.
Proposition 2.
The influence of requirement of the credit ratio ξ on the wholesale price, sales price, and profit of new energy vehicles are as follows:  w n * ξ = 0 , p n * ξ > 0 , q n * ξ > 0 , π n * ξ > 0 . Detailed proof of Proposition 2 is in Appendix A.
According to proposition 2, the new energy vehicle credit ratio ξ has a positive effect on the market demand for new energy vehicles, while it harms the market demand increasing of fuel vehicles. From 2021 to 2023, the new energy vehicle credit ratio is 14%, 16%, and 18%. The increase in credit ratio is helpful to the market diffusion of new energy vehicles, which brings technological innovation and industrial upgrading.
Proposition 3.
Under extreme market conditions, the competitive relationship between fuel vehicles and new energy vehicles is as follows:
(1) when δ 1 2 h { ( β 2 2 ) ( λ n p λ c n ) β [ ( 1 θ ) Q + h + η ( k 0 k f ) ] 2 [ θ Q + η ( k 0 k n ) ] β [ c f + p λ ( λ f + ξ ) ] } , consumers no longer have a demand for new energy vehicles.
(2) when X < δ < min { Y , 1 } , Y = 1 h [ ( 1 θ ) Q + h + η ( k 0 k f ) ] ( 1 + β ) [ c f + p λ ( λ f + ξ ) + ( λ n p λ c n ) ] [ θ Q + η ( k 0 k n ) ] , consumers have a demand for fuel vehicles and new energy vehicles. Detailed proof of Proposition 3 is in Appendix A.
According to proposition 3, recognition of cruise capability and environmental friendliness have positive impacts on consumer adoption. Moreover, the manufacturer can increase market demand by reducing unit costs, and the government expands the adoption of new energy vehicles by increasing the price of credit transactions.

4.2. Analysis of the Centralized Automobile Supply Chain

Under the centralized decision model of the automobile supply chain, each member aims to maximize the profit of the supply chain. The profit function under the centralized decision mode of the automotive supply chain is:
π T = q f ( p f c f ) + q n ( p n c n ) + p λ [ λ n q n ( λ f + ξ ) q f ]
The equilibrium solution is obtained as shown in Table 3.
Proposition 4.
Under the centralized automobile supply chain, the impact of recognition for cruise capability δ and consumers’ willingness to pay for green η on the price and sales of the automotive supply chain is as follows:
(1) q f * * δ = 0 , q e * * δ > 0 , p f * * δ > 0 , p e * * δ > 0
(2) q f * * η < 0 , q e * * η > 0
The proof of Proposition 4 can be found in Appendix A.
According to proposition 4, the increase in cruise capability is positive for the market demand for new energy vehicles. The higher the recognition for new energy vehicles, the more consumers are willing to adopt new energy vehicles. Consumers’ willingness to pay for green products is harmful to the demand for fuel vehicles. The increase in consumers’ awareness of environmental protection drives the market diffusion of new energy vehicles and increases the market share of new energy vehicles.
Proposition 5.
Under the centralized decision mode, the impact of the new energy vehicle requirement for the credit ratio ξ on the price and sales of the automotive supply chain is as follows: q f * * ξ < 0 , q n * * ξ > 0 , p f * * ξ > 0 , p n * * ξ = 0 . Detailed proof of Proposition 5 is in Appendix A.
According to proposition 5, whether in a decentralized decision model or a centralized decision model, increasing the ξ has a positive impact on the market demand for new energy vehicles, but it harms the market demand for fuel vehicles. The increase in the proportion coefficient of new energy vehicle production can encourage new energy car manufacturers’ investment. It is helpful to drive the market diffusion of new energy vehicles [34]. Overall, the implementation of the dual credit policy is beneficial to the green development of the automobile industry.
Proposition 6.
Compared with the decentralized decision model, the market price of the two types of vehicles is lower under the centralized decision model, and the total market demand grows, i.e.,   q n * * + q f * * > q n * + q f * . Detailed proof of Proposition 6 is in Appendix A.
According to proposition 6, the centralized decision model is beneficial for increasing market demand for new energy vehicles. However, the decline in the selling price can easily lead to a decrease in the retailer’s profit per unit. Higher sales increase manufacturers’ profits, but it reduces retailers’ profits. Channel conflicts are exacerbated and lead to the failure of the centralized decision model.
In summary, under the two different decision modes, the pricing of the automotive supply chain shows differences. The market price in the centralized decision model is lower than the market price in the decentralized decision model. The demand for vehicles increases; however, the decrease in unit profits of the product limits retailers’ profit growth. It is beneficial to the manufacturer, and the increase in the market’s demand leads to an overall increase in profits. The increase in requirement for the credit ratio has a positive effect on the market demand of NEV. The government should increase the credit ratio of new energy vehicles. Furthermore, it is necessary to increase the publicity of new energy vehicles and improve consumers’ awareness of green consumption [68].

5. The Influence of Dual Consumer Preferences on Supply Chain and Difference Analysis

We analyze the impacts of consumers’ preferences in the supply chain to guide production planning and price decisions. Some propositions are as follows.
Proposition 7.
Recognition for cruise capability δ and consumers’ willingness to pay for green η has a more positive effect on demand increase for new energy vehicles under the centralized decision mode, i.e.,   q n * * δ q n * δ > 0 ,   q n * * η / q n * η > 1 . Detailed proof of Proposition 7 is in Appendix A.
According to proposition 7, the centralized decision model is better than the decentralized decision model. The market demand for new energy vehicles is growing faster, and the diffusion capacity is stronger.
Proposition 8.
Under the centralized decision mode, the growth trend of market demand is affected by environmental friendliness. The higher the environmental friendliness of the product, the more consumers’ willingness is to pay. The market demand for new energy vehicles will increase. However, the market demand for fuel vehicles will decrease, i.e.,   q n * η > 0 , q f * η < 0 , q f * * η < 0 , and q n * * η > 0 . Detailed proof of Proposition 8 is in Appendix A.
According to proposition 8, we know that the market prices and demand of two types of vehicles are affected by environmental friendliness. As environmental friendliness increases, more consumers are willing to pay for green. The result is that the pricing of new energy vehicles increases, while the pricing of fuel vehicles decreases. The increase in environmental friendliness of products drives the market share of the NEVs increase.
Proposition 9.
The influence of recognition for the cruising capability δ and environmental friendliness e n in the difference of price and demand under two decisions modes is as follows:
(1) ( p n * p n * * ) δ > 0 ; ( p n * p n * * ) e n > 0 ; ( p f * p f * * ) δ > 0 ; ( p f * p f * * ) e n > 0
(2) ( q n * * q n * ) δ > 0 ; ( q n * * q n * ) e n > 0 ; ( q f * * q f * ) δ < 0 ; ( q f * * q f * ) e n < 0
The proof of Proposition 9 can be found in Appendix A.
According to proposition 9, with the value increase in recognition for cruising capability and environmental friendliness, the price difference or demand difference of new energy vehicles expands. The price difference of the fuel vehicles expands, but the demand difference shrinks. Under the centralized decision mode, with the value increases in recognition for cruising capability, the market price of new energy vehicles widens the gap with the decentralized decision mode. Following the market price decreases, the market demand growth widens the sale difference under the two decision modes. New energy vehicles with higher performance can spread faster in the market. In the same way, the improvement of environmental friendliness effectively speeds up the market diffusion of new energy vehicles. In both the decentralized and centralized decision modes, the market demand for traditional fuel vehicles is shrinking. With the increase in consumers’ recognition and environmental preference, consumers are more willing to adopt new energy vehicles. In the new market environment, the difference in sales of traditional fuel vehicles under the two decision modes is getting smaller.
Proposition 10.
The increase in recognition for cruising capability δ and environmental friendliness e n will widen the profit gap of the supply chain under two different decision models, i.e.,   e n > 0 ,   δ > 0 . The proof of Proposition 10 can be found in Appendix A.
According to proposition 10, the profit difference is affected by consumer preferences under the two decision modes, but the difference change rate is related to the two preferences value. The impacts of one kind of preference on the profit difference are related to the value of another preference, i.e., the effect of environmental friendliness on profit difference is related to the value of cruising capability.
The production decisions of the auto supply chain are affected by consumer preferences. With the increasing consumer preference value, the market share of new energy vehicles increases. In both the decentralized and centralized decision modes, the increase in recognition for cruising capability can improve market adoption of new energy vehicles. The higher the environmental friendliness and consumer awareness of environmental protection, the more willing the adoption for green products and the market demand to obtain growth. With consumer preferences increasing, price, demand, and supply chain profit differences are enlarged under the decentralized and centralized decision model. The changing trend of difference is affected by the two preferences. Especially, the difference in the demand for fuel vehicles shrinks with the increase in awareness of environmental protection.

6. Numerical Simulation

We analyze the impacts of dual consumer preferences, which are cruise capability preference and environmental friendliness, in a supply chain consisting of one manufacturer and two retailers. In Section 4, we analyze the optimal decisions in two different decision modes; in Section 5, we analyze the influence of consumer preferences on supply chain pricing, market demand, and profits differences. To observe the effect of each parameter visually and comprehensively on the results, this section is analyzed and interpreted by numerical simulations. The assumption that the market size Q is 1 million. Consumer preference for new energy vehicles is θ = 0.4 . The unit cost of new energy vehicles is c n = 120,000/vehicle, and the unit cost of fuel vehicles is c f = 50,000/vehicle [3,58]. Let cruising capability level of fuel vehicle be h = 1 , the recognition for cruising capability be δ = 0.45, and the consumers’ willingness to pay for the green product be η = 0.7 [57]. The mutual substitution coefficient of fuel vehicles and new energy vehicles is β = 0.5; the new energy vehicle requirement for the credit ratio is ξ = 12%; the average fuel consumption of fuel vehicles is k f = 7.64 L per 100 km; the converted average fuel consumption of new energy vehicles is k n = 3.11 L per 100 km; the average fuel consumption standards value by the government is k 0 = 6.9 L per 100 km; the credit coefficient of fuel vehicles is λ f = 0.458 credits/vehicle; the credit coefficient of new energy vehicle is λ n = 3.8 credits/vehicle; and the expected credit transaction price is p λ = 20,000 yuan/credits [60,61]. Based on the above simulation values, we analyze the impact of dual consumer preferences on supply chain decisions prices, market demand, and profits under dual credit policy. By fixing the values of other parameters, we analyze the influence of each parameter change on the results.

6.1. Analysis of the Impact of Environmental Friendliness and Recognition for Cruising Capability on Supply Chain Prices and Demand

Consumer preferences are important factors in supply chain decision making. In this part, we analyze the impacts of environmental friendliness and recognition for cruising capability on supply chain production and pricing (see Figure 2).
The pricing of fuel vehicles and new energy vehicles increases with the value increase in consumer preferences. The demand for new energy vehicles increases obviously, but the market demand for fuel vehicles has not changed. Compared with fuel vehicles, recognition for cruise capability has an obvious effect on new energy vehicles. As shown in Figure 2a, the retailer prices under the centralized decision model are much lower than the retailer prices for the two types of vehicles under the decentralized decision model. The lower the prices, the higher the market demand. In Figure 2b, the recognition for cruising capability increases one unit, and the demand for new energy vehicles adds to 5000, while the demand for fuel vehicles has no change. In the centralized decision model, sales of new energy vehicles increased by 60,000 vehicles more than the sales are in the decentralized decision models. The improvement of environmental friendliness increases product pricing and demand. Consumers can accept higher prices with higher environmental awareness. Hence, the product price increases. In Figure 2c,d, the sales prices under the centralized decision model are lower than the sales prices under the decentralized decision model. The environmental attribute increases one unit, the demand for new energy vehicles increases from 160,000 to 230,000 under the centralized decision model, but the market demand for fuel vehicles has not changed.
The increase in recognition for cruising capability and environmental friendliness has a positive impact on pricing and production. There is a different point in which fuel vehicles are not sensitive to changes in consumer preferences. Product pricing has a competitive advantage in centralized decision-making models, products’ demand grows sharply, and the market spread faster. The improvement of cruising capability led to higher prices. As consumers become more tolerant of pricing, they can accept higher pricing. Retailers raise the market price of vehicles in search of more profits. Increased consumer preferences have a significant impact on the market diffusion of new energy vehicles.

6.2. Analysis of the Impact of Dual Consumer Preferences on Supply Chain Differences

This part analyzes the impact of environmental friendliness and recognition for cruising capability on supply chain pricing, production, and profit differences.

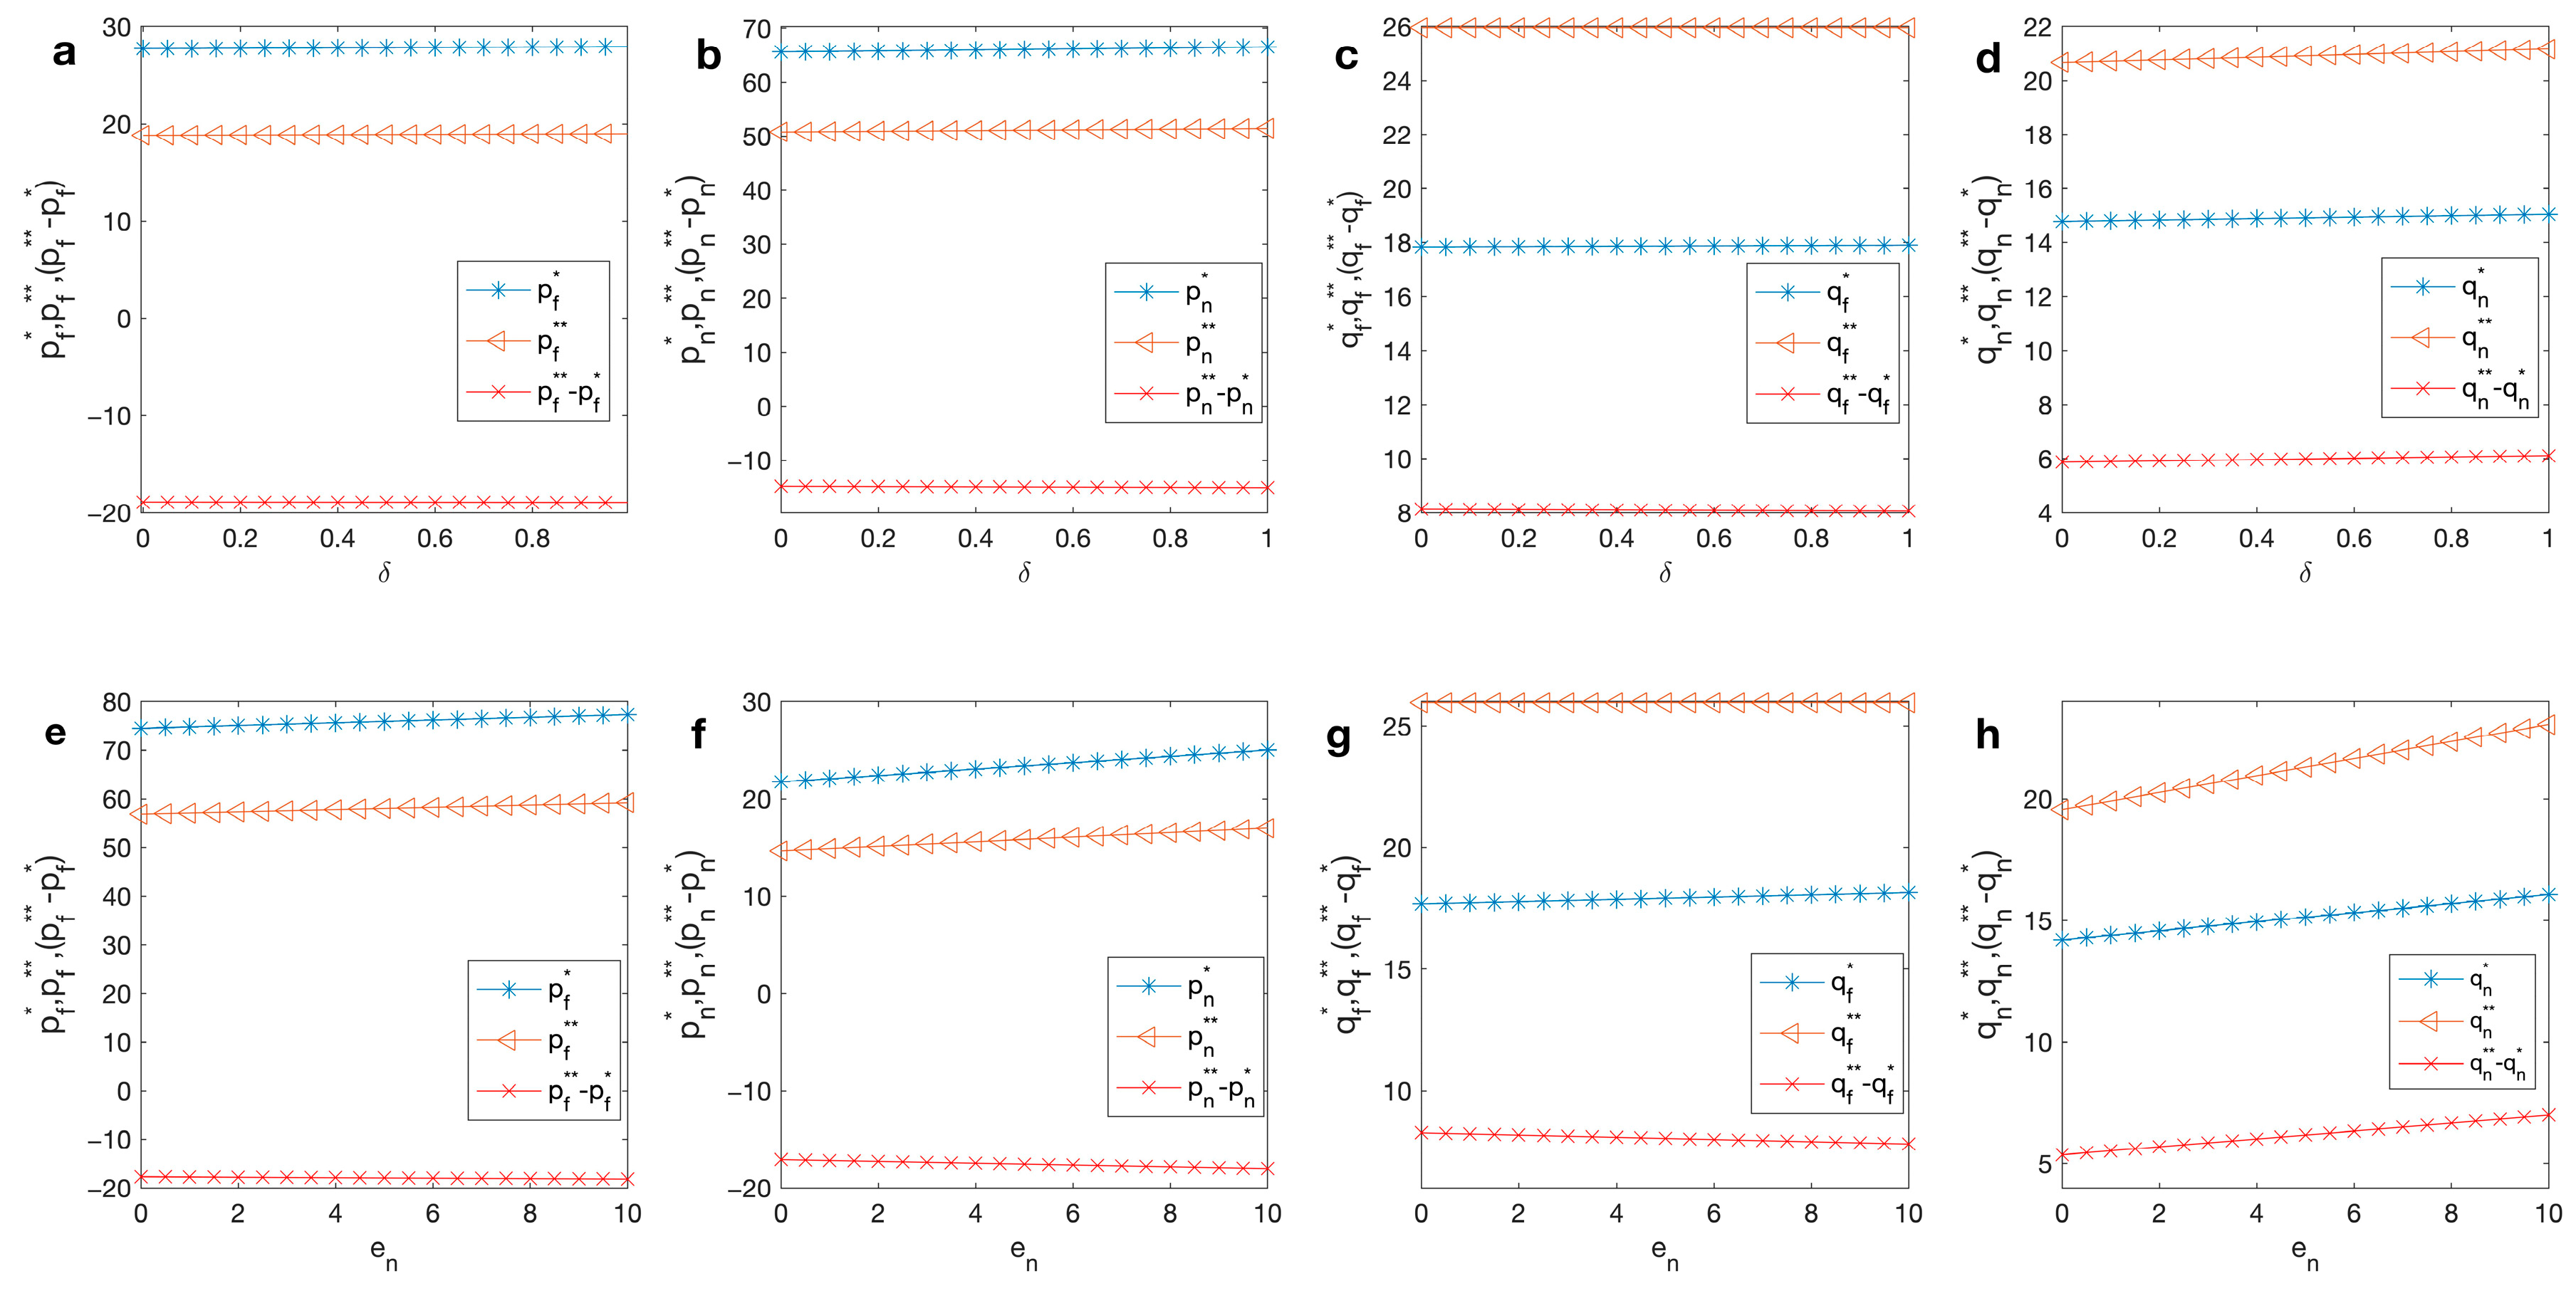
6.2.1. Analysis of the Impact of Dual Consumer Preferences on Supply Chain Pricing and Market Demand Differences

With the value increase in consumer preferences, the difference in price and market demand of new energy vehicles expands under the two decision modes. However, the difference in market demand for fuel vehicles shrinks. Figure 3a,e demonstrates that with the increase in consumer preferences, the difference in retailer pricing for the fuel vehicles widens under two decision modes, but the change is minor. Under the two decision modes, the changing trend of retailer’s pricing is smooth, and the price difference is minor. Similarly, increased consumer preference widens the gap between the retailer pricing of new energy vehicles under two decision models in Figure 3b,f. Prices have a greater sensitivity to environmental friendliness. With the increase in environmental friendliness, the price difference significantly increases. However, prices have a lower sensitivity to the recognition for cruising capability. With the increase in environmental friendliness, the price differences are not changes. Compared with the price changes of fuel vehicles, the price of new energy vehicles is more sensitive to changes in preferences. In the centralized decision mode, the price of the two types of vehicles is lower than the price in the decentralized decision mode, and the market demand grows. Figure 3d,h shows that new energy vehicles’ demand has a greater sensitivity to environmental friendliness. With the increase in environmental friendliness, the demand significantly increases. With one unit value increase in consumer preferences, demand increases by 2000. However, the price reduction does not increase the market demand for fuel vehicles. There is no change under the centralized decision mode. Consumer preferences have a limited positive impact on the growth of fuel vehicles’ demand. With the increase in consumer preferences, the difference in demand between the two decision modes decreases, as shown in Figure 3c,g.
The environmental friendliness and recognition for cruising capability have different effects on prices and demand differences. The change of dual consumer preferences has a weak impact on fuel vehicles, while new energy vehicle is more sensitive to change. Compared with the recognition for cruising capability, the prices and demand for new energy vehicles are more sensitive to environmental friendliness. Consumer tolerance for green products pricing increase, and demand for environmentally friendly products increase.

6.2.2. The Impact of Dual Consumer Preferences on the Supply Chain Profits Difference

With the increase in environmental friendliness and recognition for cruising capability, the profit of the supply chain increases, and the difference of supply chain gradually expands. As shown in Figure 4, when considering the dual consumer preferences, the profit increase in the supply chain is better than a single preference. Consumer preferences have positive impacts on the profit of the supply chain, and the profit growth rate is not the same under different preferences.
When only considering the recognition for cruising capability, the manufacturer’s profit increases by 30.75 with the increase in recognition for cruising capability. When only considering the impact of environmental friendliness on the manufacturer’s profit, the manufacturer’s profit reaches 1744.87, increased by 223.62 with the increase in environmental friendliness. The total profit increases by 254.37 under different consumer preferences. When considering the dual consumer preferences, the manufacturer’s profit is 1778.41, which is increased by 257.16. Consumer preferences have a positive cross-effect, and the value of the positive cross effect is 2.79, and the growth rate is 1.1%. In the same way, as shown in Figure 4c, the profit of new energy vehicle retailers is also affected by the cross-effect of consumer preferences. The value added to the positive cross-effect is 0.995, with a growth rate of 1.56%. Figure 4b reflects that the profit of fuel vehicle retailers is affected by consumer preferences, and the profit surface is flat. We can know that the profits of fuel vehicle retailers are not affected by the cross-effect of preferences. Dual consumer preferences have a positive impact on the profits of the supply chain, while the impact of a single preference is limited. With the positive impact of consumer preferences, supply chain profits reach a higher level. The growth rate of the members’ revenues is between 1.1% and 1.56%. In the centralized decision model, the value added to the positive cross-effect is higher.
As shown in Figure 4d, when the value of the dual preferences increases, the profit difference of the supply chain gradually expands under the two decision modes. However, only considering the effect of a single preference on the profit difference, the trend of change is also very different. When considering dual consumer preferences, the profit difference change value is greater than the change value under a single preference, and the profit difference change value is greater than the sum of the values under a single preference. When considering consumer preference for cruise capability and environmental friendliness, the supply chain profit difference between different decision models increases to 175.86. The sum of the difference values under the influence of a single preference is 175.051. The profit growth rate is 0.5% under dual consumer preferences.
In summary, under the two decision modes, consumer preferences have a significant positive impact on prices, demand, and profits. With the increase in consumer preference, the pricing, demand, and profits of the supply chain increase, but the changing trend is different. The effect of a single preference is limit. When considering the dual consumer preference, the demand and profits of the supply chain reach a higher level. What is more, with the increase in consumer preferences value, the supply chain difference expands. For the supply chain, the decision makers should pay attention to the economic and noneconomic attributes of the consumer. Comprehensive research and analysis are beneficial to the development of the supply chain.

7. Conclusions

7.1. Contributions and Implications

The dual credit policy brings changes for China’s automotive industry, and the promotion of electric vehicles also enriches consumer selection. The production decisions of the supply chain are affected by multiple factors, such as the market size, production cost, and consumer preferences, etc. This paper analyzes the effects of consumer preferences and dual credit policy in supply chain differences under the decentralized and centralized decision modes, and the supply chain is consisting of one manufacturer and two retailers.
This study makes several contributions to the literature. First, we contribute to the literature that focuses on operation decisions between manufacturers and retailers under dual credit policy. Prior research has discussed operation decisions between manufacturers and retailers, but production decisions researches are not enough in new market circumstances. We build the two-stage automobile supply chain, including one manufacturer and two retailers, under the impacts of consumer preferences and dual credit policy. The results suggest that the dual credit policy promotes the spread of new energy vehicles. The increase in the credit factor of new energy vehicles has promoted the popularization of new energy vehicles but may hinder the development of fuel vehicles. Therefore, the government should appropriately increase the proportion coefficient of new energy vehicle production and encourage new energy vehicle manufacturers and retailers to do more sale efforts.
In addition, we focus on the impacts of consumer preferences under the decentralized and centralized decision mode. The results show that consumer preferences have a positive effect on price, demand, and profit. With the increase in environmental friendliness and recognition for cruising capability, the market pricing of vehicles increases. The market pricing of new energy vehicles has a high sensitivity to the preferences, i.e., with the value increase in environmental friendliness and recognition for cruising capability, the demand for new energy vehicles has significantly increased. However, fuel vehicles have a weak sensitivity to consumer preferences. Consumers’ awareness of environmental protection has increased their tolerance for prices, and there is a demand growth for environmentally friendly products.
We also contribute to analyze the decision differences of the two decision models. Compared with the decentralized decision model, the retailer price of fuel vehicles and new energy vehicles is lower under the centralized decision model. As the total market demand grows, manufacturers’ profits increase, but it hurts retailers’ profits. With the increase in consumer preferences, the difference in prices and profits expands. The market demand difference of new energy vehicles also expands, but the demand difference of fuel vehicles shrinks.
The profits of manufacturers and retailers reach a higher level in the impacts of the cross-effect of preferences. The growth rate of profit is between 1.1% and 1.56%. The profit difference between the two decision-making modes gradually expands as the value of consumer preference increases. What is more, the change in the difference under the influence of one preference is related to the value of the other preference.

7.2. Limitations and Future Research Directions

In addition to the research perspective mentioned above, this study has other limitations that extensions to this research might address. First, we focus on the auto supply chain, which raises a question about the generalizability of our findings to other product supply chains. Second, we focus on the consumer preferences of vehicles, which raises another question about the generalizability of our findings to other green products.
Moreover, although we limit the scope of this paper to issues related to consumer preference, i.e., recognition for cruising capability and environmental preference and dual credit policy, future research could explore customer preferences in greater detail and study the impact of consumer preferences in an operation decisions problem of multiple manufacturers and multiple retailers.
In addition, future research could also consider infrastructure operators in the supply chain. The promotion policies of new energy vehicles have changed the market circumstances, and the design and optimization of the credit transaction mechanism could be an interesting direction for future research.

Author Contributions

Methodology, formal analysis, writing, L.P.; conceptualization, supervision, funding acquisition, Y.L.; software, L.P. and H.Y.; All authors have read and agreed to the published version of the manuscript.

Funding

This research was funded by the National Natural Science Foundation of China, grant number 72074076, 71972070.

Institutional Review Board Statement

Not applicable.

Informed Consent Statement

Not applicable.

Data Availability Statement

Data sharing not applicable.

Acknowledgments

Thanks for the support by the National Natural Science Foundation of China (No.72074076, 71972070). Thanks for the advice from the partners.

Conflicts of Interest

The contents of this manuscript have not been copyrighted or published previously. The contents of this manuscript are not now under consideration for publication elsewhere. There are no directly related manuscripts or abstracts, published or unpublished, by any authors of this manuscript. We declare that we do not have any commercial or associative interest that represents a conflict of interest in connection with the work submitted.

Appendix A

Proof of Proposition 1.
To examine the impact of recognition for cruising capability δ on the price, demand, and profit, we take the first-order partial derivatives of w , p , and π for δ , we get w f * δ = β h 2 ( 1 β 2 ) > 0 , w e * δ = h 2 ( 1 β 2 ) > 0 , p f * δ = β ( 2 β 2 5 ) h 2 ( β 2 1 ) ( 4 β 2 ) > 0 , p e * δ = ( 3 β 2 6 ) h 2 ( β 2 1 ) ( 4 β 2 ) > 0 , q f * δ = β h 2 ( 4 β 2 ) > 0 , q e * δ = h 2 ( 4 β 2 ) > 0 , π f * δ = β h q f * ( 4 β 2 ) > 0 , π e * δ = h q e * ( 4 β 2 ) > 0 , the proposition is proved. □
Proof of Proposition 2.
To examine the impact of the requirement for the new energy vehicle credit ratio ξ on the new energy vehicle of the wholesale price, retailer price, and profit, we take the first-order partial derivatives of w , p , and π for ξ . We get w n * ξ = 0 , p n * ξ = β p λ 2 ( 4 β 2 ) > 0 , q n * ξ = β 4 β 2 > 0 , π n * ξ = p λ β q n * 4 β 2 > 0 , the proposition is proved. □
Proof of Proposition 3.
(1)
Under extreme market conditions, there is no demand for new energy vehicles in the market. That is q n * 0 , we get δ X , X = 1 2 h { ( β 2 2 ) ( λ n p λ c n ) β [ ( 1 θ ) Q + h + η ( k 0 k f ) ] 2 [ θ Q + η ( k 0 k n ) ] β [ c f + p λ ( λ f + ξ ) ] } ;
(2)
There is demand for new energy vehicles and fuel vehicles in the market. That is 0 < q n * < q f * , According to q n * > 0 , we get δ > X , from q n * < q f * , we get δ < Y , because of δ < 1 , there is X < δ < m i n { Y , 1 } . Y = 1 h [ ( 1 θ ) Q + h + η ( k 0 k f ) ] ( 1 + β ) [ c f + p λ ( λ f + ξ ) + ( λ n p λ c n ) ] [ θ Q + η ( k 0 k n ) ] , the proposition is proved. □
Proof of Proposition 4.
The proof of Proposition 4 is similar to Proposition 1, so we omitted it. □
Proof of Proposition 5.
The proof of Proposition 5 is similar to Proposition 2, so we omitted it. □
Proof of Proposition 6.
The total market demand grows under a centralized supply chain, from Table 2 and Table 3, and we get p f * * = w f * , p n * * = w n * ; p f * > p f * * , p n * > p n * * , there is q n * * + q f * * = ( θ Q + δ h + η ( k 0 k n ) ) + [ ( 1 θ ) Q + h + η ( k 0 k f ) ] + ( β 1 ) [ c f + p λ ( λ f + ξ ) ] ( β 1 ) ( λ n p λ c n ) 2 ,   q n * + q f * = ( θ Q + δ h + η ( k 0 k n ) ) + [ ( 1 θ ) Q + h + η ( k 0 k f ) ] + ( β 1 ) [ c f + p λ ( λ f + ξ ) ] ( β 1 ) ( λ n p λ c n ) 2 ( 2 β ) , that is q n * * + q f * * > q n * + q f * , the proposition is proved. □
Proof of Proposition 7.
To examine the impact of recognition for cruise capability δ and consumers’ willingness to pay for green η on the market diffusion of new energy vehicles.
(1) Under a centralized supply chain, there is q n * * δ = 1 2 h > 0 ; under a decentralized supply chain, there is q n * δ = h 2 ( 4 β 2 ) > 0 . q n * * δ q n * δ = 1 2 h h 2 ( 4 β 2 ) = h ( 3 β 2 ) 2 ( 4 β 2 ) > 0 ;
(2) Under a centralized supply chain, there is q n * * η = 1 2 ( k 0 k e ) > 0 ; under a decentralized supply chain, there is q n * η = 2 ( k 0 k n ) + β ( k 0 k f ) 2 ( 4 β 2 ) . When 2 ( k 0 k n ) + β ( k 0 k f ) 0 , there is q n * * η / q n * η = ( 4 β 2 ) ( k 0 k n ) 2 ( k 0 k n ) + β ( k 0 k f ) > 1 , the proposition is proved. The market demand for new energy vehicles is growing faster, and the diffusion capacity is stronger under the centralized decision model than the decentralized decision model. The proposition is proved. □
Proof of Proposition 8.
To examine the impact of consumers’ willingness to pay for green η on the market demand. Under the centralized supply chain, q f * * η = 1 2 ( k 0 k f ) < 0 , q n * * η = 1 2 ( k 0 k n ) > 0 , When ( k 0 k n ) 0 , the consumer has a higher adaption of new energy vehicle. The diffusion capacity is stronger than fuel vehicle or not. When ( k 0 k f ) 0 , the lower of environment friendliness, the weaker willingness of paying for fuel vehicle. The demand for fuel vehicles decreases. Under the decentralized supply chain, there is q f * η = β ( k 0 k n ) + 2 ( k 0 k f ) 2 ( 4 β 2 ) , q n * η = 2 ( k 0 k n ) + β ( k 0 k f ) 2 ( 4 β 2 ) . When 1 2 < | k 0 k n | | k 0 k f | < 2 , there is q n * η > 0 , q f * η < 0 . The market demand for new energy vehicles increases with the increase in consumers’ willingness to pay for the environment, and the market demand for fuel vehicles decreases with the decline of the willingness to pay for the environment. The proposition is proved. □
Proof of Proposition 9.
To examine the influence of endurance recognition for the cruising capability δ and environmental friendliness e n on the difference in sales price and demand under the two decision modes.
(1) From Table 2 and Table 3, there is ( p n * p n * * ) δ = h ( 4 β 2 ) > 0
; ( p n * p n * * ) e n = η ( 4 β 2 ) > 0 ; ( p f * p f * * ) δ = β h 2 ( 4 β 2 ) > 0 ; ( p f * p f * * ) e n = β η 2 ( 4 β 2 ) > 0 ;
(2) From Table 2 and Table 3, there is ( q n * * q n * ) δ = ( 2 β 2 ) h 2 ( 4 β 2 ) > 0 ; ( q n * * q n * ) e n = ( 2 β 2 ) η 2 ( 4 β 2 ) > 0 ; ( q f * * q f * ) δ = β h 2 ( 4 β 2 ) < 0 ; ( q f * * q f * ) e n = β η 2 ( 4 β 2 ) < 0 , the proposition is proved. □
Proof of Proposition 10.
To examine the influence of recognition for cruising capability δ and environmental friendliness e n on the supply chain profit difference under two decision model, from Table 2 and Table 3, we take the first-order partial derivatives of π to δ and e n . There is e n = ( ( 54 + 8 β 4 41 β 2 ) ( η e n + δ h ) 2 ( 4 β 2 ) + M ) η > 0 , and = π T ( π M + π f + π e ) , M = A + B + C + D 2 ( 4 β 2 ) > 0 , A = [ 60 + 8 β 4 44 β 2 ] θ Q 2 ( 4 β 2 ) , C = ( β 5 + 10 β 5 β 3 ) [ c f + p λ ( λ f + ξ ) ] 2 ( 4 β 2 ) , D = ( 20 + 8 β + 4 β 2 + 10 β 5 26 β 3 3 β 4 β 7 ) ( λ n p λ c n ) 2 ( 4 β 2 ) , B = [ 2 β 5 + 28 β + 16 β 2 15 β 3 8 β 4 β 6 ] [ ( 1 θ ) Q + h + η ( k 0 k f ) ] 2 ( 4 β 2 ) ; It’s similar to above that there is δ = [ ( 54 41 β 2 + 8 β 4 ) ( η e n + δ h ) 2 ( 4 β 2 ) + M ] h > 0 , the proposition is proved. □

References

  1. Foley, B.; Degirmenci, K.; Tan, Y. Factors Affecting Electric Vehicle Uptake: Insights from a Descriptive Analysis in Australia. Urban Sci. 2020, 4, 57. [Google Scholar] [CrossRef]
  2. Wu, J.; Liao, H.; Wang, J.W.; Chen, T. The role of environmental concern in the public acceptance of autonomous electric vehicles: A survey. from China. Transp. Res. 2019, 60, 37–46. [Google Scholar] [CrossRef]
  3. Li, J.; Ku, Y.; Liu, C.; Zhou, Y. Dual credit policy: Promoting new energy vehicles with battery recycling in a competitive environment. J. Clean. Prod. 2020, 243, 118456.1–118456.14. [Google Scholar] [CrossRef]
  4. Shao, L.; Yang, J.; Min, Z. Subsidy scheme or price discount scheme? Mass adoption of electric vehicles under different market structures. Eur. J. Oper. Res. 2017, 262, 1187–1195. [Google Scholar] [CrossRef]
  5. Shao, W.; Yang, K.; Bai, X. Impact of financial subsidies on the R&D intensity of new energy vehicles: A case study of 88 listed enterprises in China. Energy Strategy Rev. 2021, 33, 100580. [Google Scholar]
  6. Azevedo, A.; Pereira, P.J.; Rodrigues, A. Optimal Timing and Capacity Choice with Taxes and Subsidies Under Uncertainty. Omega 2020, 6, 102312. [Google Scholar] [CrossRef]
  7. Harrison, G.; Thiel, C. An exploratory policy analysis of electric vehicle sales competition and sensitivity to infrastructure in Europe. Technol. Forecast. Soc. Chang. 2017, 114, 165–178. [Google Scholar] [CrossRef]
  8. Yang, W.; Artie, W.; Yu, Z.; Huang, J.; Meng, K.; Dong, Z. A review of evolutionary policy incentives for sustainable development of electric. vehicles in China: Strategic implications. Energy Policy 2021, 148, 111983. [Google Scholar]
  9. Wang, Z.; Zhang, J.; Zhao, H. The Selection of Green Technology Innovations under Dual-Credit Policy. Sustainability 2020, 12, 6343. [Google Scholar] [CrossRef]
  10. Heutel, G.; Muehlegger, E.J. Consumer learning and hybrid vehicle adoption. Environ. Resour. Econ. 2014, 62, 125–161. [Google Scholar] [CrossRef] [Green Version]
  11. Adepetu, A.; Keshav, S. The relative importance of price and driving range on electric vehicle adoption: Loss angles case study. Transportation 2015, 44, 1–21. [Google Scholar] [CrossRef]
  12. Haustein, S.; Jensen, A.F.; Cherchi, E. Battery electric vehicle adoption in Denmark and Sweden: Recent changes, related factors, and policy implications. Energy Policy 2021, 149, 112096. [Google Scholar] [CrossRef]
  13. Zhang, X.; Wang, K.; Hao, Y.; Fan, J.L.; Wei, Y.M. The impact of government policy on preference for NEVs: The evidence from China. Energy Policy 2013, 61, 382–393. [Google Scholar] [CrossRef]
  14. Degirmenci, K.; Breitner, M.H. Consumer purchase intentions for electric vehicles: Is green more important than price and range? Transp. Res. Part D Transp. Environ. 2017, 51, 250–260. [Google Scholar] [CrossRef] [Green Version]
  15. Rezvani, Z.; Jansson, J.; Bodin, J. Advances in consumer electric vehicle adoption research: A review and research agenda. Transp. Res. Part D Transp. Environ. 2015, 34, 122–136. [Google Scholar] [CrossRef] [Green Version]
  16. Moorthy, K.S. Product and price competition in a monopoly. Mark. Sci. 1988, 7, 141–168. [Google Scholar] [CrossRef] [Green Version]
  17. Gu, H.; Liu, Z.; Qing, Q. Optimal electric vehicle production strategy under subsidy and battery recycling. Energy Policy 2017, 109, 579–589. [Google Scholar] [CrossRef]
  18. Zhang, X. Dependent electric vehicle production strategy considering subsidies and consumer trade-offs. Energy Policy 2014, 67, 422–430. [Google Scholar] [CrossRef]
  19. Huang, J.; Leng, M.; Liang, L.; Liu, J. Promoting electric automobiles: Supply chain analysis under a government’s subsidy incentive scheme. IIE Trans. 2013, 45, 826–844. [Google Scholar] [CrossRef]
  20. Mohan, T.V.K.; Amit, R.K. Modeling oligopsony market for end-of-life vehicle recycling. Sustain. Prod. Consum. 2021, 25, 325–346. [Google Scholar] [CrossRef]
  21. Zhou, F.; Lim, M.K.; He, Y.; Lin, Y.; Chen, S. End-of-life vehicle (ELV) recycling management: Improving performance using an ISM approach. J. Clean. Prod. 2019, 228, 231–243. [Google Scholar] [CrossRef]
  22. Basiri, Z.; Heydari, J. A mathematical model for green supply chain coordination with substitutable products. J. Clean. Prod. 2017, 145, 232–249. [Google Scholar] [CrossRef] [Green Version]
  23. Madani, S.R.; Rasti-Barzoki, M. Sustainable supply chain management with pricing, greening and governmental tariffs determining strategies: A game-theoretic approach. Comput. Ind. Eng. 2017, 105, 287–298. [Google Scholar] [CrossRef]
  24. Zhu, M.; Liu, Z.; Li, J.; Zhu, S.X. Electric vehicle battery capacity allocation and recycling with the downstream competition. Eur. J. Oper. Res. 2020, 283, 365–379. [Google Scholar] [CrossRef]
  25. Hao, H.; Qiao, Q.; Liu, Z.; Zhao, F. Impact of recycling on energy consumption and greenhouse gas emissions from electric vehicle production: The China 2025 case Resources. Conserv. Recycl. 2017, 122, 114–125. [Google Scholar] [CrossRef]
  26. Tang, Y.; Zhang, Q.; Li, Y.; Wang, G.; Li, W. Recycling mechanisms and policy suggestions for spent electric vehicles’ power battery—A case of Beijing. J. Clean. Prod. 2018, 186, 388–406. [Google Scholar] [CrossRef]
  27. Gu, X.; Zhou, L.; Huang, H.; Shi, X.; Ieromonachou, P. Electric Vehicle Battery Secondary Use Under Government Subsidy: A Closed-loop Supply Chain Perspective. Int. J. Prod. Econ. 2021, 234, 108035. [Google Scholar] [CrossRef]
  28. Zhang, H.; Xu, X.; Liu, W.; Jia, Z. Green supply chain decision modeling under the financial policy, with or without uniform government emission reduction policy. Manag. Decis. Econ. 2020, 41, 1040–1056. [Google Scholar] [CrossRef]
  29. Liu, L.; Zhang, T.; Avrin, A.P.; Wang, X. Is China’s industrial policy failing? An empirical study of the new energy vehicles industry. Technol. Soc. 2020, 63, 101356. [Google Scholar] [CrossRef]
  30. Wang, N.; Tang, L.; Zhang, W.; Guo, J. How to face the challenges caused by the abolishment of subsidies for electric vehicles in China? Energy 2019, 166, 359–372. [Google Scholar] [CrossRef]
  31. Luo, Q.; Saigal, R.; Chen, Z.; Yin, Y. Accelerating the adoption of automated vehicles by subsidies: A dynamic games approach. Transp. Res. Part B Methodol. 2019, 129, 226–243. [Google Scholar] [CrossRef]
  32. Li, J.; Ku, Y.; Yu, Y.; Liu, C.; Zhou, Y. Optimizing production of new energy vehicles with across-chain cooperation under China’s dual credit policy. Energy 2020, 194, 116832. [Google Scholar] [CrossRef]
  33. Yu, Y.; Zhou, D.; Zha, D.; Wang, Q.; Zhu, Q. Optimal production and pricing strategies in auto supply chain when dual credit policy is substituted for subsidy policy. Energy 2021, 120369. [Google Scholar] [CrossRef]
  34. Cheng, Y.; Fan, T. Production coopetition strategies for an FV automaker and a competitive NEV automaker under the dual-credit policy. Omega 2021, 102391. [Google Scholar] [CrossRef]
  35. Ou, S.; Lin, Z.; Qi, L.; He, X.; Przesmitzki, S. The dual-credit policy: Quantifying the policy impact on plug-in electric vehicle sales and. industry profits in China. Energy Policy 2018, 121, 597–610. [Google Scholar] [CrossRef]
  36. Jun, S.; Yoo, H.; Kim, J. A study on the effects of the CAFE standard on consumers. Energy Policy 2016, 91, 148–160. [Google Scholar] [CrossRef]
  37. Wang, Y.; Benjamin, T.H. Consumer product knowledge and intention to purchase remanufactured products. Int. J. Prod. Econ. 2016, 181, 460–469. [Google Scholar] [CrossRef]
  38. Ping, H.A.; Zheng, W.A.; Shi, V.; Liao, Y. The direct and cross effects in a supply chain with consumers sensitive to both carbon emissions and delivery time. Eur. J. Oper. Res. 2021, 292, 172–183. [Google Scholar]
  39. Lim, M.K.; Mak, H.Y.; Rong, Y. Toward Mass Adoption of Electric Vehicles: Impact of the Range and Resale Anxieties. Manuf. Serv. Oper. Manag. 2015, 17, 101–119. [Google Scholar] [CrossRef]
  40. White, L.V.; Sintov, N.D. You are what you drive: Environmentalist and social innovator symbolism drive electric vehicle adoption intentions. Transp. Res. Part A Policy Pract. 2017, 99, 94–113. [Google Scholar] [CrossRef] [Green Version]
  41. Hardman, S. Understanding the impact of reoccurring and non-financial incentives on plug-in electric vehicle adoption—A review. Transp. Res. Part A Policy Pract. 2019, 119, 1–14. [Google Scholar] [CrossRef] [Green Version]
  42. Moons, I.; Pelsmacker, D. Emotions as determinants of electric car usage intention. J. Mark. Manag. 2012, 28, 195–237. [Google Scholar] [CrossRef]
  43. Shahla, A.; Nilashi, M.; Samad, S.; Abdulah, R.; Mahmoud, M.; Alknani, M.H.; Yadegaridehkoridi, E. Factors impacting consumers’ intention toward adoption of electric vehicles in Malaysia. J. Clean. Prod. 2021, 282, 124474. [Google Scholar]
  44. Zhang, X.; Bai, X.; Shang, J. Is subsidized electric vehicles adoption sustainable: Consumers’ perceptions and motivation toward incentive policies, environmental benefits, and risks. J. Clean. Prod. 2018, 192, 71–79. [Google Scholar] [CrossRef]
  45. Kumar, R.R.; Alok, K. Adoption of electric vehicle: A literature review and prospects for sustainability. J. Clean. Prod. 2020, 253, 119911. [Google Scholar] [CrossRef]
  46. Lane, B.; Potter, S. The adoption of cleaner vehicles in the UK: Exploring the consumer attitude–action gap. J. Clean. Prod. 2007, 15, 1085–1092. [Google Scholar] [CrossRef]
  47. Stephen, M.S. How consumer drivers construe vehicle performance: Implications for electric vehicles. Transp. Res. Part F Traffic Psychol. Behav. 2014, 23, 15–31. [Google Scholar]
  48. Mccollum, D.L.; Charlie, W.; Michela, B.; Carrara, S.; Edelenbosch, O.Y.; Emmerling, J.; Guivarch, C.; Karkatsoulis, P.; Keppo, I.; Krey, V.; et al. Interaction of consumer. preferences and climate policies in the global transition to low-carbon vehicles. Nat. Energy 2018, 3, 664–673. [Google Scholar] [CrossRef]
  49. Wang, Y.; Hou, G. A duopoly game with heterogeneous green supply chains in optimal price and market stability with consumer green. preference. J. Clean. Prod. 2020, 255, 120161. [Google Scholar] [CrossRef]
  50. Xia, L.; Hao, W.; Qin, J.; Ji, F.; Yue, X. Carbon emission reduction and promotion policies considering social preferences and consumers’ low-carbon awareness in the cap-and-trade system. J. Clean. Prod. 2018, 195, 1105–1124. [Google Scholar] [CrossRef]
  51. Zhang, L.; Zhou, H.; Liu, Y.; Lu, R. Optimal environmental quality and price with consumer environmental awareness and retailer’s fairness concerns in supply chain. J. Clean. Prod. 2018, 213, 1063–1079. [Google Scholar] [CrossRef]
  52. Gong, B.; Xia, X.; Cheng, J. Supply-Chain Pricing and Coordination for New Energy Vehicles Considering Heterogeneity in Consumers’ Low Carbon Preference. Sustainability 2020, 12, 1306. [Google Scholar] [CrossRef] [Green Version]
  53. Sarkar, S.; Bhadouriya, A. Manufacturer competition and collusion in a two-echelon green supply chain with production trade-off between non-green and green quality. J. Clean. Prod. 2020, 253, 119904. [Google Scholar] [CrossRef]
  54. Debabrata, G.; Janat, S. Supply chain analysis under green-sensitive consumer demand and cost-sharing contract. Int. J. Prod. Econ. 2015, 164, 319–329. [Google Scholar]
  55. Ghosh, S.; Seikh, M.; Chakrabortty, M. Analyzing a stochastic dual-channel supply chain under consumers’ low carbon preferences and cap-and-trade regulation. Comput. Ind. Eng. 2020, 149, 106765. [Google Scholar] [CrossRef]
  56. Chong, Z.; Ying, L.; Guanghua, H. Two-stage pricing strategies of a dual-channel supply chain considering public green preference. Comput. Ind. Eng. 2020, 151, 10689. [Google Scholar]
  57. Meng, Q.; Li, M.; Liu, W.; Li, Z.; Zhang, J. 2021. Pricing policies of the dual-channel green supply chain: Considering government subsidies and consumers dual preferences. Sustain. Prod. Consum. 2021, 26, 1021–1030. [Google Scholar] [CrossRef]
  58. Zhou, D.; Yu, Y.; Wang, Q.; Zha, D. Effects of a generalized dual-credit system on green technology investments and pricing decisions in a supply chain. J. Environ. Manag. 2019, 247, 269–280. [Google Scholar] [CrossRef] [PubMed]
  59. Sudhir, K. Competitive Pricing Behavior in the Auto Market: A Structural Analysis. Mark. Sci. 2001, 20, 42–60. [Google Scholar] [CrossRef]
  60. Mcguire, T.W.; Staelin, R. An Industry Equilibrium Analysis of Downstream Vertical Integration. Mark. Sci. 1983, 27, 115–130. [Google Scholar] [CrossRef]
  61. Steven, T.B. Estimating Discrete-Choice Models of Product Differentiation. RAND J. Econ. 1994, 25, 242–262. [Google Scholar]
  62. Hua, G.; Wang, S.; Cheng, T. Price, and lead time decisions in dual-channel supply chains. Eur. J. Oper. Res. 2010, 205, 113–126. [Google Scholar] [CrossRef]
  63. Mohammad, B.J.; Rasti, B.M. A game-theoretic approach to investigate the effects of third-party logistics in a sustainable supply chain by reducing. delivery time and carbon emissions. J. Clean. Prod. 2019, 235, 636–652. [Google Scholar]
  64. Fan, J.L.; Wang, Q.; Yang, L.; Zhang, H.; Zhang, X. Determinant changes of consumer preference for NEVs in China: A comparison between. 2012 and 2017. Int. J. Hydrogen Energy 2020, 45, 23557–23575. [Google Scholar] [CrossRef]
  65. Sierzchula, W.; Bakker, S.; Maat, K.; Vee, B. The influence of financial incentives and other socio-economic factors on electric vehicle adoption. Energy Policy 2014, 68, 183–194. [Google Scholar] [CrossRef]
  66. Wang, R.X.; Ke, C.X.; Cui, S. Product Price, Quality, and Service Decisions Under Consumer Choice. MSOM 2021, 1–18. [Google Scholar] [CrossRef]
  67. Wang, Z.; Zhao, C.; Yin, J.; Zhang, B. Purchasing intentions of Chinese citizens on new energy vehicles: How should one respond to current. preferential policy? J. Clean. Prod. 2017, 161, 1000–1010. [Google Scholar] [CrossRef]
  68. Li, J.; Jiao, J.; Tang, Y. Analysis of the impact of policies intervention on electric vehicles adoption considering information transmission—based on consumer network model. Energy Policy 2020, 144, 1–12. [Google Scholar] [CrossRef]
Figure 1. Two-stage supply chain structure framework.
Sustainability 13 05821 g001
Figure 2. The impact of environmental friendliness and recognition for cruising capability on prices and demand. Recognition for cruising capability: (a): impacts on prices; (b): impacts on demand. Environmental friendliness: (c): impacts on prices; (d): impacts on demand.
Sustainability 13 05821 g002
Figure 3. The impact of consumer preferences on supply chain pricing and market demand differences. (a,e): the impacts of consumer preferences on the fuel vehicles’ pricing differences under two different decision model; (b,f): the impacts of consumer preferences on the new energy vehicles’ pricing differences under two different decision model; (c,g): the impacts of consumer preferences on the fuel vehicles’ demand differences under two different decision model; (d,h): the impacts of consumer preferences on the new energy vehicles’ demand differences under two different decision model;.
Sustainability 13 05821 g003
Figure 4. The impact of environmental friendliness and recognition for cruising capability on the profit difference of the auto supply chain. Dual consumer preferences: (a): impacts on the manufacturer’s profit; (b): impacts on the fuel vehicles retailer’s profit; (c): impacts on the new energy vehicles retailer’s profit; (d): impacts on profit of the auto supply chain.
Sustainability 13 05821 g004
Table 1. Parameters and variables.
Parameters NotationDefinition
Q Potential market size
α f Self-price sensitivity of fuel vehicles
α n Self-price sensitivity of new energy vehicles
θ Consumers’ preference for new energy vehicles, θ [ 0 , 1 ]
k f , k n Average fuel consumption of fuel vehicles and new energy vehicles (L/100 km)
k 0 The standard value (L/100 km)
c f , c n The unit cost of fuel vehicles and new energy vehicles
λ n ,   λ f Credit coefficient of fuel vehicles and new energy vehicles
ξ Requirement for the new energy vehicle credit ratio
β f , β n The cross-price coefficient of fuel vehicles and new energy vehicles
η Consumers’ willingness to pay for green, η ~ U ( 0 , 1 )
h The vehicles of cruising capability, h [ 0 , 1 ]
w f , w n The wholesale price of the traditional vehicle and new energy vehicle
p f , p n Retail price of the traditional vehicle and new energy vehicle
π M , π f , π n Profits of the manufacture, traditional vehicle retailer, and new energy vehicle retailer
q f , q n Market demands for the traditional vehicle and new energy vehicle
Table 2. Optimal decisions, demands, and profits of the decentralized automobile supply chain.
Parameters Notation Values
w f * [ ( 1 θ ) Q + h + η ( k 0 k f ) ] + β ( θ Q + δ h + η ( k 0 k n ) ) ( β 2 1 ) [ c f + p λ ( λ f + ξ ) ] 2 ( 1 β 2 )
w n * ( θ Q + δ h + η ( k 0 k n ) ) + β [ ( 1 θ ) Q + h + η ( k 0 k f ) ] + ( β 2 1 ) ( λ n p λ c n ) 2 ( 1 β 2 )
p f * ( 6 3 β 2 ) [ ( 1 θ ) Q + h + η ( k 0 k f ) ] + β ( 5 2 β 2 ) ( θ Q + δ h + η ( k 0 k n ) ) + ( 1 β 2 ) { 2 [ c f + p λ ( λ f + ξ ) ] β ( λ n p λ c n ) } 2 ( 1 β 2 ) ( 4 β 2 )
p n * ( 6 3 β 2 ) [ θ Q + δ h + η ( k 0 k n ) ] + β ( 5 2 β 2 ) [ ( 1 θ ) Q + h + η ( k 0 k f ) ] + ( 1 β 2 ) { β [ c f + p λ ( λ f + ξ ) ] 2 ( λ n p λ c n ) } 2 ( 1 β 2 ) ( 4 β 2 )
q f * 2 [ ( 1 θ ) Q + h + η ( k 0 k f ) ] + β [ θ Q + δ h + η ( k 0 k n ) ] + ( β 2 2 ) [ c f + p λ ( λ f + ξ ) ] β ( λ n p λ c n ) 2 ( 4 β 2 )
q n * 2 ( θ Q + δ h + η ( k 0 k n ) ) + β [ ( 1 θ ) Q + h + η ( k 0 k f ) ] + β [ c f + p λ ( λ f + ξ ) ] ( β 2 2 ) ( λ n p λ c n ) 2 ( 4 β 2 )
π f * { 2 [ ( 1 θ ) Q + h + η ( k 0 k f ) ] + β ( θ Q + δ h + η ( k 0 k n ) ) + ( β 2 2 ) [ c f + p λ ( λ f + ξ ) ] β ( λ n p λ c n ) } 2 4 ( 4 β 2 ) 2
π n * { 2 ( θ Q + δ h + η ( k 0 k n ) ) + β [ ( 1 θ ) Q + h + η ( k 0 k f ) ] + β [ c f + p λ ( λ f + ξ ) ] ( β 2 2 ) ( λ n p λ c n ) } 2 4 ( 4 β 2 ) 2
Table 3. Optimal decisions and demands of the centralized automobile supply chain.
Parameters Notation Values
p f * * ( 1 β 2 ) [ c f + p λ ( λ f + ξ ) ] + β ( θ Q + δ h + η ( k 0 k n ) ) + ( 1 θ ) Q + h + η ( k 0 k f ) 2 ( 1 β 2 )
p n * * ( β 2 1 ) ( λ n p λ c n ) + β [ ( 1 θ ) Q + h + η ( k 0 k f ) ] + θ Q + δ h + η ( k 0 k n ) 2 ( 1 β 2 )
q f * * 1 2 { ( 1 θ ) Q + h + η ( k 0 k f ) [ c f + p λ ( λ f + ξ ) ] β ( λ n p λ c n ) }
q n * * 1 2 { θ Q + δ h + η ( k 0 k n ) + ( λ n p λ c n ) + β [ c f + p λ ( λ f + ξ ) ] }
Publisher’s Note: MDPI stays neutral with regard to jurisdictional claims in published maps and institutional affiliations.

