1. Introduction
Improving the power system’s resilience against incidents and natural disasters has attracted much attention during the last decade. Resiliency depicts the capability of a system to withstand low-probability and high-impact incidents without causing a power outage. Microgrid (MG) deployments are considered a viable solution to cope with major extreme events [
1]. Besides, coupling adjacent MGs is offered as an effective solution to enhance power system resilience [
2]. In this way, MGs’ local power generation is an alternative backup for the critical loads of the adjacent MGs during extreme events [
3]. Due to the striking proliferation of gas-fired generations, energy infrastructure interdependencies, e.g., electricity and natural gas, are significant [
4]. Therefore, economic dispatch of power and gas is a necessity to enhance the resiliency of networked multi-carrier microgrids (NMCMG). On the other hand, the integration of distributed generations (DG) into the energy networks has created many challenges for power system operation. In this way, the uncertainties of non-dispatchable DGs, demands, and the electricity market make the problem non-deterministic. The uncertainties mentioned above should be addressed in the multi-carrier microgrids (MCMG)’ operational strategies to overcome the problem.
Demand response programs (DRPs) are workable solutions to hedge against the intermittency and volatility of renewable energy sources (RES) [
5]. The DRPs make it possible to integrate flexibility potentials of demand sectors, including residential [
6,
7], industrial [
8], commercial [
9], and agricultural sectors [
10], university districts [
11], and seaports [
12] into the power systems. The paper [
13] described several categories of DRPs. The research study [
14] presented a linear programming method to design isolated MGs considering electrical batteries’ aging model. The benefits of DRPs in the presence of local RES were estimated for typical isolated hybrid MGs in [
15]. In [
16], real-time pricing of DRP was utilized to encourage customers to shift and/or curtail demands in critical hours. The model investigates the impacts of demand response intensity and the cost of energy not served on MGs’ reliability and economy. The results show that the need for load shedding decreases as the penetration of responsive consumers increase. In [
17], interruptible load programs with price-based DRPs were addressed. The paper classified electrical demands into shiftable, adjustable, interruptible, and fixed loads. Reference [
18] employed a novel dynamic pricing scheme to make a profit for both responsive and non-responsive consumers. The dynamic pricing was measured based on the imported energy from the main grid and local generation of RES. The paper in [
19] proposed a hybrid robust/stochastic framework for optimal scheduling of a multi-energy MG comprised of electric vehicle parking lots, power-to-gas facility, and price-responsive shiftable loads.
Reference [
20] proposed a hybrid analytical-heuristic approach to determine the optimal generation of domestic units in the day-ahead market. Reference [
21] studied heuristic algorithms to optimize DGs’ size and location as voltage regulators in distribution systems. Different charging/discharging strategies for electric vehicles were addressed considering the uncertainties associated with RES and demands in [
22]. In [
23], electric vehicles and charging stations were offered as distributed resources to enhance power system resiliency. Reference [
24] analyzed the real-time performance of a rooftop solar-based MG. The paper took advantage of financial incentives to reach 40 GW power generation capacity for rooftop photovoltaic panels to compensate for the high investment cost of batteries. Reference [
25] proposed a resiliency-oriented energy scheduling for hybrid MGs considering feasible islanding and survivability of sensitive demands. The model is split into normal and emergency modes. The objectives of normal and emergency modes are to minimize the operational cost considering feasible islanding in normal mode and maximize the power system reliability for islanding mode. The joint optimization of energy and reserve scheduling of renewable-powered MGs was proposed to minimize the cost-emission function using the epsilon-constraint approach in [
26]. The optimal operation of MGs under normal and emergency operating conditions was facilitated incorporating efficient time-rate-based DRP as an effective reserve option to smooth the usage pattern of consumers and minimize the procurement costs. Reference [
27] employed the moth-flame algorithm to optimize the operation of a hybrid energy system, including various distributed energy resources (DERs). An efficient joint optimization problem was presented to minimize the overall fuel and emission costs in a photovoltaic-based MG in [
28]. In [
29], an economic pollution dispatch problem was suggested to minimize the operation cost of urban MGs addressing the local pollution from power and heat generation facilities.
An iterative energy scheduling model was proposed to quantify MGs’ local power exchange price and unused capacity in [
30]. A robust game-theoretic model was devised to cope with energy trading between coupled MGs in [
31]. In this way, the Nash equilibrium point is determined under a scenario-based model. A coalitional game-theoretic algorithm was proposed to optimize the energy exchange among MGs in [
32]. In [
33], the concept of adjustable demand was adopted to optimally schedule low-cost resources for meeting the resiliency requirements of multiple MGs. A dynamic pricing mechanism was proposed to optimize the operational strategies of multiple MGs in [
34]. A novel bi-level energy management system for isolated networked MGs was proposed utilizing a step-wise DRP model in [
35]. This paper also introduced a novel pricing model based on MG marginal pricing for the power exchange between interconnected MGs. Furthermore, employing DRPs resulted in the convergence of buses’ voltages to their rated values.
The NMCMG is initially inspired by the multi-carrier energy hub model. The NMCMG can be exploited to streamline the complex tasks of energy management and efficiently deal with different load growth scenarios in market prices within a network of MCMGs [
36]. In [
37], the MG resilience against severe events was reviewed from centralized, decentralized, and hybrid energy management systems. A distributed method was presented to satisfy the demands in decentralized energy management in [
38]. The results showed that centralized energy management enhances MGs’ resiliency considerably compared with the other strategies. Reference [
39] proposed a central controller for NMCMG systems aggregating signals from local central controllers to simplify energy management. A strategy for optimal energy management of MCMGs was proposed to minimize thermal energy loss in [
40]. The potential benefits of cooperation between multiple MCMGs at the distribution level were highlighted in [
41]. Simulation results confirmed that the financial feasibility of MCMGs can be enhanced through a local power exchange between MCMGs.
To narrow this gap, this paper proposes a probabilistic optimal dispatch of energy in electric and natural gas networks in an NMCMG. To integrate flexibility potentials of MCMGs into the main grid, the approach uses a combination of incentive-based and time-based DRPs (IBDRP and TBDRP). In this way, the approach unlocks the flexibility potentials of responsive consumers to compensate for the power shortage during unpredicted failures in power/gas lines. Furthermore, the dual dependency of heat and power generation in combined heat and power (CHP) units is regarded in the model where the overall efficiency and heat to power (H2P) ratio are in variation with the loading level. The model aims to minimize the costs associated with the operation, maintenance, unserved energy, CO2e emission, CHP startup and shutdown, penalty, and incentive payments while satisfying local customers’ power and heat demand. The uncertainties associated with the thermal and electrical load forecast errors, RES power generations, and electricity market are modeled with probability distribution functions (PDFs). To sum up, the main contributions of the study can be stated as follows:
Proposing a mathematical model of NMCMG addressing the interdependencies of gas and electricity networks;
Optimizing the operational strategies of NMCMG in the presence of uncertainties associated with electrical and thermal demands, electricity market, and RES;
Introducing varying H2P ratio of CHP units with respect to the loading level;
Integrating the flexibility potentials of responsive thermal/electrical consumers into the main grid using IBDRP and TBDRP.
The rest of the paper is organized as follows: In
Section 2, the key points of the suggested approach are described qualitatively. This section gives the authors a general insight into the problem.
Section 3 provides the mathematical formulations of the proposed approach in detail. In
Section 4, the simulation results and discussions are stated. Finally,
Section 5 concludes the suggested approach.
3. Mathematical Formulations
In this section, the fundamentals of the suggested approach are modeled mathematically. For the sake of clarity, subscript/superscript is introduced to distinguish the terms related to the introduced variables or parameters of the same symbol from those related to their variations as indices.
3.1. Uncertainty Characterization
In energy studies, energy systems are subject to uncertain variables, e.g., energy price, demand level, renewable power generation, etc. In this way, the deterministic approaches may fail to optimize energy systems’ operation, especially in multi-carrier energy systems. To overcome the barrier, this study suggests the probabilistic optimal dispatch considering uncertainties associated with electrical/thermal demand, electricity prices, and renewable power generation. To model the uncertain behavior of the stochastic variables, the best-fitted PDFs are incorporated into the problem. Consequently, the operational strategies of the MCMGs are optimized, addressing the probability distribution of the imperfect data.
The normal PDF fits the electrical and thermal demands reasonably well [
43]. The normal PDF can be stated as follows:
where
x is the uncertain variable with imperfect data,
μ and
σ are the mean and standard deviation of the normal PDF, respectively.
In the electricity market, energy price is widely modeled by the lognormal PDF [
44]. Therefore, the distribution of the electricity price is formulated by the lognormal PDF as follows:
A lognormal distribution with mean m and variance
v has parameters:
The power generation of WTs is strongly dependent on the wind regime. In this way, the Weibull PDF normally fits the wind velocity [
45]. Therefore, the Weibull PDF is adopted in this study as follows:
where
is the wind velocity,
α is the scale parameter, and
β denotes the shape parameter.
Afterward, the wind turbines’ power curves indicate how large the electrical power output is generated at different wind speeds. The power curves of the wind turbines are formulated as follows [
46,
47]:
Finally, the beta distribution function [
48] is employed to model the uncertainty of solar irradiation as follows:
where Γ(.) denotes the gamma function.
In the same way, there is a strong correlation between solar irradiation and PV output power. Therefore, the power curves of solar panels are modeled to describe the power output of the PV units as follows:
3.2. Energy Storage
The energy storage systems have great flexibility potentials to enhance the resiliency of MGs [
49]. The storage systems provide operational flexibility for the MGs when a power outage occurs due to unpredicted failure in local DGs and/or power lines. Moreover, they can hedge against the intermittency of RES. Therefore, the mathematical formulation of the storage system can be presented as follows:
Equation (9) describes the state of charge (
SoC) of the storage systems. Inequality (10) illustrates the upper and lower thresholds of the storage capacity. The energy loss of the storage unit is presented by (11). The energy storage system is subject to the following constraints:
Equation (12) presents the upper and lower thresholds of energy storage capacity. Equation (13) enforces that the initial charging state is equal to the charging state’s last cycle.
3.3. Power and Gas Flow
In multi-carrier energy systems, there is a strong correlation between optimal flows of power and gas. The approach addresses the DC power flow in the electricity network based on the nodal power balance and line constraints regarding the power network. The nodal power balance at power node
n can be stated as follows:
In the same way, the gas flow balance for node
g can be formulated as follows:
Equations (15) and (16) describe the gas flows to the connected nodes as a function of upstream and downstream pressures. The flow equation is generally valid for all types of isothermal pipelines, including liquid and gaseous.
3.4. Resilience Criteria
In this paper, a resilience index is developed to exhibit the resilience of MCMGs during emergency modes. The resilience index denotes the supplied demand during disruptions as follows:
The resilience index is applied for both electricity and heat demands as
3.5. Demand Response Programs
In this study, to unlock the flexibility potentials of the demand-side, two types of DRPs are addressed, including IBDRPs and PBDRPs. The suggested DRPs are implemented to electrical and heat demands. This model is comprised of a linear economic model of price-based and incentive-based demand responses. The model can be presented mathematically as follows [
50]:
The initial price for flexible demands is described as follows:
In the DRP, the customers change their demands in response to operators’ requests. The system operator allocates incentive costs to the consumers who participated in the DRPs. In contrast, the contracted customers in the compulsory DRPs will be fined by a penalty cost if they refuse to provide demand flexibility according to the contract. Further information about the DRPs can be found in [
50,
51].
3.6. Networked Multi-Carrier Microgrid
In this study, two-stage energy management is proposed to optimize the operational strategies of the NMCMG in the presence of stochastic variables. In the first stage, a significant number of scenarios are generated for the uncertain variables. In the second stage, the uncertain scenarios are imported to the energy management of the NMCMG. To present the mathematical model of the NMCMG, the cost function and the operational constraints are illustrated in the following subsections.
3.6.1. Cost Function of the NMCMG
The objective is to minimize the total operation cost of the NMCMG. The total cost of the NMCMG is comprised of the operation, maintenance, reliability, CO2e emission, CHP startup and shutdown, energy incentive and penalty costs as follows:
The cost function of the NMCMG is comprised of seven terms. The first term describes the energy trading cost. The second term denotes the maintenance cost of the DGs. The third term presents the reliability cost of curtailed demands. The fourth term denotes the CO2e emission tax. The fifth term declares the startup and shutdown cost of CHP units. Finally, the last two terms illustrate the incentive payment and penalty cost of responsive demands.
The energy trading cost of the NMCMG can be formulated as follows:
The utility grid power () can be positive (import), negative (export) or zero.
The overall maintenance cost of local DERs is expressed as follows:
The first term denotes the maintenance cost of DGs. The second term illustrates the depreciation cost of energy storage systems.
The startup and shutdown cost of CHP units is expressed in (23). Equations (24) and (25) declare CHP units’ startup and shutdown status by using binary variables
SU and
SD as follows:
The emission cost for the main grid and local DGs is calculated as follows:
The positive sign in denotes the electricity purchase from the utility grid.
Although DRPs and energy storage are employed to supply demands during unpredicted disruptions, the load shedding scheme plays a key role in the contingency management of the NMCMG. Therefore, the reliability cost implies unserved energy costs for reimbursing curtailed demands as follows:
The DRPs are comprised of incentive payment and penalty cost. In this way, the payments can be formulated as follows:
Equation (28) describes the incentive payment for contracted consumers who fulfilled the flexibility requirements. Equation (29) states the penalty cost for consumers who have refused to meet the flexibility requirements of the contracts. In this way, the penalty cost is allocated based on the participation rate of the consumers. If the participation rate is lower than the agreed value in the contract, the consumers are faced with a penalty cost. Equation (30) shows the participation rate of the flexible demands. Detailed information about the DRPs is found in [
52].
3.6.2. Constraints of the NMCMG
In addition to the previous constraints, the NMCMG is subject to additional operational constraints associated with self-generation facilities, power balance, and required reserve. In this section, the complementary constraints are explained.
The following equations describe the power generation of the CHP and gas boilers in terms of power and heat. The fuel consumption function of the CHP units is modeled as (31) based on [
53]. Equations (31)–(34) are used to represent the features of CHPs using the power–heat feasible operating regions of type-one CHP units in [
54]. Inequalities (35) and (36) show the upper and lower thresholds of the electrical and thermal power generated by CHPs.
The H2E ratio of CHPs is defined as the ratio of the heat output to the electricity output, which is also closely linked with the overall efficiency and loading level of CHPs. The H2E ratio is expressed in (37). The electricity and heat output ramp constraints of CHP units are expressed in (38) and (39). Here,
is the ramp rate of CHP units and ΔT is the time step length of 60 min.
The operation of gas-boilers satisfies the following constraints. Equation (40) denotes boilers’ heat production as a function of injected natural gas and unit efficiency. Inequality (41) shows the upper and lower thresholds of the generated power by boilers.
Equation (42) illustrates the total gas consumption of gas-fired units, including CHPs and boilers.
The power and heat balance equations of the NMCMG are formulated as follows:
Equation (43) presents the power balance equation. As the equation reveals, the summation of exchanged power with the electric utility network, power generation of DERs, and curtailed demands are equal to the summation of non-responsive and responsive electrical demand. In the same way, Equation (44) enforces that the exchanged heat with adjacent MCMGs, the produced/converted thermal power by DERs and the amount of curtailed heat demand are equal to the heat demand including both non-responsive and responsive consumers.
The following equation balances the thermal power exchange of the MCMGs:
Equation (45) ensures the thermal balance between MCMGs.
The power and gas distribution networks are subject to the following operational constraints:
Inequality (46) confines the power flow of distribution lines. In the same way, the capacity of the gas flow in the gas distribution network is restricted by inequality (47). The inequality (48) ensures that the voltage phase satisfies the upper and lower standard deviations at electrical nodes. The node pressure in the gas distribution network is guaranteed by (49).
Reserve margin should be considered available to compensate for the unpredicted power shortage in the generation units or increase in demand that might stem from the probabilistic nature of resources [
55]. Dispatchable units serving as fast-responding frequency and voltage regulators must remain online to provide power once any disturbance or power oscillation occurs. The battery charging can be utilized to contribute to reserve availability. The constraints associated with reserve availability can be stated as follows:
Equation (50) describes that the available online reserve is proportional to the critical demand of the MCMGs. Equation (51) explains that the generation capacity of DERs and storage capacity of energy storage provides adequate reserve when the MCMGs face power shortage. In the worst-case scenario, loads with low priorities will be curtailed to maintain the MCMG frequency within the allowable limits.
4. Results
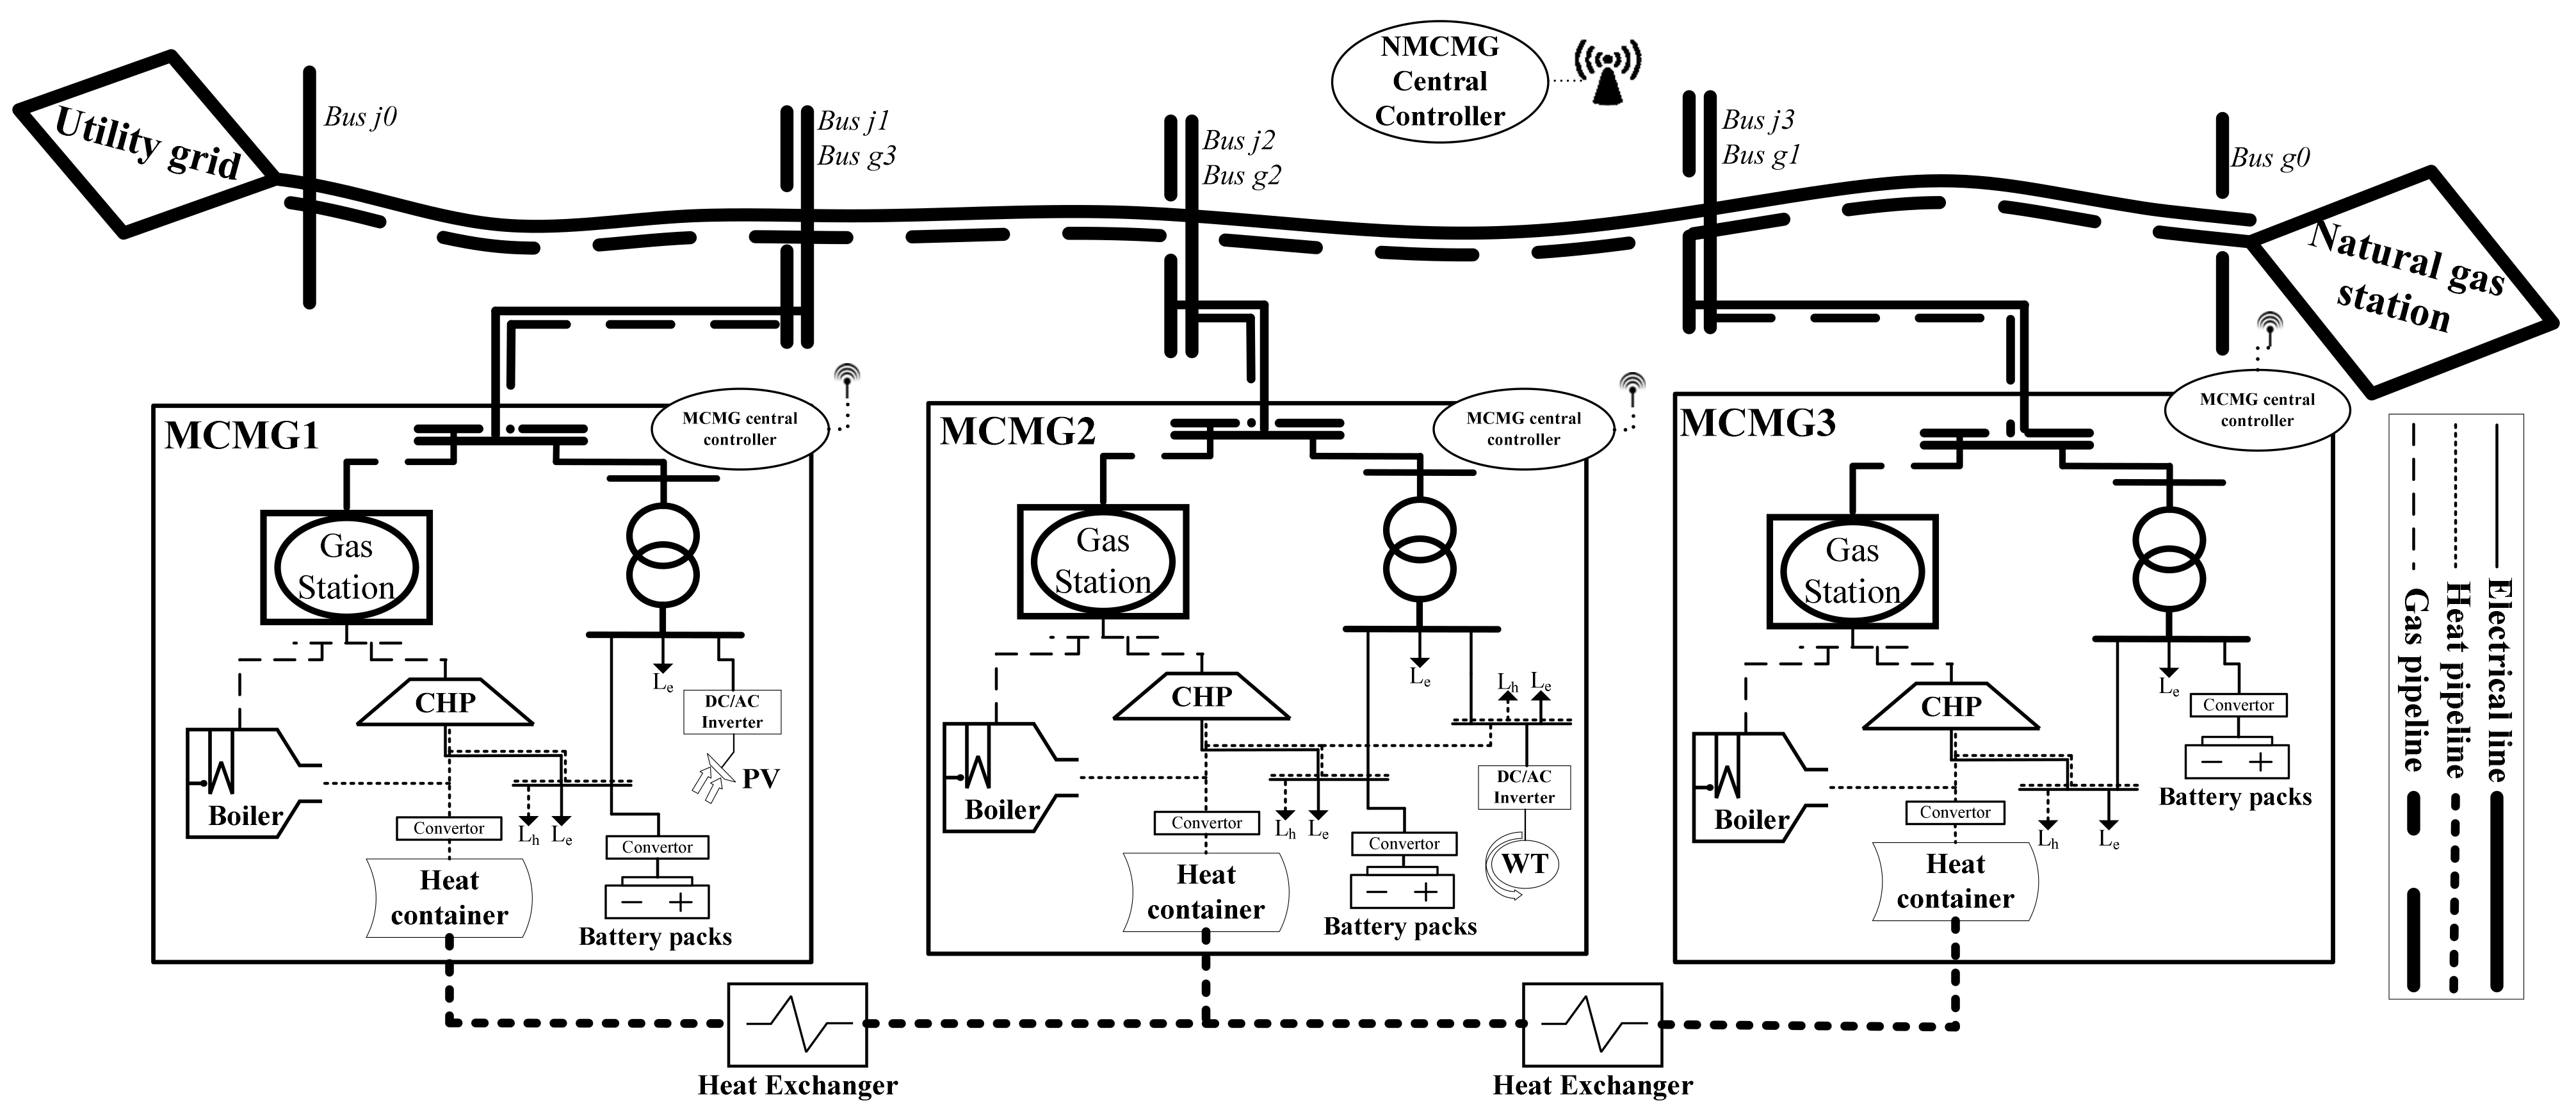
In this study, the suggested NMCMG comprises three MCMGs respectively resided by 504 residential, 7 agricultural, and 12 industrial customers. The MCMGs are interconnected through the power and natural gas networks. In order to show the proficiency of the proposed approach, two different modes are addressed, including normal and emergency operation modes. The emergency mode makes it possible to optimize the operation of the MCMGs under extreme conditions. Adversely, no failure and/or power outage occurs in the normal operation mode. The time horizon of the problem is 24 h on an hourly basis. The main aim is to unlock the flexibility potentials of electrical and heat demands to minimize the total operation cost of the MCMGs.
Table 1 describes the technical characteristics of the electrical/thermal infrastructures of the MCMGs. In order to hedge against the imperfect data of stochastic variables, 500 scenarios are generated for wind speed, solar irradiation, and demands.
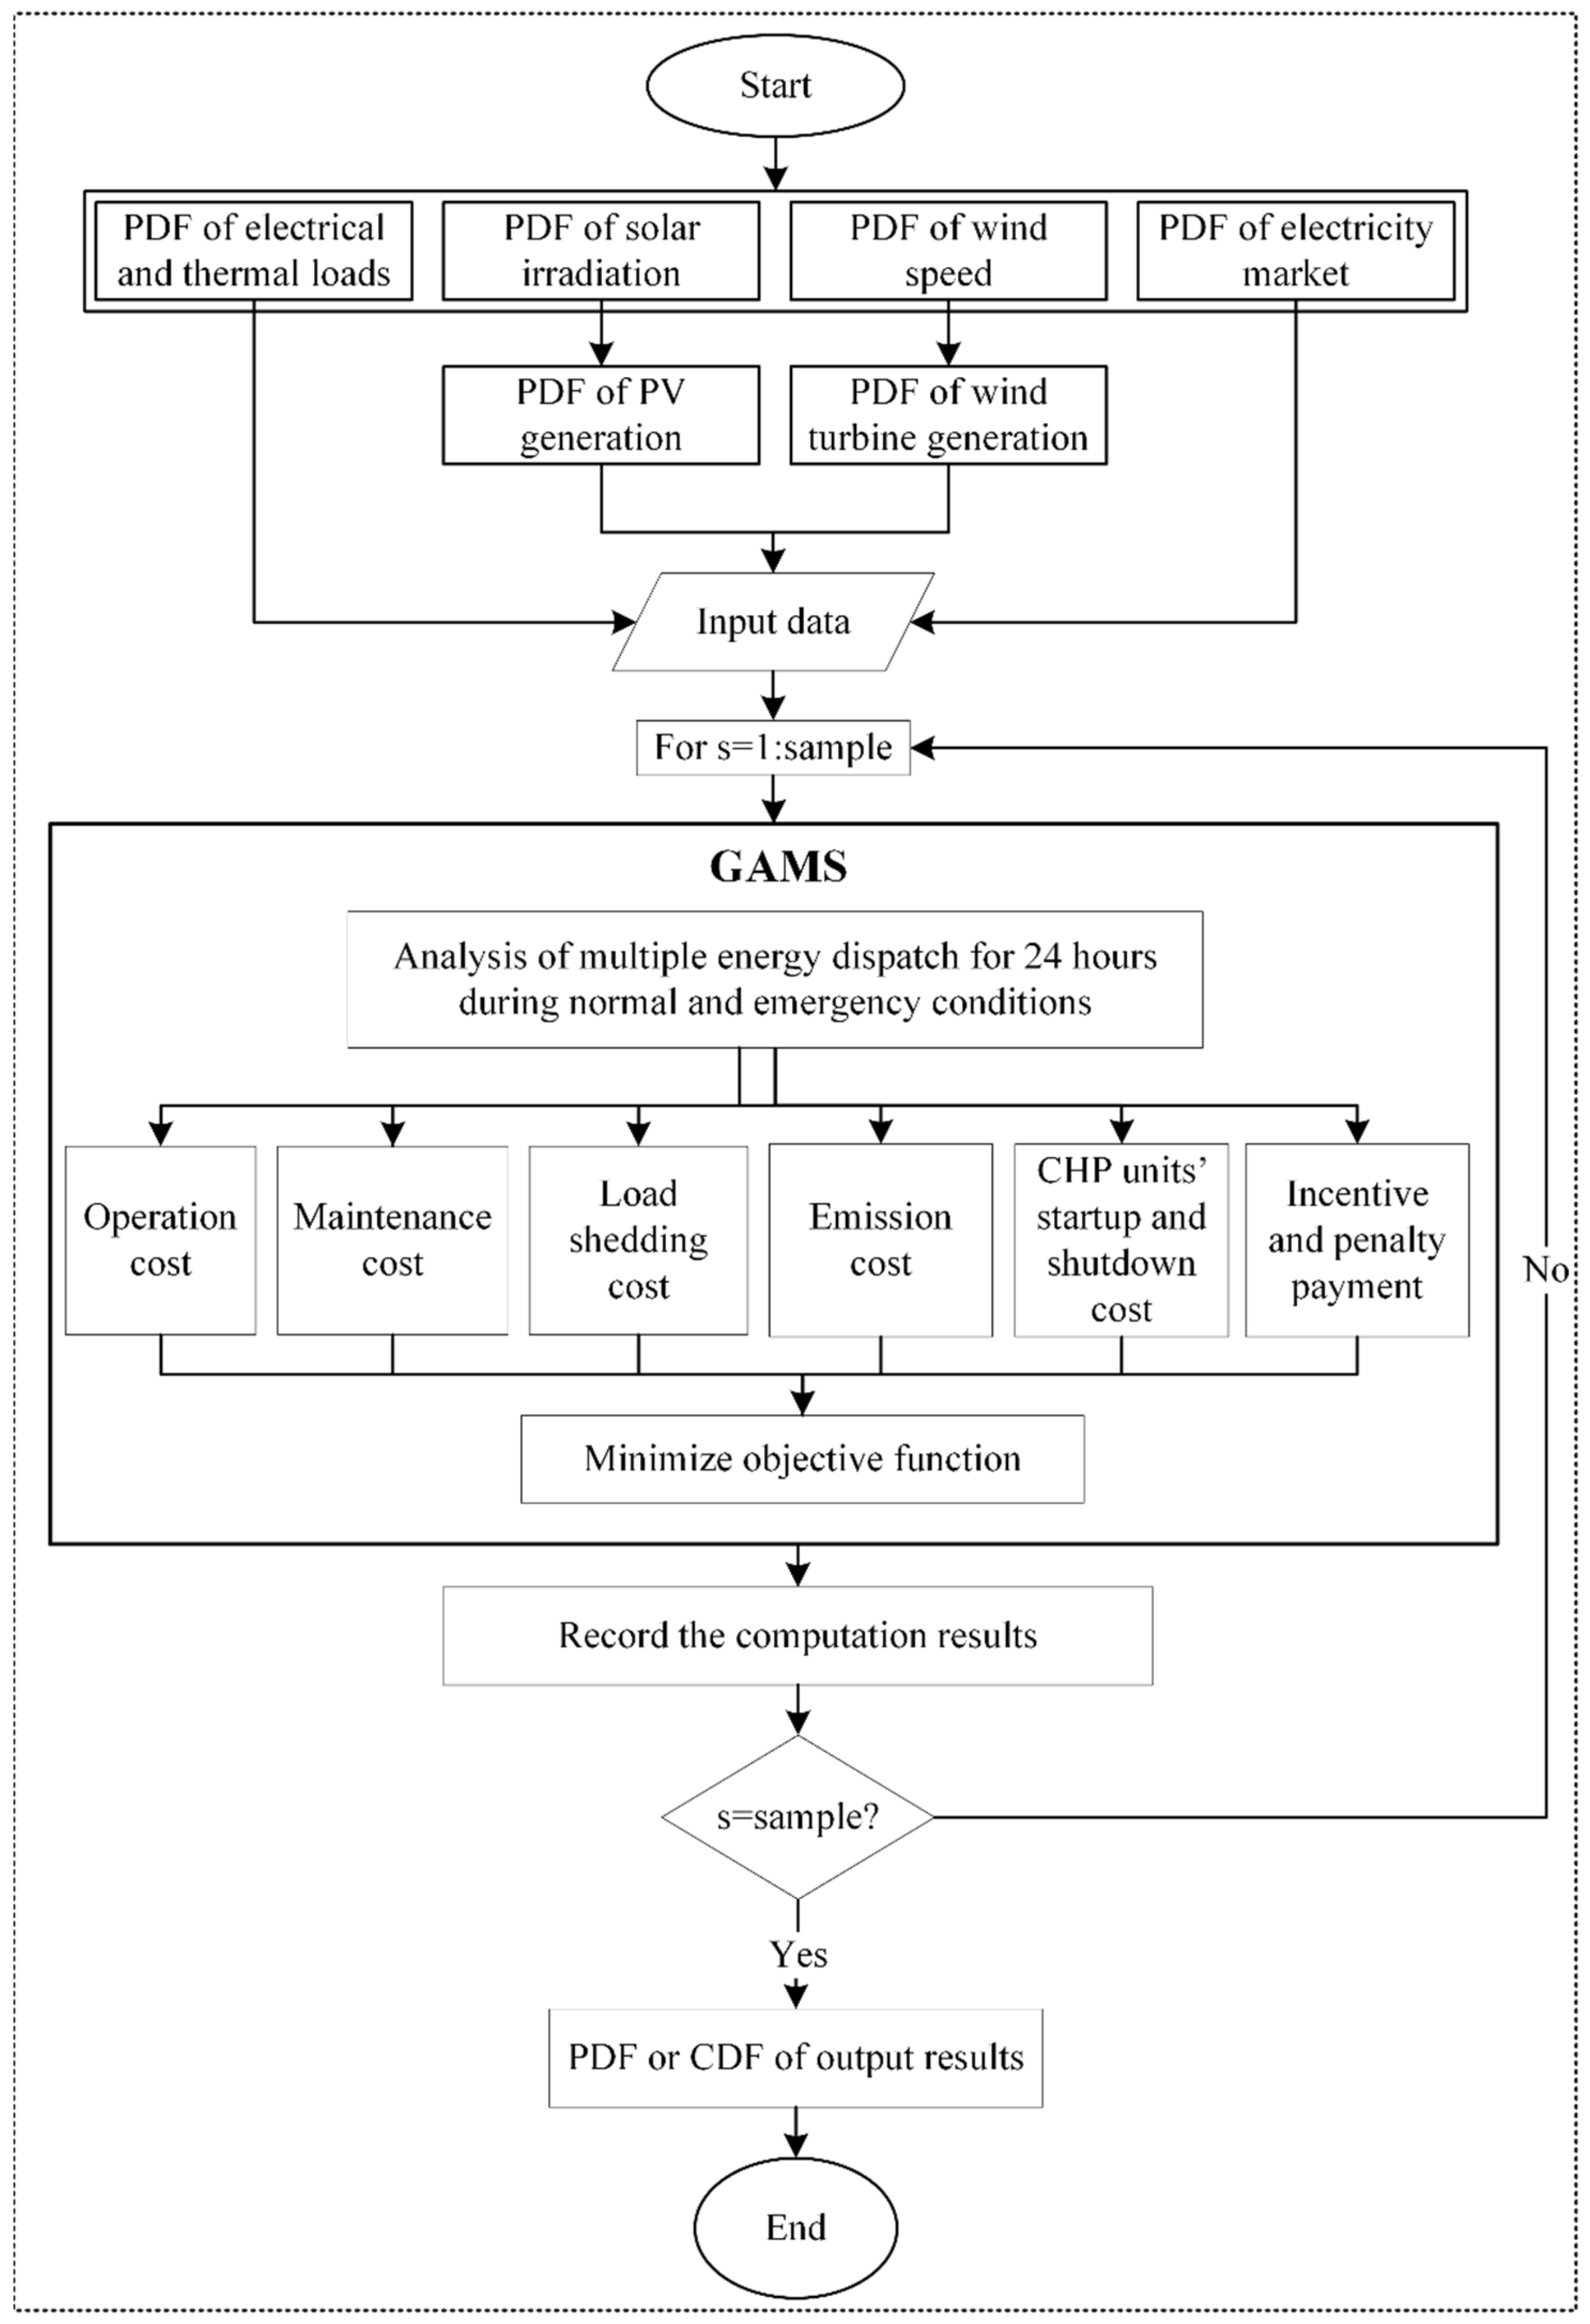
Figure 3 describes the general procedure of the proposed approach. This diagram provides general insight into the proposed approach.
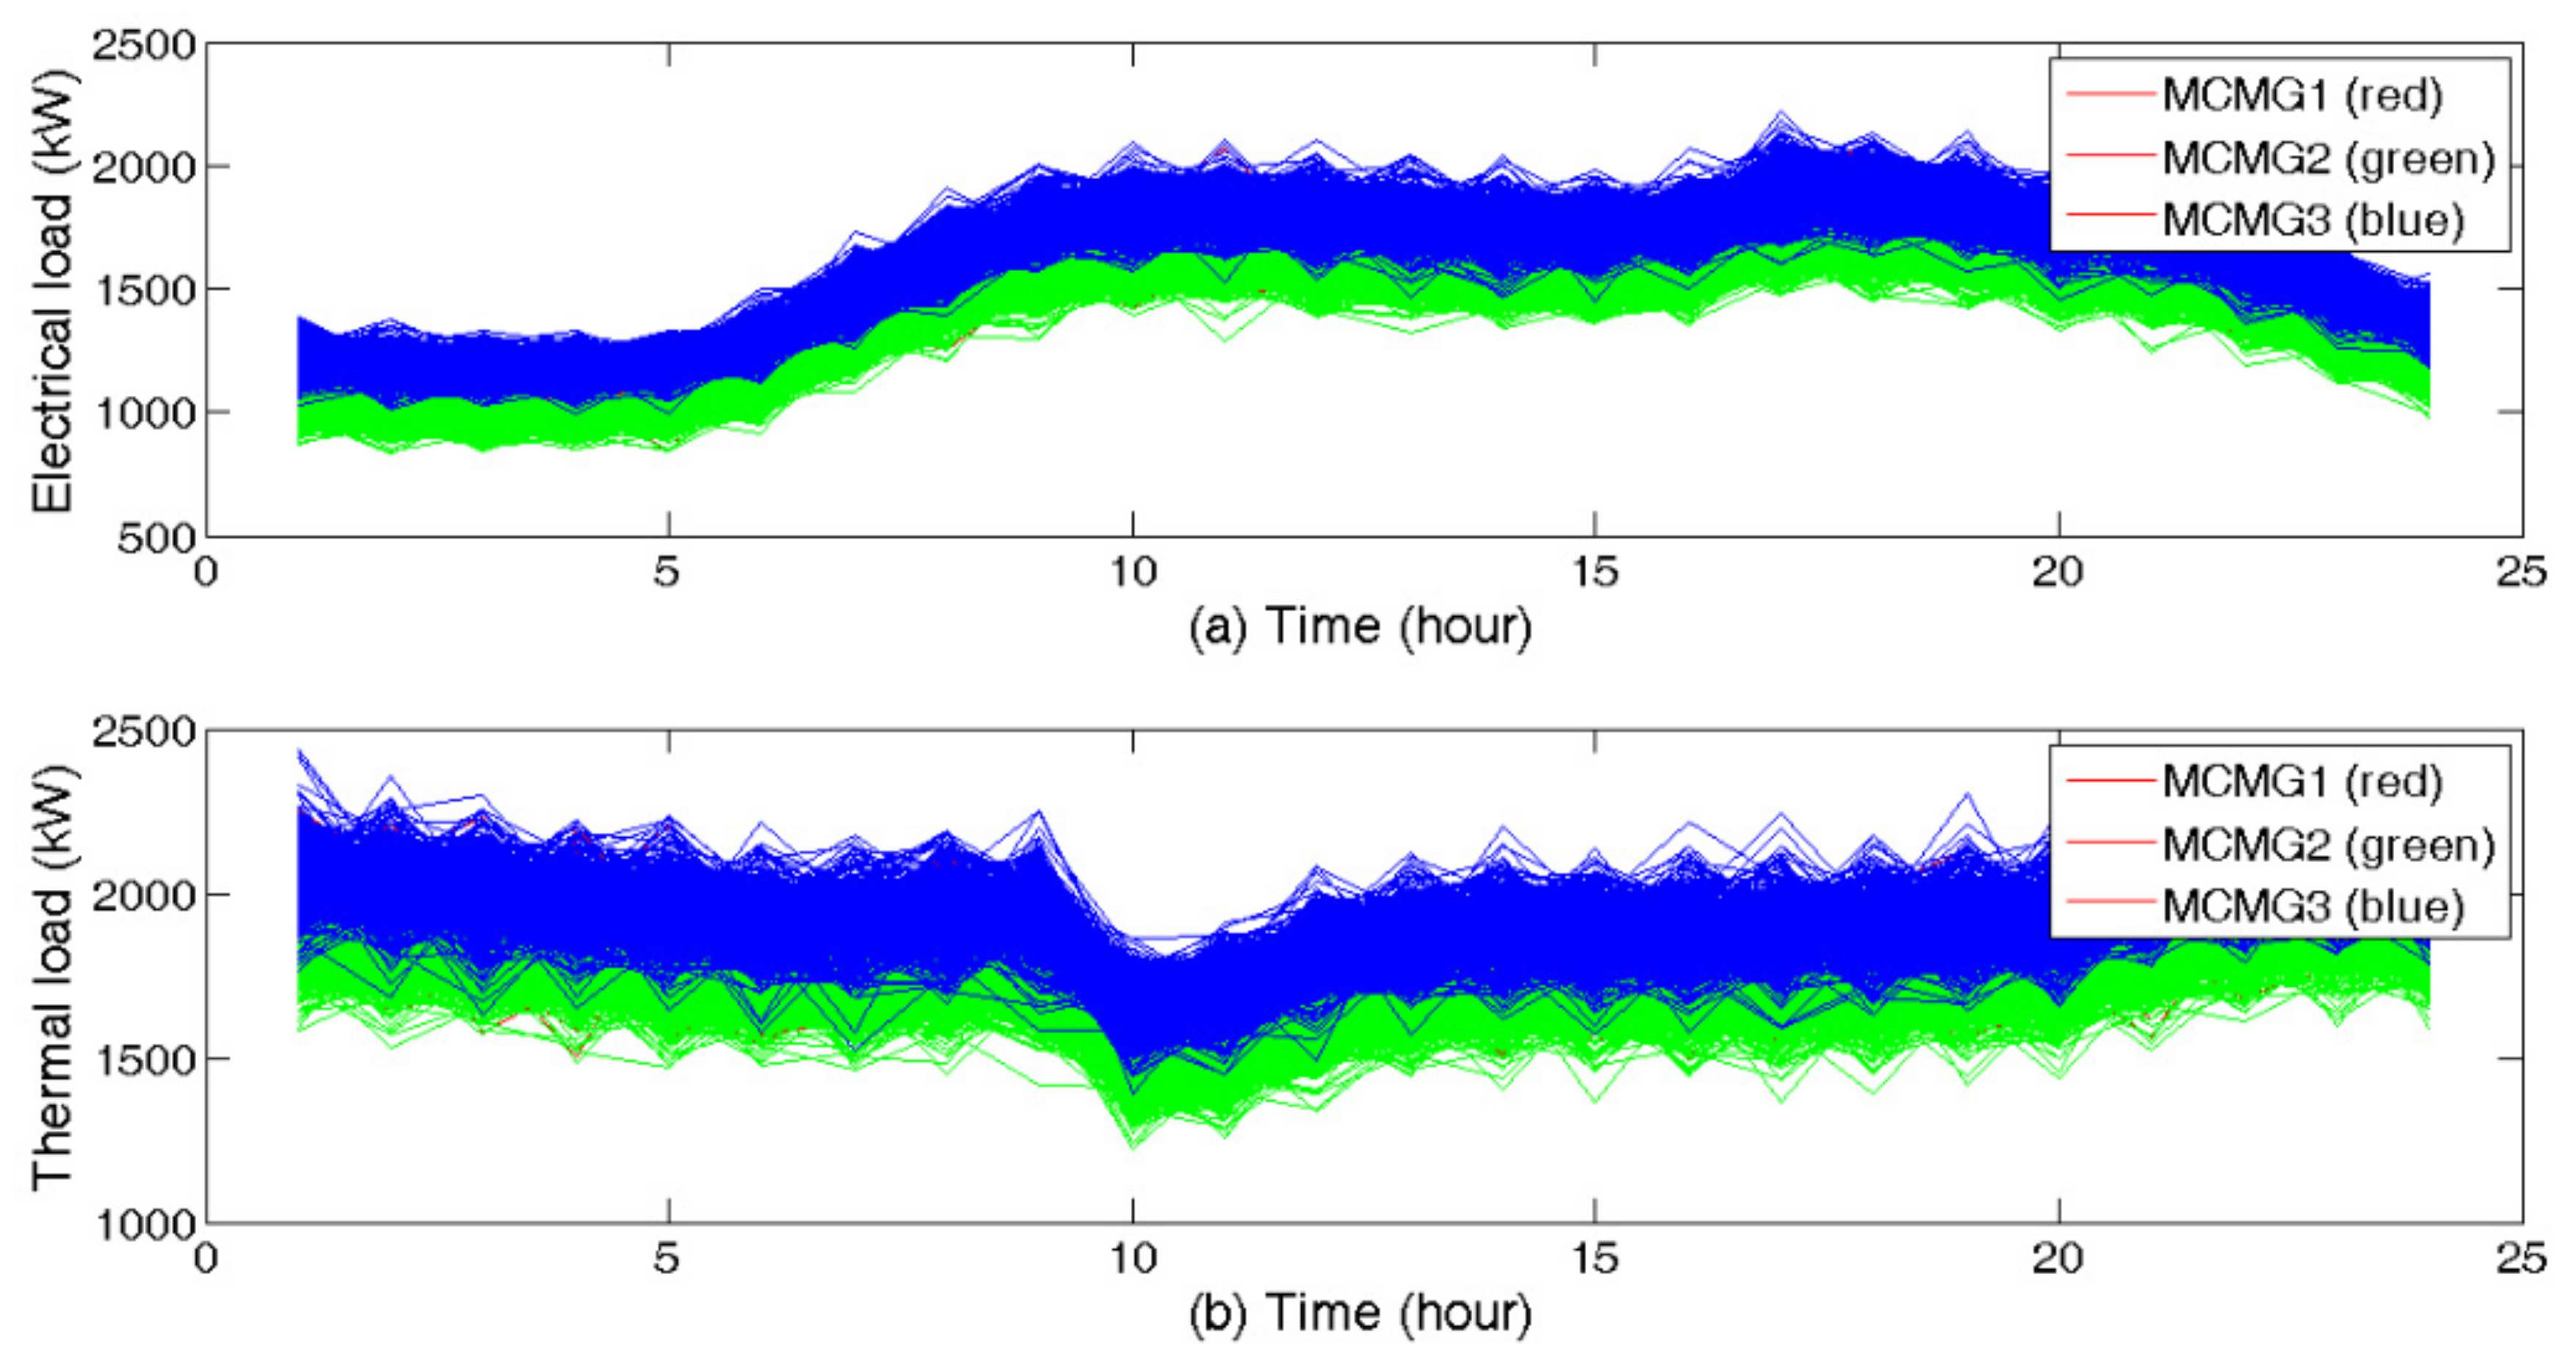
Figure 4 depicts the electrical and thermal load profiles of the MCMGs. The mean and standard deviation values of lognormal PDF for electricity prices are considered 0.113 and 0.007, respectively. Moreover, the natural gas price is considered 0.023 (USD/kWh).
The operation strategies of the MCMGs are optimized for four case studies. The case studies describe the different failure and contingency modes in the power and gas networks. Case Study 1 illustrates the normal operation mode for the three MCMGs. In Case Study 2, a contingency analysis is carried out. Case Studies 3 and 4 are allocated to failure modes. Note that the failure modes disrupt the power and gas networks. In contrast, in the contingency mode, the congestion occurs in the distribution lines without severe interruption. In Case Studies 3 and 4, it is assumed that the failure occurs at 07:00 p.m., and it takes four hours to be cleared.
Table 2 describes the characteristics of four case studies.
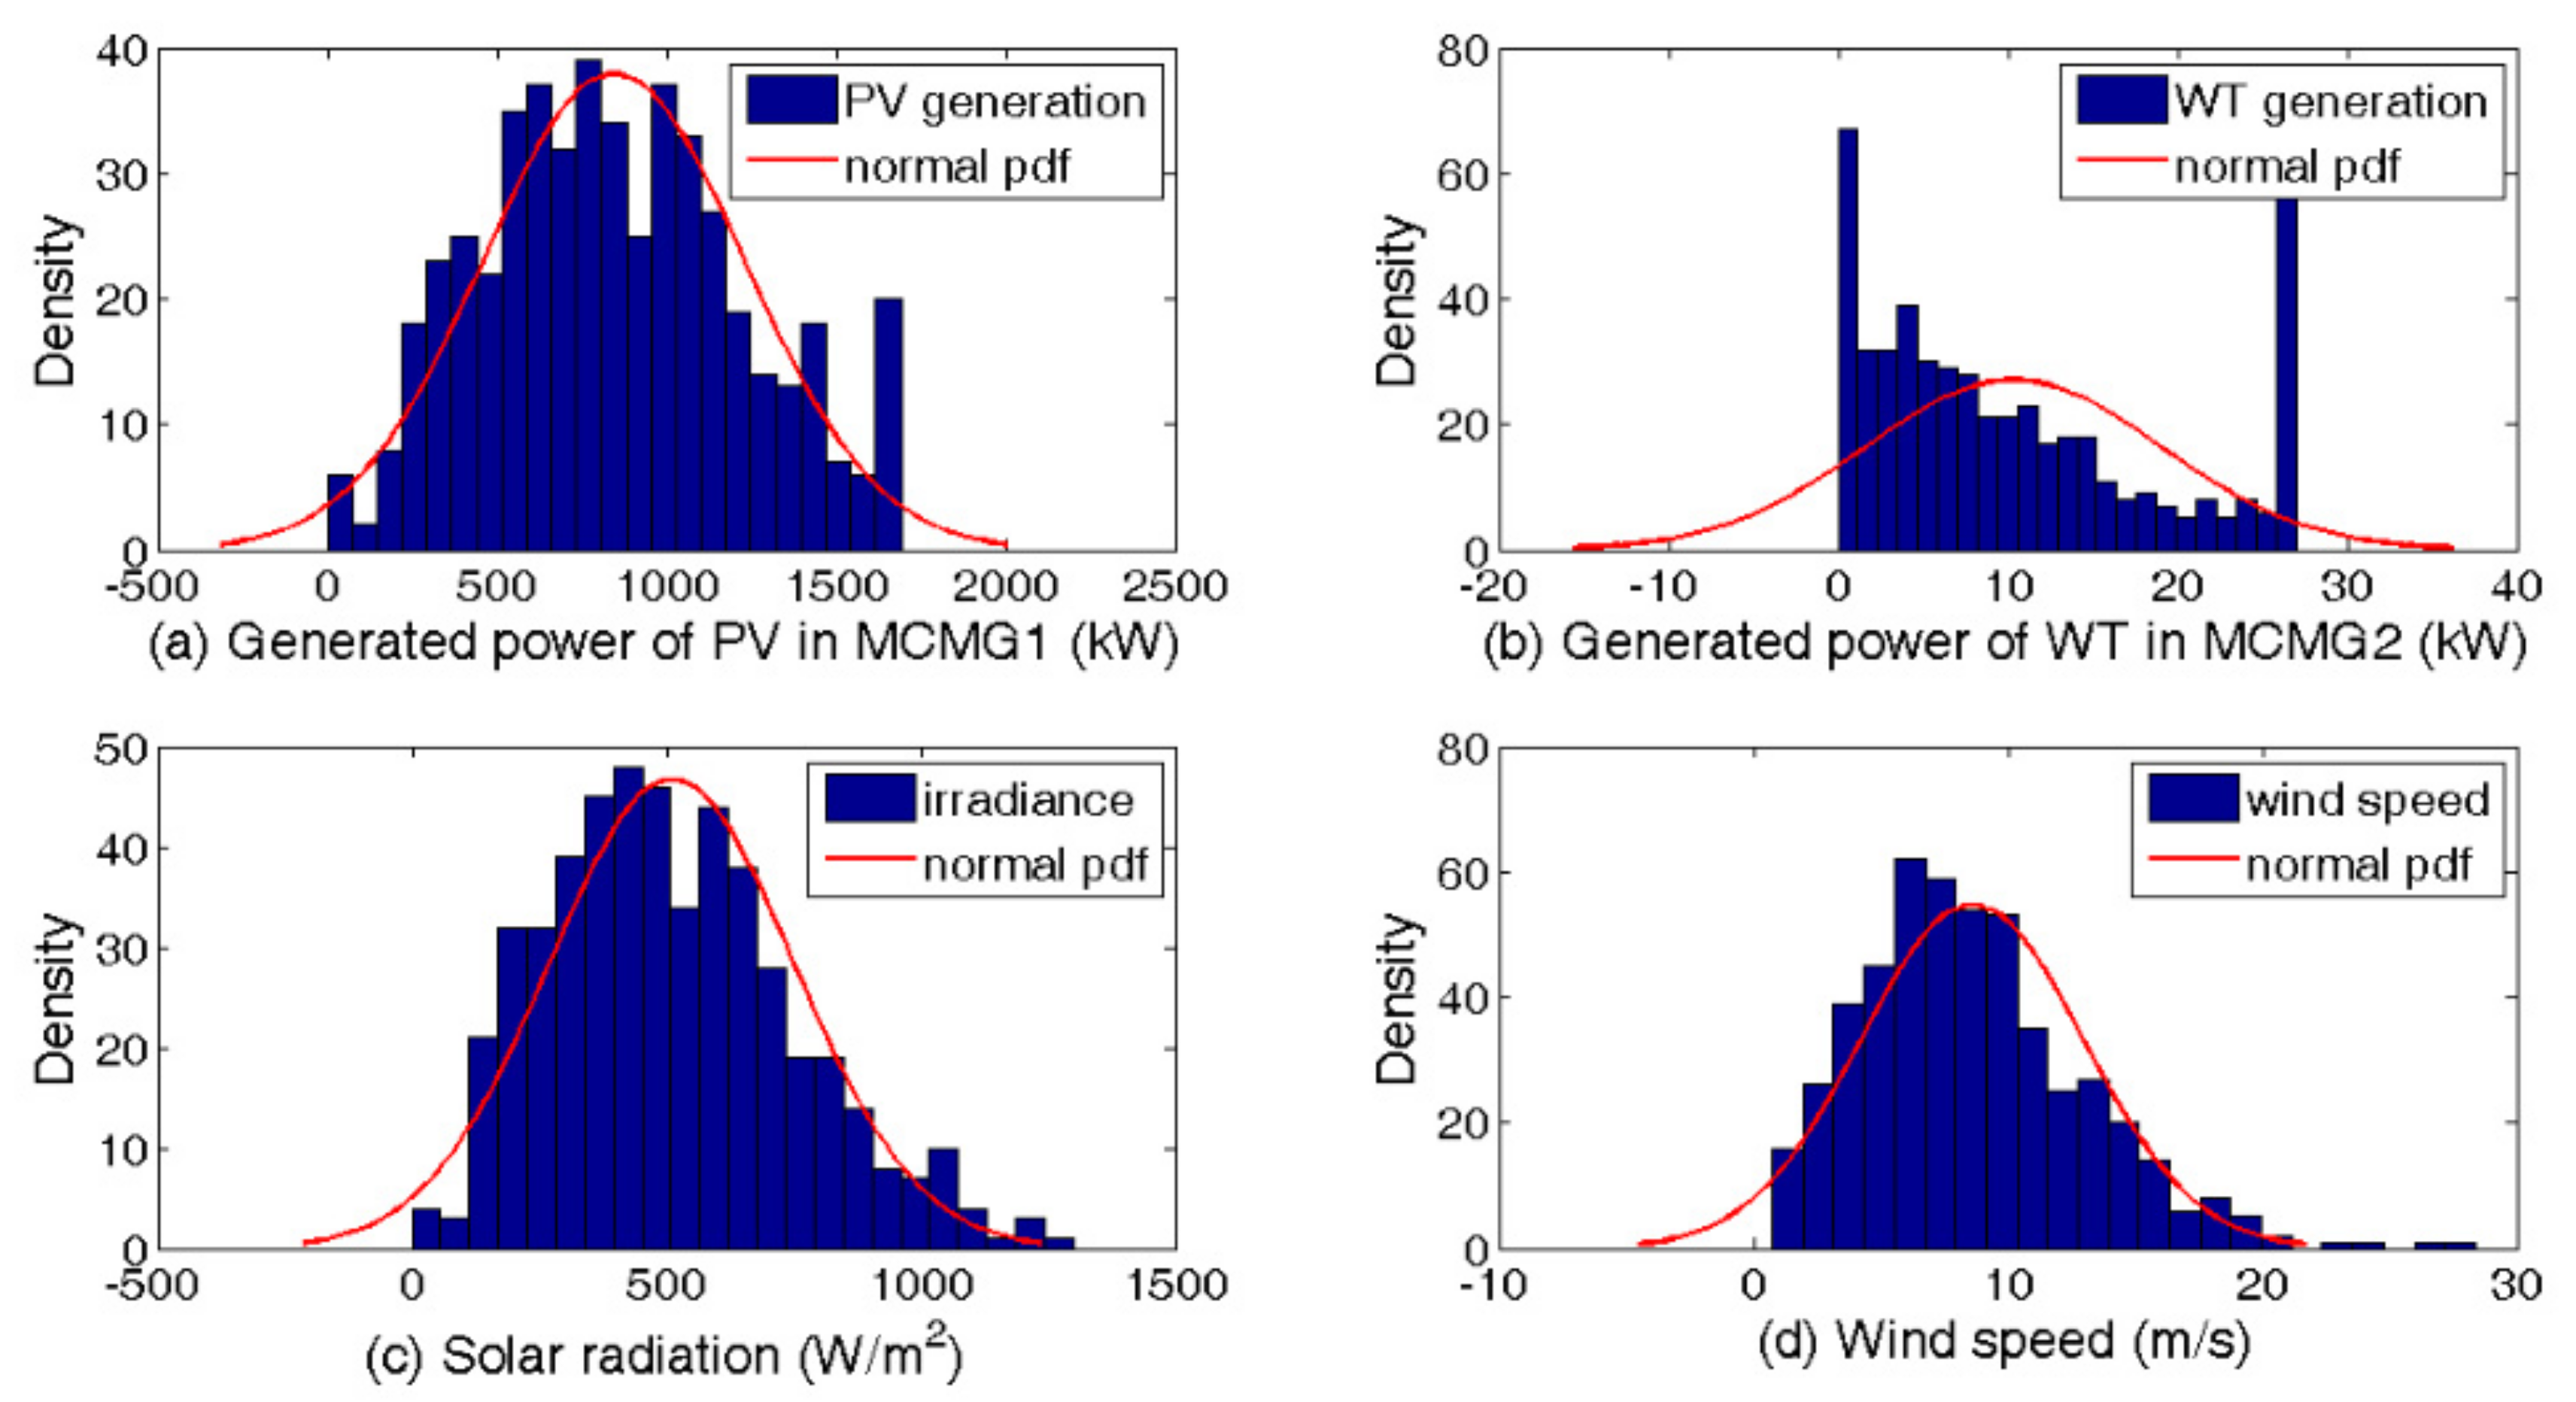
The renewable generation units are comprised of WTs and PVs. In this way, 4 × 250 kW wind turbines are modeled in MCMG 2. Moreover, a 2 MW PV site is located in MCMG 1.
Figure 5 depicts the characteristics of the WT and PV. The bar graphs illustrate the probability distribution of wind velocity, output wind power, solar irradiation, and output solar power for hour 12 of the day.
Table 3 illustrates the optimized operational strategies of the MCMGs in Case Study 1 for hour 12 of the day. The results indicate that the standard deviation of power generation increases when they are located near RESs.
Table 4 describes the mean and deviation values of the daily purchased energy from the main grid by the NMCMG. The results reveal that, as the penetration of RES increases, the possibility of power purchase from the main grid decreases; thus, the possibility of congestion in transmission lines decreases noticeably.
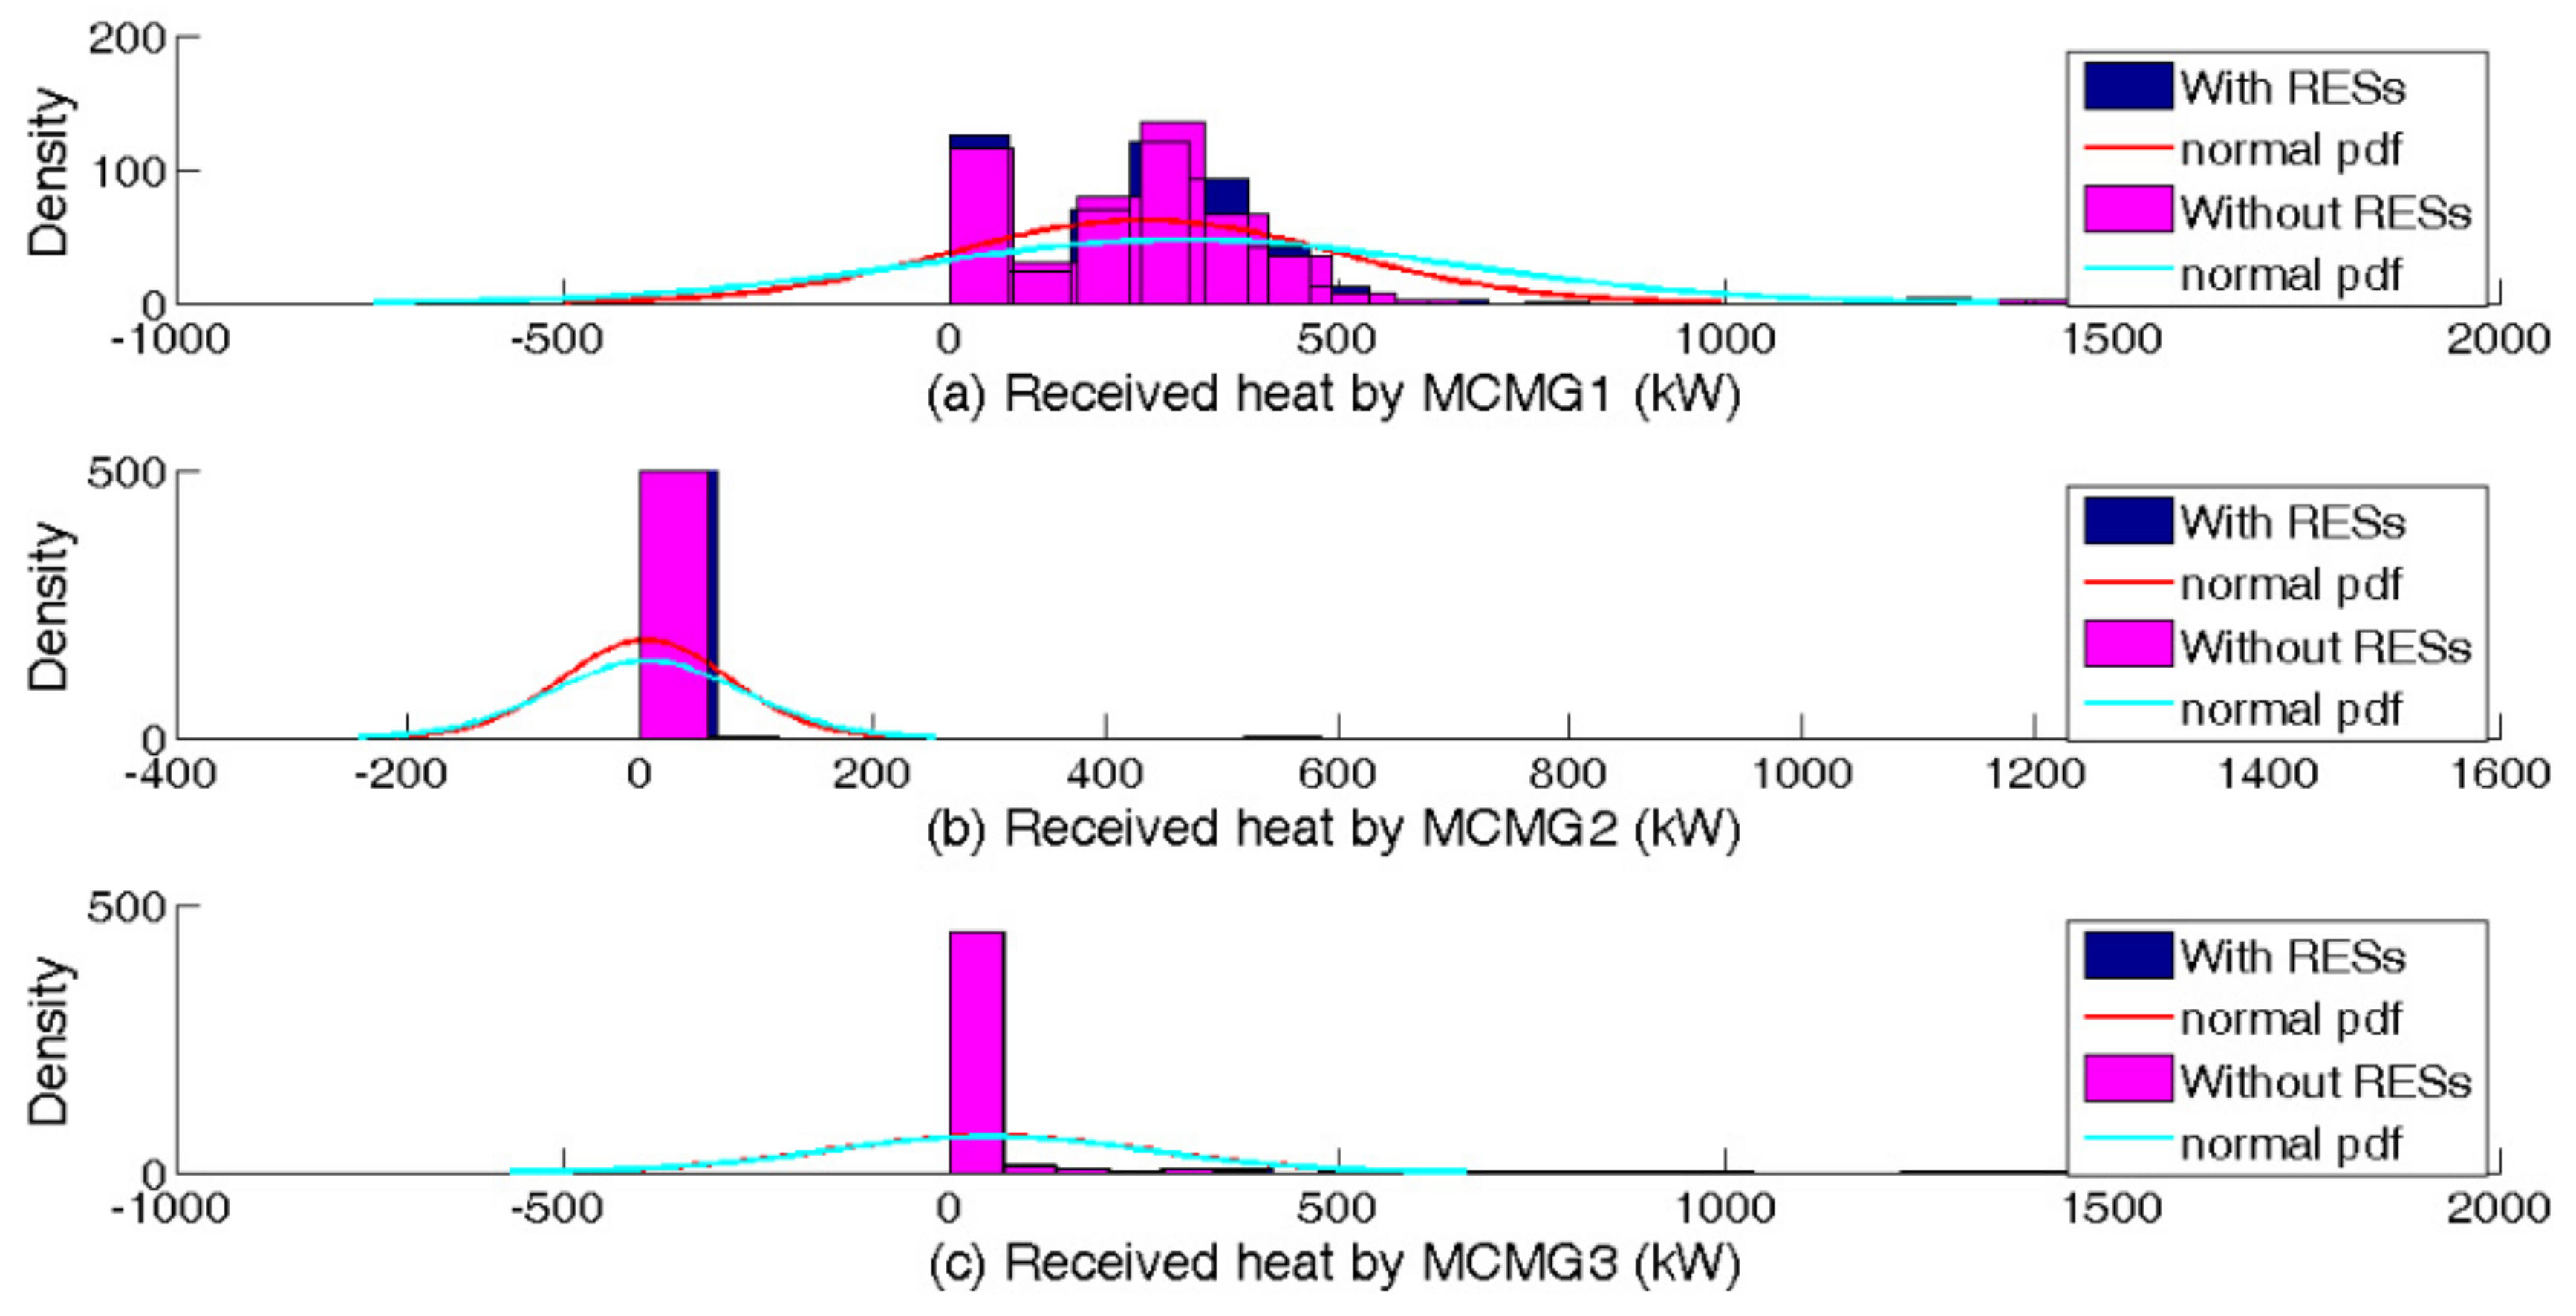
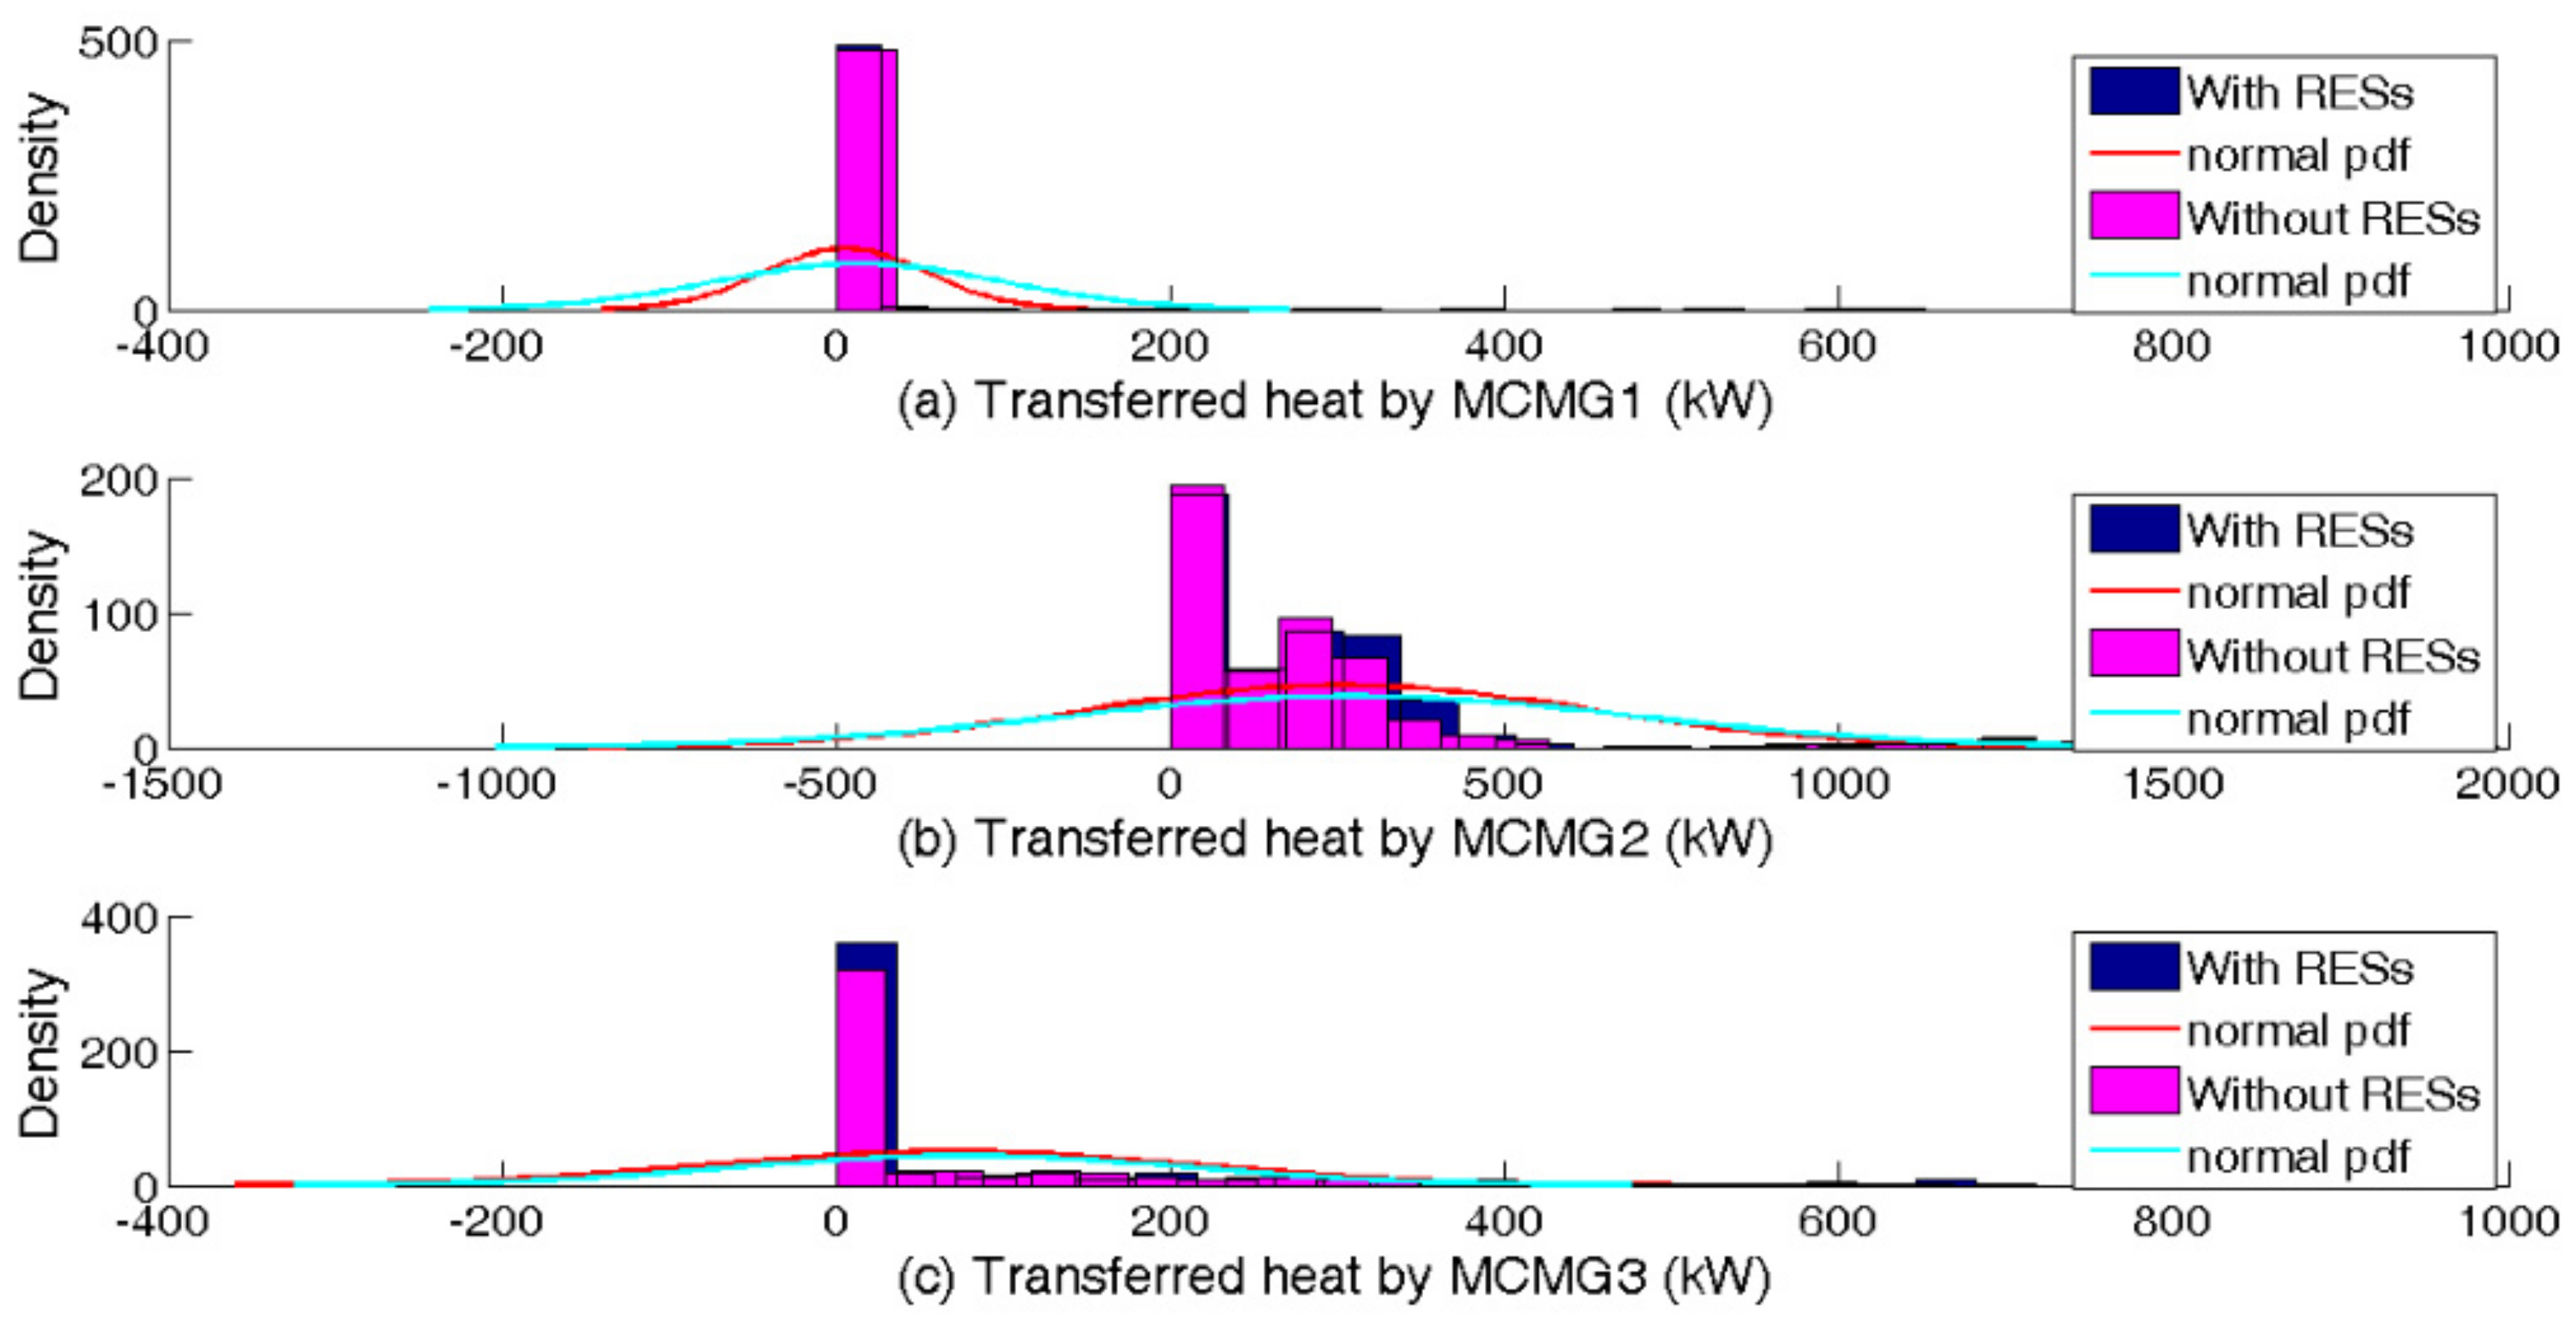
Figure 6 and
Figure 7 present the procurement strategies of thermal energy in terms of imported and exported energy at hour 22 of the day. The graphs are plotted with and without RES penetration. As shown, the thermal demand of MCMG 1 is partially supplied by the adjacent MCMG 2, denoting the key role of thermal energy connectivity between MCMGs in supplying the heat demand of adjacent demanding MCMGs. The average daily thermal energy exchange between MCMGs with and without RESs penetration is 5818.77 and 6439.7, respectively. The results advocate that the overall performance of the system increases with the availability of RESs.
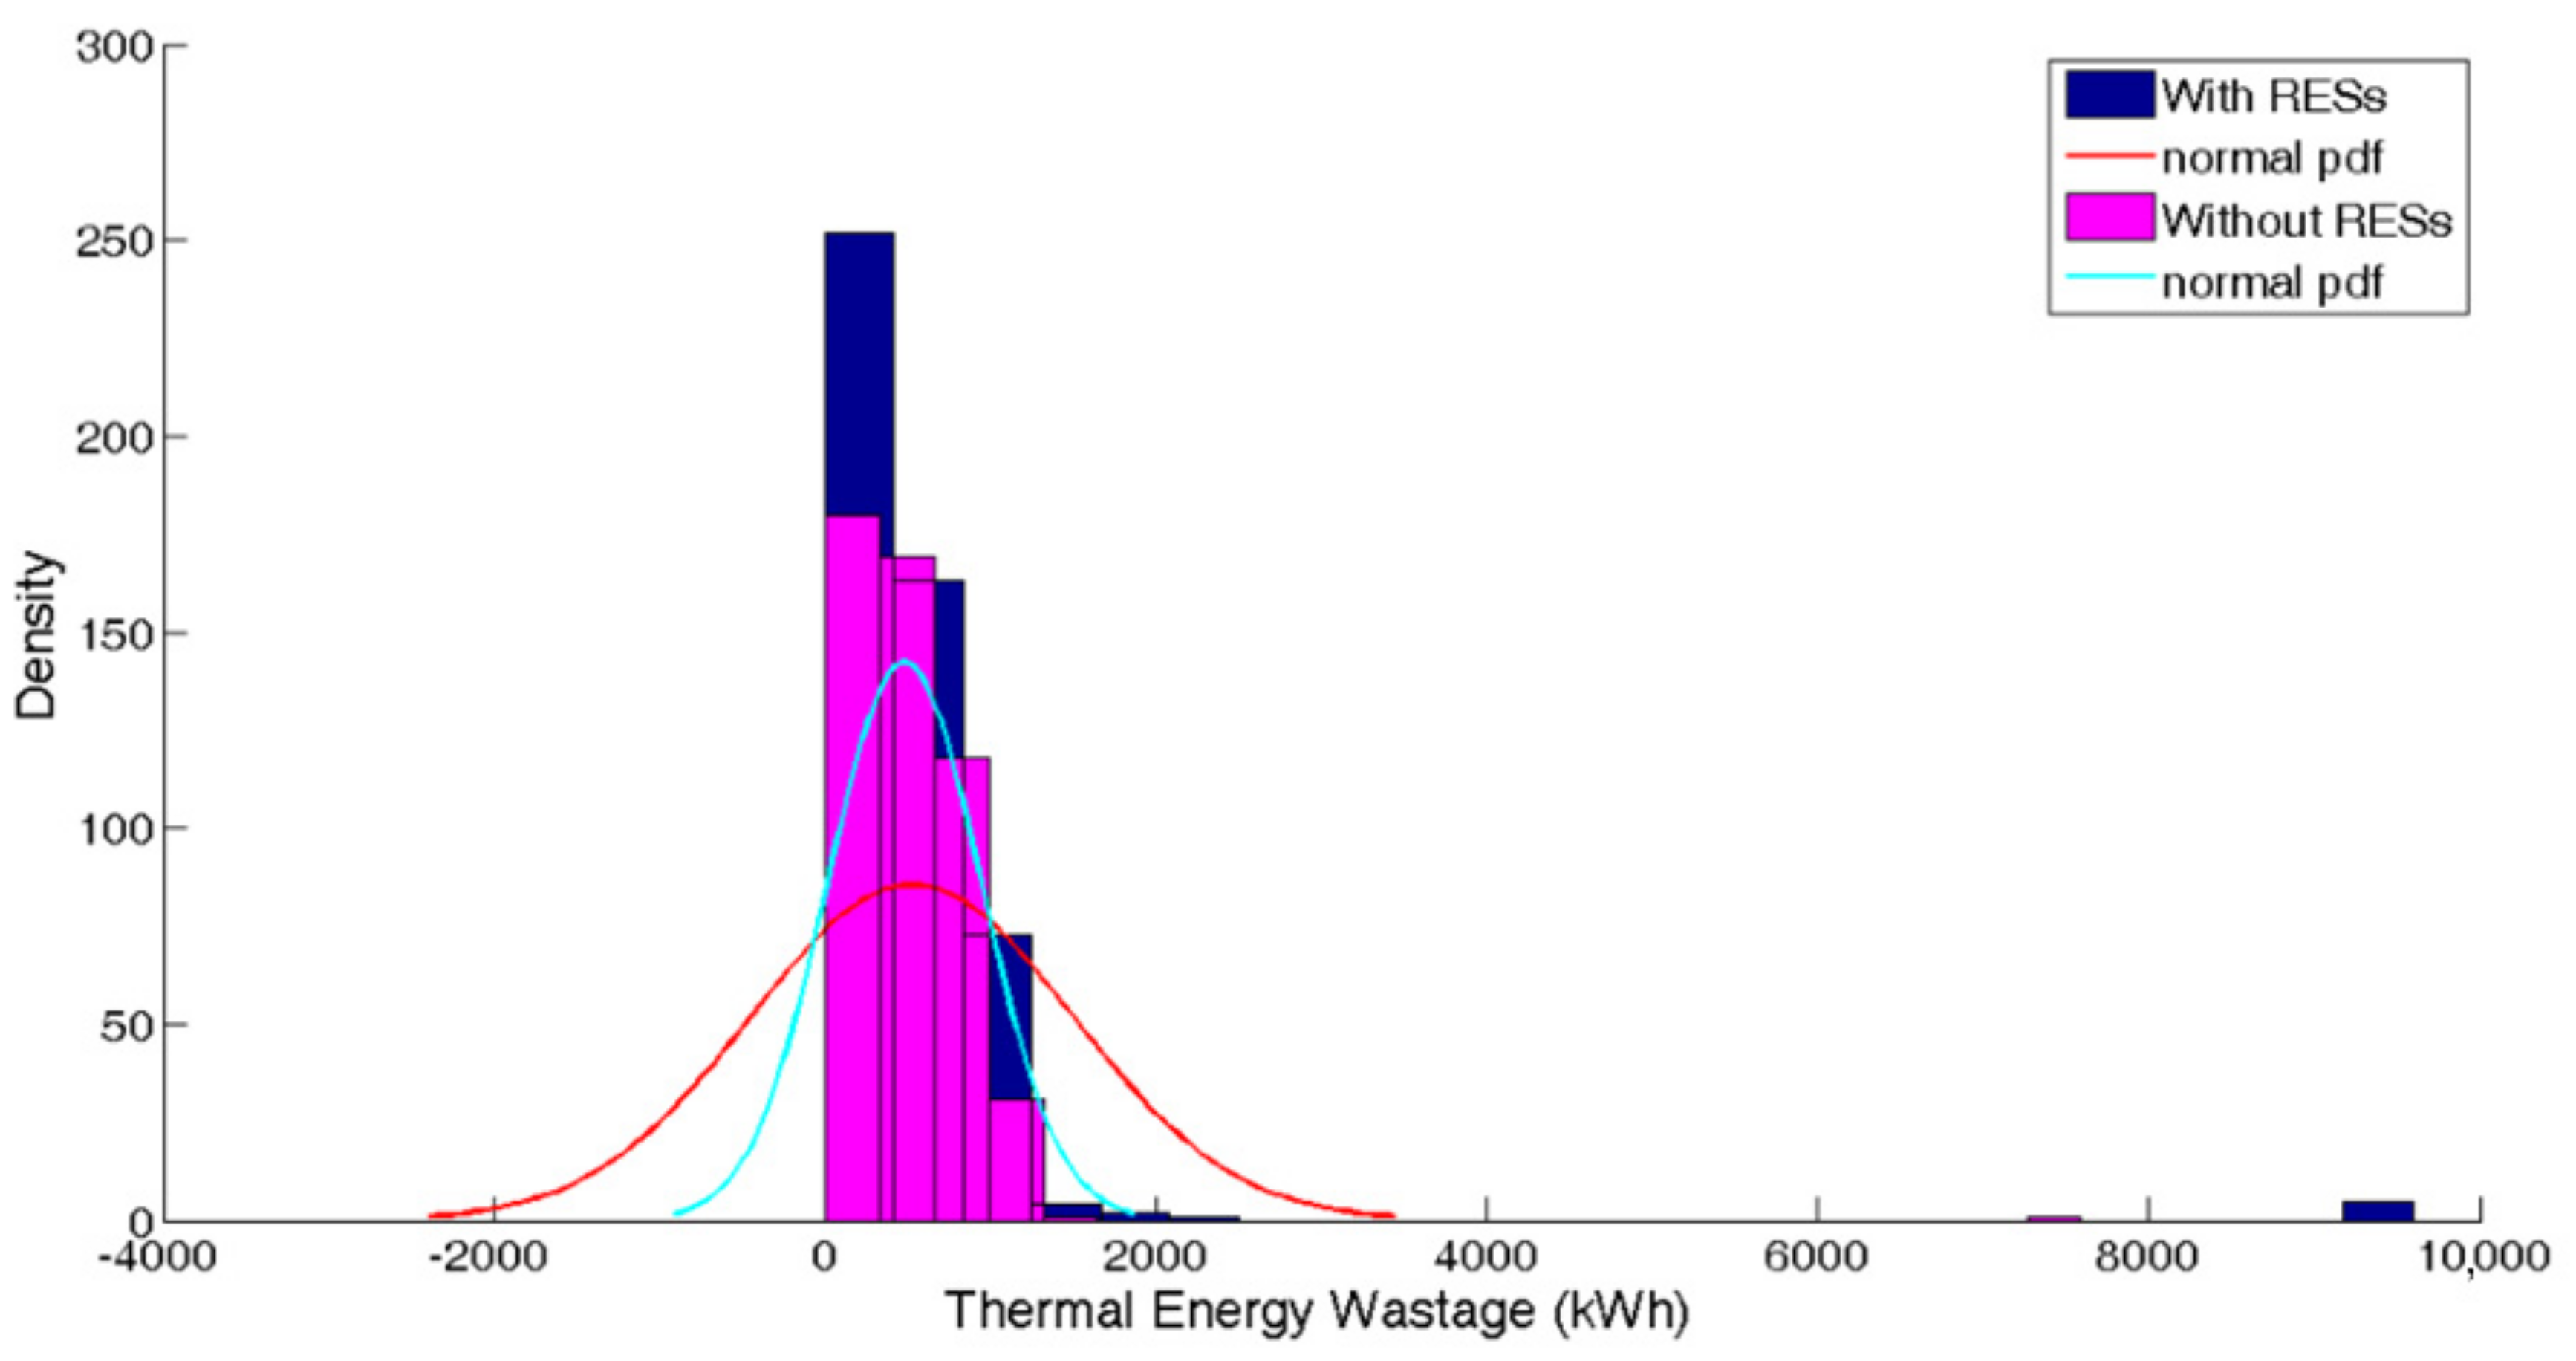
The daily thermal energy wastage in the proposed thermally energy-connected MCMG system is illustrated in
Figure 8. The result advocates that the daily thermal energy wastage of the NMCMG penetrated with RESs increases by a mean and standard deviation value of 9% and 210% compared with a system without RESs penetration.
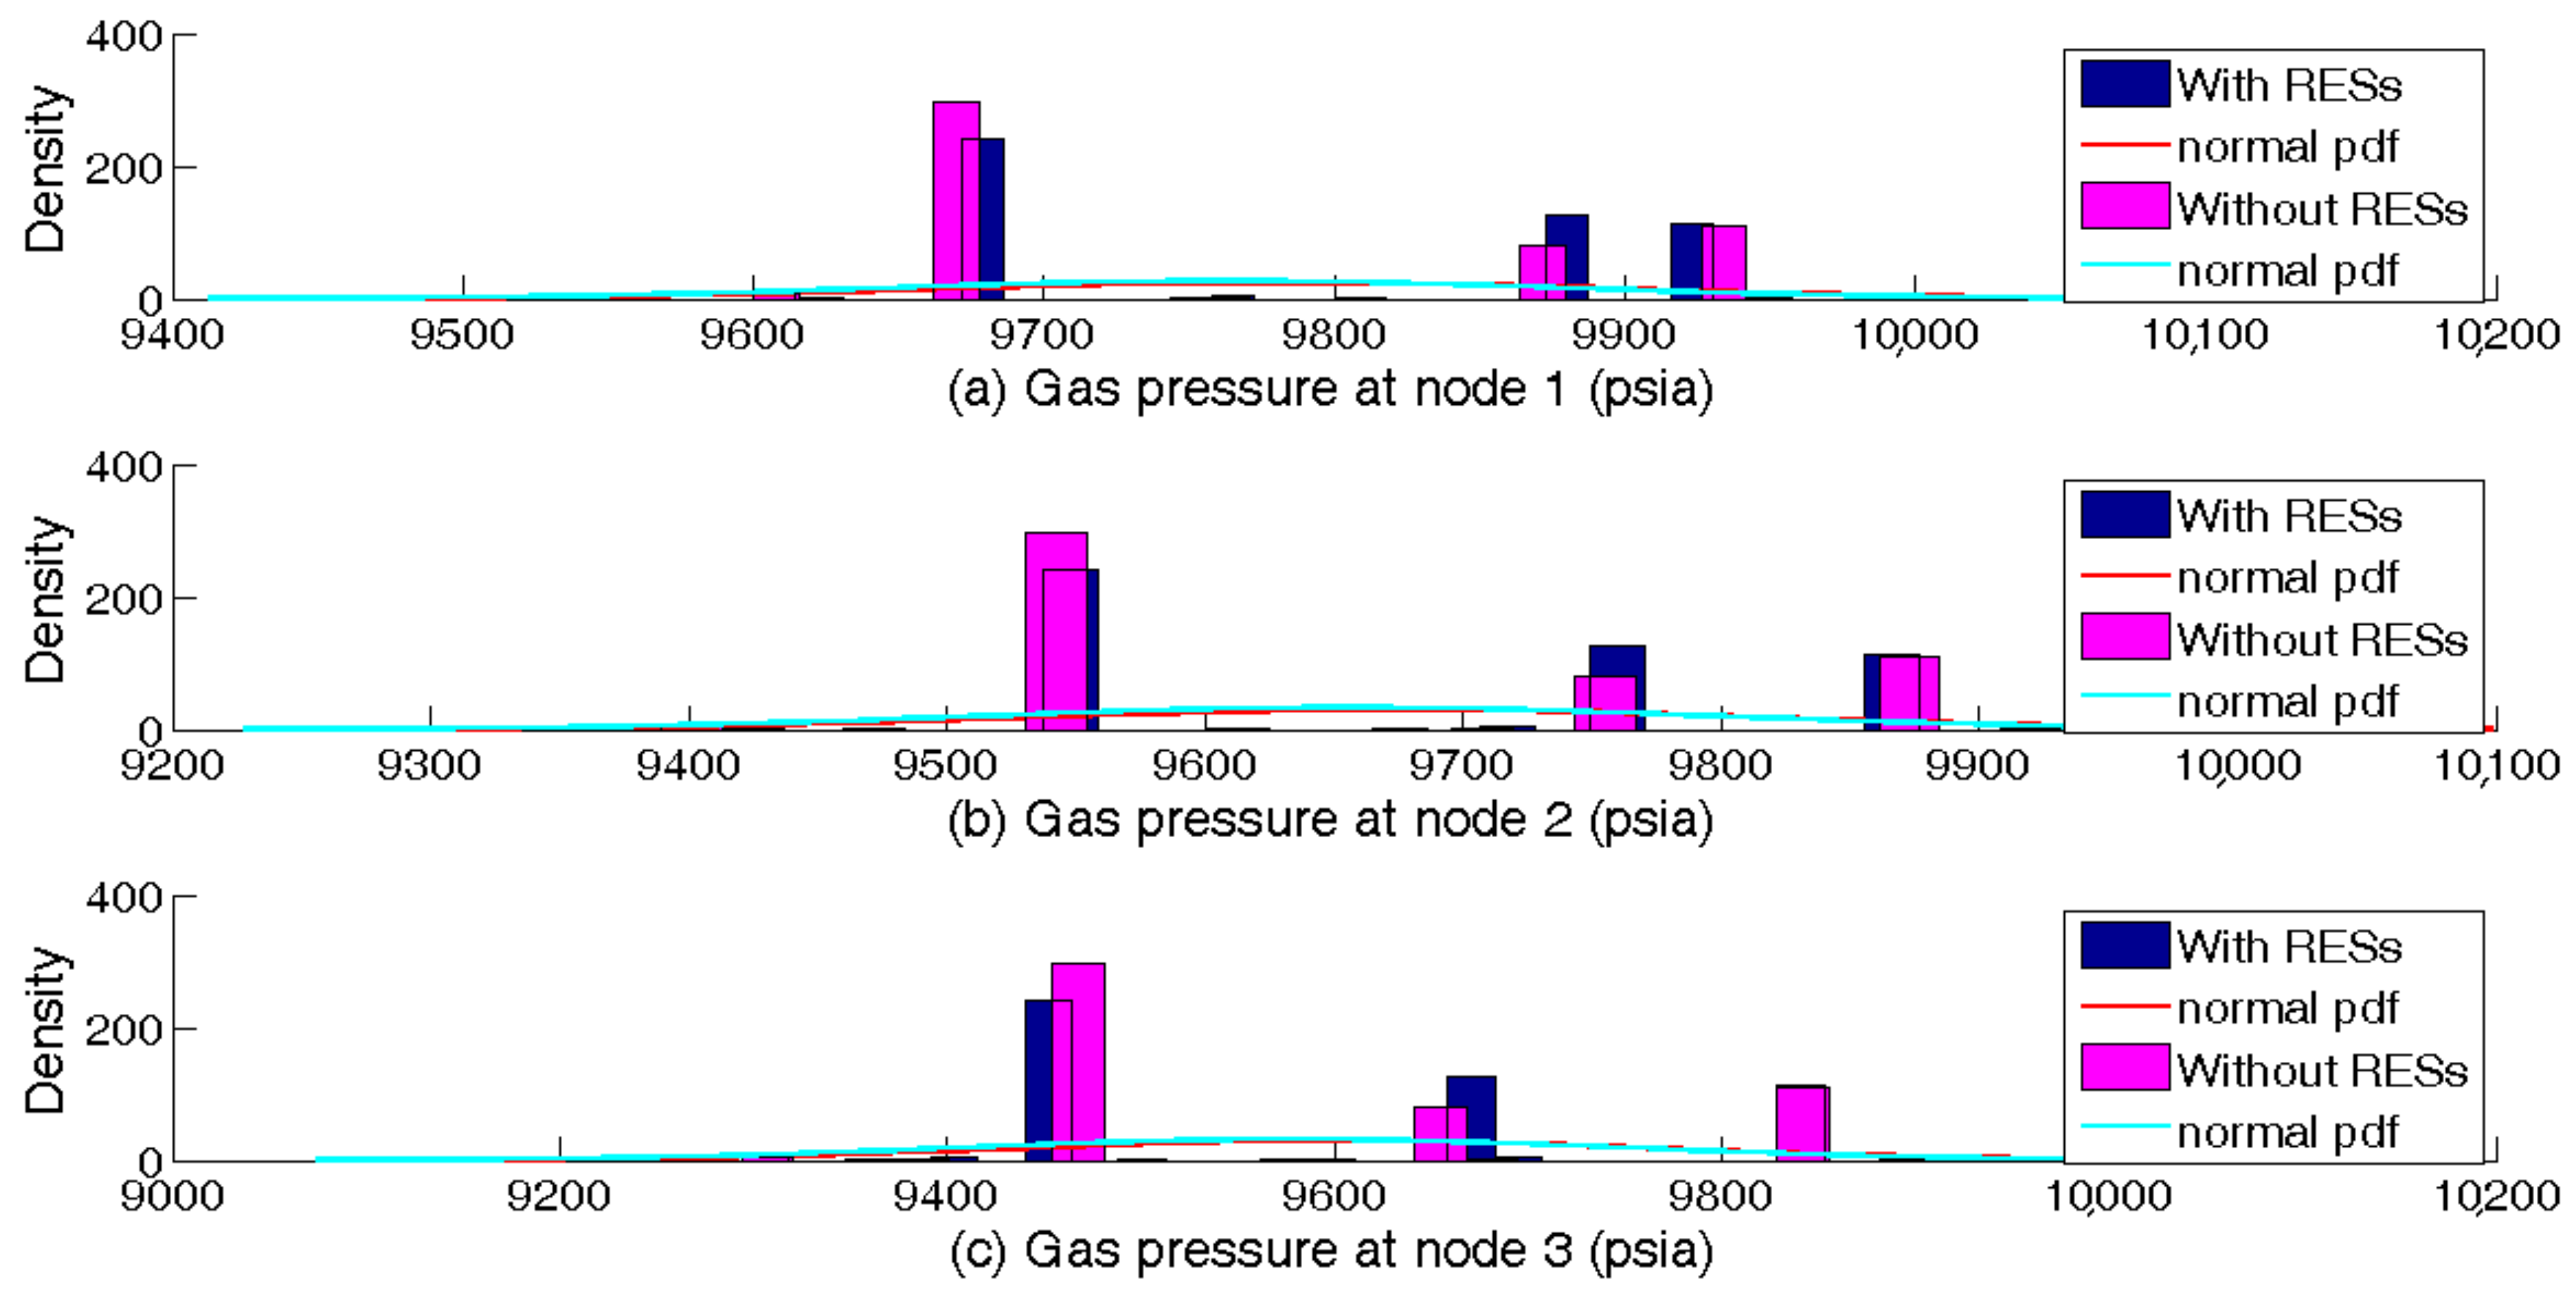
Figure 9 presents the gas pressure profile in three nodes of the gas network at hour 22 of the day. It can be seen that RESs penetration has an indirect impact on the gas nodes due to CHP units as though, by increasing the RESs penetration, the pressure on CHP units decreases. Due to the radial structure of power and gas distribution networks, the gas pressure decreases in the subsequent nodes.
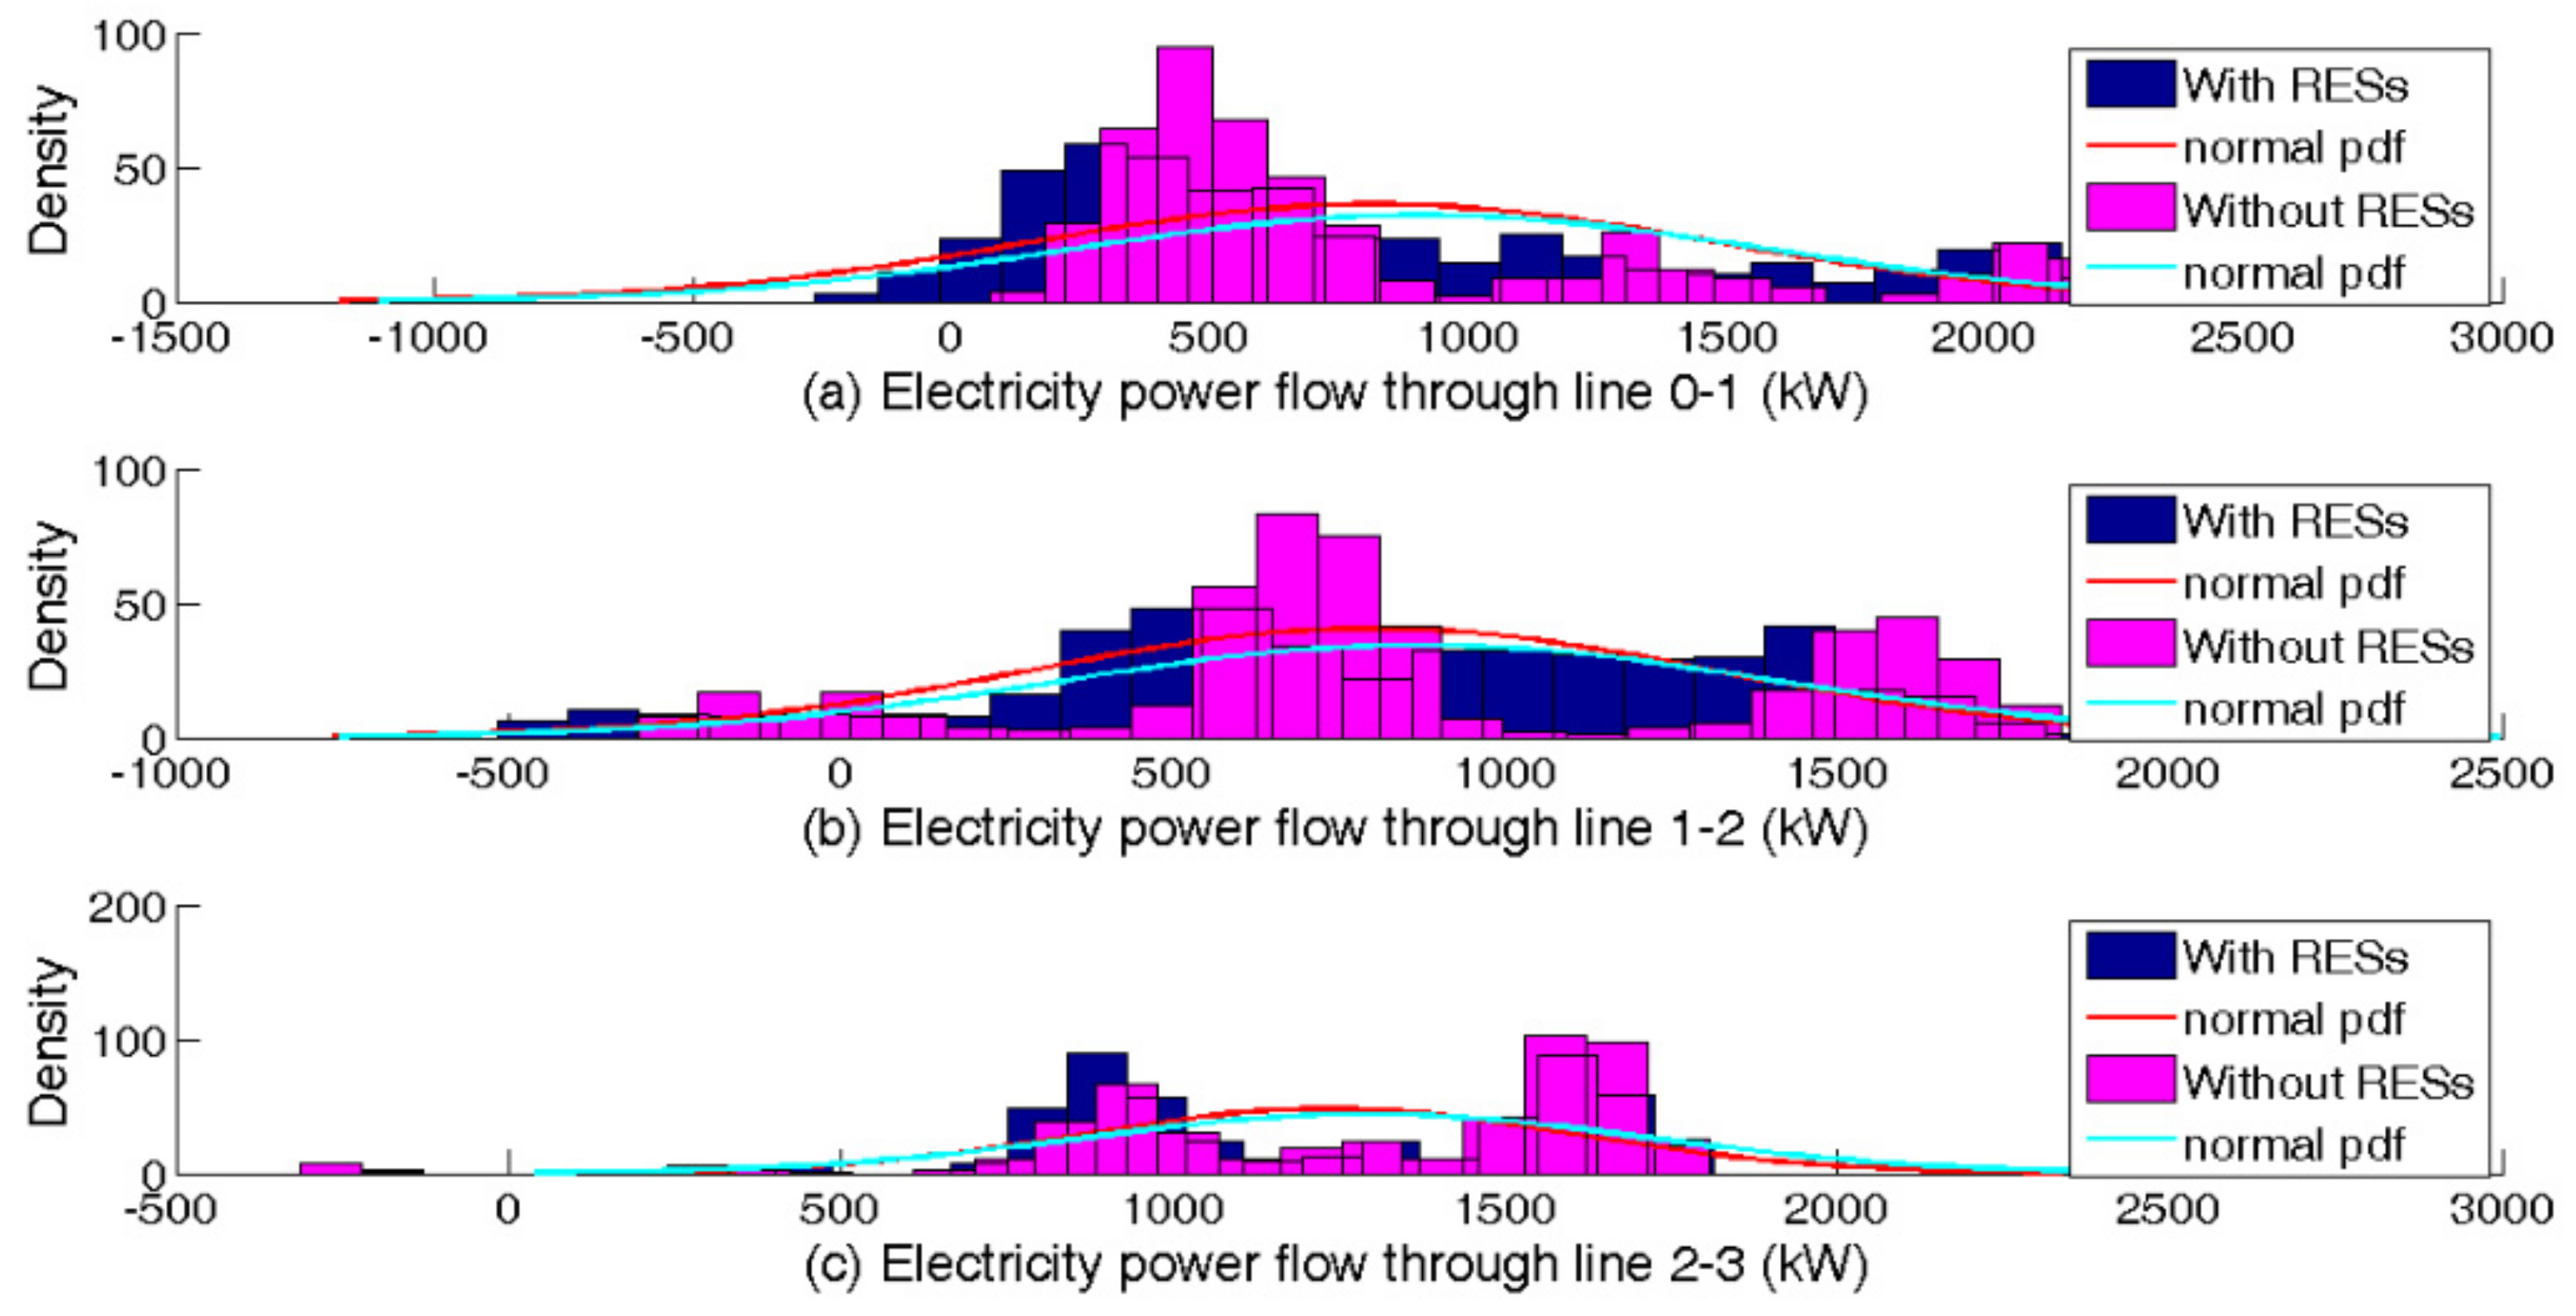
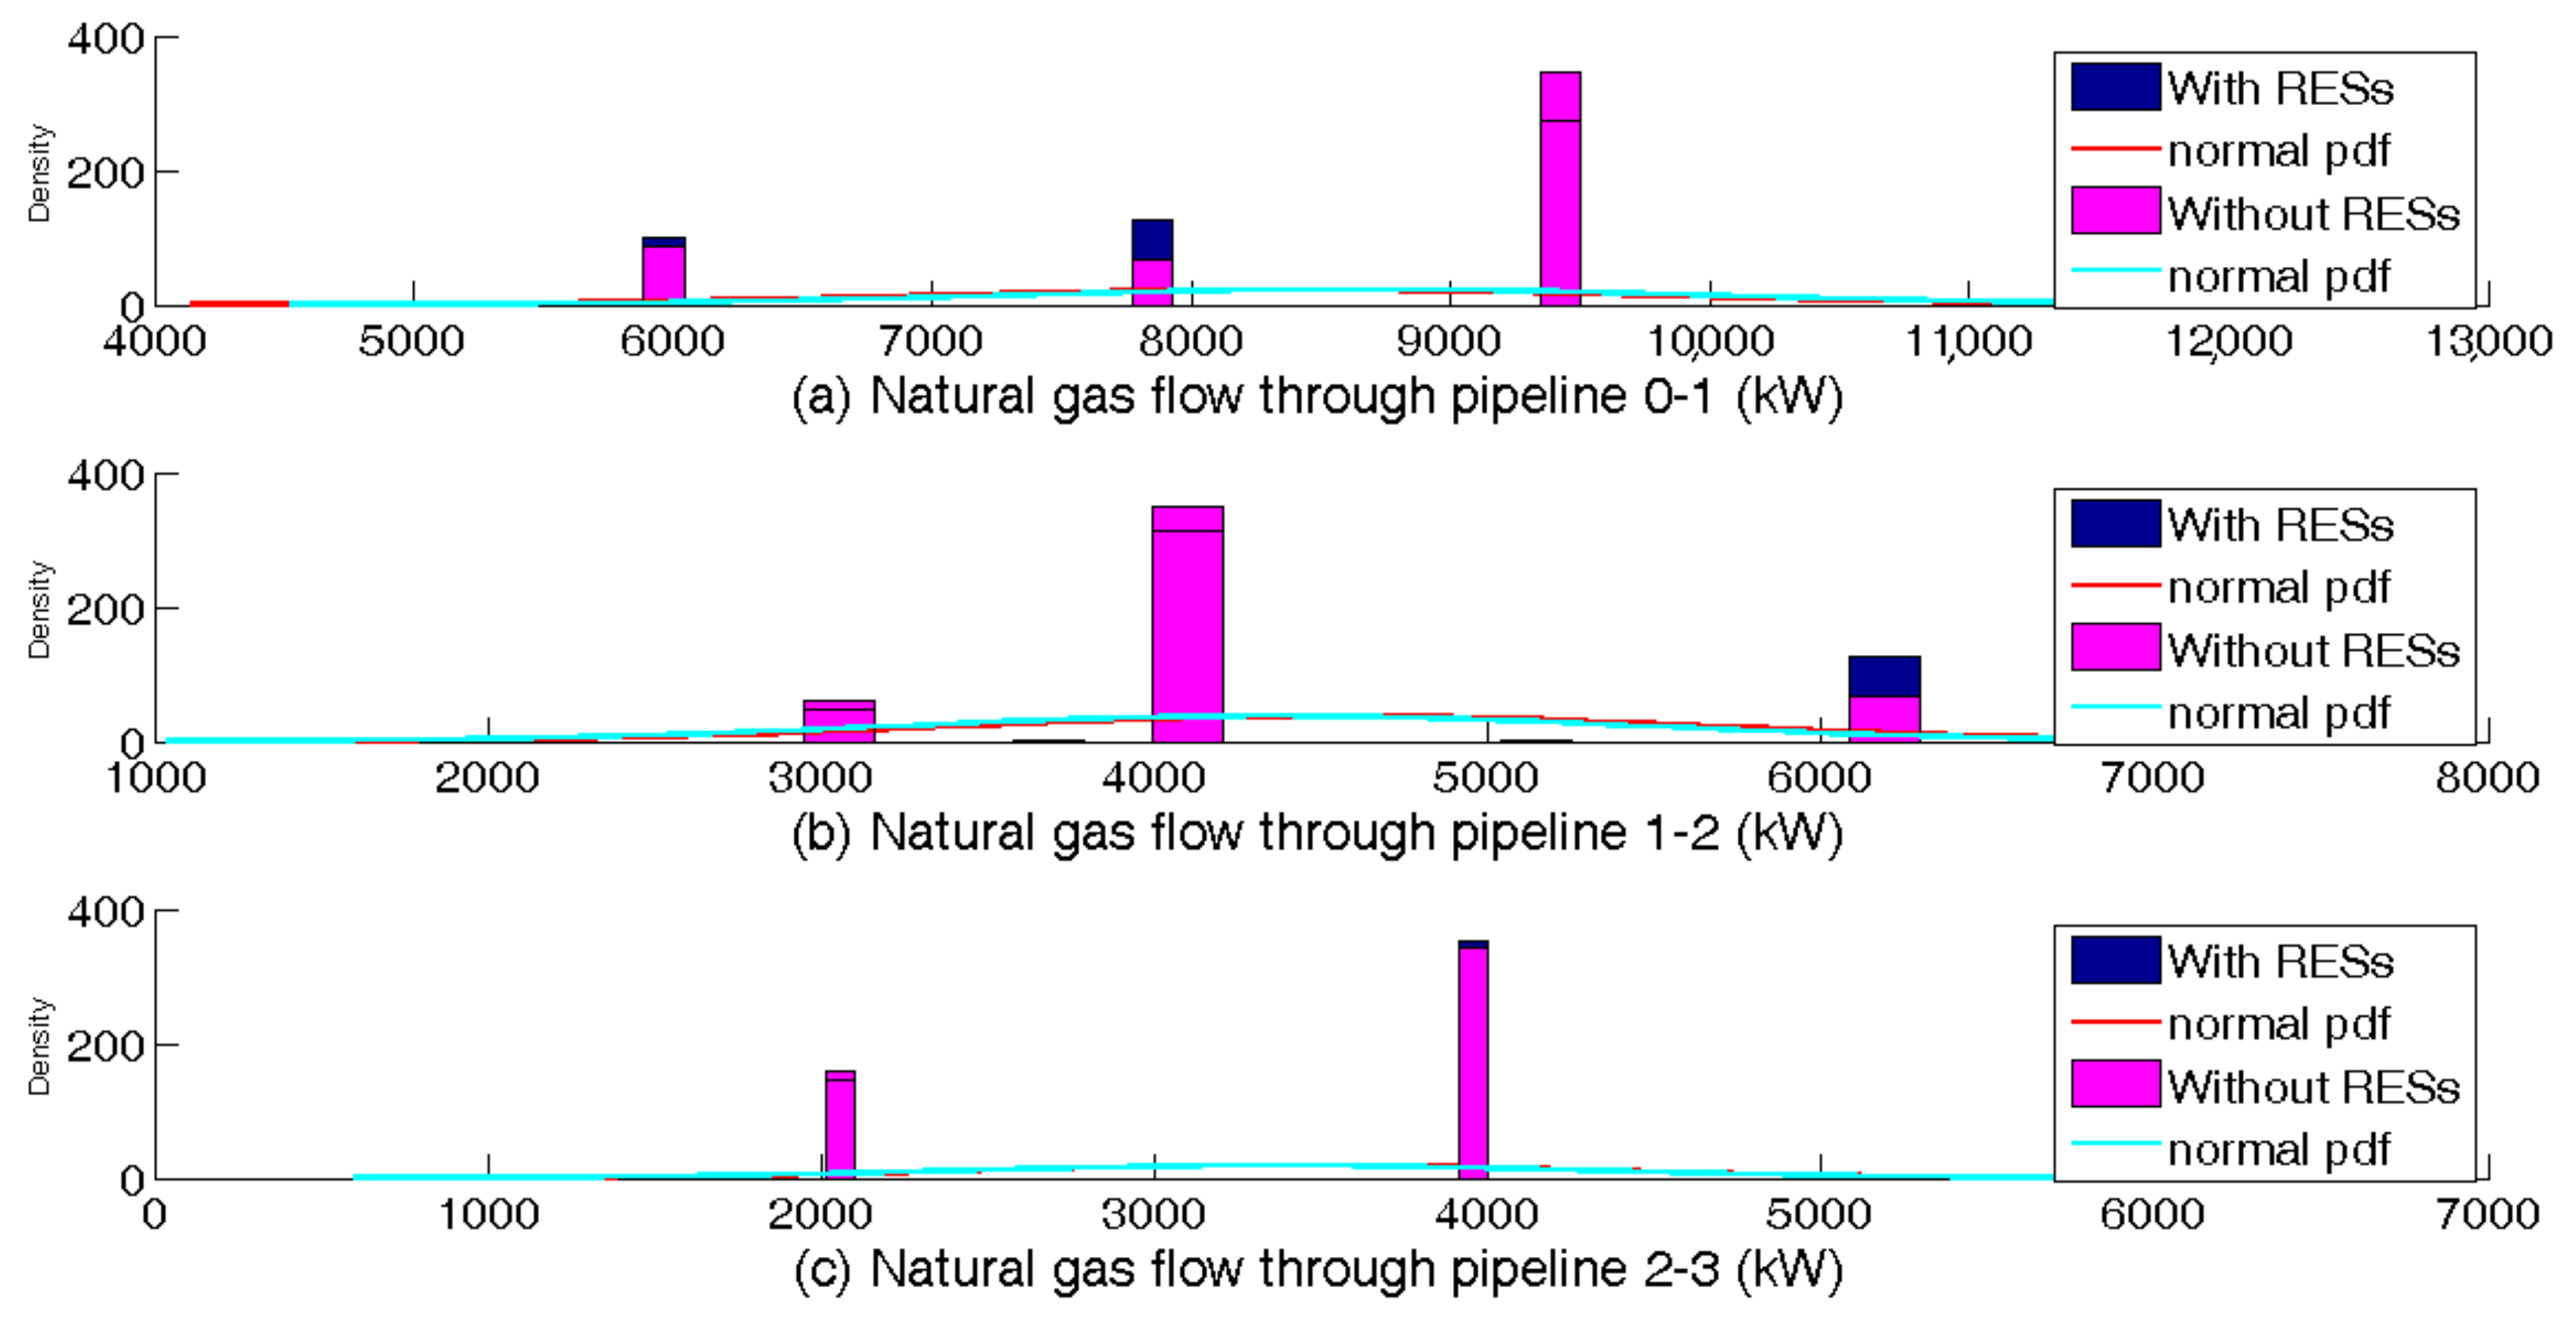
Figure 10 presents the probability distribution of power flow in three distribution lines with and without RESs at hour 22 of the day in Case Study 2. In the same way,
Figure 11 depicts the gas flow in three lines of the gas network at hour 22 of the day. The results advocate that the impact of RES penetration on the gas network is considerably lower than electric networks in Case Study 2. The reason is that the RES directly affects the power balance at electrical nodes. Based on the graph, some parts of domestic demands are supplied by local generation units with RES availability. As a result, the possibility of congestion in transmission/distribution lines decreases.
In Case Study 2, the penetration of responsive consumers is considered 30%. This means that only 30% of consumers participate in DRPs. In this way, the contracted consumers must reduce 15% of energy consumption during critical hours.
Figure 12 and
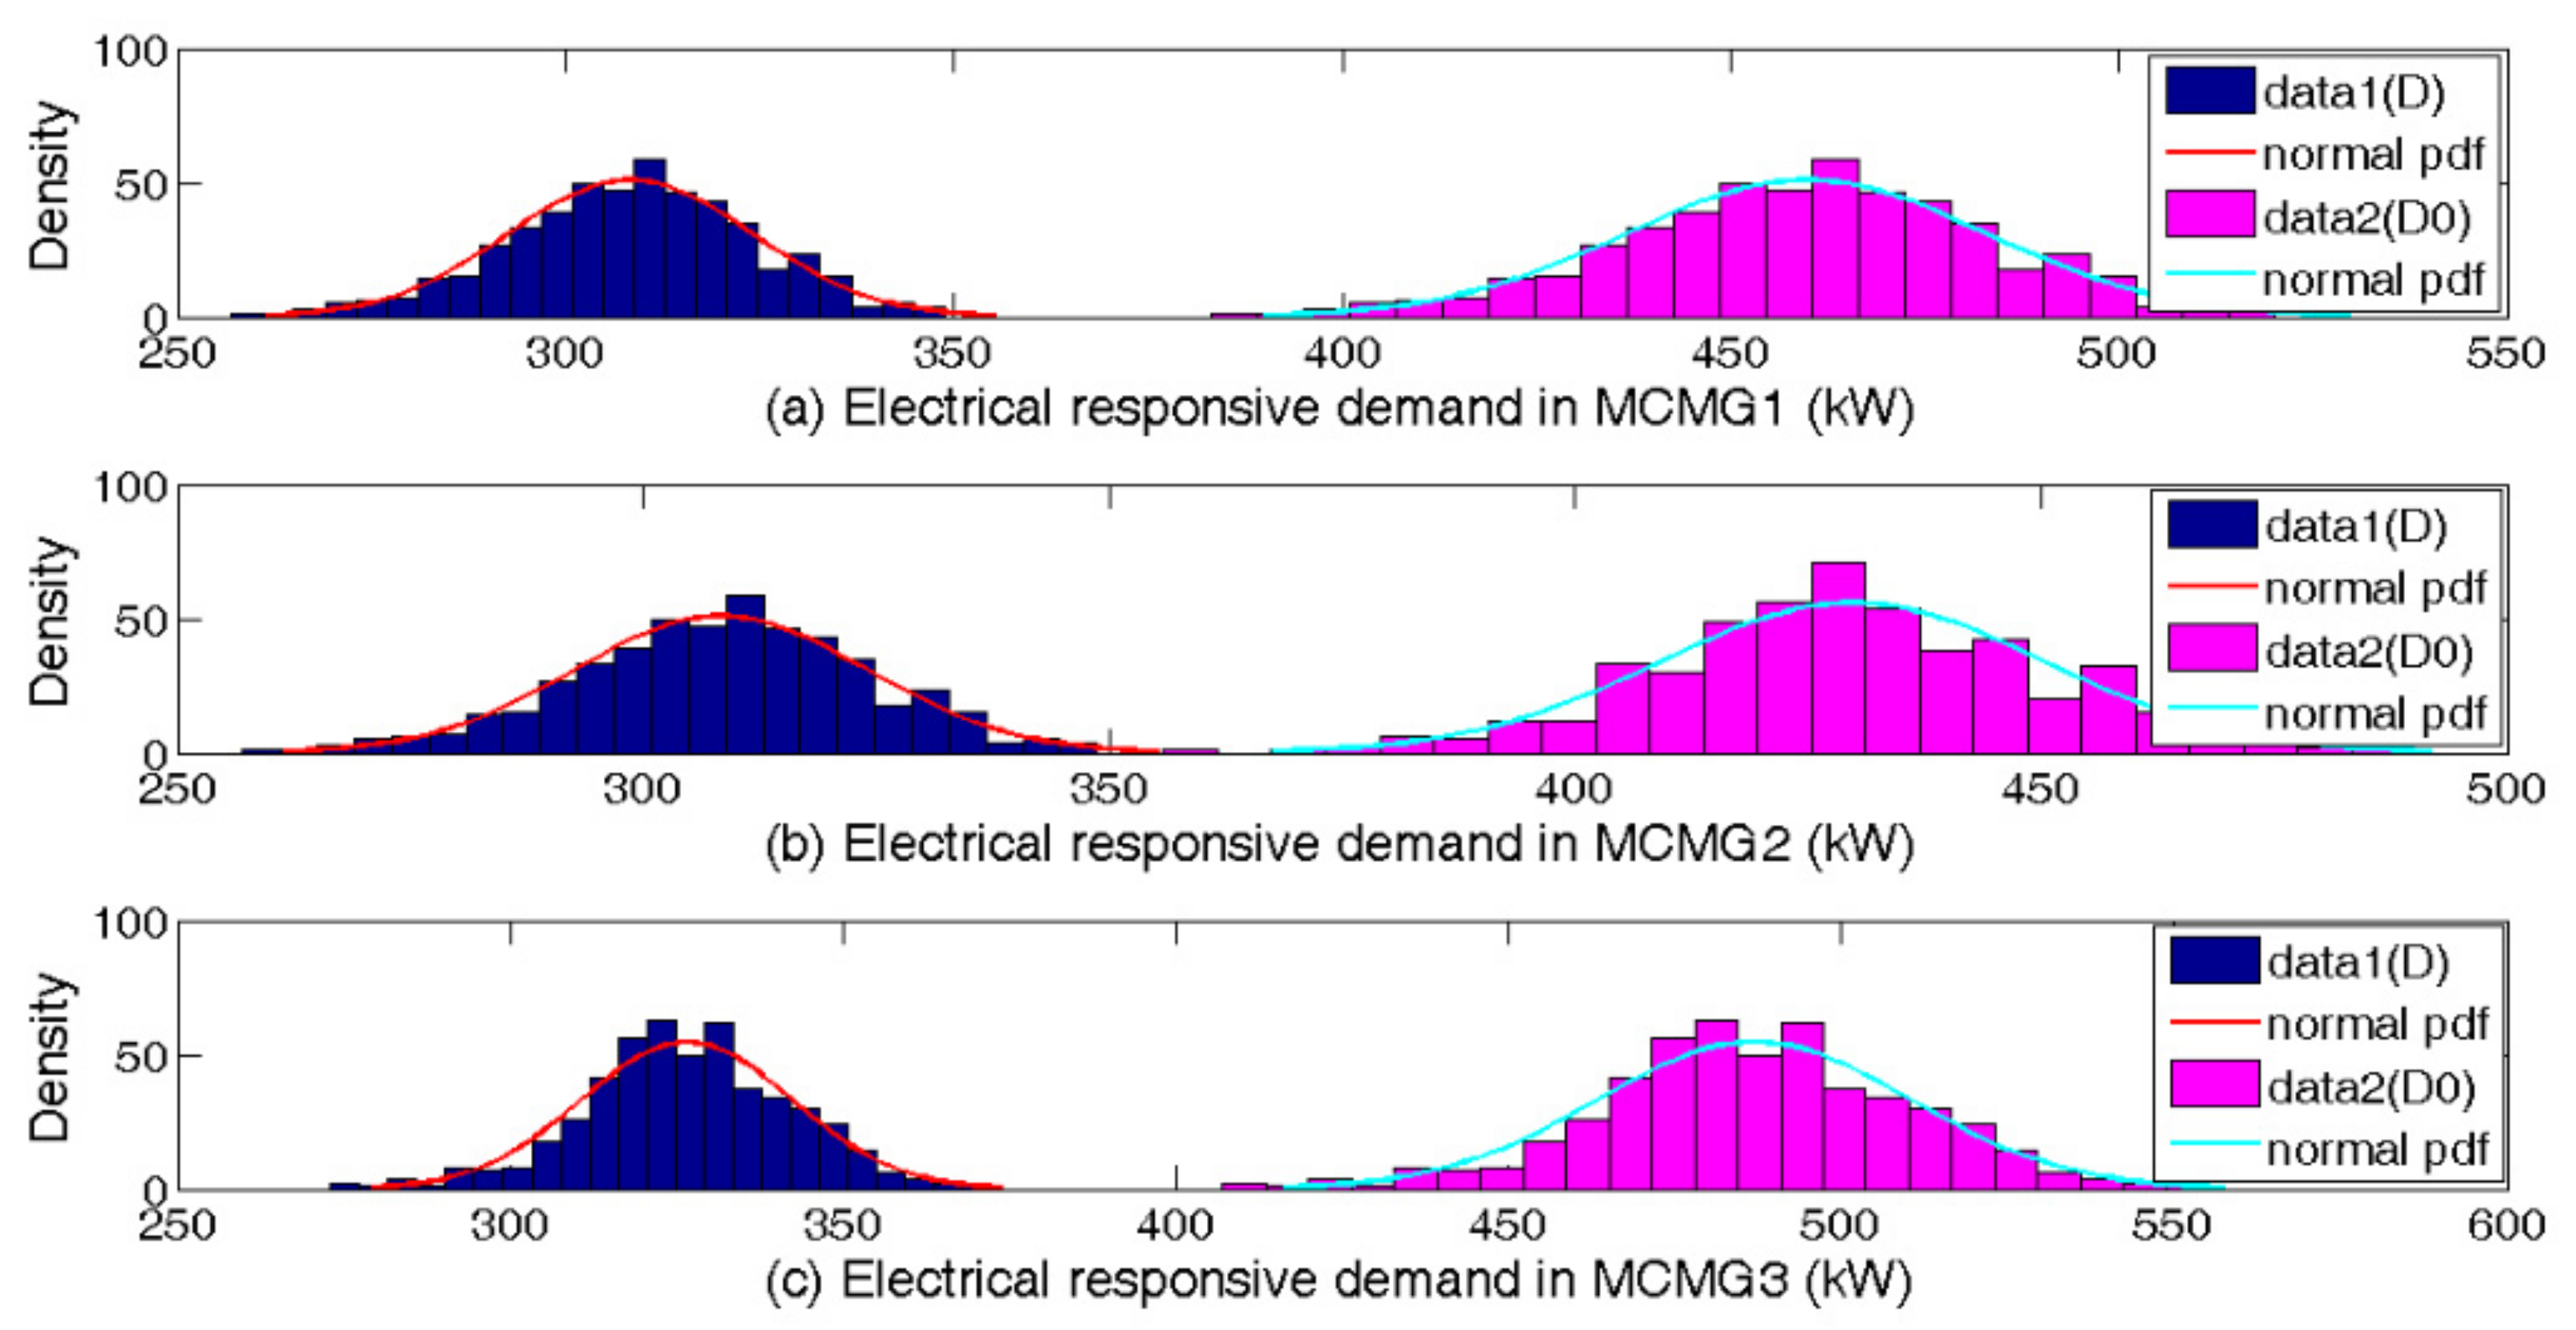
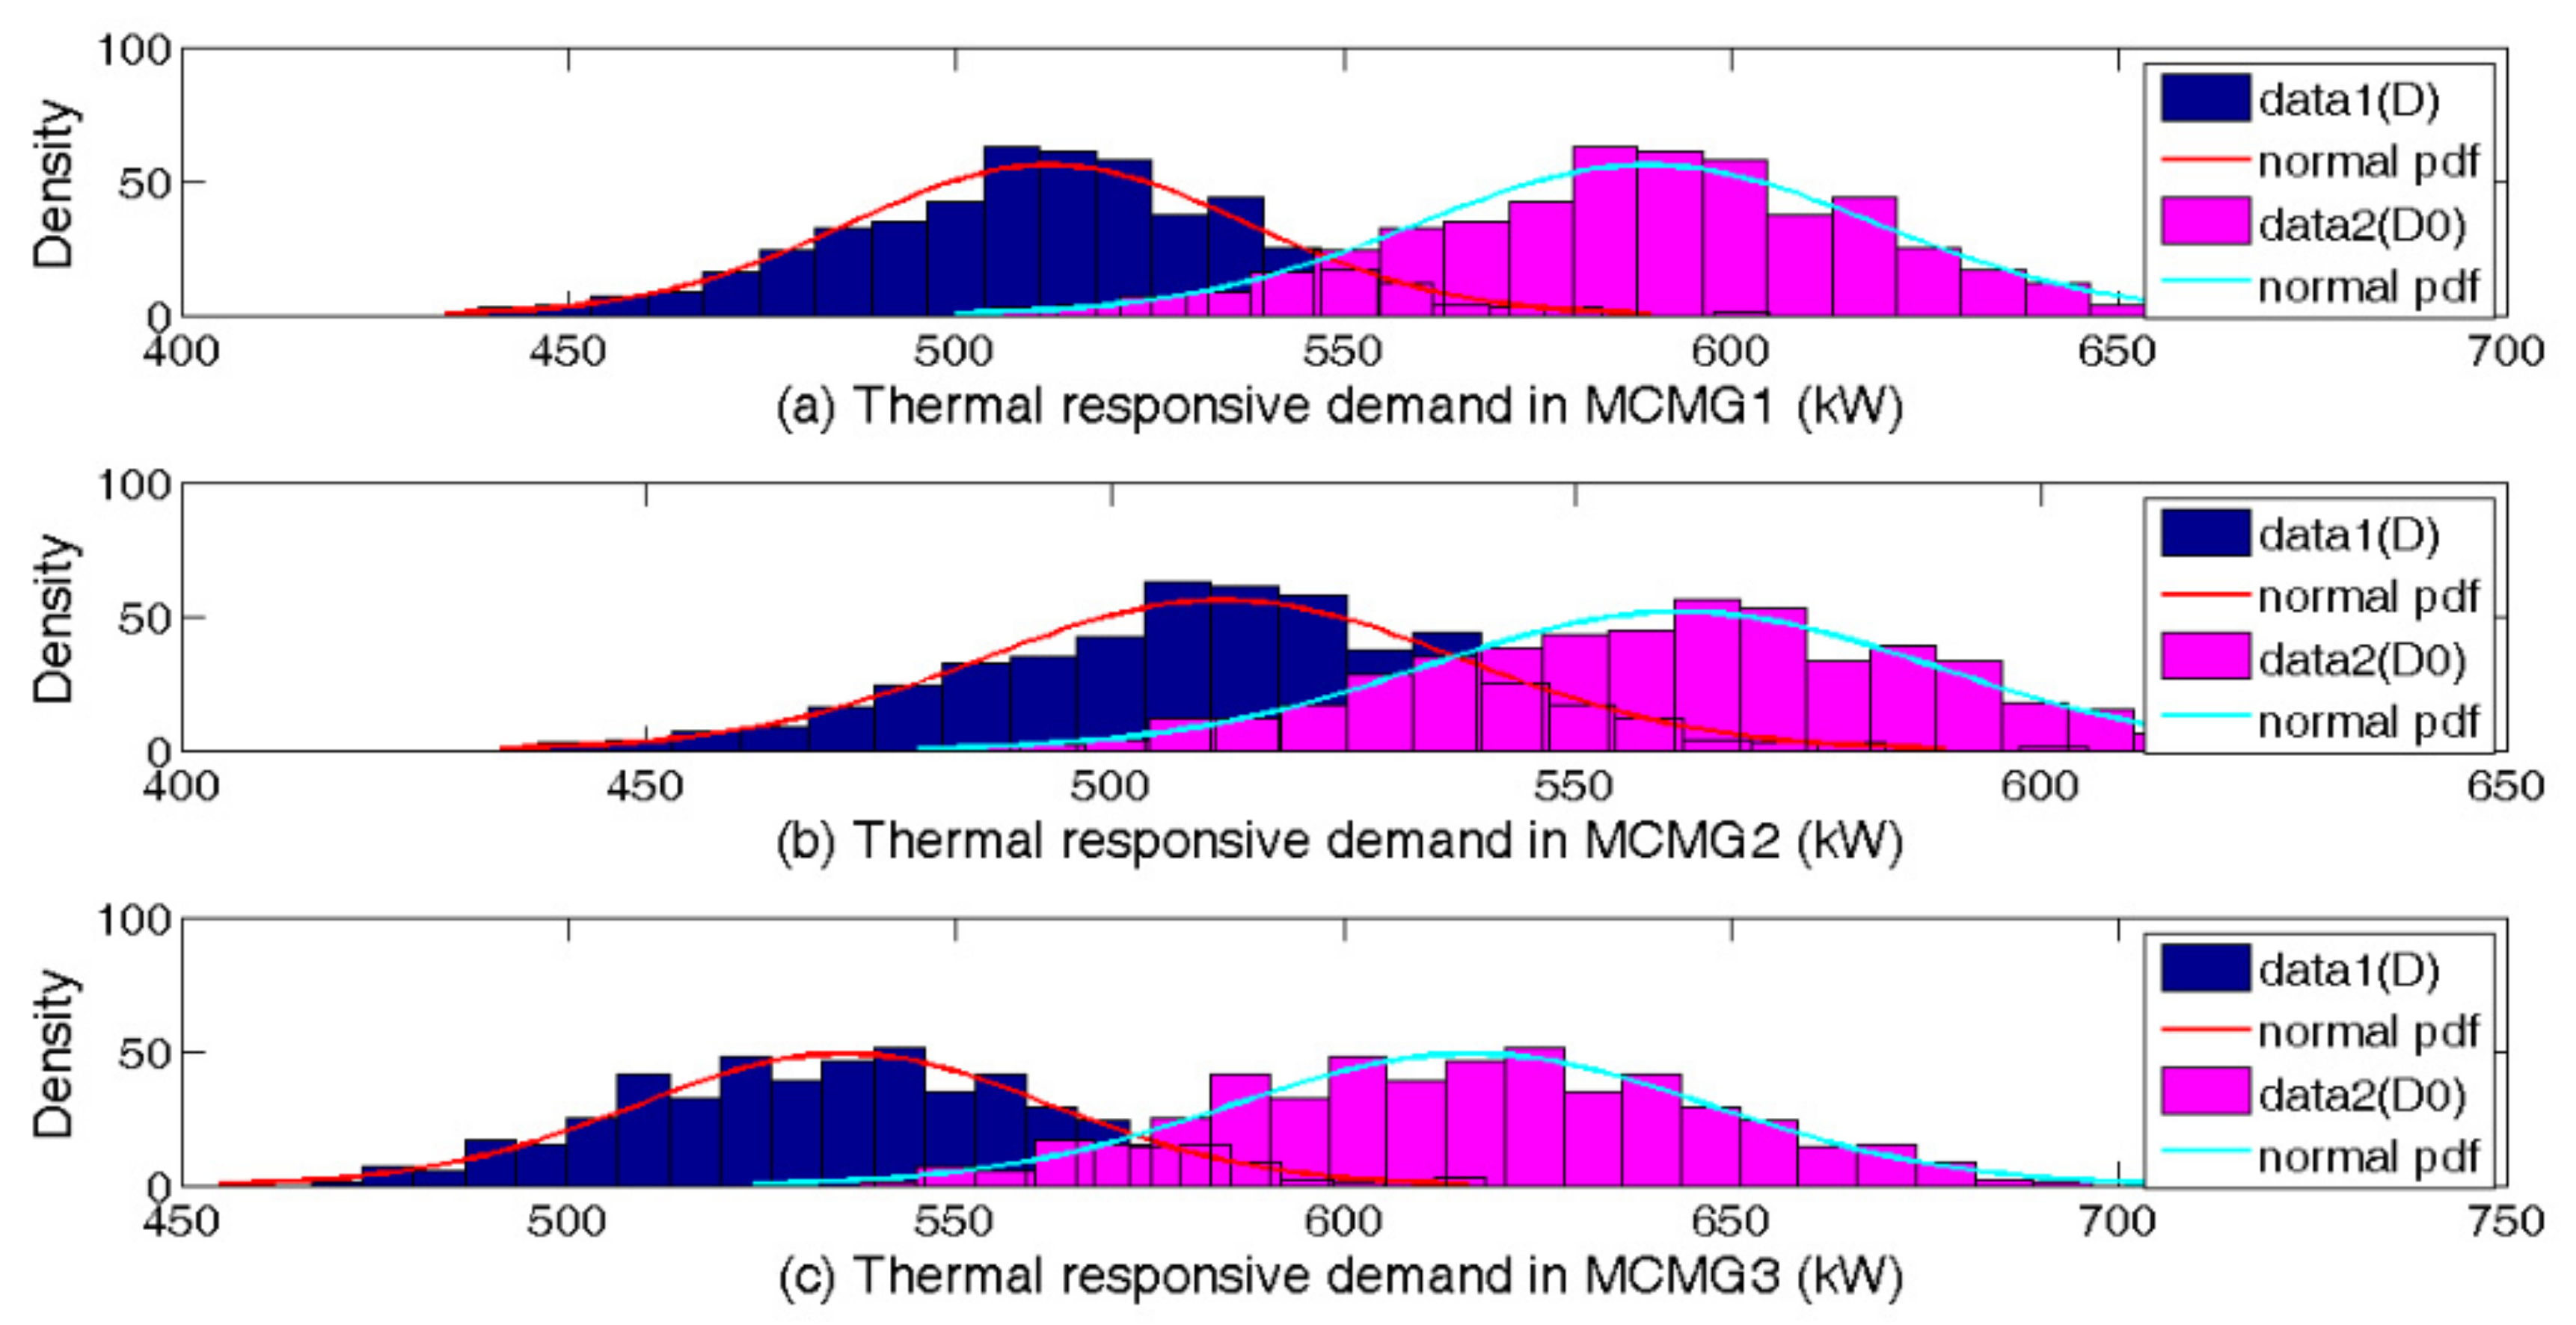
Figure 13 show the participation of flexible consumers in the DRPs for the electrical and thermal networks at hour 22 of the day, respectively. The results advocate that responsive customers have a tendency to shift their demands from peaks to off-peaks. Furthermore, the penetration of RES changes the distribution of demand flexibility in MCMGs. Therefore, more demand flexibility is available in some time intervals. The availability of demand flexibility has a strong correlation with renewable power availability, which is an intermittent variable.
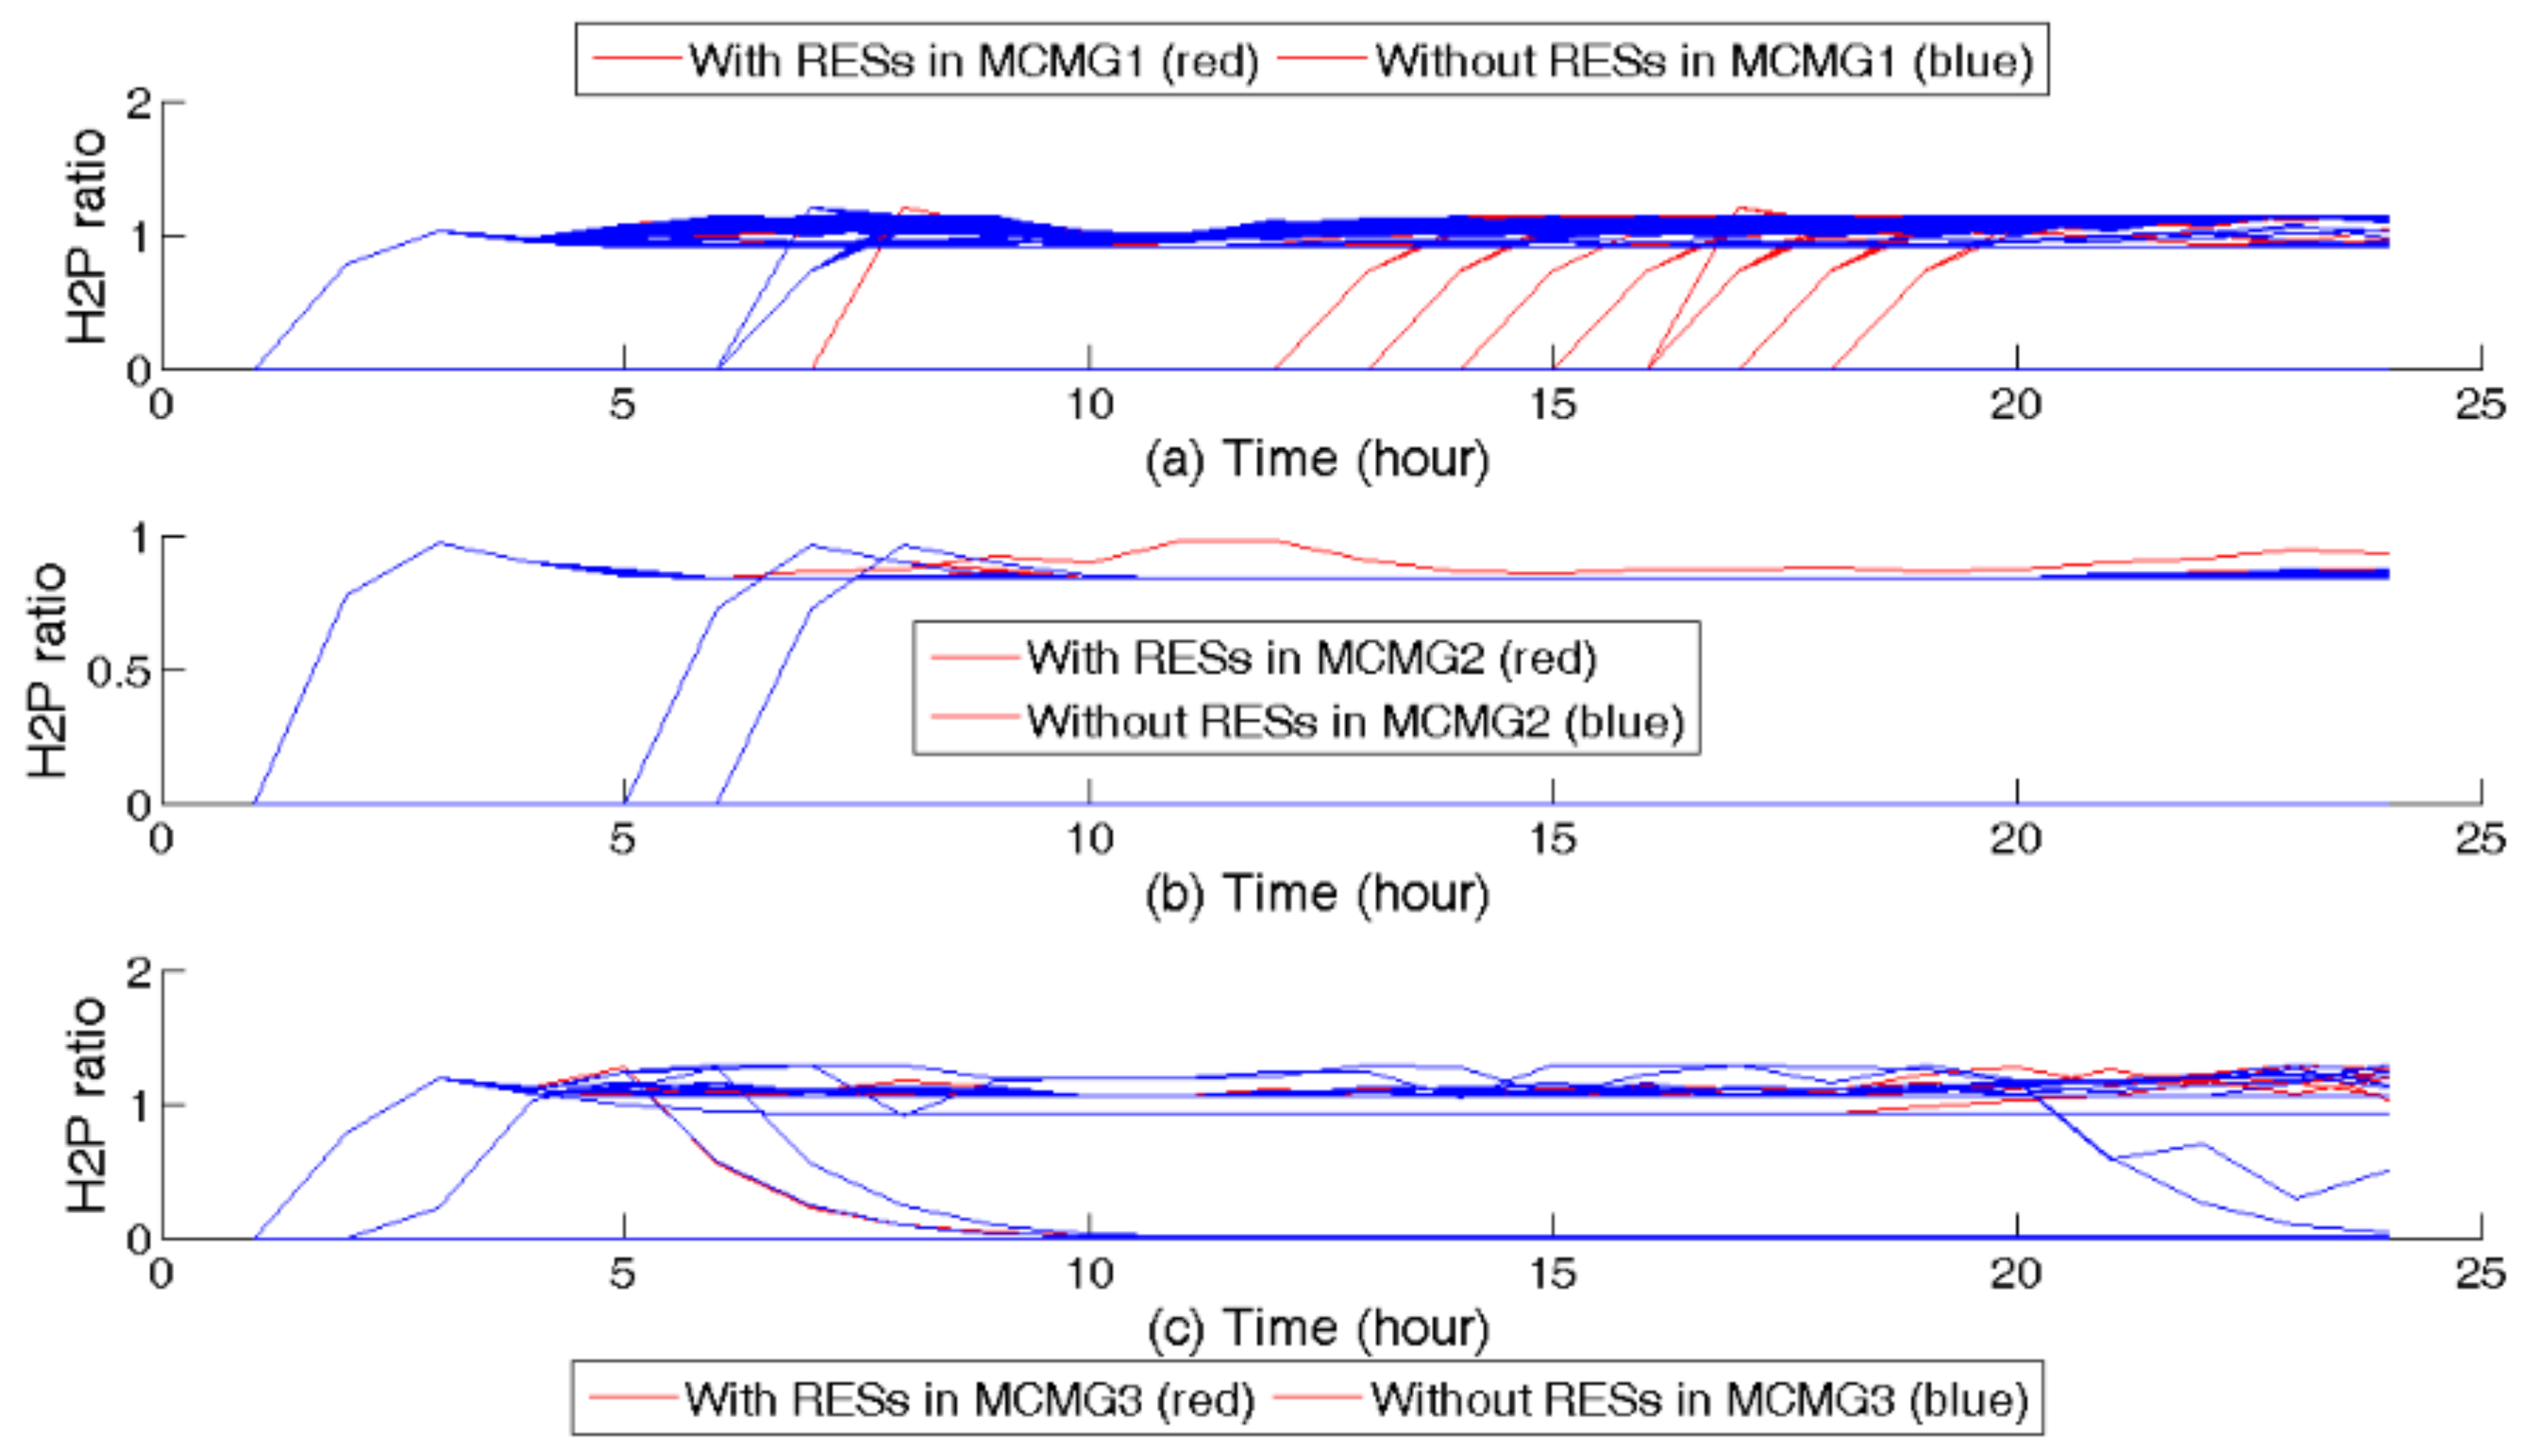
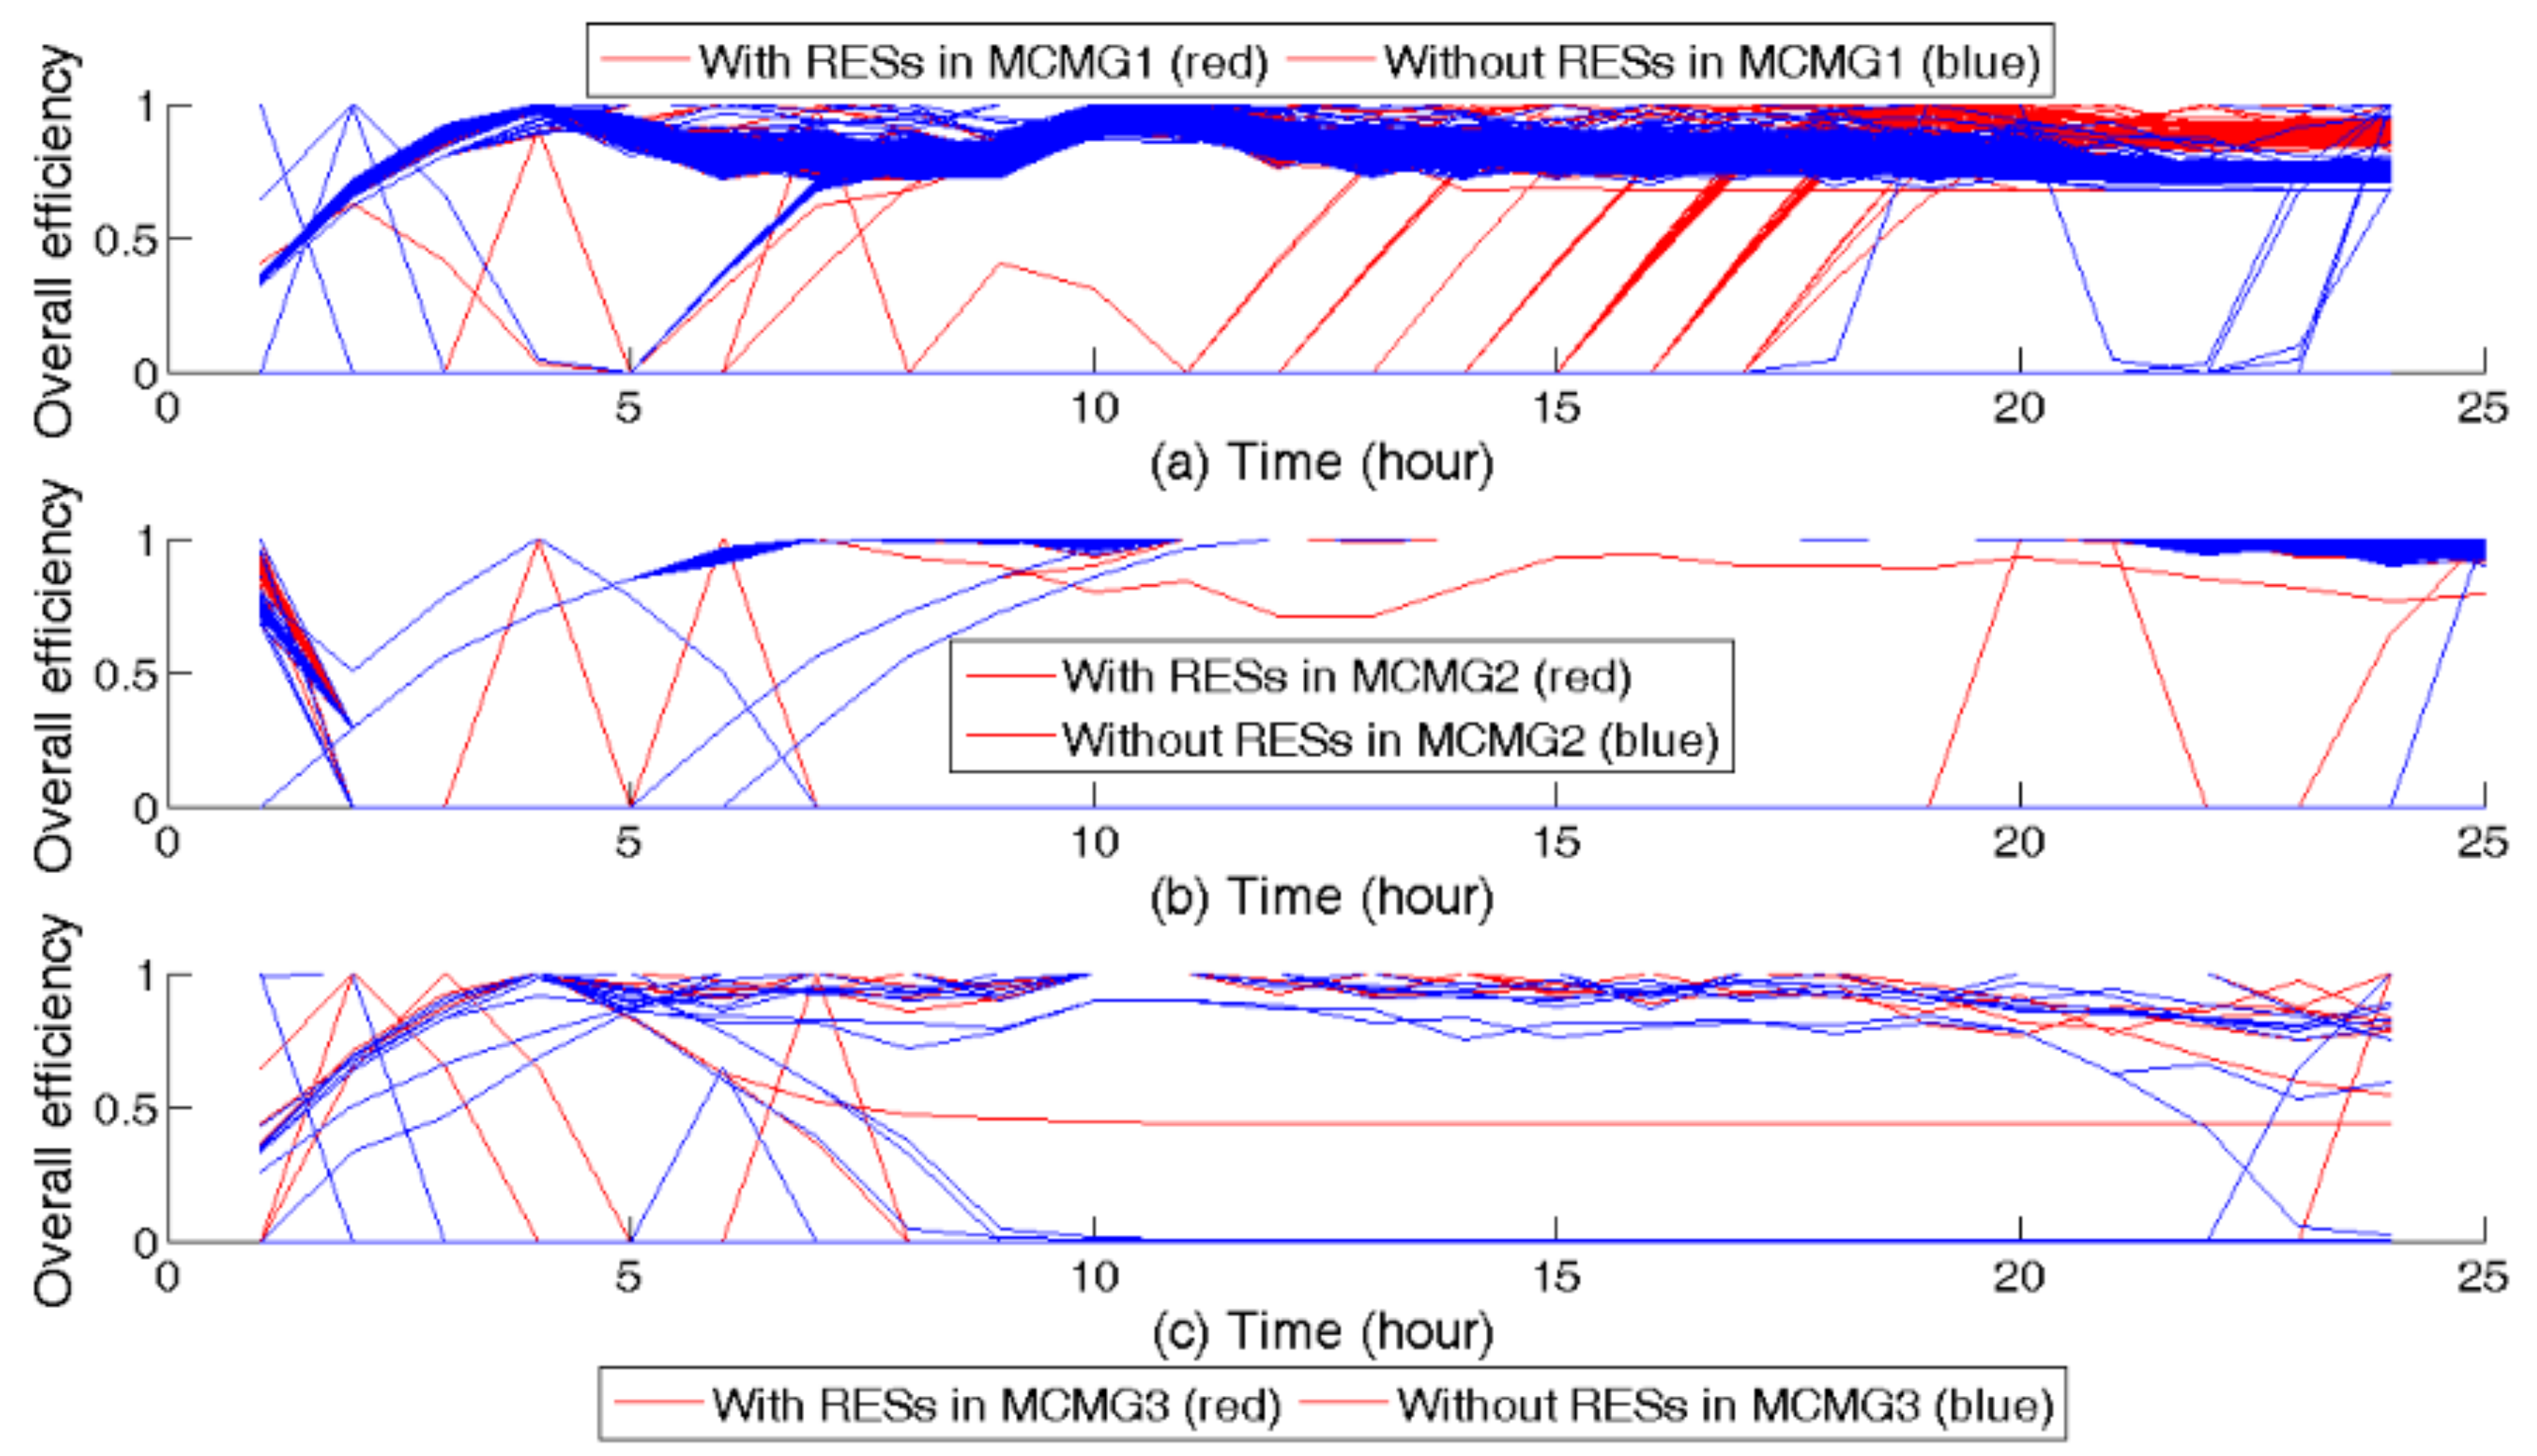
H2P ratio and overall efficiency of CHP units in each MCMG for different scenarios are illustrated in
Figure 14 and
Figure 15, respectively. At large, the mean values of H2P ratio and overall efficiency levitate moderately without RES penetration as a means of generating more heat. Additionally, the average overall efficiency of CHP units in each MCMG is 74%, 87%, 48%, respectively. The higher overall efficiency of MCMG 2’s CHP unit is stemmed from heat transportation to adjacent demanding MCMGs.
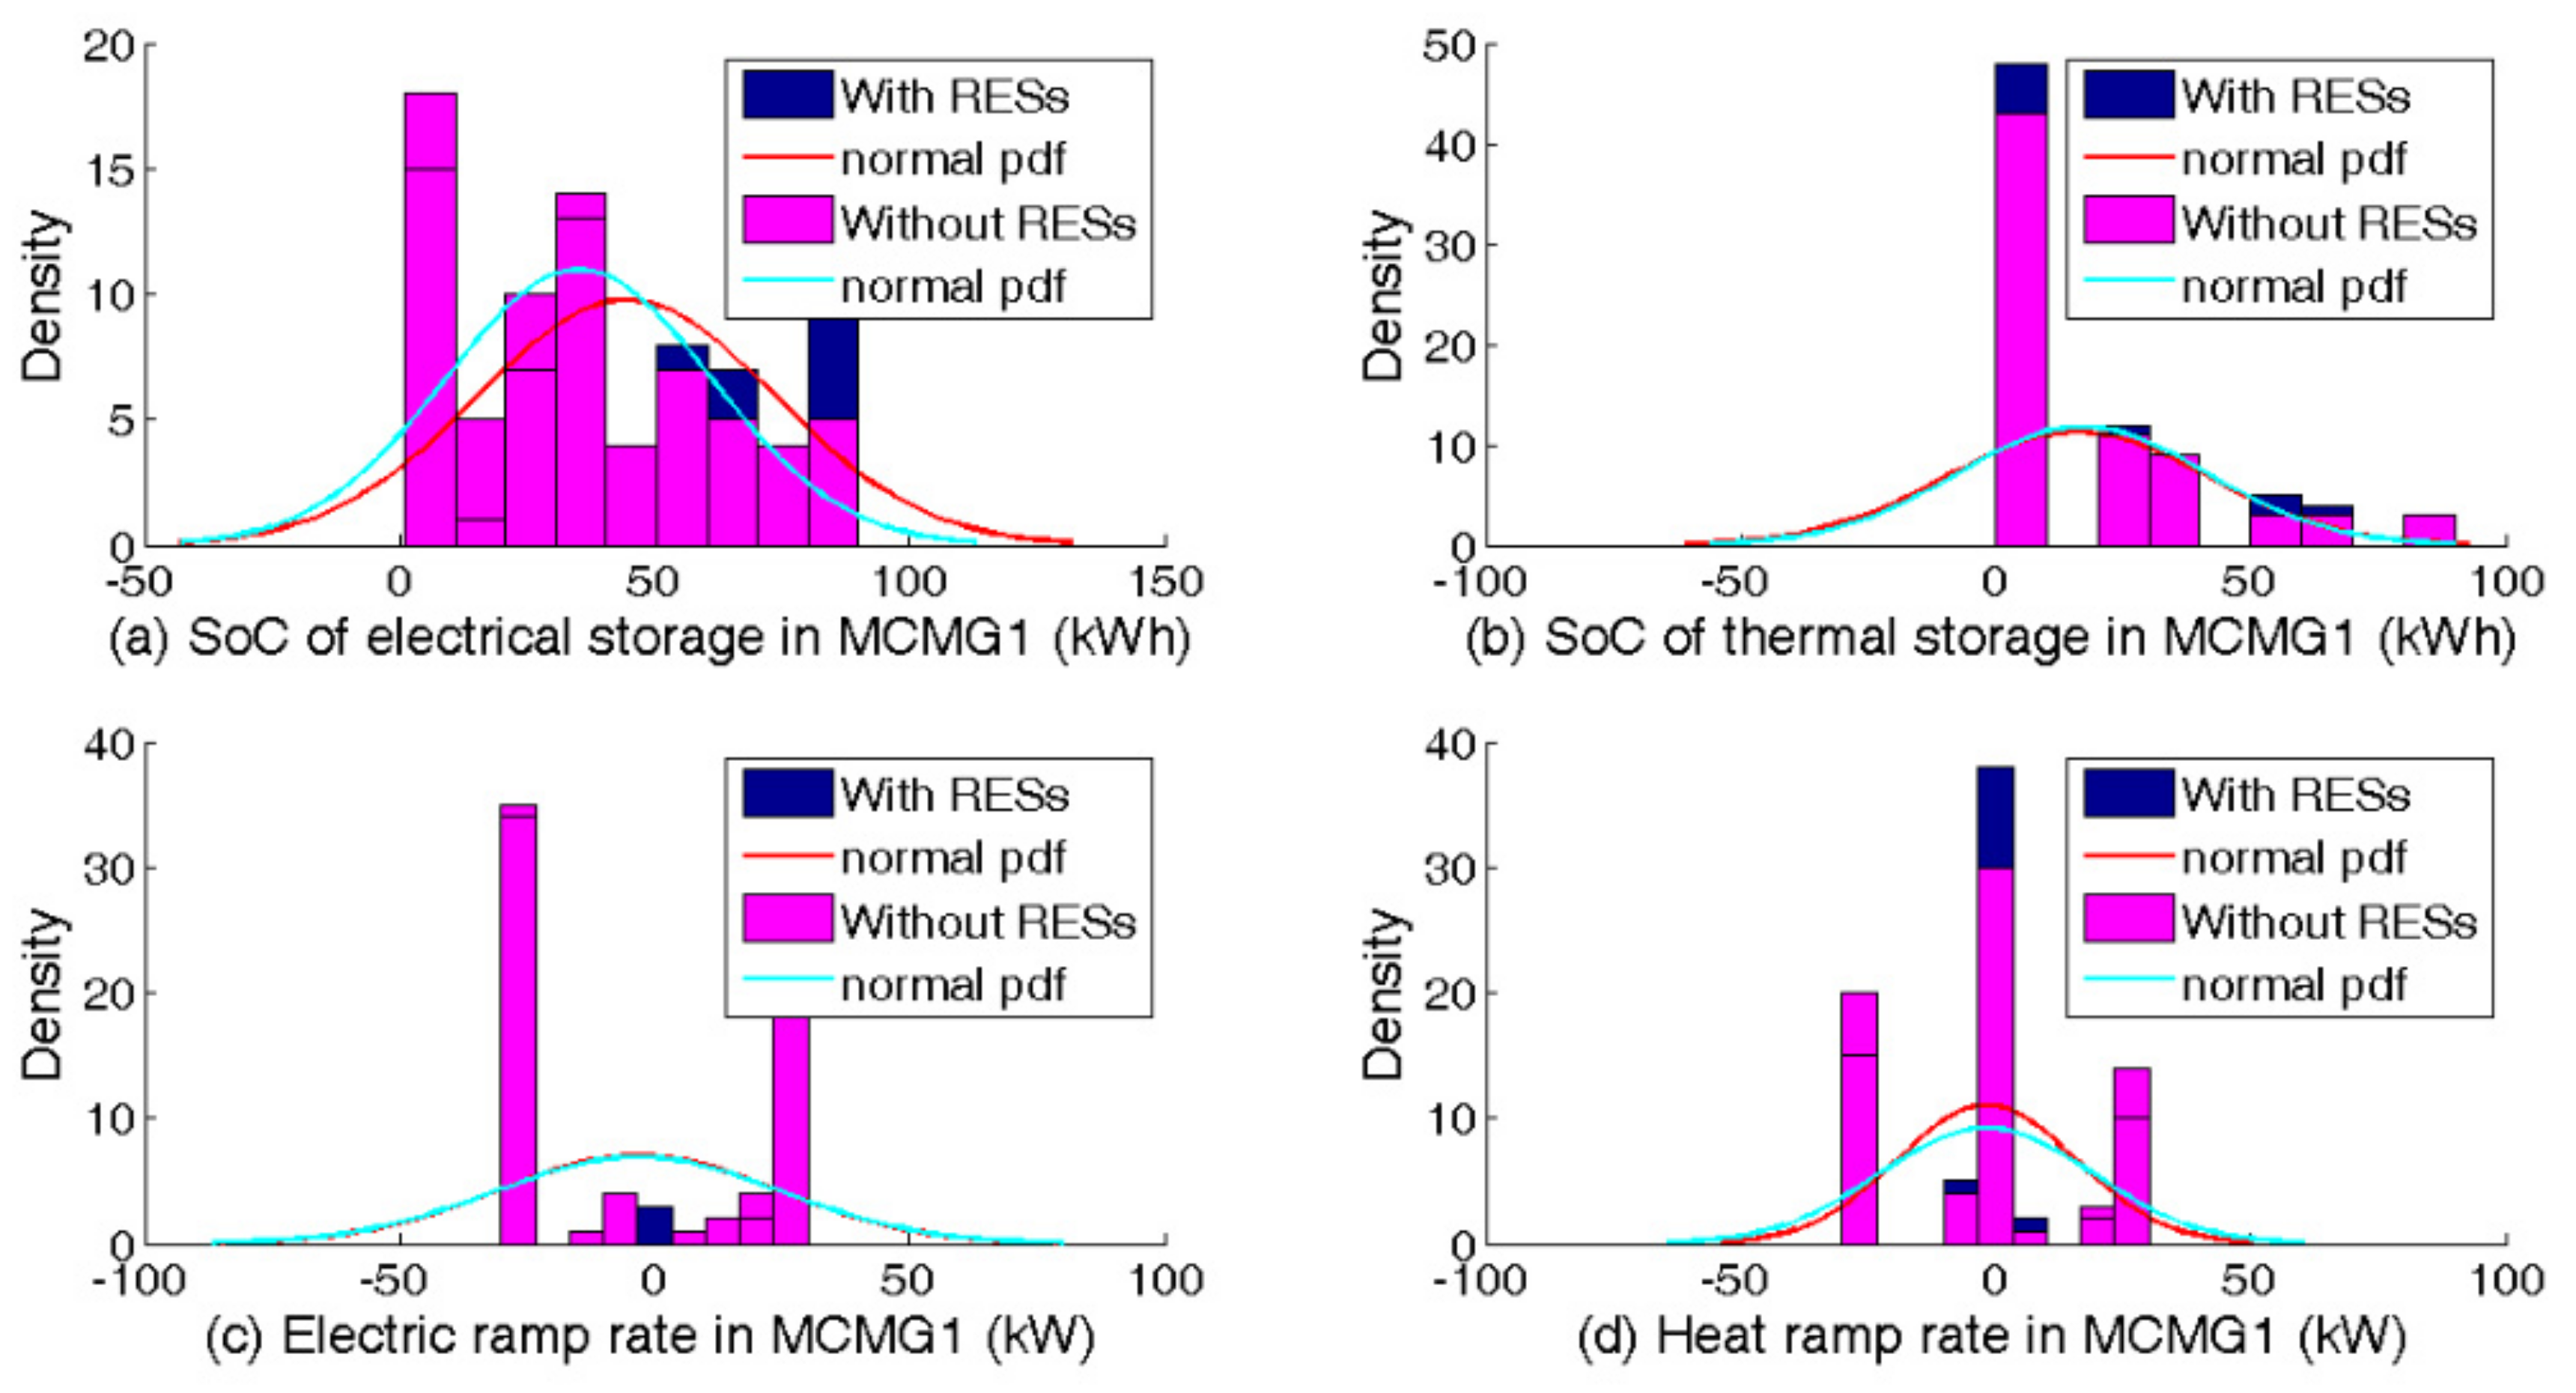
Figure 16 describes the SoC of power and heat for Case Study 3 in MCMG 1 at hour 22 of the day. It can be seen that the performance of electrical storage varies during major failures. Although the electrical storage usually tends to discharge its power during major failures, the electrical storage system in MCMG 1 initiates charging due to RES penetrations to stabilize the frequency and voltage in the emergency mode.
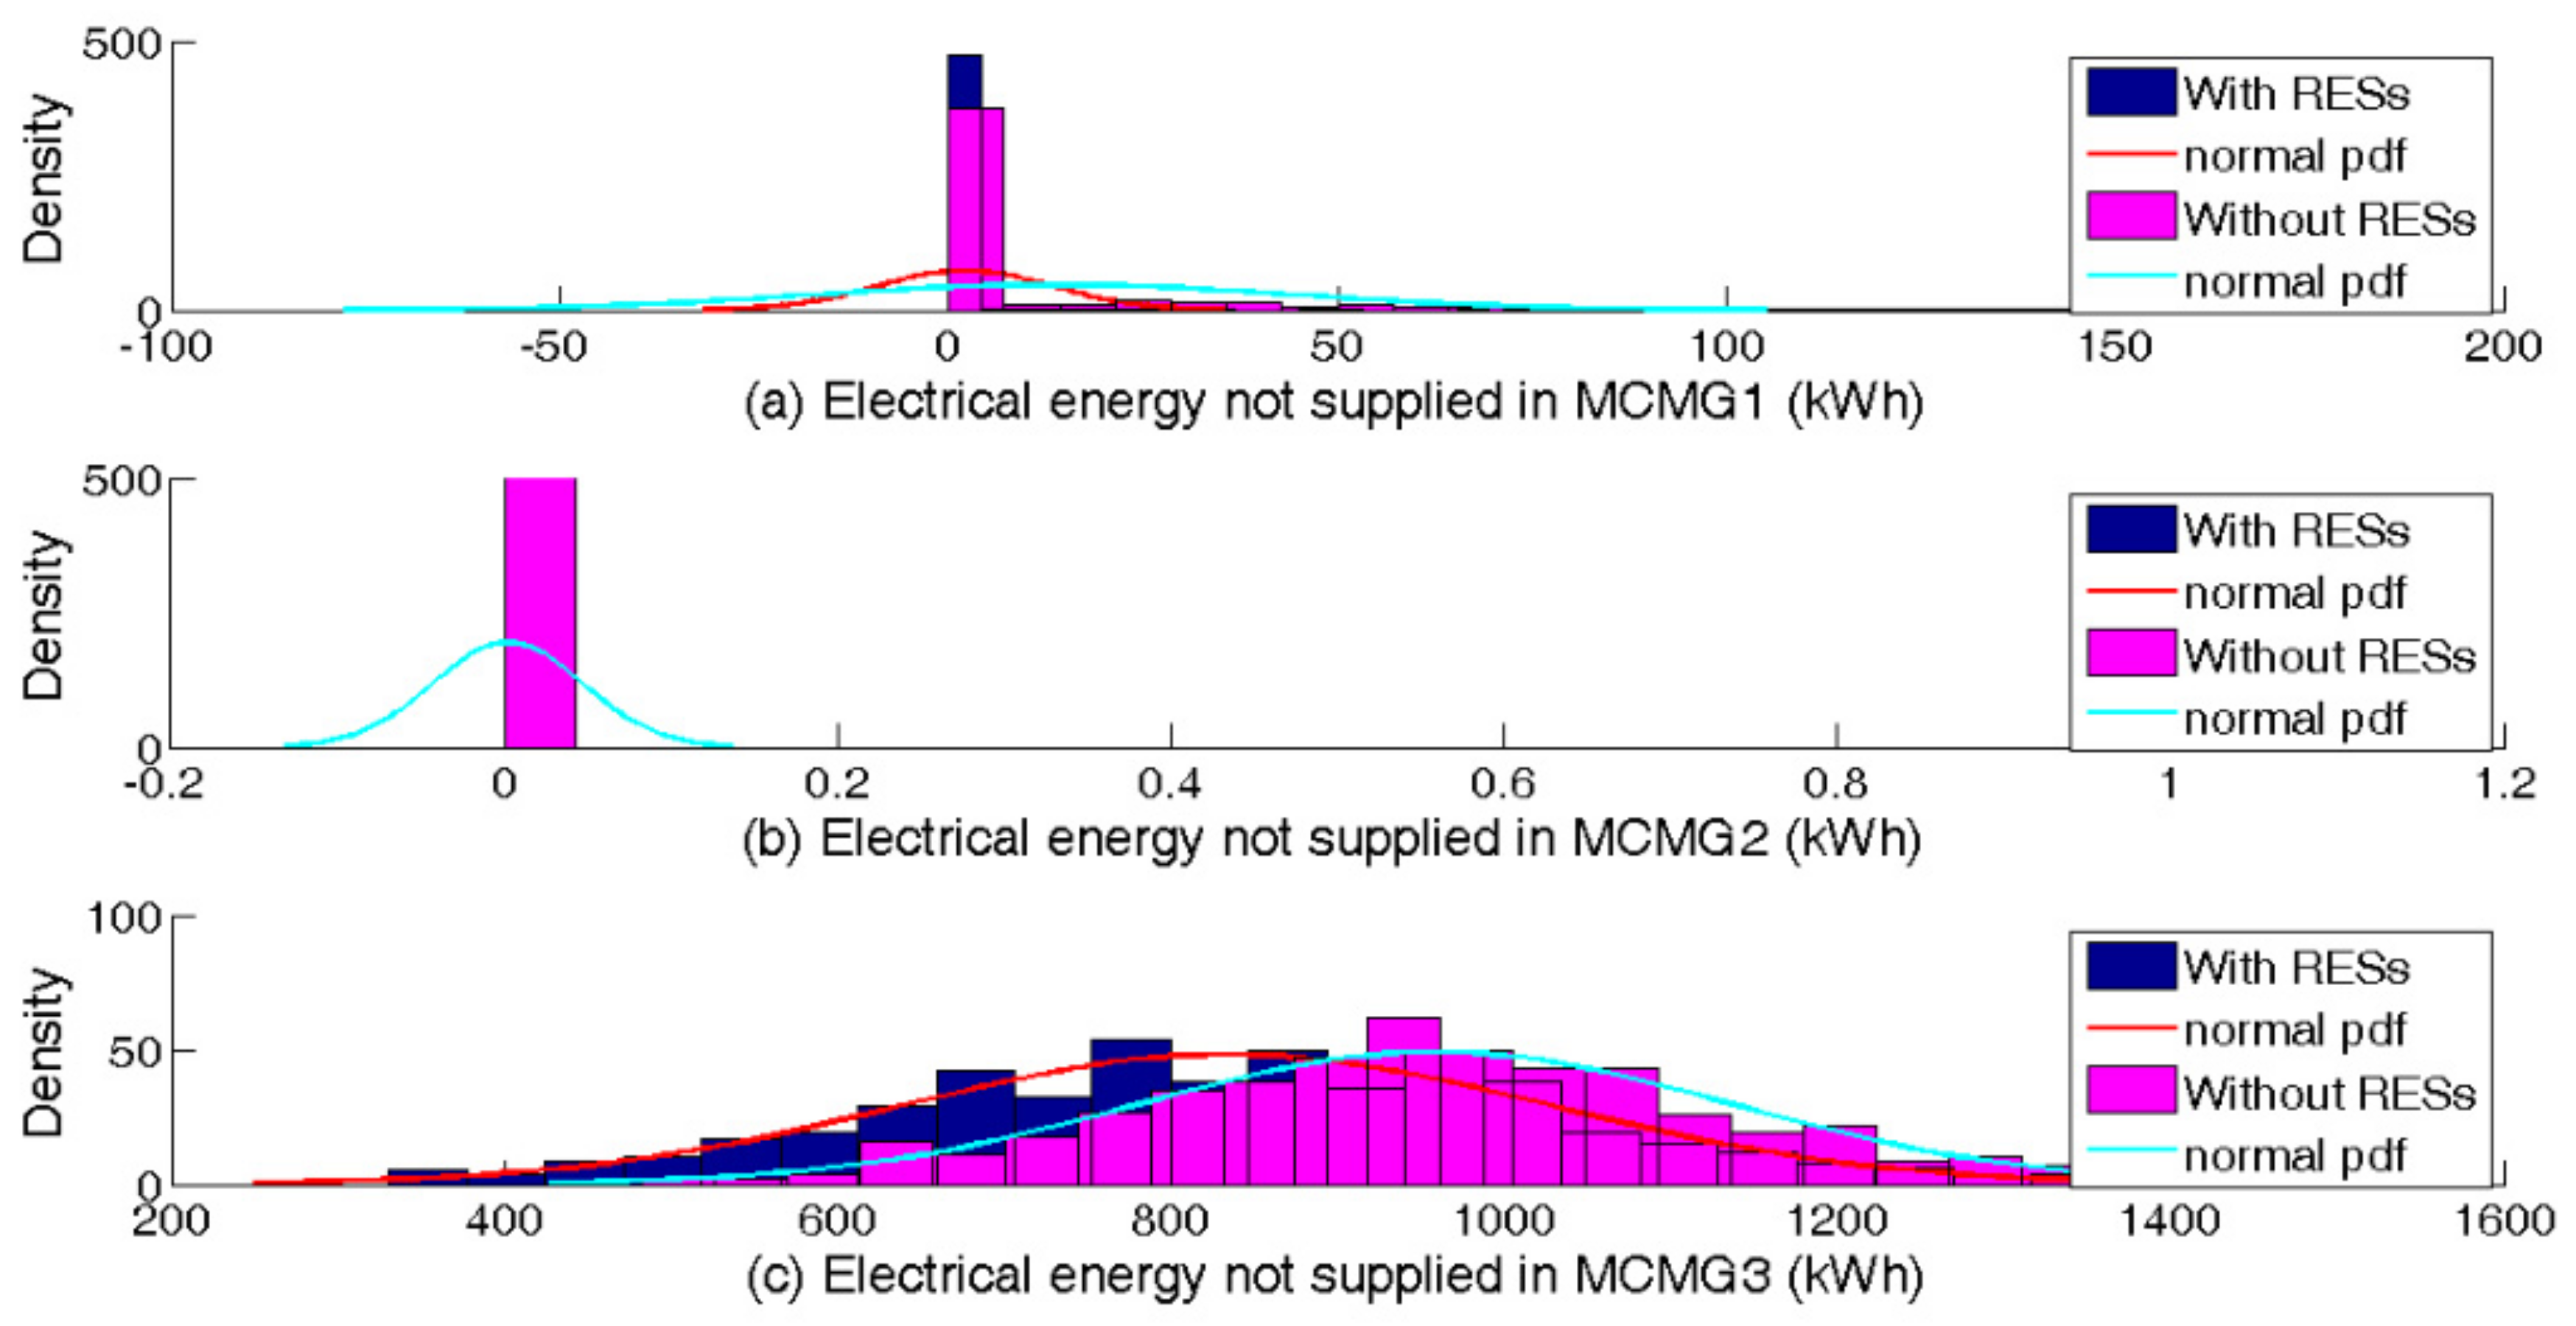
Figure 17 depicts the daily electrical energy not supplied in each MCMG for Case Study 3. As the graph reveals, the daily expected energy not supplied of MCMG 2 is zero when an unpredicted failure occurs on the supply side. The reason is that the WT compensates for the power shortage during critical hours. An average power shortage of 2 kW and 833.6 kW is ensued in MCMG 1 and MCMG 3, respectively.
Table 5 illustrates the resilience index for electrical demands in the emergency mode of Case Study 3. Based on the table, the DRPs and RESs play key roles in the resiliency enhancement of MCMGs. The results show that the flexibility potentials of the MCMGs increase when the IBDRP and TBDRP are applied concurrently. The results illustrate that resilience indices for MCMG 1 and 2 are notably higher than MCMG 3 during critical hours. Additionally, MCMG 2 is completely resilient against the main grid outage. The main reason is that the WT not only compensates for the lack of power generation in MCMG 2 but also supplies some parts of demands for adjacent MCMGs.
As shown, the resiliency of MCMG 3 is relatively lower than the other MCMGs. The reason is that the RESs are not available in MCMG 3. It is worth noting that more penetration of RESs will result in higher survivability of loads during emergency intervals. Additionally, the resilience index for thermal demands is equal to one in all intervals. The reason is that the gas-fired units supply the heat demand in all Case Studies uninterruptedly.
Table 6 presents the cost analysis of the operational strategies for different DRPs. In this way, the following points should be pointed out. First of all, power/gas flow limitations and unpredicted failures of power/gas networks not only affect the power balance of the networks but also increase the total cost of the NMCMG. The results of Case Studies 1 and 2 led us to conclude that an optimum solution would be attained by applying only TBDRP in normal and contingency circumstances; thus, employing both TBDRP and IBDRP would result in sub-optimal solutions. Comparing Case Studies 1 and 2, the total cost of the NMCMG is intensely affected by the contingencies. Besides, barely any change can be seen in the total cost of the NMCMG employing TBDRP and IBDRP concurrently.
In Case Study 3, each MCMG switches to islanded mode during major failures to supply domestic demands by local energy resources. In this way, a significant number of demands is curtailed to stabilize the frequency and voltage in the emergency mode. In Case Study 3, the total cost of the NMCMG is increased considerably compared with Case Study 1, but a relatively slight decrease in total cost is ensued compared with Case Study 2. The results manifest that contingency in gas networks impacts the system more critically than unpredicted failures in the upstream transmission networks.
In Case Study 4, the total cost of the NMCMG is decreased by 5% compared with Case Study 3. In this case study, the interconnectivity of MCMGs with the centralized optimization of the network allows the operator to compensate for the power shortage in MCMGs during unpredicted failures. The main reason is that the flexible consumers participate in the TBDRP in addition to the IBDRP. The total cost of the NMCMG decreases when the TBDRP and IBDRP are applied concurrently. Furthermore, the eminence of applying both TBDRP and IBDRP under emergency conditions is highlighted in Case Studies 3 and 4 as a substantial technology to reduce total cost. Last of all, the effectiveness of the proposed DRP under uncertainties is confirmed, given that a 33% peak mitigation is derived in this model and that the overall cost of Case Study 4 notably declines by about 28% when compared with that of [
56] under the assumption of 30% participation of responsive customers. Thus, TBDRP along with voluntary and mandatory DRPs, plays a vital role in bringing about a prominent decrease in the operation costs of MCMGs.
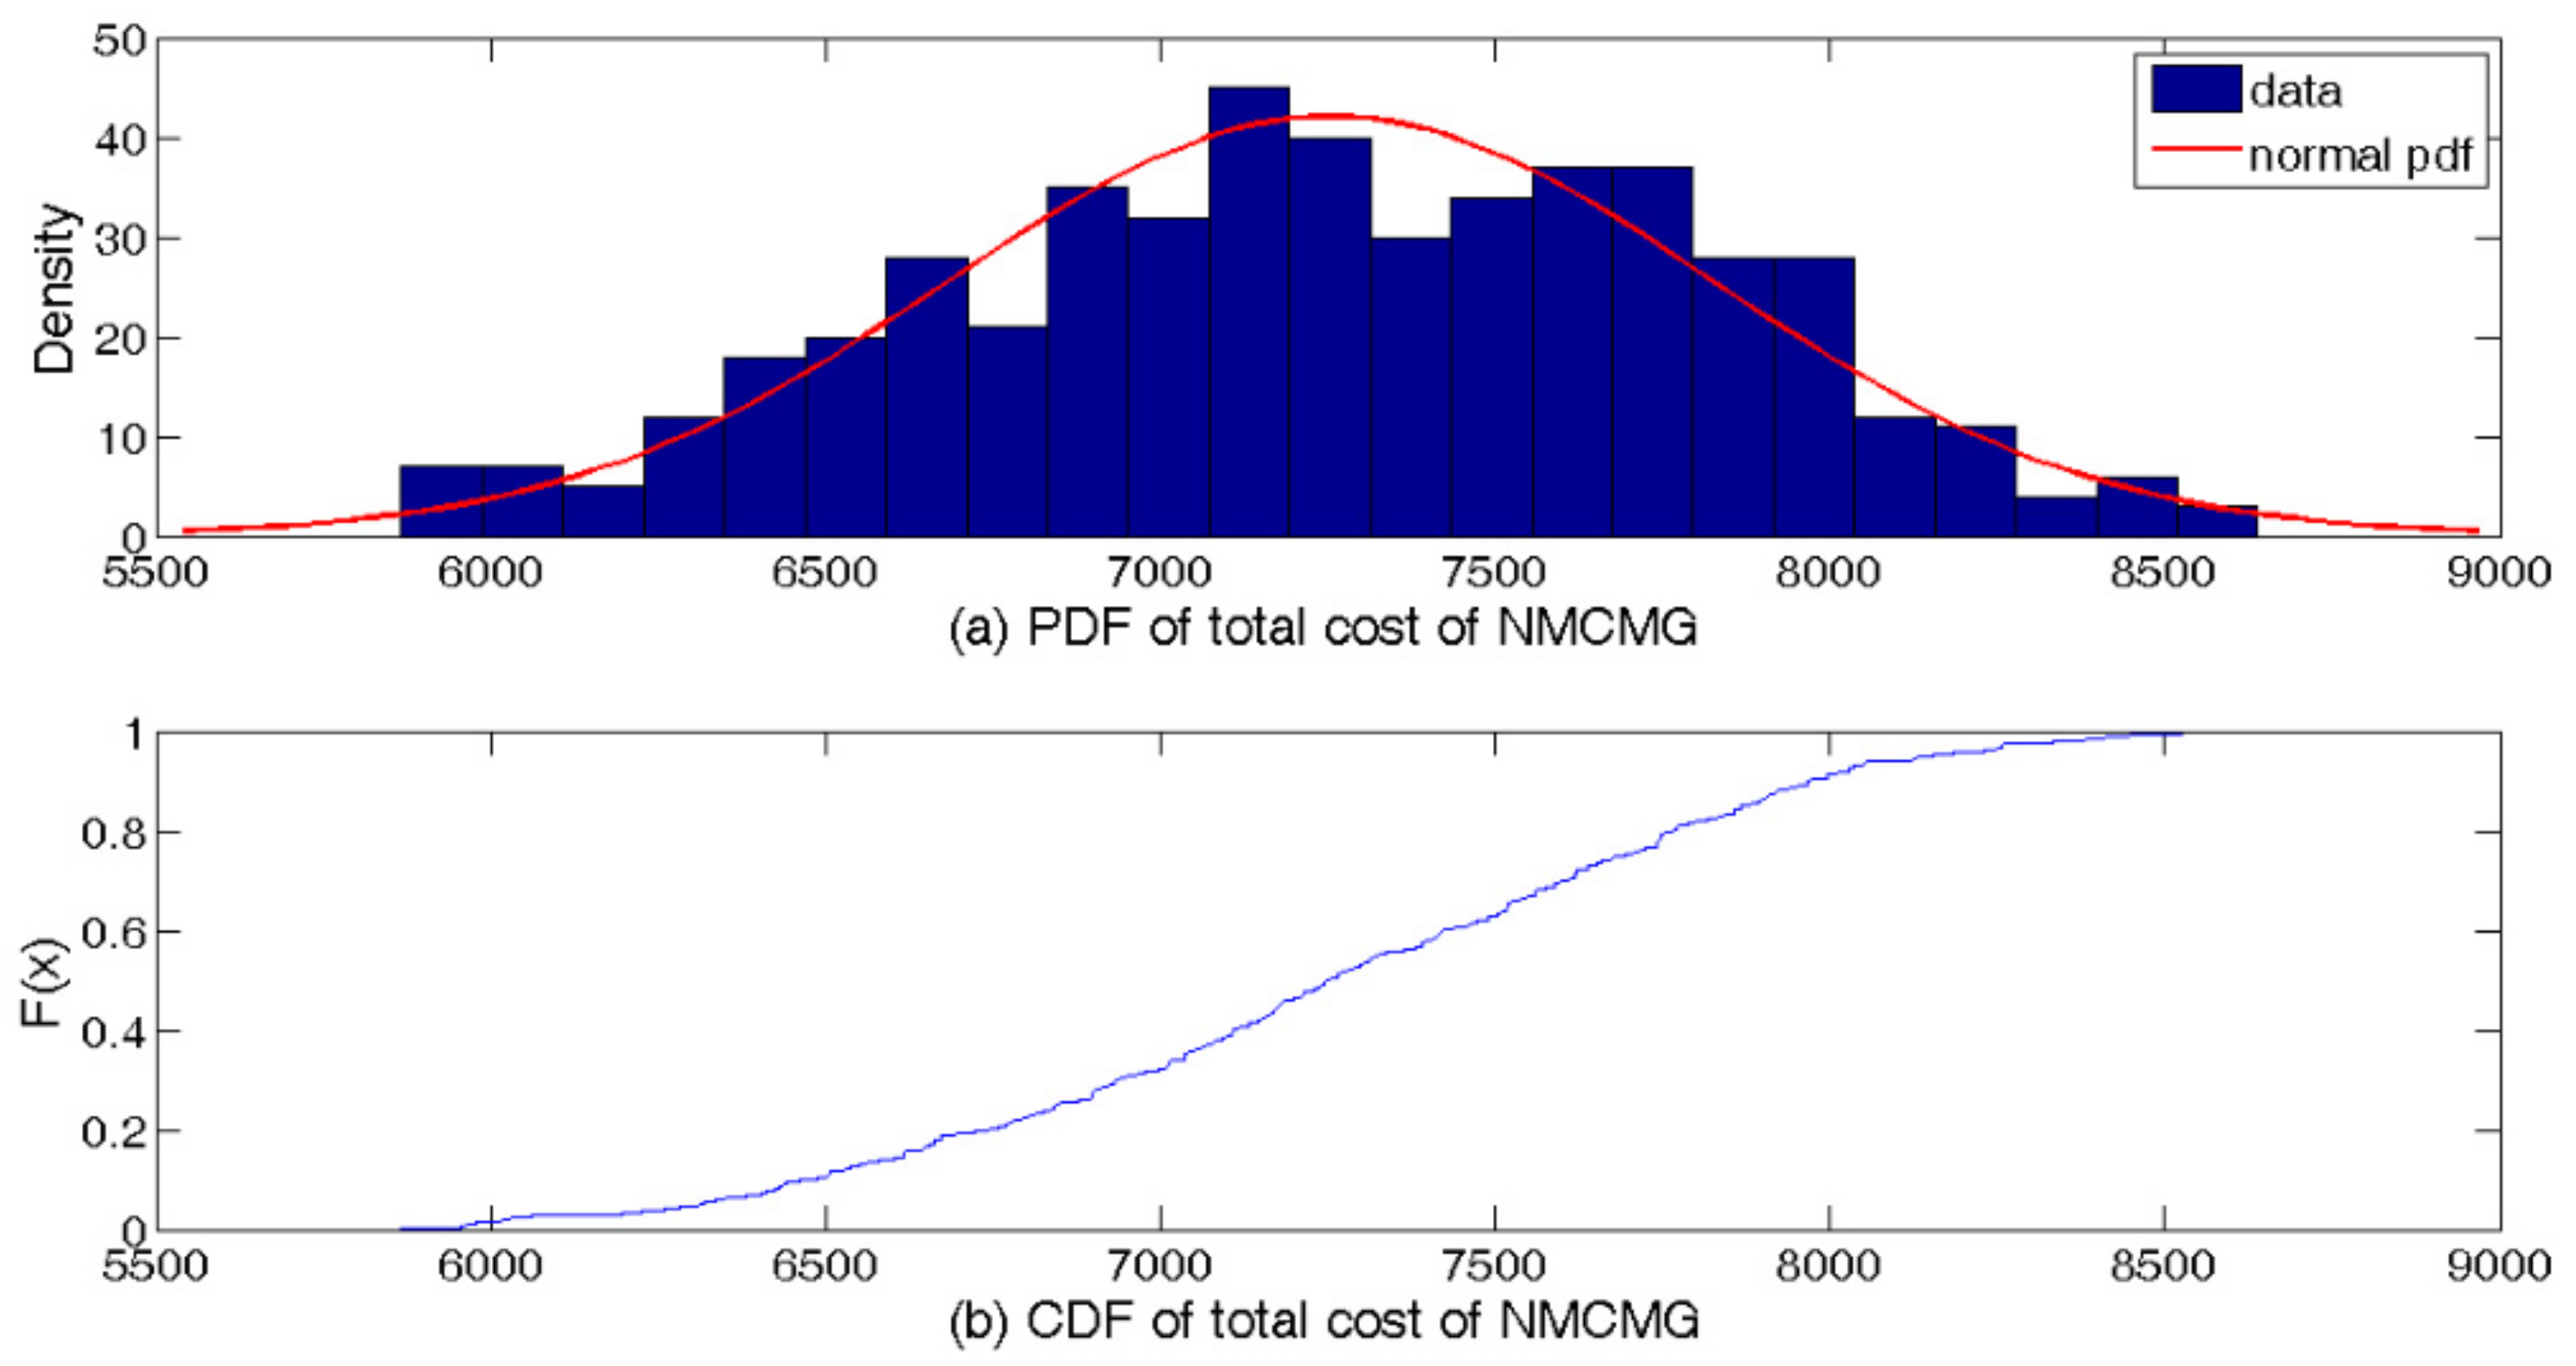
Figure 18 describes the total operation cost of the NMCMG for case study 4. The PDF and cumulative distribution function (CDF) are depicted. As can be seen, the normal PDF fits the total cost of the NMCMG reasonably well. Herein, the costs associated with energy exchange, maintenance and CHP units startup/shutdown, emission, and DRP payments embrace 74%, 14%, 12%, and 0.4% of the total cost on average, respectively. The reliability cost of the system is wiped out wholly due to the interconnectivity of MCMGs.
To conclude, the proposed approach confirms that the interconnections of MCMGs enhance the resiliency of the system. The centralized control approach changes the structure of MCMGs from grid-connected to islanded modes during critical hours. In this way, the interconnections between the MCMGs are preserved to integrate the flexibility potentials of one MCMG into adjacent MCMGs. Residential communities, industrial parks, and urban districts can be considered as practical applications to NMCMG.
To illustrate the proposed model’s merits, a comparison is made between the proposed framework and other approaches used for MGs short-term operation scheduling, as in
Table 7. As illustrated, remarkable cost reduction and peak mitigation are found in this work, addressing both time- and incentive-based DRPs within an NMCMG environment. It is worth pointing out that the acquired higher cost reduction of paper [
56] compared with this work may stem from a larger participation ratio of responsive customers to total demands.
5. Conclusions
This paper proposed a mathematical formulation for enhancing the resiliency of networked multi-carrier microgrids regarding severe uncertainties. Due to the uncertainties associated with the generation, demand, and electricity market, the deterministic energy scheduling fails to optimize the economic dispatch problem under uncertainties. Compared with the deterministic energy dispatch studies, the probabilistic optimal dispatch of energy in electric and natural gas networks helps system operators assess the system in a much wider sense and yields reliable data. Therefore, the combined optimization of the economic dispatch and coupled power flow for the electric and gas networks was conducted to optimize microgrids’ operational strategies both in grid-tied and off-grid modes. The uncertainties of thermal and electrical demands, photovoltaic sites, wind turbine generations, and the electricity market price were embedded in this study. The proposed network included three interconnected multi-carrier microgrids, where the electric and natural gas networks were designed radially. In contrast, the district heating network was modeled as a ring network without any heat transmission loss. To be more specific, the district heating network was represented as one single node in the networked multi-carrier microgrids; therefore, the multi-carrier microgrids could trade thermal energy internally. Furthermore, during severe incidents, operators of the networked multi-carrier microgrid, as a potential solution to deal with major power disruption events, were able to enter into an emergency operation mode and, thereafter, supply local loads in islanded modes. Besides, adjacent multi-carrier microgrids were able to link internally to share their unused capacity and maintain their supply-demand balance as a whole interconnected system. Besides, the capability of heat interchange between multi-carrier microgrids resulted in lower energy wastages. Furthermore, it was indicated that multiple carriers’ considerations could compensate for the power mismatch during contingencies or incidents. Moreover, the responsiveness of demands to electricity and gas prices resulted in lower costs under the centralized operation of networked multi-carrier microgrids. The results showed that the concurrent implementation of time- and incentive-based demand response programs mitigate congestion in power and gas networks. Moreover, it reduces the operation cost of the NMCMG in the emergency mode. The resiliency of multi-carrier microgrids was also enhanced by flexible consumers during the disturbance in the main grid. Network parameters were demonstrated as probabilistic and cumulative distribution functions, which can help assess the operation of interconnected networks.
In summary, this model enables the energy systems to couple various energy carriers, which yields various benefits from operational, CO2e emission, and economic perspectives, to coordinate between the interconnected multi-carrier microgrid communities. Indeed, leveraging demand response programs and coordination by the centralized optimization of the proposed network brings the system into an optimum situation, particularly when an incident occurs in the network. Moreover, the probabilistic method can increase the trustworthiness of the optimal solution by considering more uncertain parameters. For future works, the analysis of variance can be embedded into the model to guarantee a robust solution, as well as employing a dynamic price-based local energy market evaluator to avoid new peaks.


