Review

How Do Energy-Economy Models Compare? A Survey of Model Developers and Users in Canada

1
School of Public Administration, University of Victoria, P.O. Box 1700 STN CSC, Victoria, BC V8W 2Y2, Canada
2
Energy and Materials Research Group, School of Resource and Environmental Management, Simon Fraser University, 8888 University Dr., Burnaby, BC V5A 1S6, Canada
3
Sustainable Energy Systems Integration and Transitions Group, Department of Civil Engineering, University of Victoria, P.O. Box 1700 STN CSC, Victoria, BC V8W 2Y2, Canada
*
Author to whom correspondence should be addressed.
Sustainability 2021, 13(11), 5789; https://doi.org/10.3390/su13115789
Submission received: 20 April 2021 / Revised: 14 May 2021 / Accepted: 18 May 2021 / Published: 21 May 2021
(This article belongs to the Section Energy Sustainability)

Abstract

:
Governments at all levels rely on energy-economy models to design climate policy portfolios. Models vary in their purposes and methodologies, yet there is limited research comparing model characteristics and identifying models suitable for specific policy questions. We conduct a web-based survey of energy-economy model users and developers (n = 14) in Canada’s public, private, and non-profit sectors, to systematically compare seventeen models against the following characteristics: Technology representations, microeconomic and macroeconomic details, policy representations, treatment of uncertainty, high-resolution spatial and temporal representations, and data transparency. We find that for the most part, models represent technology, micro-, and macroeconomic characteristics according to the typology of bottom-up, top-down, and hybrid models. However, several modelling evolutions have emerged. To varying extents, top-down models can explicitly represent technologies and some bottom-up models incorporate microeconomic (non-financial) characteristics. We find that models differ in the types of policies they can simulate, sometimes underrepresenting performance regulations, government procurement, and research and development programs. All models use at least one method to explore uncertainty, rarely incorporate spatial and temporal representations, and most models lack publicly available methodological documentation. We discuss the implications of our comparative model analysis for climate policy projections and future research.

1. Introduction

In a pledge to limit the rise of average global temperatures beyond two degrees Celsius, 189 nations signed the Paris Agreement in 2015 [1,2]. As part of this pledge, countries developed nationally determined contributions (NDCs) that outline their strategies to reduce greenhouse gas (GHG) emissions [3]. While some NDCs are supported by climate policy, the current efforts are projected to miss the global commitment, requiring additional and more stringent national climate policy [4]. This is especially important in the developed countries, such as Canada, that have the financial capacity and responsibility for GHG mitigation [4].
Governments often rely on energy-economy models to design and assess the effects of climate policy proposals on GHG emissions and economic outcomes at the national, sub-national, and municipal levels [5,6]. When choosing among policy options, governments often seek different types of modelling information that is important to their specific policy questions and/or to a broader range of government objectives [7,8]. This information may include different pathways for reducing emissions and their associated abatement costs, distributional impacts, changes to economic activity levels, and impacts on the composition of jobs [9,10,11].
Energy-economy models examine the linkages between the energy system and the economy of a region [12]. However, the degree to which certain methodological characteristics are incorporated into a model varies across model types, thereby affecting climate policy projections in terms of GHG emissions and economics costs [13]. These discrepancies make it difficult for policy-makers to choose amongst the various models to assess impacts of existing and proposed climate policies. This is further complicated by the lack of publicly available and consistent information on modelling methodologies. While some information on academic models exists in scholarly databases, other information has only been sporadically gathered across the public, private, and non-profit sectors [9,11,14]. In addition, these sources do not use consistent characteristics to compare and contrast models, making it difficult for policy-makers and researchers to understand which model is best suited to answer their specific policy questions. Understanding how different models perform against common methodological characteristics can help both policy-makers and researchers choose models and/or improve existing modelling methodologies.
Using a web-based survey of energy-economy model users and developers in Canada (n = 14), our study compares and contrasts 17 energy-economy models currently used in the public, private, and non-profit sectors. Several recent studies have called for the use of survey questionnaires and personal communication to review and validate the technical features of modelling tools given the lack of ‘common language’ in published model reviews, misinterpretations of model descriptions in peer-reviewed versus white or green policy papers, and the general absence of methodological documentation on many energy-economy models [15,16,17,18,19]. Our study compares models in terms of their technology, micro-, and macroeconomic characteristics, policy representations, treatment of uncertainty, high-resolution spatial and temporal representations, and data transparency. Our objectives are to (1) inform existing literature reviews of energy-economy models with up-to-date survey data, (2) capture model information that is novel and not otherwise documented in a publicly accessible manner, and (3) enable systematic model comparisons against the aforementioned characteristics to identify model strengths and weaknesses with implications for climate policy projections. The study does not aim to conduct an exhaustive literature review, but rather builds on past reviews that have revealed substantial gaps and inconsistencies in published model descriptions and called for gathering direct input from model developers and users via surveys [15,16].
The paper is organized as follows. Section 2 reviews energy-economy modelling classification. Section 3 discusses our framework for assessing and comparing energy-economy models. Section 4 outlines the survey data collection and analysis methodology. Section 5 describes the results of our analysis. Finally, Section 6 concludes and discusses the implications of our findings for policy-makers and academic researchers.

2. Energy-Economy Model Classification

Energy-economy modelling literature suggests three model types categorized by analytical approach: “bottom-up” technological models, “top-down” macroeconomic models, and hybrid models that combine the strengths of the bottom-up and top-down model types [20]. While model frameworks are diverse and do not always fit into these general categories, it is pedagogically useful to classify models in this way [21]. This classification distinguishes models based on the three characteristics of technology, micro-, and macroeconomic representations [13,20]. Technology characteristics involve the level of detail a model has about current and emerging technologies [22]. Microeconomic characteristics refer to the inclusion of both financial (capital and operating) and non-financial (intangible) costs associated with individual technology preferences such as the quality of service and risks of new technology failure [6]. Macroeconomic characteristics represent how the energy system interacts with the larger macroeconomy through equilibrium feedbacks [15,20].
Bottom-up energy-economy models estimate energy use and associated GHG emissions from a technology-explicit perspective including market shares, operating costs, and performance attributes of both supply- and demand-side technologies [20,21]. However, these models have been criticized for their focus on financial costs alone, ignoring the non-financial intangible costs of new technologies [6,21] and underestimating the total cost of GHG abatement [15,20,23]. In addition, the technologies in the energy sector might not interact with the rest of the economy, limiting the usefulness of bottom-up models for policies that have economy-wide impacts [24].
Conversely, top-down models tend to represent micro- and macroeconomic characteristics better than technology details. The historical macroeconomic data used to parameterize top-down models can implicitly capture the intangible costs firms and consumers face when purchasing technologies. However, historical data may not always accurately reflect future decision-making processes [6,21]. These models can estimate macroeconomic effects of policy interactions with the rest of the economy, making them useful for modelling economy-wide policies such as carbon taxes [23]. However, their aggregated approach to technology representation tends to overestimate the GHG abatement cost of technology-specific policies [25].
Hybrid models were developed to combine the strengths of bottom-up and top-down models. These models tend to incorporate the technological explicitness of bottom-up models and the micro- and macroeconomic characteristics of top-down models, in order to produce more accurate projections [6,20,26].
Besides the aforementioned types of energy-economy models, policy-makers also use integrated assessment models (IAMs) and energy systems models to inform climate policy decisions, often for other types of policy questions [27,28]. IAMs aim to link key processes of the economy and energy system with the dynamics of the atmosphere and biosphere, providing useful insights into the complexity of environmental problems [29]. Energy systems models focus on the energy system (i.e., the progression of acquisition to the final use of energy), within an economy to understand energy supply and demand and generally do not incorporate economic agent behavior [27]. While there have been examples of systematic reviews of IAMs (e.g., [30,31]) and energy systems models (e.g., [27,32]), energy-economy model reviews are lacking, especially in the Canadian context. Therefore, the scope of our review is restricted to the assessment of energy-economy models in Canada [11].

3. Energy-Economy Model Assessment Framework

While the technology, micro-, and macroeconomic characteristics have been considered extensively in the modelling literature (e.g., [14,20,33]), several other characteristics have been put forward as being important in the assessment of energy-economy model projections, including policy representations, treatment of uncertainty, spatial and temporal resolution, and data transparency [11,15,27,32]. However, none of the previous literature reviews have consistently described energy-economy models against these characteristics overlooking some aspects of the models and their implications for policy decisions [16,19]. In this study, we review and compare energy-economy models via a web-based survey instrument that collects primary ‘expert’ data from model users and developers in Canada on the seven model characteristics: Technology characteristics, micro- and macroeconomic characteristics, policy representations, treatment of uncertainty, high-resolution spatial and temporal representations, and data transparency, discussed below in detail. To our knowledge, this is the first study to systematically compare energy-economy models in Canada against the seven characteristics using a survey-based data collection method. By allowing for direct input from model developers and users, the study bridges the methodological gap in existing literature reviews and establishes a common language to compare and contrast models with implications for climate policy projections.
Our study, however, does not test a specific conceptual framework. While we generally follow Hourcade’s [20] model assessment characteristics, we primarily employ an exploratory research approach to gather information on the key strengths and gaps in existing energy-economy models to help guide researchers and policy-makers in their model choices and interpretations of modelling results.
Technology characteristics refer to the level of detail about technology-specific parameters and the representation of technological change in an energy-economy model [15,21]. A high level of technological detail aids policy-makers in making market-specific predictions of consumer and firm responses to a particular policy [6]. Technologically explicit models can consider commercial (e.g., hydroelectricity, nuclear, hybrid electric vehicles) and near-commercial (e.g., direct air capture, carbon capture and storage, hydrogen-fuel cell vehicles, first- and second-generation biofuels) technologies. These technologies can be characterized by their capital and operating costs and performance attributes (e.g., energy efficiency) [6]. When technologies are represented in adequate detail, the evidence base for developing policies is generally strengthened [34]. The representation of technological change dynamics also impacts climate policy projections [35]. Exogenous technological change is often modelled as a function of time, and is therefore represented independent from, and thus unresponsive to, policy measures [35,36,37]. It can be represented via an autonomous energy-efficiency improvement (AEEI) parameter in more aggregated models, the addition of new energy-efficient technology in more disaggregated models, or through backstop technologies (i.e., undefined processes or technologies used to limit abatement costs) [35]. In contrast, endogenous technological change is influenced by investments in research, expected prices, and policies in addition to the passage of time [35,37]. The three main methods of incorporating endogenous technological change are direct price-induced, investments in research and development, and learning by doing [35].
The second model characteristic is microeconomic representations that enables the model to account for people’s non-financial (behavioral) choices that impact the effectiveness of policies [20,38]. Addressing the microeconomic characteristics in energy-economy modelling can be accomplished through two main methods: Market heterogeneity and non-financial decision factors used in decision-making [15]. Market heterogeneity reflects the reality that variation exists amongst consumers and producers. This variation can include factors such as income stratification or other socio-economic and behavioral parameters, that can influence technology choice [39]. The inclusion of market heterogeneity in energy-economy models is more likely to portray a realistic outcome of technology adoption and the distributive impacts of policies [38]. Non-financial (sometimes called “intangible”) costs are additional costs incurred by consumers and firms when making technology-purchasing decisions. Typically, models represent firms and consumers as ‘rational agents’ in their decision-making when choosing between technology alternatives [20,40]. Rational agents aim to maximize utility, have fixed and known preferences, as well as perfect information. However, real-world decision-making is much more complex and agents do not always choose the rational option that is the most cost-minimizing or utility maximizing [41]. The risk of adopting new technologies, quality variations between technologies, and the lack of information are all important non-financial considerations that, if ignored, can lead to underestimated costs of GHG reductions [14,15,20,37].
Third, macroeconomic characteristics represent a region’s economy through the relationships of energy supply–demand to the structure of the economy [15,20,38]. Climate policies have the ability to cause economic benefits and costs, which can often occur at the same time [42]. These macroeconomic feedbacks have the ability to change both the structure and the growth rate of the economy, and its outputs [21]. Understanding the influence of climate policies on the economy is therefore important to policy-makers when they are considering decarbonization pathways. The two common approaches for incorporating macroeconomic feedbacks in an energy-economy model are via full or partial equilibrium methods [15]. Full equilibrium methods link the whole economic output to energy supply and demand in the macroeconomy. The effects of policy instruments, price fluctuations, and resources on every sector are examined [43]. In contrast, partial equilibrium methods only consider a part of the economy, with the focus on the energy sector. Generally, both full and partial equilibrium methods link the energy-consuming sectors to the energy-producing sectors of the economy to represent the supply and demand of energy in the economy [15]. Through price and quantity adjustments, equilibrium is achieved between the supply and demand of all energy commodities. For example, due to the variable nature of renewable energy sources, the representation of the electric grid is crucial to understanding the balance of supply and demand of electricity between economic sectors [44]. This can also be done for non-energy commodities, though it is not incorporated as often as it is for energy commodities [15].
Another important macroeconomic characteristic is the incorporation of trade and financial feedbacks [20,21]. Models can range from not including trade effects all together to assuming domestic goods are preferred over imports or that goods are traded easily and are homogenous globally [37]. Further, models can differ in how they represent the financial and monetary sectors [5]. Given that financial investments in clean energy are required to meet climate goals, knowing the origins of investments and how they affect the economy is crucial in climate policy projections [39].
Fourth, models differ in their representation of different types of climate policies. Policies can be considered individually or in combination with each other [15]. Their modeled impacts can range to include GHG reductions, abatement costs, and/or distributional impacts [7]. The ability for a model to represent multiple climate policies allows policy-makers to choose the best combination of policies for a given goal, if policy interactions are in fact carefully considered to avoid the double-counting of emission reductions [45,46]. The common climate policy instruments that are of interest in modelling include government investments and subsidies, emission pricing, performance standards, and prescriptive regulations [7]. Government investment and subsidies are measures that provide financial aid or support to lower the barrier to accessing low-carbon technologies. Research and development investments are a common example of government investments, while rebates for energy efficiency are a typical form of subsidy. Emission pricing can take the form of a direct tax on emissions, or a tradeable allowance system also known as a cap-and-trade, or a hybrid combination of the two. Both methods require economic agents to either decrease their emissions or pay a carbon price [7]. Performance standards set regulatory requirements without prescribing specific technologies and sometimes allowing for credit trading as a compliance option [7]. Low-carbon fuel standards and zero-emission vehicle mandates are examples of performance standards. Prescriptive regulations do not give firms the flexibility to decide how to meet government standards and instead require them to adopt specific technologies, with non-compliance leading to penalties [47].
Fifth, the incorporation of uncertainty is important to provide a range of possible real-life scenarios given the complexity of modelling methodologies [43]. However, policy reports and academic literature usually do not consistently summarize the treatment of uncertainty across different models. Energy-economy models can consider parametric and structural uncertainty, where the former represents the uncertainty in input parameters and the latter refers to the uncertainty in the structure of the model describing energy-economic systems [48,49]. A sensitivity analysis is a common method to address parametric uncertainty by assessing the relative influence of each input parameter on modelling results [48,50]. A Monte Carlo analysis is another method to determine the uncertainty range of a variable in addition to determining which parameters are important to the results [43]. The effects of uncertainty in economic growth rates, discount rates, energy prices, and technology details, can be explored to provide a range of possible GHG and economic outputs under climate policy [51].
Sixth, high temporal modelling resolutions can help account for the intermittency of renewable energy supply via real-time data and time slices [27,32]. High spatial resolutions, on the other hand, are crucial in community-scale energy management where the effects of policies are not spatially uniform (e.g., urban transportation and zoning bylaws) [11].
Finally, the transparency of the methods, data, and assumptions used in an energy-economy model is important for the results to be reproduced and trusted by relevant stakeholders [52,53]. Transparency can be increased by making the model’s source code, input data, and documentation publicly available as well as using free software tools to allow for wider model accessibility [53]. Greater transparency can help third parties to reproduce and validate modelling results, and to increase the general understanding and trust in models among researchers and policy-makers.

4. Materials and Methods

4.1. Data Collection

We implemented a web-based survey of energy-economy model ‘experts’ (n = 14) in the public, private, and non-profit sectors in Canada, to collect primary data about their models as per the seven assessment characteristics in Section 3. We chose a purposive convenience sampling methodology to recruit the ‘experts’ [54] including model developers and model users because they tend to simulate the effects of climate policies and use the results to inform policy decisions. Purposive convenience sampling requires making judgements regarding including or excluding certain individuals to achieve specific research objectives [55]. Given that the energy modelling field includes a variety of models (i.e., energy-economy, integrated assessment, and energy systems) and our focus is on energy-economy models only, the purposive convenience sampling allowed to select the most appropriate individuals. Our population included experts from a comprehensive scoping review of energy-economy models by Rhodes et al. [15] that identified 33 model users and developers of energy-economy models in Canada. These 33 individuals represented 30 organizations consisting of 20 public organizations, 6 private companies, and 4 non-profit organizations. We identified email addresses of the 33 individuals through their organizations’ open-access websites and sent electronic invitations. In our invites, we stated that different individuals from each organization could fill out the survey for different models, and different individuals who develop and/or use the same model(s) could complete the survey together, in one response, given the complex nature of some models and the small size of the energy-economy modelling field in Canada.
We administered the survey in September 2020 using the University of Victoria’s SurveyMonkey platform. We employed tailored survey design methods to ensure high quality of responses while minimizing the overall survey error [56]. We pre-tested the survey questions with a select group of energy experts and economists in public (i.e., academic and government) institutions to reduce survey error. The average time for a respondent to complete the survey was 1 h and 30 min but it is skewed by six respondents who completed the survey for more than one model.
To encourage participation and establish trust, we sent out personalized survey invitations explaining the purpose of the study and its benefits to the potential participant. Before beginning the survey, all respondents were presented with consent information outlining the terms of participation, including the risks and benefits to participating as well as how their data would be used, analyzed, and stored. To begin the survey, all respondents were required to agree to these terms.
We received complete survey responses from 14 individuals, 10 model owners and 4 model users, resulting in a 42% response rate. However, these individuals reported on 19 distinct models out of the total of 21 models identified in the exhaustive scoping literature review of all Canadian energy-economy models in Rhodes et al. [15], making the survey representative of the energy-economy models in Canada. Receiving data from 14 out of 33 invited respondents was a result of (a) allowing respondents who use/develop the same model(s) to work together to submit a joint response, and (b) several model users/developers reporting on more than one model (i.e., eight individuals responded for one model, five responded for two models, and one responded for five models). Collecting data representative of models, rather than model users and developers, was important for the primary goal of the study to compare and contrast energy-economy models, rather than opinions of model users and developers. Further, the 14 respondents represent many of the top energy-economy modelers in Canada, which is a small field comprised of specialized knowledge holders. As 71% of the respondents are model owners/developers (the rest are model users), they represent a population with the most up to date and in-depth knowledge about their model designs. The individuals represented 13 organizations: Five public organizations, six private companies, and two non-profit organizations.
The survey contained a mix of closed-ended and open-ended questions in each of the sections. The questions were based on the seven assessment characteristics from Section 3 and aimed to collect objective information about model features rather than opinions or judgements of model developers and users, to minimize the social desirability bias. Specifically, the survey consisted of eight sections: (1) Information about the respondent; (2) general model information; (3) the model’s technology characteristics; (4) the model’s inclusion of microeconomic characteristics; (5) the model’s inclusion of macroeconomic characteristics; (6) the model’s policy representations; (7) the model’s treatment of uncertainty, inclusion of spatial and temporal representations, and transparency of modelling assumptions; and (8) final comments (see Appendix A for the full survey questionnaire).
In the first section, respondents were asked general questions about their identity, organizational affiliation, and the number of models they use or run in their line of work. The subsequent sections and questions were repeated for each model based on the indicated number of models that are run or used by the respondent. The second section asked general questions about the model including the model name and owner/operator, model description to identify its type (i.e., top-down, bottom-up, or hybrid), and other general information such as the jurisdictional application and simulation period.
In the third section on technology characteristics, respondents were asked questions about the level and dynamics of technology representation in their model. A definition for technology characteristics was provided at the beginning of the section. Respondents were asked questions about the number of represented technologies, types of included and excluded near-commercial and backstop technologies (i.e., defined in the survey as “an undefined processes used to limit abatement costs”), how technological change is represented, and how often technology parameters are updated.
The fourth section on microeconomic characteristics asked respondents questions on the model’s ability to realistically represent agent behavior within the energy-economy. A definition of microeconomic characteristics was provided at the beginning of the section and other terms were defined throughout the questions. Respondents were asked about their model’s ability to capture perceptions of upfront costs, lack of information, quality of technology service, risks of new technology failure, and how often microeconomic parameters are updated.
The fifth section started with a definition of macroeconomic characteristics and asked questions about the model’s representation of equilibrium feedbacks, balances of energy and non-energy commodities, representation of the electric grid (due to electricity typically portrayed as its own sector), trade, the monetary and finance sectors, and how often macroeconomic parameters are updated.
The sixth section on policy representation asked questions about the model’s ability to accurately represent different types of climate policies and policy mechanisms, including government investments, subsidies, a carbon tax, cap-and-trade, hybrid carbon pricing (combining carbon tax with cap-and-trade), carbon revenue recycling, performance standards, and prescriptive regulations. The final question asked how often policy parameters are updated.
The seventh section asked questions about the uncertainty method(s) used by the modelers and the parameter(s) most often explored through uncertainty analysis. Respondents were also asked to answer questions about high-resolution spatial and temporal representations as well as the transparency of the model and data. The final section asked a single open-ended question to share any other model details.
It is important to note that the survey responses represent a static form of self-reported knowledge of the contacted 14 experts. Other stakeholders using these models may frequently update them and perceive model characteristics differently. Therefore, the responses may not always capture the most up to date information and heterogeneity in perceptions of model capabilities, but rather provide a snapshot of the energy-economy modelling landscape to guide policy-makers and researchers in their model choice and interpretation of modelling results.

4.2. Data Analysis

The responses for four models (i.e., CIMS, GCAM, gTech, LEAP) with multiple survey participants were merged into one synthesized response per model through the use of the following methods: (1) For “I don’t know” answers from one respondent, any alternative response from another respondent would replace “I don’t know;” (2) questions that allowed multiple answers (e.g., the timeframe in which parameters are updated) were merged in the combined response; and (3) if both the developer and a user of a model submitted contradictory responses, the developer’s answers were used instead of the model user’s. We contacted four respondents by email to confirm information where the variation in responses could not be resolved using the aforementioned methods.
We categorized models into the three main model types discussed in Section 2—bottom-up, top-down, and hybrid, in order to examine the general trends in how they incorporate each of the seven characteristics. We used model description answers from the first part of the survey to assign models to either of the three categories. Specifically, macroeconomic top-down models included models described as “input-output” and “computable general equilibrium;” technological bottom-up models were described as “simulation,” “optimization,” “linear programming,” or “technology adoption;” and hybrid models included “hybrid” and “system dynamics” descriptors. We confirmed this model classification with past literature into these models [15,57,58], though we acknowledge that some models may not be completely attributed to just one category. The integrated assessment model EC-IAM was included in the top-down category due to its focus on the explicit representation of macroeconomic characteristics.
We received one response for a macroeconomic model The Infometrica Model (TIM), but we did not analyze it as a stand-alone model because it does not meet the definition of an energy-economy model in Section 1. TIM represents as a sub-component of the E3MC model, composed of TIM and ENERGY 2020; therefore, we analyzed TIM as part of the entire E3MC model. Similarly, the Integrated Electricity Supply and Demand (IESD) model was not analyzed separately—it is used in conjunction with gTech to provide increased detail in the electricity sector so we considered its characteristics in the analysis of gTech [9]. As a result of merging the models, we analyzed the survey data for 17 models, not 19 as identified by respondents.
We analyzed responses using descriptive statistics to calculate frequencies in multiple-choice questions. The open-ended responses were manually scanned and analyzed to identify common themes to support and further explain multiple-choice responses. When respondents provided answers that did not align with the definition of a question, we reassigned the response to a more suitable section of the analysis. Where a model was described by only one respondent, we treated the “I don’t know” responses as missing values. We used matrix tables (see Appendix B) to summarize our assessments for each model against the seven characteristics from Section 3. Some of the details from the open-ended responses were also included in the assessment matrices to enhance the comparative analysis of models.

5. Results

The surveyed energy-economy models are primarily owned by public organizations (8 models), followed by private companies (7 models), and non-for-profit groups (2 models) in Canada (Table 1). These models use a diverse set of analytical approaches. A hybrid approach was the most common approach, employed by eight models: CIMS, CIMS-Urban, E3MC, ENERGY 2020, Energy Policy Simulator, GCAM, gTech, and NATEM-TIMES. A bottom-up approach was the next most common approach, employed by CanESS, CityInSight, LEAP, MEDEE, MESSAGE, and REPAC. A top-down approach was found only in three models: EC-PRO, EC-MSMR, and EC-IAM.
Models’ simulation periods range from a sub-annual time period to every 10 years, with a select group of models having the ability to simulate multiple time periods (i.e., GCAM, LEAP, MESSAGE, NATEM-TIMES). The most common simulation period is every year or every 5 years. Fewer models use a simulation period of every 10 years (two models) or more often than at an annual basis (three models). Models vary in their simulation timeframes with almost three-quarters of models running to 2050. A smaller portion of models run to 2030 and 2100. The respondents for six models—CIMS, CIMS-Urban, CityInSight, EC-MSMR, gTech, and LEAP, indicated they can be run to multiple dates in the future.
There is a wide range of jurisdictional applications of models, from cities all the way up to an international level, depending on models’ specific objectives. Three-quarters of models can be used in multiple jurisdictions with the provincial/territorial level being the most common application (observed in twelve models), followed by a national application (nine models). Fewer models can be applied to regional and municipal scales as well as the broad international jurisdiction (five to six models).
About half of the models represent multiple economic sectors at once ranging from buildings, to waste, transport, industry, electricity, and land use. The least represented economic sector is land use with six models excluding this sector. A few models include additional sectors, such as agriculture (i.e., CIMS, MEDEE) and the forest sector (i.e., NATEM-TIMES). The transportation sector is the only sector to be included in all surveyed models.
The following sub-sections describe the surveyed models against the seven characteristics from Section 3.

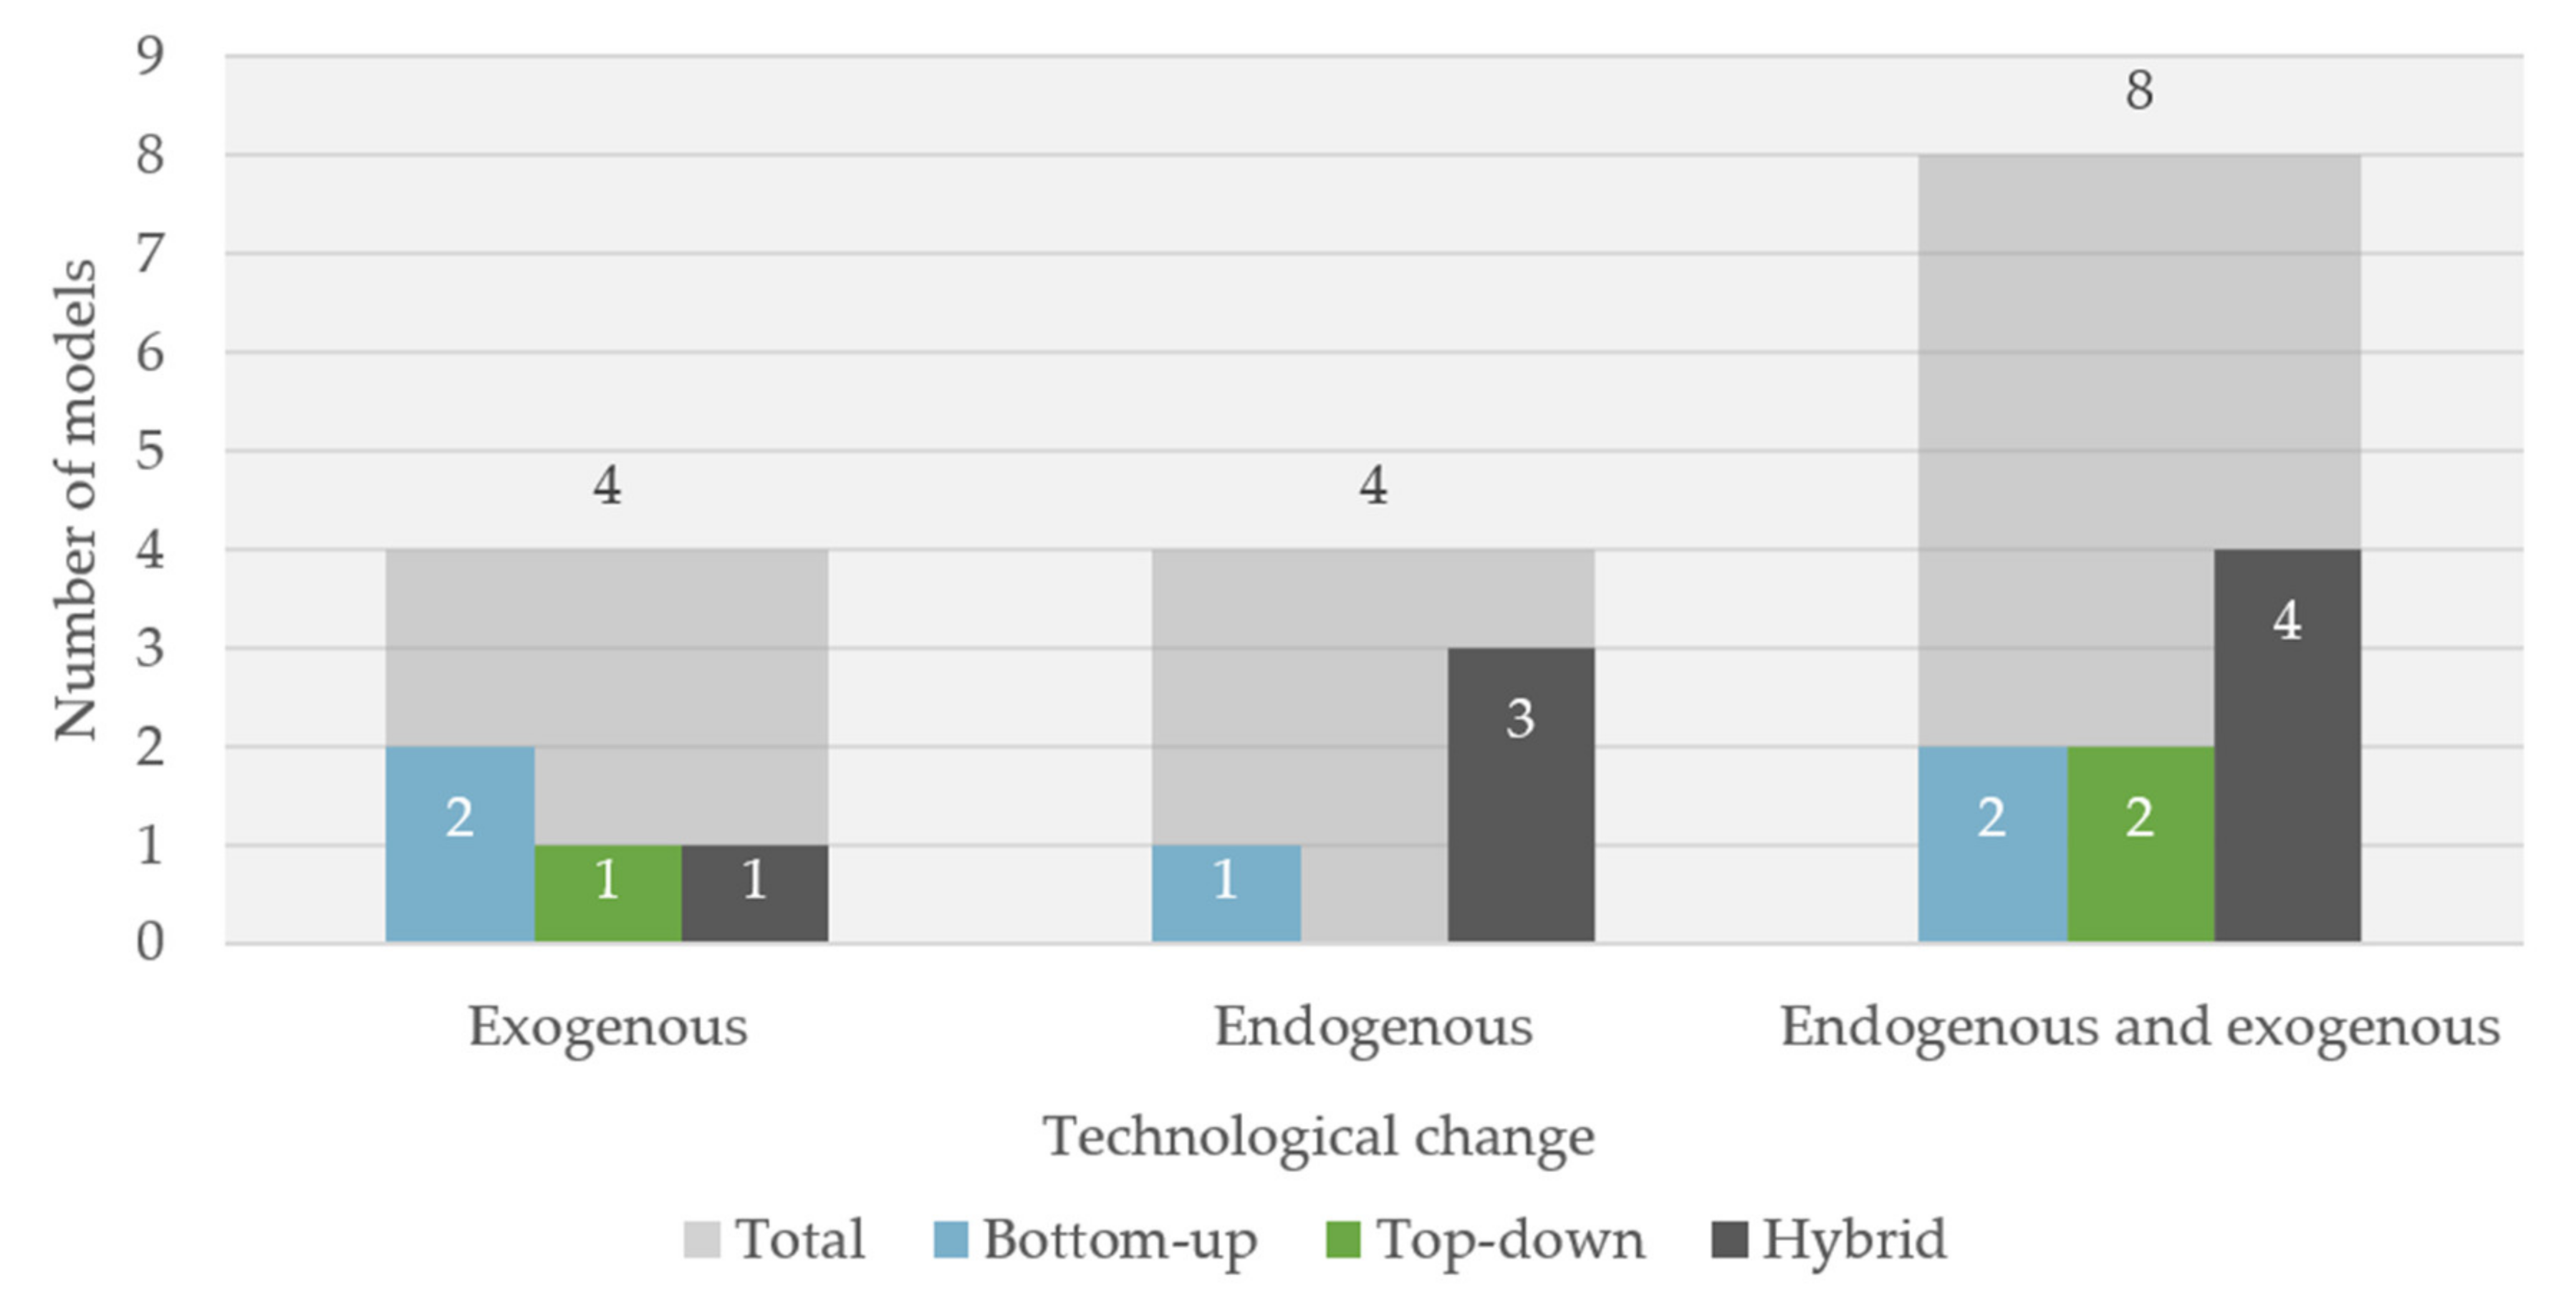
5.1. Treatment of Technologies and Technological Change

All of the surveyed models explicitly represent technologies (Table A1 in Appendix B). Seven models explicitly represent both backstop and near-commercial technologies: GCAM, CIMS, EC-IAM, EC-PRO, EC-MSMR, Energy Policy Simulator, and MESSAGE. Over half of the models explicitly represent technologies in certain sectors, with the rest explicitly representing technologies in all sectors. The number of represented technologies ranges from five (i.e., REPAC) to thousands (e.g., CIMS, NATEM-TIMES). Backstop technologies exist in only seven models and include carbon capture and storage (i.e., CIMS, Energy Policy Simulator, GCAM), direct air capture (i.e., CIMS, Energy Policy Simulator), and biomass/bioliquids (i.e., GCAM).
With the exception of MEDEE, all of the models represent at least one near-commercial technology. Near-commercial technologies are technologies that are used in a limited way and require some further development to achieve widespread adoption. Of the near-commercial technologies surveyed, hydrogen fuel cell vehicles are the most common, being represented in fifteen models. Other near-commercial technologies that were represented in the surveyed models include carbon capture and storage, electrolysis-based hydrogen production, and direct air capture. Finally, the majority of models (i.e., 14 models) represent first- and/or second-generation biofuels, with 10 models representing both categories of biofuels.
Almost all models include representations of technological change, declining capital costs, and annual operating costs. Models most commonly represent technological change using both exogenous and endogenous methods depending on technology types (Figure 1). All three model types—bottom-up (i.e., LEAP, MEDEE), top-down (i.e., EC-PRO, EC-MSMR), and hybrid (i.e., E3MC, ENERGY 2020, Energy Policy Simulator, NATEM-TIMES), use this method. The models that represent technological change exogenously consist of mostly bottom-up (i.e., CanESS, CityInSight) and top-down (i.e., EC-IAM) approaches, while models that represented it endogenously mostly use a hybrid approach (i.e., CIMS, CIMS-Urban, gTech).
The large majority of models (i.e., 16 models) include declining capital costs in their representation of technologies. Only one model, MEDEE, does not include declining capital cost functions. Finally, fuel and maintenance costs are included as annual operating costs in almost all surveyed models.

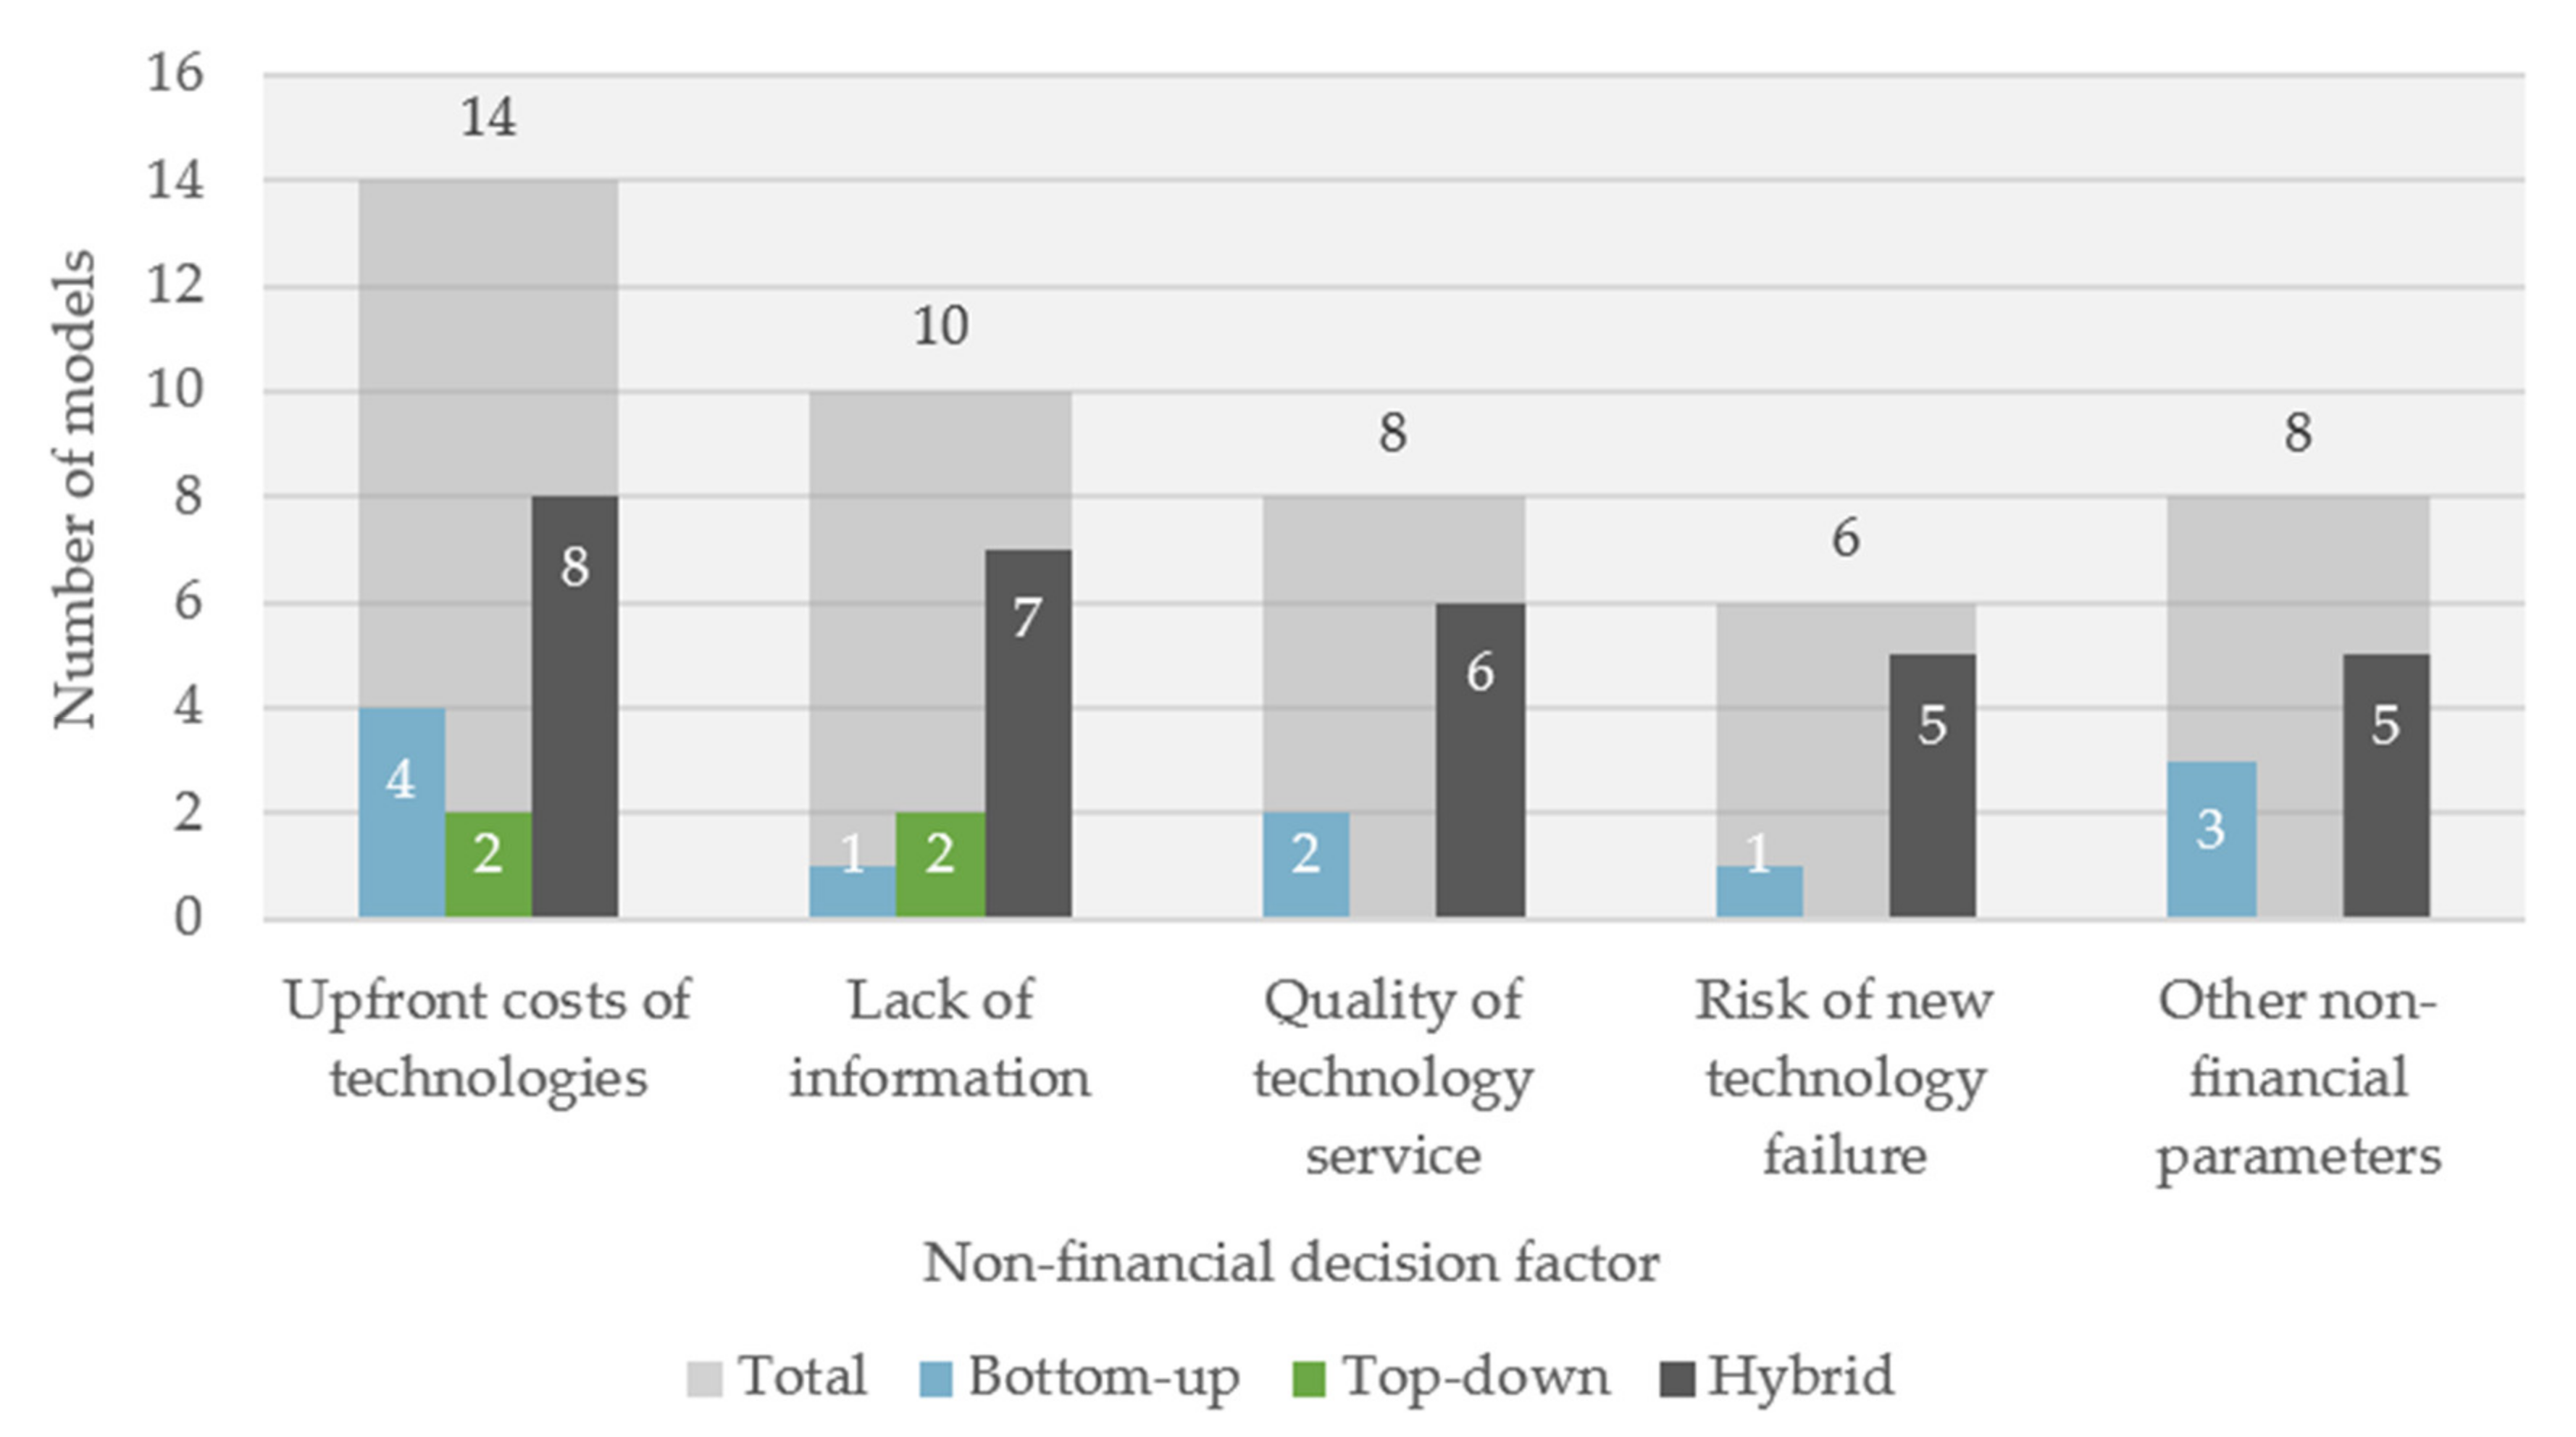
5.2. Representation of Microeconomic Characteristics

With the exception of CanESS and CityInSight, all models include some level of microeconomic characteristics (Table A2 in Appendix B). Only a few models represent a full range of microeconomic characteristics including upfront costs, lack of information, varying quality of technology service, risk of new technology failure, and other non-financial characteristics—these tend to be hybrid models including CIMS, CIMS-Urban, E3MC, and gTech (Figure 2). Models address market heterogeneity through several methods including choice methods (i.e., E3MC, ENERGY 2020, Energy Policy Simulator, REPAC) and behavioral parameters (i.e., CIMS, CIMS-Urban). The models that do not address market heterogeneity are bottom-up models.
The same models that address market heterogeneity also include at least one non-financial cost parameter. The most common parameters are upfront costs of technologies and associated discount rates, with fourteen models including these parameters. Of those fourteen models, the majority represent this parameter by disaggregating technologies and representing the non-financial upfront costs of each technology.
Characteristics that represent the lack of technology information, varying quality of technology service, and risk of technology failure are included less frequently than non-financial upfront costs of technologies. The models that include these characteristics are often of a hybrid nature (e.g., CIMS, E3MC, gTech). Just over half of models acknowledge that firms and consumers do not have complete information about all technologies with the vast majority of those models representing this characteristic explicitly. The quality of technology service is addressed in eight models and the risk of new technology failure in six. Almost half of the models contain additional non-financial decision-making characteristics including technology availability (i.e., REPAC) and externality values of pollution (i.e., LEAP).

5.3. Representation of Macroeconomic Characteristics

The majority of surveyed models (i.e., 12 models) incorporate macroeconomic characteristics to some degree to represent the structural systematic relationships of a region’s economy (Table A3 in Appendix B). These models are almost all hybrid or top-down models due to their parameterization through historical macroeconomic data (Figure 3). The models EC-IAM, EC-PRO, EC-MSMR, gTech, and NATEM-TIMES include all the surveyed macroeconomic characteristics of full and/or partial equilibrium methods, supply–demand balance both energy and non-energy commodities and represent the electric grid. Five bottom-up models that do not represent the macroeconomy include CanESS, CIMS-Urban, CityInSight, MEDEE, and REPAC. Of the twelve models that incorporate macroeconomic characteristics, seven models use partial equilibrium methods and five full equilibrium methods. Full-equilibrium models are typically more of a top-down (i.e., EC-IAM, EC-PRO, EC-MSMR) or hybrid (i.e., gTech) nature.
Most models represent the supply–demand balance of energy commodities through price-quantity adjustments, with fewer models balancing non-energy commodities. Of these models, six (i.e., EC-IAM, EC-PRO, EC-MSMR, GCAM, gTech, NATEM-TIMES) balance both energy and non-energy commodities and two (i.e., Energy Policy Simulator, MESSAGE) partially balance both energy and non-energy commodities. The six models that balance both energy and non-energy commodities are top-down (i.e., EC-PRO, EC-IAM, EC-MSMR) or hybrid models (i.e., GCAM, gTech, NATEM-TIMES). E3MC is the only model that balances energy commodities, but not non-energy commodities. Two-thirds of the surveyed models include a representation of regional electric grids (i.e., E3MC, EC-IAM, EC-PRO, EC-MSMR, ENERGY 2020, gTech, LEAP, NATEM-TIMES). These are mostly full-equilibrium top-down or hybrid models.
The incorporation of trade effects is found in almost all the models that represent macroeconomic characteristics, while the representation of the monetary and financial sectors was rare. gTech is the only model found to represent inter-regional and international trade as well as the monetary and finance sectors. Of the nine models that incorporate trade effects, inter-regional trade is represented endogenously in eight models and exogenously in one model, LEAP. Similarly, international trade is represented by more models endogenously than exogenously (i.e., LEAP, NATEM-TIMES). The Energy Policy Simulator is the only model, among those that represent the macroeconomy, to not include trade effects. Overall, the monetary and finance sectors have little representation in the models surveyed, with only two hybrid models, Energy Policy Simulator and gTech, incorporating these sectors.

5.4. Representation of Policies and Policy Interactions

All models except for CanESS and CityInSight are able to represent at least one policy type, with almost all hybrid or top-down models having the ability to represent all tested policy types (i.e., EC-IAM, EC-PRO, EC-MSMR, Energy Policy Simulator, gTech, LEAP, and NATEM-TIMES) (Table A4 in Appendix B). The most represented policy types across all models are the carbon tax and prescriptive regulations, found in 15 models. This is followed by subsidies (14 models), performance standards (13 models), cap-and-trade as well as hybrid carbon pricing (13 models), recycling carbon revenue (12 models), government procurement (10 models), and research and development (7 models) (Figure 4).
Most models that explicitly represent carbon pricing (i.e., carbon tax, cap-and-trade and a combination of thereof) are hybrid or top-down. Of the models that represent a carbon tax, all but one model (MEDEE) simulates this policy explicitly. These models can also simulate the recycling of carbon revenue. Cap-and-trade is represented by fewer models than a carbon tax, with most models simulating it explicitly and two models implicitly (i.e., Energy Policy Simulator, MEDEE). The same models can simulate hybrid carbon pricing due to their ability to represent cap-and-trade policy mechanisms.
The representation of prescriptive regulations mirrors the results for the carbon tax with most models representing this policy type and MEDEE being the only model representing prescriptive regulations implicitly. The majority of models represent subsidies and do so explicitly. Performance standard policies are represented 13 models, with 12 of those models representing this policy explicitly. The models that do not represent either prescriptive regulations or performance standards are bottom-up models. Models vary in their representation of government procurement and investment with half of them representing it explicitly and one model implicitly (i.e., Energy Policy Simulator). Investment in research and development is the least-represented policy, with only seven models having the ability to simulate it. Five of these models simulate it explicitly (i.e., EC-IAM, EC-PRO, EC-MSMR, LEAP, NATEM-TIMES) and fall under the top-down or hybrid model category—these models are mostly used by Canada’s federal government.
Regardless of model type, the majority of models (i.e., 14 models) explicitly consider the interactions between multiple climate policies. However, not all models that consider these interactions also avoid double-counting emissions from multiple climate policies. The model E3MC implicitly represents both of these sub-characteristics.

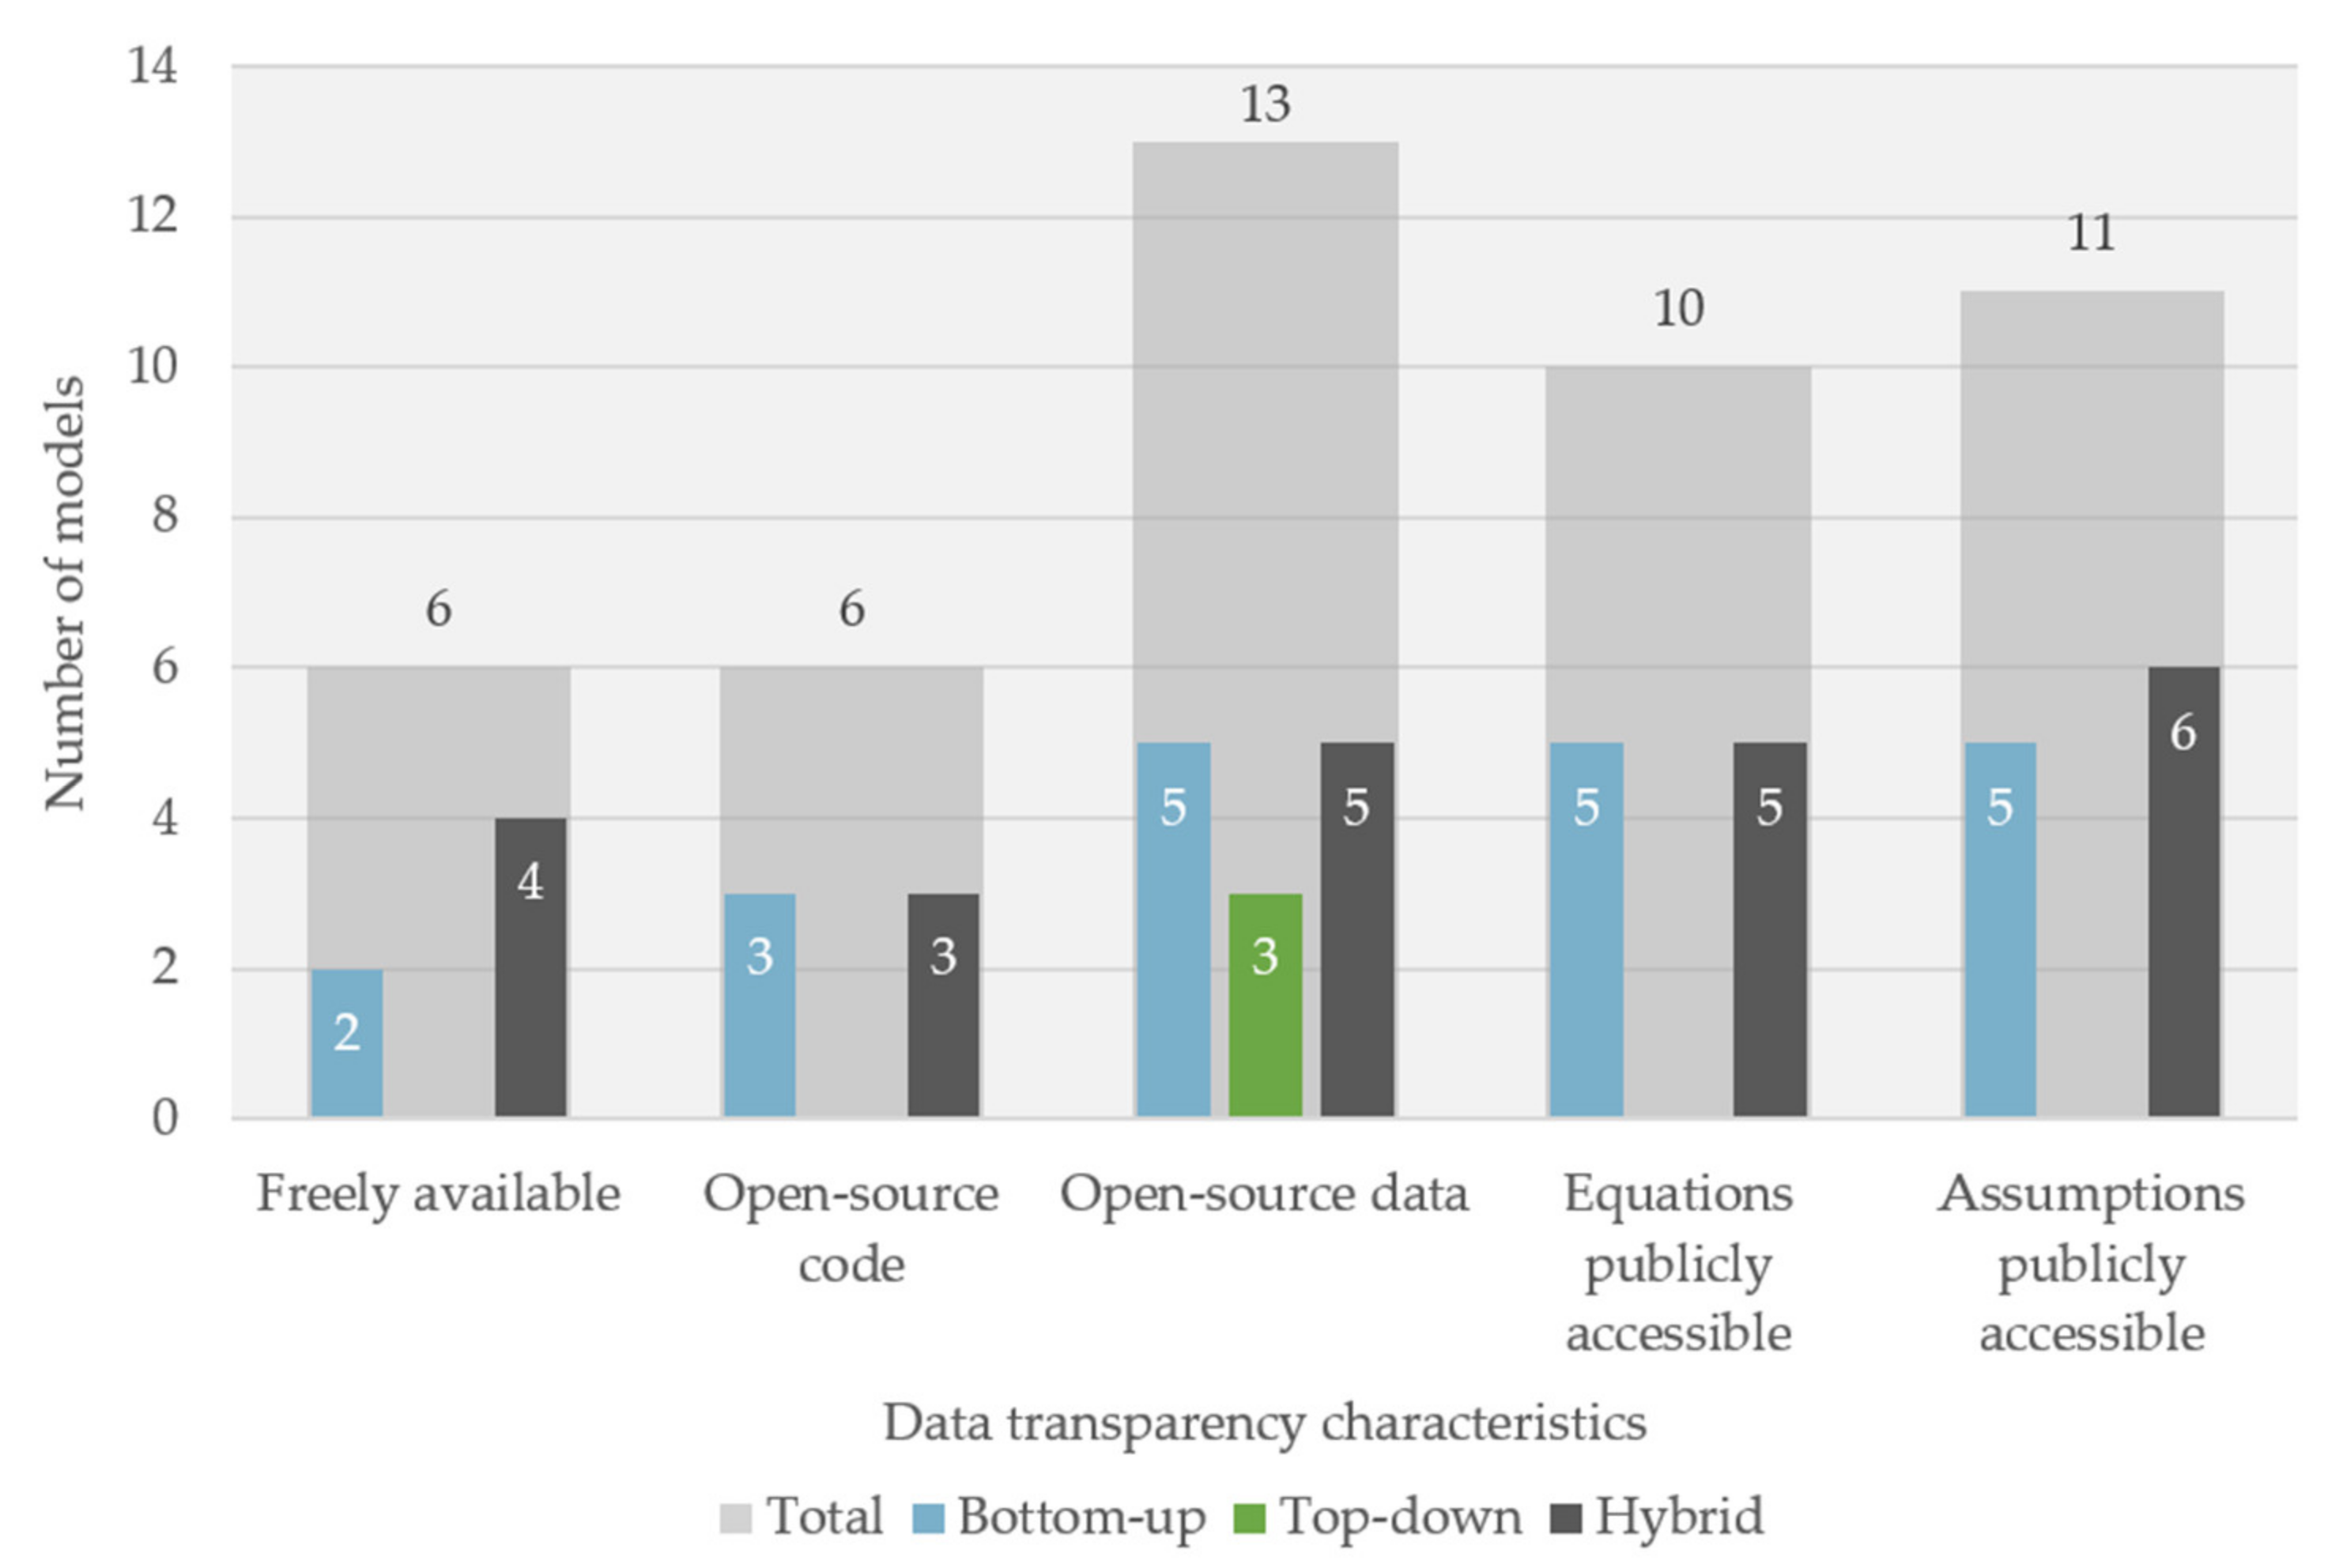
5.5. Other Characteristics and Data Management

Uncertainty is explored in all models with sensitivity analysis being used in all surveyed models, a Monte Carlo analysis in seven models, and other methods being employed in four models (Table A5 in Appendix B). Just over half of model users employ two or more methods to explore uncertainty. The use of a Monte Carlo analysis and/or other methods to explore uncertainty is most often found in hybrid models. Economic growth and energy prices are the most common characteristics explored through uncertainty analyses. The model NATEM-TIMES is the only model found to not explore either of these characteristics through uncertainty analysis. In addition, many models explored uncertainty in other parameters including technology-related parameters (i.e., CanESS, CityInSight, E3MC, gTech, NATEM-TIMES, REPAC) and intangible costs (i.e., CIMS, CIMS-Urban).
High-resolution spatial and/or temporal representations are included in only eight models, with more models including high-resolution temporal representations compared to high-resolution spatial representations. The four models that include high-resolution spatial characteristics represent explicit geographic blocks (i.e., CIMS-Urban, CityInSight, LEAP) and water-related infrastructure (i.e., MESSAGE). Most of the models that include high-resolution spatial or temporal representations are bottom-up.
In terms of data management, most models (i.e., 11 models) are not freely available for public use and do not have open-source code—these models are most often run by governments or private organizations (Figure 5). However, models are more likely to be transparent in their use of open-source data inputs and have at least some of their modelling equations and assumptions publicly accessible. Of the six models that are freely available for public use two are from academic institutions (i.e., CIMS, CIMS-Urban) and four from non-profit organizations (i.e., Energy Policy Simulator, GCAM, LEAP, MESSAGE). Only five models (i.e., CIMS, CIMS-Urban, GCAM, LEAP, MESSAGE) are both freely available and use open-source code. In contrast, 13 models include at least some open-source data with certain inputs to the model being from publicly available sources such as Statistics Canada, Environment and Climate Change Canada, and Natural Resources Canada. Most models include a mixture of data from publicly available sources and confidential ones. More than half of the models have at least some of their modelling equations and assumptions documented in a publicly accessible manner. While some models do not have the equations and/or assumptions publicly available currently, several respondents indicated they are in the process of or plan to open source this information (i.e., CityInSight, NATEM-TIMES).
Related to data management, we asked all respondents to indicate how often each of the core model characteristics is updated (Table A6 in Appendix B). For each characteristic, the most common update timeframe is every year, followed by every 2–5 years for all characteristics except for macroeconomic details. Some models such as GCAM and gTech have more than one update timeframe due to different model end-users (e.g., clients and/or policy-makers) choosing to update at different times.

6. Discussion and Conclusions

6.1. Conclusions

Energy-economy models are important tools that aid governments at all levels in developing climate policies by assessing their effects on GHG emissions and economic outcomes [12]. Energy-economy models provide policy-makers with different types of information relevant to their specific policy questions ranging from the most effective pathways to reduce emissions to their associated abatement costs, distributional impacts, changes to jobs and economic activity levels [9,10,11]. This study represents the first attempt in a Canadian context to compare energy-economy models against seven assessment characteristics to help policy-makers answer these important questions.
Our web-based survey of energy-economy model developers and users in Canada identifies 17 distinct models, representative of the energy-economy models used across public, private, and non-profit sectors [15]. Most of these models can be described as hybrid (i.e., CIMS, CIMS-Urban, E3MC, ENERGY 2020, Energy Policy Simulator, GCAM, gTech, and NATEM-TIMES), followed by bottom-up (i.e., CanESS, CityInSight, LEAP, MEDEE, MESSAGE, REPAC), and top-down models (i.e., EC-PRO, EC-MSMR, EC-IAM). While the study focuses on models that are used in Canada, most energy-economy modelling methodologies are universal and some of the reviewed models (i.e., Energy Policy Simulator, GCAM, LEAP, MESSAGE, and NATEM) are in fact developed and also used outside of Canada, making the study’s results applicable to other jurisdictions [12,20,22]. We compare all models against seven assessment characteristics generally considered important in literature for projecting climate policy effects on GHG emissions and economic outcomes. These characteristics include technology representations, microeconomic and macroeconomic details, policy representations, treatment of uncertainty, high-resolution spatial and temporal representations, and data transparency.
For the most part, models represent technology, micro-, and macroeconomic characteristics according to the typology of top-down, bottom-up, and hybrid models, validating past modelling reviews in Canada [6,21] and worldwide [12,20,22]. In line with past literature, the surveyed top-down (e.g., EC-PRO, EC-MSMR) and hybrid (e.g., NATEM-TIMES, gTech) models include microeconomic (behavioral) and macroeconomic characteristics [6,20]. Bottom-up models (e.g., REPAC, MEDEE) explicitly represent technological characteristics, while excluding or poorly representing macroeconomic details [21,24]. However, the survey data suggest that models have evolved in several ways due to a growing variety and complexity of different policy tools used in climate policy mixes [59]. Some top-down models have evolved to include explicit representations of technologies in order to model technology-specific policies, while some bottom-up models have started to incorporate market heterogeneity and behavioral preferences to produce more realistic simulations.
Our study expands the three-characteristic based model typology [20] to include additional four characteristics of policy representations, treatment of uncertainty, high-resolution spatial and temporal representations, and data transparency. We find that while bottom-up models can simulate a carbon tax and prescriptive regulations, they do not generally represent macroeconomic policy mechanisms, such as the recycling of carbon revenues, adequately. Model users do address uncertainty, though often only through a sensitivity analysis. Bottom-up models are more likely than other models to include high-resolution spatial and/or temporal representations due to their explicit technological characteristics. In contrast, most hybrid and all top-down models can simulate the tested policy types due to a combination of explicit technology representations (to varying degrees in top-down models) and the incorporation of macroeconomic feedbacks [23]. Similar to bottom-up models, top-down models generally address uncertainty through a sensitivity analysis, while hybrid models almost always use other methods in combination with the sensitivity analysis, including Monte Carlo analysis. Top-down models lack the inclusion of high-resolution spatial and temporal representations due to their aggregated approach, while a small number of hybrid models include these representations. Differences in data transparency could not be attributed to model type, but rather to the organization type that uses and/or develops the model.

6.2. Limitations and Contributions

There are several limitations to this analysis. First, there are potential biases that might have impacted survey responses. Because many respondents are model developers, they have a vested interest in promoting their model(s) and answering the survey questions in a way that reflects positively on their model and its assumptions. All respondents might have also been influenced by a social desirability bias whereby the capacity of the model or degree that characteristics are represented may have been overemphasized (e.g., several answers included “yes” and “explicitly” but failed to explain how exactly a characteristic was represented). In addition, the findings might have been affected by the varying levels of knowledge between model users and developers who completed the survey. For example, model users were more likely to choose the answer “I don’t know” or not answer an open-ended portion of the question, and sometimes provided a conflicting answer about the same model that was described by a model developer. Therefore, model assessments should be interpreted as a static form of self-reported knowledge from model users and developers in Canada, consistent with the goal of the study to collect and review the most recent and at times publicly unavailable information about energy-economy models. Future research could conduct external validations of models against each assessment characteristic.
Second, this study used a convenience sampling method to recruit energy-economy model ‘experts’ in Canada as identified by Rhodes et al. [15] in their scoping literature review. This methodology might have limited the sample size potentially affecting the representation of the full model landscape in Canada. Finally, we chose the seven assessment characteristics using past literature on their general importance for modelling economic and GHG emission impacts of climate policy [15,20,32,44]. We did not test a specific conceptual framework and therefore did not conduct inferential analyses to suggest that some of these characteristics are more or less significant in influencing the quality of climate policy projections. Future research can employ a standard set of assumptions and climate policy scenarios to run different models and compare differences in results, in order to identify the relative importance of the seven assessment characteristics.
Despite these limitations, this study offers important contributions to the existing body of modelling literature and climate policy-making. The comprehensive model assessment matrices in Appendix B help update past modelling reviews in and outside of Canada [12,20,21,22] and provide novel model information that is not otherwise publicly available, enabling more systematic comparisons of model strengths and gaps. Researchers and policy-makers can refer to the matrix tables when choosing a suitable model for their specific research or policy question. No model is ideal for every policy question, but rather certain models or model types are better suited to answer certain questions than others. All surveyed models seem to explicitly represent some technologies making them suitable to answer technology-specific policy questions. The high-resolution temporal representations in many bottom-up models (e.g., CanESS, LEAP) can further represent the fluctuations in renewable energy technologies caused by changing weather conditions. The evolution of explicit technology representations in all model types could reflect the fact that technology-specific policies such as subsidies and regulations are often preferred by policy-makers due to their higher political acceptability [14]. Almost all models are able to simulate carbon pricing; however, hybrid or top-down models (e.g., gTech or EC-PRO) would be more suited to represent this policy type due to their incorporation of macroeconomic feedbacks and the ability to represent carbon revenue recycling. All top-down and hybrid models (e.g., EC-IAM, GCAM, NATEM-TIMES) can simulate a variety of prescriptive regulations, performance standards, and subsidies, due to their incorporation of strengths of bottom-up and top-down methodologies. When developing climate policies at the municipal scale, using models that incorporate high-resolution spatial representation (e.g., CIMS-Urban, CityInSight) can help account for the non-spatial uniformity of land-use policies. Other implications of each model characteristic for climate policy projections are discussed in the section below.

6.3. Implications for Climate Policy Projections

Our study has several practical implications for researchers and policy-makers. First, all models explicitly represent technologies and technological change. This explicit representation strengthens the evidence base of policies [34] and allows them to make better predictions of future energy demands [60]. While all models represent technological change, the diverse methods of modelling technological change can produce different results. Models that use endogenous technological change can respond to socio-economic factors in addition to the passage of time. Therefore, the projected cost of abatement in these models can be considerably lower than projections from models that use exogenous technological change [24].
Second, most models represent at least one microeconomic characteristic such as market heterogeneity and non-financial costs, which helps produce more behaviorally realistic projections [6]. However, the most frequent and often the only microeconomic characteristic is upfront costs of technologies. The lack of other characteristics (e.g., imperfect information, quality of technology service, and risk of technology failure) in modelling methodologies implies that many real-life behaviors are likely to be ignored in climate policy projections resulting in underestimated mitigation costs and overly optimistic GHG reductions [14,34].
Third, while some top-down and hybrid models may not represent microeconomic characteristics, their inclusion of macroeconomic characteristics allows policy-makers to understand the economic costs and benefits of a policy, including changes to energy prices, economic activity, gross domestic product, job composition, consumption, and investments [42]. These are important impacts to consider given that all governments face multiple and sometimes conflicting socio-economic and environmental objectives [61]. While most models with macroeconomic feedbacks represent trade effects, they lack representation of the financial and monetary sectors potentially ignoring differences in costs of capital for low-carbon technology in different regions [5].
Fourth, some of the most popular policies used by governments, such as performance standards, government procurement, and research and development, are not represented in all the models, decreasing their usefulness for policy-making. These underrepresented policies tend to receive high political support due to implicit abatement costs and associated higher chances of long-term implementation [62,63]. Future modelling improvements should aim to incorporate most policy types as jurisdictions strengthen their climate policy portfolios.
While all models consider the interactions between policies, they do not all avoid double-counting of emission reductions caused by multiple climate policies, leading to potentially overstated GHG reductions. Future research could explore the extent to which different models double-count GHG reductions and assess methodological solutions to overcome the issue in different model types.
Fifth, the incorporation of uncertainty analysis methods in all models allows policy-makers compare a range of modelling projections contributing to more credible and politically acceptable policy decisions [33]. Uncertainty analyses can be particularly useful to policy-makers when estimating the world’s transition out of the COVID-19 pandemic.
Sixth, high-resolution spatial and/or temporal representations are rarely incorporated in the surveyed models. This lack of spatial representations may impact the effectiveness of local-scale climate policy development regarding land-use issues, while the lack of temporal representations can affect projections concerned with electricity and renewable energy demand.
Finally, the observed lack of transparency in model data and assumptions/equations is one of the biggest concerns deserving academic and policy-making attention. Non-transparent models can raise credibility questions, especially if their results are used to inform public policy decisions. Without transparent and open access data, model results cannot be effectively reproduced and the implications of a policy scenario may not be fully understood and trusted [27]. The movement towards more transparent and open access data can advance the accuracy of modelling results and lead to more informed and effective climate policy decisions [53]. One example of such movement in Canada is the Energy Modelling Initiative, which aims to provide open access tools and bridge the gap between model developers and users, similar to an Energy Modelling Forum in the United States [8,64]. Future research could explore governance mechanisms to amplify and sustain modelling transparency efforts.

Author Contributions

Conceptualization, E.R. and M.M.; methodology, E.R.; formal analysis, K.C. and E.R.; investigation, E.R., K.C., and A.H.; writing—original draft preparation, E.R. and K.C.; writing—review and editing, A.H. and M.M.; visualization, E.R. and K.C.; supervision, E.R.; project administration, E.R.; funding acquisition, E.R. and M.M. All authors have read and agreed to the published version of the manuscript.

Funding

The study was funded by the Social Sciences and Humanities Research Council (SSHRC) Knowledge Synthesis Grant #872-2019-1002 awarded in 2020.

Data Availability Statement

The data presented in this study are openly available in MendeleyData at doi:10.17632/mxctpp43n9.1 [65].

Acknowledgments

We gratefully acknowledge the support of our SSHRC grant collaborator, Glasha Obrekht (Environment and Climate Change Canada, Government of Canada), who contributed to the development of the research idea and survey design.

Conflicts of Interest

The authors declare no conflict of interest. The funders had no role in the design of the study; in the collection, analyses, or interpretation of data; in the writing of the manuscript, or in the decision to publish the results.

Appendix A. Survey Questionnaire “A Review of Energy-Economy Models in Canada”

  • Your Information
    1.1.
    Personal information
    • Prefix/Title____________________
    • First Name____________________
    • Last Name____________________
    • Job Title/Position____________________
    • Division/Department/Program____________________
    • Organization____________________
    • City/Province____________________
    • Email____________________
    1.2.
    What is the type of organization(s) you are associated with?
    • Academia
    • Government
    • Industry
    • Utility
    • Consultant
    • NGO
    • Other. Please specify____________________
    1.3.
    How many energy-economy models (i.e., a model that examines the linkages between all energy sectors and the economy of a region) do you use/run in your line of work? If you use more than one model you will be asked to fill out the survey for each model.
    • 1
    • 2
    • 3
    • 4
    • 5
    • More than 5
    (For each model identified the following questions were asked)
  • Model Information
    2.1.
    Please provide the following information for the first model:
    • Model name____________________
    • Owner/Operator____________________
    2.2.
    What type of model is it?
    • Optimization/linear programming
    • Input-output
    • Computable general equilibrium (CGE)
    • Hybrid
    • Integrated assessment
    • System dynamics
    • Other. Please specify ____________________
    2.3.
    What is the simulation period of the model? Please select all that apply.
    • Every year
    • Every 5 years
    • Every 10 years
    • Other. Please specify ____________________
    2.4.
    How far into the future can the model be run? Please select all that apply.
    • 2030
    • 2050
    • 2100
    • Other. Please specify ____________________
    2.5.
    What is the jurisdictional application of the model? Please select all that apply.
    • Municipal
    • Regional
    • Provincial
    • National
    • Other. Please specify ____________________
    2.6.
    What economic sectors are included in the model? Please select all that apply.
    • Buildings
    • Waste
    • Transportation
    • Industry
    • Electricity
    • Land use
    • I don’t know/I prefer not to answer
    • Other. Please specify ____________________
3.
Treatment of Technology
Treatment of technology refers to the level of resolution to which a model represents technological information, and how technological dynamics are captured.
3.1.
Does the model explicitly represent technologies (e.g., their costs, availability, energy efficiency, and fuel compatibility)?
  • Yes
  • No (if selected, the survey will skip to question 4.1)
  • I don’t know/I prefer not to say
3.2.
What are the sectors where technologies are explicitly represented (e.g., their costs, availability, energy efficiency, and fuel compatibility)?
  • All sectors. Please specify the approximate number of technologies _________
  • Certain sectors. Please specify the approximate number of technologies _________
3.3.
If you answered certain sectors, what sectors do explicitly represent technologies? Please select all that apply.
  • Buildings
  • Waste
  • Transportation
  • Industry
  • Electricity
  • Land use
  • Not applicable (model explicitly represents technologies in all sectors)
  • Other. Please specify ____________________
3.4.
Does the model include any backstop technologies? A backstop technology can be represented as an undefined process used to limit abatement costs, or can refer to a particular technology or set of technologies.
  • Yes
  • No
  • I don’t know/I prefer not to say
If you answered yes, please explain which backstop technologies are included in the model. ______________________
The following questions are about the near-commercial technologies represented in the model. Near-commercial technologies are technologies that are used in a limited way and require some further development to achieve widespread adoption.
3.5.
Does the model include direct air capture?
  • Yes
  • No
  • I don’t know/I prefer not to say
3.6.
Does the model include carbon capture and storage?
  • Yes
  • No
  • I don’t know/I prefer not to say
3.7.
Does the model include electrolysis-based hydrogen production?
  • Yes
  • No
  • I don’t know/I prefer not to say
3.8.
Does the model include hydrogen fuel cell vehicles?
  • Yes
  • No
  • I don’t know/I prefer not to say
3.9.
Does the model include first generation biofuels (i.e., derived from food crop sources such as starch, sugar, animal fats, and vegetable oil)?
  • Yes
  • No
  • I don’t know/I prefer not to say
If you answered yes, please explain which first generation biofuels are included in the model. ______________________
3.10.
Does the model include second generation biofuels (i.e., derived from non-food biomass sources such as waste from food crops, agricultural residue, wood chips, and waste cooking oil)?
  • Yes
  • No
  • I don’t know/I prefer not to say
If you answered yes, please explain which second generation biofuels are included in the model. ______________________
3.11.
Are any near-commercial technologies excluded from the model? Near-commercial technologies are technologies that are used in a limited way and require some further development to achieve widespread adoption (e.g., carbon capture and storage, plug-in electric vehicles, hydrogen fuel cells vehicles, heat pumps, solar, and wind).
  • Yes
  • No
  • I don’t know/I prefer not to say
If you answered yes, please explain which near-commercial technologies are excluded from the model. ______________________
3.12.
Is technological change in the model represented as endogenous or exogenous? Technological change is the evolution of capital stocks of energy-related technologies within the economy.
  • Endogenous
  • Exogenous
  • Endogenous and exogenous
  • Not represented
  • I don’t know/I prefer not to say
If you answered endogenous and/or exogenous, please explain how the technological change is represented in the model. ______________________
3.13.
Are technologies represented in the model subject to declining capital costs?
  • Yes
  • No
  • I don’t know/I prefer not to say
If you answered yes, please explain how declining cost are represented in the model. ______________________
3.14.
What annual operating costs are included in the model? Please select all that apply.
  • Fuel
  • Maintenance
  • No operating costs
  • I don’t know/I prefer not to answer
  • Other. Please specify. ______________________
3.15.
How often are most technology parameters updated in the model?
  • Every year
  • Every 2–5 years
  • Every 5–10 years
  • Every 10 years or longer
  • Never
  • I don’t know/I prefer not to say
If certain technology parameters are updated at different times, please explain which parameters and how often. ______________________
4.
Microeconomic Characteristics
Microeconomic characteristics refers to the ability of a model to realistically represent agent behavior within the energy-economy, including the heterogeneity of consumer preferences, and non-financial decision factors.
4.1.
Is market heterogeneity (i.e., differences in how different consumers and producers make choices between technologies) addressed in the model?
  • Yes
  • No
  • I don’t know/I prefer not to say
If you answered yes, please explain how market heterogeneity is addressed in the model. ______________________
4.2.
Is the risk of new technology failure addressed in the model (i.e., that new technologies have higher risk of failure than conventional ones)?
  • Yes
  • No
  • I don’t know/I prefer not to say
If you answered yes, please explain how the risk of new technology is addressed in the model. ______________________
4.3.
Is the quality of technology service addressed in the model (e.g., convenience and comfort associated with driving a personal vehicle versus taking transit)?
  • Yes
  • No
  • I don’t know/I prefer not to say
If you answered yes, please explain how the quality of technology service is addressed in the model. ______________________
4.4.
Is the lack of information (i.e., firms and consumers do not have complete information about all available technologies) addressed in the model?
  • Yes, explicitly (e.g., through model’s parameters)
  • Yes, implicitly (e.g., through past data, proxies)
  • No
  • I don’t know/I prefer not to say
If you answered yes, please explain how the lack of information is addressed in the model. ______________________
4.5.
Are upfront costs (i.e., capital investments) of technologies and associated discount rates represented in the model?
  • Yes, by disaggregating technologies (i.e., explicitly representing the upfront costs of each of the included technologies)
  • Yes, by aggregating production functions (i.e., representing upfront costs by combining related technologies that produce the same output)
  • Yes, other
  • No
  • I don’t know/I prefer not to say
If you answered yes—other, please explain how upfront costs of technologies and associated discount rates are addressed in the model. ______________________
4.6.
Besides the parameters listed above, are there other consumer and firm non-financial decision-making parameters?
  • Yes
  • No
  • I don’t know/I prefer not to say
If you answered yes, please explain any other consumer and form non-financial decision-making parameters included in the model. ______________________
4.7.
How often are most microeconomic/behavioural parameters updated in the model?
  • Every year
  • Every 2–5 years
  • Every 5–10 years
  • Every 10 years or longer
  • Never
  • I don’t know/I prefer not to say
If certain microeconomic/behavioural parameters are updated at different times, please explain which parameters and how often. ______________________
5.
Macroeconomic Characteristics
Macroeconomic characteristics refers to the ability of a model to represent the structural systematic relationships of a region’s economy. This includes feedbacks such as trade, financing, and links between energy supply-demand and the economy’s structure and output.
5.1.
Does the model incorporate macroeconomic characteristics (i.e., represents the structural systematic relationships of a region’s economy)?
  • Yes
  • No (If selected the survey will skip to question 6.1)
  • I don’t know/I prefer not to say
If you answered yes, please explain how macroeconomic characteristics is incorporated in the model. ______________________
5.2.
Does the model use general equilibrium methods to link economic feedbacks in a full equilibrium framework? A full equilibrium framework estimates aggregate relationships between the relative costs and markets shares of energy and other inputs to the economy, and links these estimates to sectoral and economic output.
  • Yes
  • No
  • I don’t know/I prefer not to say
If you answered yes, please explain how the model uses full equilibrium methods to link economic feedbacks in a full equilibrium framework. ______________________
5.3.
Does the model use partial equilibrium methods to partially link major equilibrium feedbacks? Partial equilibrium methods do not simulate the entire economy, but instead only considers a specific part of the market or sector where the economic equilibrium is determined independently from the prices, supply and demand from other markets.
  • Yes
  • No
  • I don’t know/I prefer not to say
  • Not applicable (model uses full equilibrium methods)
If you answered yes, please explain how the model uses partial equilibrium methods to partially link major equilibrium feedbacks. ______________________
5.4.
Are energy commodities supply-demand balanced through price-quantity adjustments? Examples of energy commodities include electricity, refined petroleum products, and/or natural gas.
  • Yes
  • Partially, via own-price elasticities
  • No
  • I don’t know/I prefer not to say
5.5.
Are non-energy commodities supply-demand balanced through price-quantity adjustments? Examples of non-energy commodities include agriculture, metal, and/or livestock.
  • Yes
  • Partially, via own-price elasticities
  • No
  • I don’t know/I prefer not to say
5.6.
Is the electric grid represented in the model (e.g., hourly supply and demand and/or voltage and frequency of the electricity transmission and distribution system by province or other region)
  • Yes
  • No
  • I don’t know/I prefer not to say
If you answered yes, please explain how the electric grid is represented in the model. ______________________
5.7.
Is trade (i.e., the flow of goods and services between regions) represented in the model?
  • Yes
  • No (If selected the survey will skip to question 5.10)
  • I don’t know/I prefer not to say
5.8.
How is inter-regional trade treated within the model bounds?
  • Endogenously
  • Exogenously
  • Other
  • Inter-regional trade is not represented
  • I don’t know/I prefer not to say
If you answered endogenously, exogenously, or other, please explain how inter-regional trade is treated within the model. ______________________
5.9.
How is international trade treated within the model bounds?
  • Endogenously
  • Exogenously
  • Other
  • International trade is not represented
  • I don’t know/I prefer not to say
If you answered endogenously or exogenously or other, please explain how international trade is treated within the model. ______________________
5.10.
Are the monetary and finance sectors represented in the model?
  • Yes
  • No
  • I don’t know/I prefer not to say
If you answered yes, please explain how the monetary and financial sectors are represented in the model. ______________________
5.11.
How often are most macroeconomic parameters updated in the model?
  • Every year
  • Every 2–5 years
  • Every 5–10 years
  • Every 10 years or longer
  • Never
  • I don’t know/I prefer not to say
If certain macroeconomic parameters are updated at different times, please explain which parameters and how often. ______________________
6.
Policy Representation
Policy representation refers to the ability of a model to accurately represent different types of climate policies, whether implemented individually or in combination with each other.
6.1.
Can the model simulate a carbon tax?
  • Yes, implicitly (e.g., through past data, proxies)
  • No
  • I don’t know/I prefer not to say
If you answered explicitly or implicitly, please explain how the model can simulate a carbon tax. ______________________
6.2.
Can the model simulate a cap-and-trade policy?
  • Yes, explicitly (e.g., through model’s parameters)
  • Yes, implicitly (e.g., through past data, proxies)
  • No
  • I don’t know/I prefer not to say
If you answered explicitly or implicitly, please explain how the model can simulate a cap-and-trade policy. ______________________
6.3.
Can the model simulate hybrid carbon pricing policies (e.g., carbon tax and cap-and-trade features combined)?
  • Yes, explicitly (e.g., through model’s parameters)
  • Yes, implicitly (e.g., through past data, proxies)
  • No
  • I don’t know/I prefer not to say
If you answered explicitly or implicitly, please explain how the model can simulate hybrid carbon pricing policies. ______________________
6.4.
Can the model simulate recycling carbon revenue?
  • Yes, explicitly (e.g., through model’s parameters)
  • Yes, implicitly (e.g., through past data, proxies)
  • No
  • I don’t know/I prefer not to say
If you answered explicitly or implicitly, please explain how the model can simulate recycling carbon revenue. ______________________
6.5.
Can the model simulate investment in Research and Development?
  • Yes, explicitly (e.g., through model’s parameters)
  • Yes, implicitly (e.g., through past data, proxies)
  • No
  • I don’t know/I prefer not to say
If you answered explicitly or implicitly, please explain how the model can simulate investment in Research and Development. ______________________
6.6.
Can the model simulate prescriptive regulations, such as an emissions standard and/or a technology mandate?
  • Yes, explicitly (e.g., through model’s parameters)
  • Yes, implicitly (e.g., through past data, proxies)
  • No
  • I don’t know/I prefer not to say
If you answered explicitly or implicitly, please explain how the model can simulate prescriptive regulations. ______________________
6.7.
Can the model simulate performance standards, such a low carbon fuel standard and/or a zero-emissions mandate with market credit trading mechanisms?
  • Yes, explicitly (e.g., through model’s parameters)
  • Yes, implicitly (e.g., through past data, proxies)
  • No
  • I don’t know/I prefer not to say
If you answered explicitly or implicitly, please explain how the model can simulate performance standards. ______________________
6.8.
Can the model simulate subsidies for specific technologies?
  • Yes, explicitly (e.g., through model’s parameters)
  • Yes, implicitly (e.g., through past data, proxies)
  • No
  • I don’t know/I prefer not to say
If you answered explicitly or implicitly, please explain how the model can simulate specific technologies. ______________________
6.9.
Can the model simulate government procurement/investments into low-carbon technologies?
  • Yes, explicitly (e.g., through model’s parameters)
  • Yes, implicitly (e.g., through past data, proxies)
  • No
  • I don’t know/I prefer not to say
If you answered explicitly or implicitly, please explain how the model can simulate government procurement/investments into low-carbon technologies. ______________________
6.10.
Can the model represent multiple climate policies and consider interactions between these different policies?
  • Yes, explicitly (e.g., through model’s parameters)
  • Yes, implicitly (e.g., through past data, proxies)
  • No
  • I don’t know/I prefer not to say
If you answered explicitly or implicitly, please explain how the model can represent multiple climate policies and consider interactions between these different policies. ______________________
6.11.
Does the model avoid double-counting emissions reductions caused by multiple climate policies?
  • Yes, explicitly (e.g., through model’s parameters)
  • Yes, implicitly (e.g., through past data, proxies)
  • No
  • I don’t know/I prefer not to say
If you answered explicitly or implicitly, please explain how the model avoids double-counting emissions reductions caused by multiple climate policies. ______________________
6.12.
How often are policy representation parameters updated in the model?
  • Every year
  • Every 2–5 years
  • Every 5–10 years
  • Every 10 years or longer
  • Never
  • I don’t know/I prefer not to say
If certain policy representation parameters are updated at different times, please explain which parameters and how often. ______________________
7.
Other Modelling Considerations
7.1.
What method(s) does the model use to explore uncertainty? Please select all that apply.
  • Sensitivity analysis
  • Monte Carlo analysis
  • Gaussian process
  • Bayesian model averaging
  • Other methods
  • No methods
  • I don’t know/I prefer not to say
If you answered other methods, please list which method(s) the explore uncertainty are used in the model. ______________________
7.2.
What parameter(s) are most often explored through uncertainty analysis? Please select all that apply.
  • Energy prices
  • Economic growth
  • Other parameters
  • No parameters
  • I don’t know/I prefer not to say
If you answered other parameters, please list which parameter(s) are most often explored through uncertainty analysis. ______________________
7.3.
Is the model freely available for public use?
  • Yes
  • No
  • I don’t know/I prefer not to say
If you answered yes, please provide a link/source where the model is available. ______________________
7.4.
Does the model use open source code?
  • Yes
  • No
  • I don’t know/I prefer not to say
If you answered yes, please explain which code is used in the model. ______________________
7.5.
Does the model use open source data?
  • Yes
  • No
  • I don’t know/I prefer not to say
If you answered yes, please explain how the data is open source. ______________________
7.6.
Are the modelling equations documented in a publicly accessible manner (e.g., user manual)?
  • Yes
  • No
  • I don’t know/I prefer not to say
If you answered yes, please explain how the modelling equations are documented in a publicly accessible manner. ______________________
7.7.
Are the modelling assumptions documented in a publicly accessible manner (e.g., assumption book)?
  • Yes
  • No
  • I don’t know/I prefer not to say
If you answered yes, please explain how the modelling assumptions are documented in a publicly accessible manner. ______________________
7.8.
Does the model include high-resolution spatial representations of any technologies and/or methods (e.g., electric vehicles, hydrogen fuel cells, infrastructure)?
  • Yes
  • No
  • I don’t know/I prefer not to say
If you answered yes, please explain which technologies and/or methods are included and how they are represented in the model. ______________________
7.9.
Does the model include high-resolution temporal representations of any technologies and/or methods (e.g., hourly renewable energy supply)?
  • Yes
  • No
  • I don’t know/I prefer not to say
If you answered yes, please explain which technologies and/or methods are included and how they are represented in the model. ______________________
8.
Final Comments
8.1.
Is there anything else you would like to share about the model not addressed in answers above? ______________________

Appendix B. Energy-Economy Model Comparisons against Assessment Characteristics

Table A1. Representation of technologies and technological change in energy-economy models.
ModelTechnology RepresentationTechnological Change
Explicit TechnologiesBackstop TechnologiesNear-Commercial TechnologiesFirst and Second-Generation BiofuelsTechnological ChangeDeclining Capital CostsAnnual Operating Costs
CanESSCertain sectors—100 technologiesNoIncludes CCS, electrolysis-based hydrogen production (H production), hydrogen fuel cell vehicles (H vehicles)Both first (i.e., ethanol, biodiesel) and second (i.e., renewable diesel)ExogenousYesFuel and maintenance
CIMSAll sectors—1200 technologiesYes—carbon capture and storage (CCS), direct air capture (DAC)Includes DAC, CCS, H production, H vehiclesFirst (i.e., ethanol, biodiesel)EndogenousYesFuel and maintenance
CIMS-UrbanAll sectors—500 technologiesNoIncludes H vehiclesFirst (i.e., ethanol, biodiesel)EndogenousYesFuel and maintenance
CityInSightCertain sectors—50+ technologiesNoIncludes CCS, H production, H vehiclesBoth first and second (i.e., generic biofuel category)ExogenousYesFuel and maintenance
E3MCCertain sectors—79 technologiesNoIncludes CCS, H production, H vehiclesBoth first (i.e., ethanol, biodiesel) and second (i.e., HDRD)Endogenous and exogenousYesFuel and maintenance
EC-IAMAll sectorsYesIncludes DAC, CCS, H production, H vehiclesBoth first and secondExogenousYesFuel and maintenance
EC-PROCertain sectorsYesIncludes DAC, CCS, H production, H vehiclesBoth first and secondEndogenous and exogenousYesFuel and maintenance
EC-MSMRAll sectorsYesIncludes DAC, CCS, H production, H vehiclesBoth first and secondEndogenous and exogenousYesFuel and maintenance
ENERGY 2020Certain sectors—5 and 10 per sectorN/AIncludes CCS, H production, H vehiclesBoth first (i.e., biofuel—corn, wheat, rapeseed) and second Endogenous and exogenousYesFuel and maintenance
Energy Policy SimulatorAll sectors—50 technologiesYes—CCS, DACIncludes DAC, CCS, H production, H vehiclesFirst (i.e., biofuel, generic biomass)Endogenous and exogenousYesFuel and maintenance
GCAMAll sectors—>100 technologies;Yes—CCS and biomass/bioliquidsIncludes DAC, CCS, H production, H vehiclesBoth first and secondExogenousYesFuel and maintenance
gTechCertain sectors—320 technologiesNoIncludes DAC, CCS, H production, H vehiclesFirst (i.e., 3 drop-in fuels compatible with gasoline, diesel, and natural gas)EndogenousYesFuel and maintenance
LEAPAll sectors– user selected number of technologiesNoIncludes DAC, CCS, H production, H vehiclesBoth first and secondEndogenous and exogenousYesFuel and maintenance
MEDEECertain sectors (3)—18 categoriesNoNoNoEndogenous and exogenousNoFuel
MESSAGEAll sectors—approx. 500 technologiesYesIncludes CCSN/AN/AYesFuel and maintenance
NATEM-TIMESCertain sectors—4000-5000 technologiesNoIncludes CCS, H production, H vehiclesBoth first and secondEndogenous and exogenousYesFuel and maintenance
REPACCertain sectors—5 technologiesNoIncludes H vehiclesNoEndogenousYesFuel
N/A stands for “not available,” and represents “I don’t know” survey responses.
Table A2. Representation of market heterogeneity and non-financial decisions factors in energy-economy models.
ModelMarket HeterogeneityNon-Financial Decision Characteristics
Upfront Costs of TechnologiesLack of
Information
Quality of
Technology Service
Risk of New Technology FailureOther Non-Financial Decision-Making Parameters
CanESSNoNoNoNoNoNo
CIMSYes—behavioral parameterYes, by disaggregating technologies (i.e., explicitly representing the upfront costs of each of the included technologies)Explicitly (e.g., through model’s parameters)—intangible cost parameterYes—intangible cost parameterYes—weighted average time preference of decision-makers for a given energy service demand and intangible costs and benefits consumers/firms perceiveYes—represented by the intangible cost parameter
CIMS- UrbanYes—behavioral parameterYes, by disaggregating technologiesExplicitly—intangible cost parameterYes—intangible cost parameterYes—weighted average time preference of decision-makers for a given energy service demand and intangible costs and benefits consumers/firms perceiveYes—represented by the intangible cost parameter
CityInSightNoNoNoNoNoNo
E3MCYes—consumer choice theoryYes, by disaggregating technologiesImplicitly (e.g., through past data, proxies)Yes—historical parametersYes—historical parametersYes—“non-price factor” parameter
EC-IAMYesYes, by disaggregating technologiesExplicitlyNoNoNo
EC-PROYes—constant elasticity of substitution functionYes, by aggregating production functions (i.e., representing upfront costs by combining related technologies that produce the same output)NoNoNoNo
EC-MSMRYesNoExplicitlyNoNoNo
ENERGY 2020Yes—qualitative choice methodsYes, by disaggregating technologiesExplicitly—qualitative choice methodsYesNoN/A
Energy Policy SimulatorYes—choice models, elasticitiesYes, by disaggregating technologiesExplicitly—shadow market pricesNoNoYes
GCAMYesYes, by disaggregating technologiesNoYes (e.g., speed in the transportation sector and time to travel)NoNo
gTechYes—“lifecycle” cost of tech experience as a normal curveYes, by disaggregating technologiesImplicitly—included within intangible costsYes—included within intangible costsYes—included within intangible costsNo
LEAPYesYes, by disaggregating technologiesN/ANoNoYes (e.g., externality values of pollution)
MEDEEYesYes, by disaggregating technologiesNoYes–cost parameterNoYes—non-financial costs in the residential sector about inconvenience of different heating systems
MESSAGEN/AYes, by disaggregating technologiesN/ANoYesN/A
NATEM-TIMESYesYes, by disaggregating technologiesExplicitlyNoYes—parametric scenario analysisYes—exogenous user constraints (e.g., max limit on carbon sequestration, ban on nuclear)
REPACYes—consumer choice modelYes, by disaggregating technologiesExplicitly—based on survey dataYes- consumer choice modelNoYes—technology availability, awareness of technology, access to home charging
N/A stands for “not available,” and represents “I don’t know” survey responses.
Table A3. Representation of macroeconomic characteristics, trade effects, and finance in energy-economy models.
ModelMacroeconomic CharacteristicsTrade Effects and Finance
Macroeconomic Characteristics Full Equilibrium MethodsPartial Equilibrium MethodsEnergy Commodities Supply-Demand BalancedNon-Energy Commodities Supply-Demand BalancedElectric GridTradeInter-Regional tradeInternational TradeMonetary and Finance Sectors
CanESSNoNoNoNoNoNoNoNoNoNo
CIMSYesNoYesYes, through price-quantity adjustmentsPartially, via own-price elasticitiesNoYesEndogenous—inter-regional transfers and net exportsEndogenous—export price elasticitiesNo
CIMS-UrbanNoNoNoNoNoNoNoNoNoNo
CityInSightNoNoNoNoNoNoNoNoNoNo
E3MCYesNoYesYesNoYes—annual/seasonal levelYesEndogenous—electricityEndogenous—energy flow in ENERGY 2020 and non-energy trade in TIMN/A
EC-IAMYesYesYesYesYes, through price-quantity adjustmentsYes—national grids with peak demandsYesEndogenousEndogenousNo
EC-PROYesYesNoYesYesYes—provincial/territorial by generating technologiesYesEndogenousEndogenousNo
EC-MSMRYesYesNoYesYesYes—national/regional level using hourly load curvesYesEndogenous—bilateral trade between countries and regional blocksEndogenousNo
ENERGY 2020YesYesYesYesN/AYesYesN/AN/AN/A
Energy Policy SimulatorYesNoN/APartially, via own-price elasticitiesPartiallyNoNoNoNoYes
GCAMYesN/AYesYesYesNoYesEndogenousEndogenousNo
gTechYesYesNoYesYesYesYesEndogenous—price and quantity used to balance supply and demand between regionsEndogenous—trade with USA is explicit, simplified “rest of world” region tradeYes
LEAPYesNoYesN/AN/AYes—detailed representation of generation and capacity expansion. Times slices can be seasons/
weeks/hours
YesExogenous—only energy flows, not all economic tradeExogenous—only energy flows, not all economic tradeNo
MEDEENoNoNoNoNoNoNoNoNoNo
MESSAGEYesN/ANoPartiallyPartiallyNoYesN/AN/ANo
NATEM-TIMESYesNoYesYesYesYes—interconnections/transmission explicit; distribution system represented by simple and aggregated tech. 16 annual time slicesYesEndogenous—optimizes trade flows of energy between model regionsExogenousNo
REPACNoNoNoNoNoNoNoNoNoNo
N/A stands for “not available,” and represents “I don’t know” survey responses.
Table A4. Representation of policy types and policy interactions in energy-economy models.
ModelPolicy TypesPolicy Interaction
Carbon TaxCap-and-TradeHybrid Carbon PricingRecycling Carbon RevenueResearch and DevelopmentPrescriptive RegulationsPerformance StandardsSubsidiesGovernment Procurement/InvestmentConsider Interactions between Multiple PoliciesAvoid Double-Counting Emissions
CanESSNoNoNoNoNoNoNoNoNoNoNo
CIMSExplicitly (e.g., through model’s parametersExplicitlyExplicitlyExplicitlyNoExplicitlyExplicitlyExplicitlyNoExplicitlyExplicitly
CIMS-UrbanExplicitlyExplicitlyExplicitlyExplicitlyNoExplicitlyExplicitlyExplicitlyNoExplicitlyExplicitly
City
InSight
NoNoNoNoNoNoNoNoNoNoNo
E3MCExplicitlyExplicitlyExplicitlyExplicitlyNoExplicitlyExplicitlyImplicitlyExplicitlyImplicitlyImplicitly
EC-IAMExplicitlyExplicitlyExplicitlyExplicitlyExplicitlyExplicitlyExplicitlyExplicitlyExplicitlyExplicitlyExplicitly
EC-PROExplicitlyExplicitlyExplicitlyExplicitlyExplicitlyExplicitlyExplicitlyExplicitlyExplicitlyExplicitlyExplicitly
EC-MSMRExplicitlyExplicitlyExplicitlyExplicitlyExplicitlyExplicitlyExplicitlyExplicitlyExplicitlyExplicitlyExplicitly
ENERGY 2020ExplicitlyExplicitlyExplicitlyExplicitlyNoExplicitlyExplicitlyExplicitlyExplicitlyExplicitlyExplicitly
Energy Policy SimulatorExplicitlyImplicitlyImplicitlyExplicitlyImplicitlyExplicitlyExplicitlyExplicitlyImplicitlyExplicitlyExplicitly
GCAMExplicitlyExplicitlyExplicitlyExplicitlyNoExplicitlyExplicitlyExplicitlyNoExplicitlyExplicitly
gTechExplicitlyExplicitlyExplicitlyExplicitlyImplicitlyExplicitlyExplicitlyExplicitlyExplicitlyExplicitlyExplicitly
LEAPExplicitlyExplicitlyExplicitlyExplicitlyExplicitlyExplicitlyExplicitlyExplicitlyExplicitlyExplicitlyExplicitly
MEDEEImplicitly (e.g., through past data, proxies)ImplicitlyImplicitlyNoNoImplicitlyImplicitlyImplicitlyNoExplicitlyExplicitly
MESSAGEExplicitlyN/AN/AN/ANoExplicitlyNoN/AExplicitlyExplicitlyExplicitly
NATEM-TIMESExplicitlyExplicitlyExplicitlyExplicitlyExplicitlyExplicitlyExplicitlyExplicitlyExplicitlyExplicitlyExplicitly
REPACExplicitlyNoNoNoN/AExplicitlyN/AExplicitlyNoExplicitlyN/A
N/A stands for “not available,” and represents “I don’t know” survey responses.
Table A5. Treatment of uncertainty, spatial and temporal resolutions.
ModelTreatment of UncertaintyHigh-Resolution RepresentationsData Transparency
Uncertainty MethodsParameters Explored Through UncertaintySpatialTemporalFreely Available for Public UseOpen-Source CodeOpen-Source DataModelling Equations Publicly AccessibleModelling Assumptions Publicly Accessible
CanESSSensitivity analysisEconomic growth, population/ employment projections, electric vehicle penetration rate, retrofit rates and depths, teleworking rates, petroleum extraction volumesNoYes—hourly demand and generation dispatch moduleNoNoYes—model calibration and “default” Business-as- usual (BAU) scenarioYes—some on websiteYes—varies, in some cases assumptions are provided
CIMSSensitivity analysis, Monte Carlo analysisEnergy prices, economic growth, capital and intangible costsNoNoYes—available on requestYesYes—from open sources (e.g., Statistics Canada (StatsCan), Natural Resources Canada (NRCan), ECCC)Yes—in academic publications and reports. Manual under developmentYes—in academic publications and reports. Manual under re-development
CIMS-UrbanSensitivity analysis, Monte Carlo analysisEnergy prices, economic growth, capital and intangible costsYes—linked to a GIS model to account for city policy impactsNoYes—available on requestYesYes—from open sources (e.g., StatsCan, NRCan, ECCC)Yes—in academic publications and reports. Manual under developmentYes—in academic publications and reports. Manual under re-development
CityInSightSensitivity analysisEconomic growth, population/ employment projections, electric vehicle penetration rate, retrofit rates and depths, teleworking ratesYes—city/region subdivided geographically into many zonesNo—a planned featureNo—ambitions for the futureNo—ambitions for the futureYes—some inputs from public sourcesNo—ambitions to open-source the modelNo—ambitions to open-source the model
E3MCSensitivity analysis, HYPERSENSEnergy prices, economic growth, technology improvementNoNoNoNoYes—some inputs from public sourcesYes—manuals on websiteYes—some published in reports and open data tables
EC-IAMSensitivity analysis, Monte Carlo analysisEnergy prices, economic growth, otherNoNoNoNoYes—partiallyNoNo
EC-PROSensitivity analysisEnergy prices, economic growth, otherNoNoNoNoYes—provincial/ territorial Supply-Use TablesNoNo
EC-MSMRSensitivity analysisEnergy prices, economic growth, otherNoNoNoNoYes—some inputs from public sourcesNoNo
ENERGY 2020Sensitivity analysis, Latin-Hypercube samplingEnergy prices, economic growthNoNoNoNoNoYes—model documentation on websiteYes—some published in reports and open data tables
Energy Policy SimulatorSensitivity analysis, Monte Carlo analysisEnergy prices, economic growthNoNoYesNoYes—all data is included and cited in the model is downloadableYes—model guide on websiteYes—online guide on website
GCAMSensitivity analysisEnergy prices, economic growth, otherNoNoYesYesYesYes—poorlyYes
gTechSensitivity analysis, Monte Carlo analysisEnergy prices, economic growth, technology cost/availability of pre-commercial techNoYes—IESD allows for flexible seasonal/ weekly/hourly time slicesNoNoYesNoYes—depends on the client
LEAPSensitivity analysis, Monte Carlo analysis, scenario analysisEnergy prices, economic growth, demographics, policyYes—can model results to user-defined grid-squaresYes—flexible seasonal/ weekly /hourly time slicesYes -free to users in low and lower-middle-income countries and all studentsYes—some code is open source (e.g., NEMO optimization framework)N/A—depends on the model createdYes—LEAP equations on websiteN/A—depends on the model created
MEDEESensitivity analysisEnergy prices, economic growthNoYes—passenger vehicle fleet characteristic on annual basisNoNoNoNoYes—in some reports and working sessions
MESSAGESensitivity analysisEnergy prices, economic growthYes—can represent water-related infrastructure in high resolutionYes—possibility to represent high resolution temporal dataYesYesYes—most data from publicly available databasesYes—model documentation on websiteYes—model documentation on website
NATEM-TIMESSensitivity analysis, Monte Carlo analysis, stochastic modellingEvolution of technology costs, future availability of emerging techNoYes—at the time slice levelNoYesYes—some inputs from public sourcesYes—basic TIMES equations on IEA-ETSAP websiteNo—website under development
REPACSensitivity analysisEnergy prices, tech availability, tech awarenessNoNoNoNoNoNoYes—open access journal article
Table A6. Frequencies of model characteristics’ updates.
ModelModel Characteristics
Technology
Characteristics
Microeconomic
Characteristics
Macroeconomic
Characteristics
Policy Representation Characteristics
CanESSEvery yearNoNoNo
CIMSEvery 2–5 yearsEvery 2–5 yearsEvery 5–10 yearsEvery year
CIMS-UrbanEvery 2–5 yearsEvery 2–5 yearsNoEvery year
CityInSightEvery yearNoNoNo
E3MCEvery 2–5 yearsEvery yearEvery yearEvery year
EC-IAMEvery yearEvery yearEvery yearEvery year
EC-ProEvery yearEvery yearEvery yearEvery year
EC-MSMREvery yearEvery yearEvery yearEvery year
Energy 2020Every 2–5 yearsEvery yearN/AEvery year
Energy Policy SimulatorEvery yearEvery yearEvery yearEvery year
GCAMEvery year; every 5–10 yearsEvery year; every 5–10 yearsEvery 5–10 yearsEvery year, every 2–5 years, every 5–10 years
gTechEvery 2–5 yearsEvery 2–5 years; every 5–10 yearsEvery 2–5 yearsEvery year, every 2–5 years
LEAPEvery 2–5 yearsEvery 2-5 yearsN/AEvery 2–5 years
MEDEEEvery 5–10 yearsEvery yearNoEvery 2–5 years
MESSAGEEvery yearN/AEvery yearEvery year
NATEM-TIMESEvery yearEvery yearEvery yearEvery year
REPACEvery 2–5 yearsN/ANoEvery 2–5 years
N/A stands for “not available,” and represents “I don’t know” survey responses.

References

  1. United Nations Climate Change. Paris Agreement—Status of Ratification. 2020. Available online: https://cop23.unfccc.int/process/the-paris-agreement/status-of-ratification (accessed on 15 November 2020).
  2. United Nations Climate Change. What is the Paris Agreement? 2020. Available online: https://unfccc.int/process-and-meetings/the-paris-agreement/the-paris-agreement (accessed on 15 November 2020).
  3. United Nations Climate Change. Nationally Determined Contributions (NDCs). 2020. Available online: https://unfccc.int/process-and-meetings/the-paris-agreement/nationally-determined-contributions-ndcs/nationally-determined-contributions-ndcs#:~:text=Nationally%20determined%20contributions%20(NDCs)%20are,the%20impacts%20of%20climate%20change (accessed on 15 November 2020).
  4. United Nations Environment Programme. Emissions Gap Report 2019. 2019. Available online: https://wedocs.unep.org/xmlui/bitstream/handle/20.500.11822/34426/EGR20.pdf?sequence=1&isAllowed=y (accessed on 15 November 2020).
  5. Pollitt, H.; Mercure, J.-F. The role of money and the financial sector in energy-economy models used for assessing climate and energy policy. Clim. Policy 2018, 18, 184–197. [Google Scholar] [CrossRef] [Green Version]
  6. Rivers, N.; Jaccard, M. Useful models for simulating policies to induce technological change. Energy Policy 2006, 34, 2038–2047. [Google Scholar] [CrossRef]
  7. Goulder, L.H.; Parry, I.W.H. Instrument Choice in Environmental Policy. Rev. Environ. Econ. Policy 2008, 2, 152–174. [Google Scholar] [CrossRef]
  8. Energy Modelling Initiative, Energy Modelling Initiative—About, (n.d.). Available online: https://emi-ime.ca/about/ (accessed on 8 January 2021).
  9. Navius Research. Supporting the Development of CleanBC: 2019 Updated Methodology Report for Assessing the Impacts of CleanBC Policies. 2019. Available online: https://www2.gov.bc.ca/assets/gov/environment/climate-change/action/cleanbc/supporting-development-cleanbc_methodology-report_navius.pdf (accessed on 1 December 2020).
  10. Government of Canada. Modelling and Analysis of a Healthy Environment and a Healthy Economy. 2020. Available online: https://www.canada.ca/content/dam/eccc/documents/pdf/climate-change/climate-plan/annex_modelling_analysis_healthy_environment_healthy_economy.pdf (accessed on 3 January 2021).
  11. Jaccard, M.; Murphy, R.; Zuehlke, B.; Braglewicz, M. Cities and greenhouse gas reduction: Policy makers or policy takers? Energy Policy 2019, 134, 110875. [Google Scholar] [CrossRef]
  12. Nakata, T. Energy-economic models and the environment. Prog. Energy Combust. Sci. 2004, 30, 417–475. [Google Scholar] [CrossRef]
  13. Jaccard, M.K.; Nyboer, J.; Bataille, C.; Sadownik, B. Modeling the Cost of Climate Policy: Distinguishing Between Alternative Cost Definitions and Long-Run Cost Dynamics. Energy J. 2003, 24, 49–73. [Google Scholar] [CrossRef] [Green Version]
  14. Murphy, R.; Jaccard, M. Energy efficiency and the cost of GHG abatement: A comparison of bottom-up and hybrid models for the US. Energy Policy 2011, 39, 7146–7155. [Google Scholar] [CrossRef]
  15. Rhodes, E.; Craig, K.; Hoyle, A.; McPherson, M. Improving Climate Policy Projections: A Pan-Canadian Review of Energy-Economy Models; University of Victoria: Victoria, BC, Canada, 2021. Available online: https://www.uvic.ca/hsd/publicadmin/assets/docs/sshrc-report_ee-models.pdf (accessed on 15 March 2021).
  16. Chang, M.; Thellufsen, J.Z.; Zakeri, B.; Pickering, B.; Pfenninger, S.; Lund, H.; Østergaard, P.A. Trends in tools and approaches for modelling the energy transition. Appl. Energy 2021, 290, 116731. [Google Scholar] [CrossRef]
  17. Ridha, E.; Nolting, L.; Praktiknjo, A. Complexity profiles: A large-scale review of energy system models in terms of complexity. Energy Strat. Rev. 2020, 30, 100515. [Google Scholar] [CrossRef]
  18. Müller, B.; Gardumi, F.; Hülk, L. Comprehensive representation of models for energy system analyses: Insights from the Energy Modelling Platform for Europe (EMP-E) 2017. Energy Strat. Rev. 2018, 21, 82–87. [Google Scholar] [CrossRef]
  19. Connolly, D.; Lund, H.; Mathiesen, B.; Leahy, M. A review of computer tools for analysing the integration of renewable energy into various energy systems. Appl. Energy 2010, 87, 1059–1082. [Google Scholar] [CrossRef]
  20. Hourcade, J.-C.; Jaccard, M.; Bataille, C.; Ghersi, F. Hybrid Modeling: New Answers to Old Challenges Introduction to the Special Issue of The Energy Journal. Energy J. 2006, 2, 1–11. [Google Scholar] [CrossRef]
  21. Jaccard, M. International Handbook on The Economics of Energy 13 Combining Top Down and Bottom Up in Energy Economy Models. In International Handbook on the Economics of Energy; Evans, J., Hunt, L.C., Eds.; Edward Elgar: Northampton, MA, USA, 2009; pp. 311–331. Available online: https://www.sfu.ca/content/dam/sfu/emrg/Publications/Research_Publications/Jaccard_2009.pdf (accessed on 15 November 2020).
  22. Mundaca, L.; Neij, L.; Worrell, E.; A McNeil, M. Evaluating Energy Efficiency Policies with Energy-Economy Models. Annu. Rev. Environ. Resour. 2010, 35, 305–344. [Google Scholar] [CrossRef] [Green Version]
  23. Jaccard, M.; Dennis, M. Estimating home energy decision parameters for a hybrid energy–economy policy model. Environ. Model. Assess. 2006, 11, 91–100. [Google Scholar] [CrossRef]
  24. Löschel, A. Technological change in economic models of environmental policy: A survey. Ecol. Econ. 2002, 43, 105–126. [Google Scholar] [CrossRef] [Green Version]
  25. Horne, M.; Jaccard, M.; Tiedemann, K. Improving behavioral realism in hybrid energy-economy models using discrete choice studies of personal transportation decisions. Energy Econ. 2005, 27, 59–77. [Google Scholar] [CrossRef]
  26. Jaccard, M. Hybrid Energy-Economy Models and Endogenous Technological Change. In Energy Environment; Loulou, R., Waaub, J.P., Zaccour, G., Eds.; Springer: Boston, MA, USA, 2005; pp. 81–110. [Google Scholar] [CrossRef]
  27. Pfenninger, S.; Hawkes, A.; Keirstead, J. Energy systems modeling for twenty-first century energy challenges. Renew. Sustain. Energy Rev. 2014, 33, 74–86. [Google Scholar] [CrossRef]
  28. IPCC. Global Warming of 1.5 °C. An IPCC Special Report on the Impacts of Global Warming of 1.5 °C above Pre-Industrial Levels and Related Global Greenhouse Gas Emission Pathways, in the Context of Strengthening the Global Response to the Threat of Climate Change. 2018. Available online: https://www.ipcc.ch/site/assets/uploads/sites/2/2019/06/SR15_Full_Report_High_Res.pdf (accessed on 15 November 2020).
  29. Nika, A.; Doukas, H.; Papandreou, A. A Detailed Overview and Consistent Classification of Climate-Energy Models. In Understanding Risks and Uncertainties in Energy and Climate Policy; Doukas, H., Flamos, A., Lieu, J., Eds.; Springer: Berlin/Heidelberg, Germany, 2019. [Google Scholar] [CrossRef] [Green Version]
  30. Paris Reinforce. 12AM Paris: Integrating Integrated Assessment Models. Available online: https://paris-reinforce.epu.ntua.gr/main#section-contact (accessed on 12 April 2020).
  31. Integrated Assessment Modeling Consortium, Models & Documentation. Available online: https://www.iamconsortium.org/resources/models-documentation/ (accessed on 12 April 2020).
  32. Lopion, P.; Markewitz, P.; Robinius, M.; Stolten, D. A review of current challenges and trends in energy systems modeling. Renew. Sustain. Energy Rev. 2018, 96, 156–166. [Google Scholar] [CrossRef]
  33. Beugin, D.; Jaccard, M. Statistical Simulation to Estimate Uncertain Behavioral Parameters of Hybrid Energy-Economy Models. Environ. Model. Assess. 2011, 17, 77–90. [Google Scholar] [CrossRef]
  34. Li, F.G.N.; Trutnevyte, E.; Strachan, N. A review of socio-technical energy transition (STET) models. Technol. Forecast. Soc. Chang. 2015, 100, 290–305. [Google Scholar] [CrossRef]
  35. Gillingham, K.; Newell, R.G.; Pizer, W.A. Modeling endogenous technological change for climate policy analysis. Energy Econ. 2008, 30, 2734–2753. [Google Scholar] [CrossRef] [Green Version]
  36. Van der Zwaan, B.C.C.; Gerlagh, R.; Klaassen, G.; Schrattenholzer, L. Endogenous technological change in climate change modelling. Energy Econ. 2002, 24, 1–19. [Google Scholar] [CrossRef]
  37. Clarke, L.; Jiang, K.; Akimoto, K.; Babiker, M.; Blanford, G.; Fisher-Vanden, K.; Hourcade, J.-C.; Krey, V.; Kriegler, E.; Löschel, A.; et al. Assessing Transformation Pathways. In Climate Change 2014: Mitigation of Climate Change. Contribution of Working Group III to the Fifth Assessment Report of the Intergovernmental Panel on Climate Change; Edenhofer, O., Pichs-Madruga, R., Sokona, Y., Farahani, E., Kadner, S., Seyboth, K., Adler, A., Baum, I., Brunner, S., Eickemeier, P., et al., Eds.; Cambridge University Press: Cambridge, UK; New York, NY, USA, 2014; pp. 413–510. [Google Scholar] [CrossRef]
  38. Krysiak, F.C.; Weigt, H. The Demand Side in Economic Models of Energy Markets: The Challenge of Representing Consumer Behavior. Front. Energy Res. 2015, 3, 24. [Google Scholar] [CrossRef] [Green Version]
  39. Mercure, J.-F.; Pollitt, H.; Bassi, A.M.; E Viñuales, J.; Edwards, N.R. Modelling complex systems of heterogeneous agents to better design sustainability transitions policy. Glob. Environ. Chang. 2016, 37, 102–115. [Google Scholar] [CrossRef] [Green Version]
  40. McCollum, D.L.; Wilson, C.; Pettifor, H.; Ramea, K.; Krey, V.; Riahi, K.; Bertram, C.; Lin, Z.; Edelenbosch, O.Y.; Fujisawa, S. Improving the behavioral realism of global integrated assessment models: An application to consumers’ vehicle choices. Transp. Res. Part D Transp. Environ. 2017, 55, 322–342. [Google Scholar] [CrossRef]
  41. Gillingham, K.; Newell, R.G.; Palmer, K. Energy Efficiency Economics and Policy. Energy Efficiency Econ. Policy 2009, 1, 597–620. [Google Scholar] [CrossRef]
  42. Mercure, J.-F.; Knobloch, F.; Pollitt, H.; Paroussos, L.; Scrieciu, S.S.; Lewney, R. Modelling innovation and the macroeconomics of low-carbon transitions: Theory, perspectives and practical use. Clim. Policy 2019, 19, 1019–1037. [Google Scholar] [CrossRef] [Green Version]
  43. Hedenus, F.; Johansson, D.; Lindgren, K. A Critical Assessment of Energy–economy–climate Models for Policy Analysis. J. Appl. Econ. Bus. Res. 2013, 3, 118–132. [Google Scholar]
  44. Savvidis, G.; Siala, K.; Weissbart, C.; Schmidt, L.; Borggrefe, F.; Kumar, S.; Pittel, K.; Madlener, R.; Hufendiek, K. The gap between energy policy challenges and model capabilities. Energy Policy 2019, 125, 503–520. [Google Scholar] [CrossRef]
  45. Bhardwaj, C.; Axsen, J.; Kern, F.; McCollum, D. Why have multiple climate policies for light-duty vehicles? Policy mix rationales, interactions and research gaps. Transp. Res. Part A Policy Pract. 2020, 135, 309–326. [Google Scholar] [CrossRef]
  46. Schneider, L.; Kollmuss, A.; Lazarus, M. Addressing the risk of double counting emission reductions under the UNFCCC. Clim. Chang. 2015, 131, 473–486. [Google Scholar] [CrossRef]
  47. Peace, J.; Ye, J. Market Mechanisms: Options for Climate Policy. 2020. Available online: https://www.c2es.org/site/assets/uploads/2020/04/market-mechanisms-options-climate-policy.pdf (accessed on 5 December 2020).
  48. DeCarolis, J.; Daly, H.; Dodds, P.; Keppo, I.; Li, F.; McDowall, W.; Pye, S.; Strachan, N.; Trutnevyte, E.; Usher, W.; et al. Formalizing best practice for energy system optimization modelling. Appl. Energy 2017, 194, 184–198. [Google Scholar] [CrossRef] [Green Version]
  49. Webster, M.D.; Sokolov, A.P. Quantifying the Uncertainty in Climate Predictions. Jt. Program Rep. Ser. 1998, 37, 23. Available online: http://globalchange.mit.edu/publication/14359 (accessed on 20 October 2020).
  50. Samsó, R.; de Blas, I.; Perissi, I.; Martelloni, G.; Solé, J. Scenario analysis and sensitivity exploration of the MEDEAS Europe energy-economy-environment model. Energy Strat. Rev. 2020, 32, 100582. [Google Scholar] [CrossRef]
  51. Babonneau, F.; Vielle, M.; Haurie, A.; Loulou, R. Uncertainty and Economic Analysis of Energy and Climate Policies using TIAM and GEMINI-E3 models. Econ. Anal. 2010, 1–25. [Google Scholar]
  52. Cao, K.-K.; Cebulla, F.; Vilchez, J.J.G.; Mousavi, B.; Prehofer, S. Raising awareness in model-based energy scenario studies—A transparency checklist. Energy Sustain. Soc. 2016, 6, 28. [Google Scholar] [CrossRef] [Green Version]
  53. DeCarolis, J.F.; Hunter, K.; Sreepathi, S. The case for repeatable analysis with energy economy optimization models. Energy Econ. 2012, 34, 1845–1853. [Google Scholar] [CrossRef]
  54. Sovacool, B.K.; Axsen, J.; Sorrell, S. Promoting novelty, rigor, and style in energy social science: Towards codes of practice for appropriate methods and research design. Energy Res. Soc. Sci. 2018, 45, 12–42. [Google Scholar] [CrossRef]
  55. Needham, M.D.; Vaske, J. Survey implementation, sampling, and weighting data. Survey Research and Analysis: Applications in Parks, Recreation, and Human Dimensions; Sagamore-Venture: Champaign, IL, USA, 2008; pp. 173–222. Available online: http://nature.forestry.oregonstate.edu/sites/default/files/2008-3%20Needham%20%26%20Vaske%20-%20Chapter%2008%20-%20Survey%20Implementation%2C%20Sampling%20%26%20Weighting%20-%20Second%20Proofs.pdf (accessed on 5 October 2020).
  56. Dillman, D.A.; Smyth, J.D.; Christian, L.M. Internet, Phone, Mail, and Mixed-Mode Surveys: The Tailored Design Method, 4th ed.; Wiley & Sons: Hoboken, NJ, USA, 2014. [Google Scholar]
  57. Wolinetz, M.; Axsen, J. How policy can build the plug-in electric vehicle market: Insights from the Respondent-based Preference and Constraints (REPAC) model. Technol. Forecast. Soc. Chang. 2017, 117, 238–250. [Google Scholar] [CrossRef]
  58. Zhu, Y.; Ghosh, M.; Luo, D.; Macaluso, N.; Rattray, J. Revenue recycling and cost effective ghg abatement: An exploratory analysis using a global multi-sector multi-region cge model. Clim. Chang. Econ. 2018, 9, 1–25. [Google Scholar] [CrossRef] [Green Version]
  59. Rogge, K.S.; Kern, F.; Howlett, M. Conceptual and empirical advances in analysing policy mixes for energy transitions. Energy Res. Soc. Sci. 2017, 33, 1–10. [Google Scholar] [CrossRef]
  60. Herbst, A.; Toro, F.; Reitze, F.; Jochem, E. Introduction to Energy Systems Modelling. Swiss J. Econ. Stat. 2012, 148, 111–135. [Google Scholar] [CrossRef] [Green Version]
  61. Kolstad, C.; Urama, K.; Broome, J.; Bruvoll, A.; Cariño Olvera, M.; Fullerton, D.; Gollier, C.; Hanemann, W.M.; Hassan, R.; Jotzo, F.; et al. Social, Economic and Ethical Concepts and Methods. In Climate Change 2014: Mitigation of Climate Change; Edenhofer, O., Pichs-Madruga, R., Sokona, Y., Farahani, E., Kadner, S., Seyboth, K., Adler, A., Baum, I., Brunner, S., Eickemeier, P., et al., Eds.; Cambridge University: Cambridge, UK; New York, NY, USA, 2014; pp. 207–282. [Google Scholar] [CrossRef]
  62. Rhodes, E.; Axsen, J.; Jaccard, M. Exploring Citizen Support for Different Types of Climate Policy. Ecol. Econ. 2017, 137, 56–69. [Google Scholar] [CrossRef]
  63. Rabe, B.G. Can We Price Carbon? MIT Press: Cambridge, MA, USA, 2018. [Google Scholar]
  64. Beaumier, L.; Esfahlani, M.; Roy, M.-M.; Mousseau, N.; McPherson, M. Energy Modelling Centre–Long-Term Plan Proposal, A Report by the Energy Modelling Initiative, Institut de l’énergie Trottier, Polytechnique Montréal. 2020. Available online: https://emi-ime.ca/wp-content/uploads/2020/04/EMI-Long-term-Proposal.pdf (accessed on 5 January 2021).
  65. Rhodes, E.; Craig, K.; Hoyle, A.; McPherson, M. Survey of Energy-Economy Model Developers and Users in Canada, Mendeley Data V1. 2021. Available online: https://data.mendeley.com/datasets/mxctpp43n9/1 (accessed on 5 May 2020). [CrossRef]
Figure 1. Representation of technological change in the surveyed models by model type.
Sustainability 13 05789 g001
Figure 2. Representations of non-financial decision factors in the surveyed models by model type.
Sustainability 13 05789 g002
Figure 3. Representation of macroeconomic characteristics in the surveyed models by model type.
Sustainability 13 05789 g003
Figure 4. Policy types represented in the surveyed models by model type.
Sustainability 13 05789 g004
Figure 5. Data transparency characteristics represented in the surveyed models by model type.
Sustainability 13 05789 g005
Table 1. General model information.
ModelModel Information
OwnerModel DescriptionSimulation PeriodSimulation TargetsJurisdictional ApplicationEconomic Sector Coverage
CanESSSustainable Solutions Group (SSG) and whatIf? Technologies Inc. Exploratory simulation model (treated as bottom-up)Every year2100Provincial, nationalAll sectors
CIMSSimon Fraser University (SFU), Energy and Materials Research GroupHybridEvery 5 years2030, 2050Regional, provincial, nationalLand use excluded; Agriculture included
CIMS-UrbanSFU, Energy and Materials Research GroupHybridEvery 5 years2030, 2050MunicipalElectricity excluded
CityInSightSSG and whatIf? Technologies Inc.Exploratory simulation model (treated as bottom-up)Every yearAny year—generally 2050–2070Municipal, regionalAll sectors
E3MCSystematic Solutions, Inc.Input-output, system dynamics, hybrid (treated as hybrid)Every year2050Provincial, nationalLand use excluded
EC-IAMGovernment of Canada, Environment and Climate Change Canada (ECCC)Integrated assessment model (IAM) (treated as top-down)Every 5 years2100International by country and regionAll sectors
EC-PROGovernment of Canada, ECCCComputer general equilibrium (CGE) (treated as top-down)Every year2050ProvincialLand use excluded
EC-MSMRGovernment of Canada, ECCCCGE (treated as top-down)Every 5 years2050, 2100International by specific countries and regionAll sectors
ENERGY 2020Systematic Solutions, Inc.System dynamics, hybrid (treated as hybrid)Every year2050ProvincialAll sectors
Energy Policy SimulatorEnergy Innovation, LLC Input-output, system dynamics, hybrid (treated as hybrid)Every year2050Municipal, regional, provincial, nationalAll sectors
GCAMUniversity of Maryland, Joint Global Change Research InstituteIAM, hybrid (treated as hybrid)Every year, every 5 years2100Regional, national, internationalAll sectors
gTechNavius ResearchOptimization/linear programming, CGE (treated as hybrid)Every 5 years2030, 2050Provincial, national, USA, internationalAll sectors
LEAPStockholm Environment InstituteOptimization/linear programming (treated as bottom-up)Sub-annual, every year, every 5 years, every 10 yearsAny yearMunicipal, regional, provincial, national, multi-national, internationalAll sectors
MEDEEGovernment of Québec, Transition Energétique QuébecSimulation model (treated as bottom-up)Every 5 years2050ProvincialElectricity and land use excluded; agriculture included
MESSAGEThe International Institute for Applied Systems Analysis (IIASA) Energy ProgramOptimization/linear programming, IAM (treated as bottom-up)Sub-annual, every year, every 5 years2100Regional, provincial, national, continental, internationalWaste excluded
NATEM-TIMESEnergy Super Modelers and International Analysts (ESMIA)Optimization/linear programming, hybrid (treated as hybrid)Any time period2050Municipal, provincialLand use excluded; forest sector included
REPACSFU, Sustainable Transportation Action Research TeamTechnology adoption (treated as bottom-up)Every 5 years2030Provincial, nationalOnly transportation included
Publisher’s Note: MDPI stays neutral with regard to jurisdictional claims in published maps and institutional affiliations.

