Abstract
Many countries have adopted culture policies such as the European Capital of Culture program to revitalize cities. Culture brings economic benefit to a city through creative industries as well as vitalizes cities by allowing excellent workforce to stay in the city. In order to achieve urban growth through culture, appropriate urban policies or services should be implemented. In addition, citizens should recognize the positive brand value of cities as a result of such policies. In this study, we considered the cultural city as one of city branding and studied how the cultural cities’ characteristics, urban services, and the city’s brand value had the effect on regional activation. Online survey was conducted from 18 September to 18 October 2019 with residents residing in Xi’an, China. In total, 345 valid questionnaires were received and analyzed. As a result of this study, the characteristics of the cultural city had positive effects on urban brand value and regional activation. Urban services had positive effects on cultural city characteristics, city brand value, and regional activation. City brand value had a positive effect on regional activation. This study contributes to the study of the cultural city and the field of public service, city brand, culture, and arts. City planners and leaders will be able to use the results of this study to establish city branding and urban revitalization policies through culture.
1. Introduction
Culture has gained a key role in strategies to deal with urban problems. To revitalize post-industrial cities, culture-led city development has been conducted. The European City/Capital of Culture program (ECOC) is one of the representative programs to promote the regeneration of the city. European cultural and historical cities such as Athens, Florence, Amsterdam, West Berlin, Paris, and so on were selected as the Capital of Culture []. These cities are positive examples of urban development through culture.
The cultural city strategy is a part of city branding. As the city’s brand value grows, the city’s economic benefits increase, for example, in terms of tourists, investors, and high-quality human resources who want to enjoy urban culture. This economic growth can be the basis for revitalizing and developing the city [].
Cultural creativity is important as the foundation of a cultural city. When the creative class stays in the city, cultural creativity and the city can be developed by creating new creative industries []. On the other hand, there is an opinion that creative cities cannot be built naturally by the creative class. Policies, cultural systems, and consumption for the culture can form creative cities []. From this point of view, it will be necessary for the creative class to stay in the city and to have a cultural policy and system for the development of a cultural city.
Since cultural city is a part of urban brand activities and cultural creativity is essential to support policies for cities, studies of the cultural city should consider the public policy and the brand. After the introduction of new public management, public services are evaluated for their effectiveness and their qualitative outcomes []. In this respect, the cultural city’s policy should also be evaluated. The policy requires customer-centered evaluation from the brand perspective. Brand equity reflects the customer’s perception of the brand []. The city brand also reflects the citizens’ perception of the city []. From this point of view, it is necessary to study the relationship between public services, cultural cities, and city brand values.
In addition, regional activation is a result of cultural policy. Both urban cultural characteristics and urban services become the resources of regional activation, as well as the foundation of urban brands and urban marketing. To revitalize a city, a cultural city will have its own storytelling, cultural characteristics, urban services, and the foundation for regional activation []. We examined how urban policy, cultural city’s characteristics, and urban brand value have an effect on the regional activation of the city.
This study analyzed the cultural characteristics and urban services of the city of Xi’an. It was studied whether the strategy of urban branding in Xi’an had an effect on regional activation. We reviewed the relationships between urban policy, cultural city’s characteristics, urban brand value, and regional activation. This study provides a research model for an urban brand and essential elements in the culture policy.
2. Literature Review and Hypotheses
2.1. Cultural City
A cultural city is a city that preserves and utilizes tradition and history. It satisfies the high quality of life by combining ecological environment and urban planning. The uniqueness, pluralism, and attractiveness of a cultural city can promote the influx of human resources, financial resources, and technology. In addition, for the sustainable development of the city, it should play a central role in the region along with the protection of city characteristics and the environment.
The European City/Capital of Culture program (ECOC) is an example of culture-led city development. It started in 1983. European cultural and historical cities such as Athens, Florence, Amsterdam, West Berlin, Paris, and so on had the title of the Capital of Culture. They became symbols of cultural city for cultural regeneration []. Europe has designated cities that have contributed to the preservation of cultural heritage and the cultural integration of Europe as cultural cities. Culture was used for the purpose of developing the old European city. Culture has developed economic industries that can contribute to increased employment and urban regeneration, and it has been used as a resource for the re-imaging of cities for tourists, investors, and skilled workers [].
The cultural city was effective for the place branding of European cities and gave economic benefits such as increased tourism income. At the point of branding, the cultural city is one of place branding. There are four trends of place branding: place of origin branding, nation branding, destination branding, culture branding, and place/city branding. Place of origin branding is the usage of the place of origin in branding a product. Nation branding leads to the positive effects of branding the nation for the benefit of tourism development and the attraction of foreign investment. Destination branding is the investigation of the role of branding in the marketing of tourism destinations. Culture branding is the physical, economic, and social environment of cities. It develops the cultural, leisure, and entertainment industries. Place branding is the concept of corporate branding. Specifically, the culture branding of place branding is a result of the place management, the influence of tourism, and the culture of city [].
Finally, culture itself is the key ingredient of city identity and arts. From this point of view, a cultural city is not simply the fusion of history, regional characteristics, and art but is defined as pursuing urban development with technology and strategic goals based on cultural factors. The essence of a cultural city aims at the integration and development of urban cultural resources []. The process of transforming into a cultural city includes the process of improving the quality of life of citizens and revitalizing the region by creating a city brand and increasing the value of the city.
Cultural cities are activated by cultural creativity. Cultural creativity is used for urban development as a driving force for urban development. The creative cities idea was the new urban strategy of the European Union’s ‘European City of Culture’ projects []. While solving environmental problems and homelessness, creativity in art and culture was utilized to create new industries and employment opportunities. Florida [] suggested that the creative class, such as artists and gays, was needed to sustain the new creative industries. The social tolerance and the cultural amenities of a city draw educated workers and new economy businesses []. U.S. cities have expanded cultural agencies and programs to establish culture-led city development []. On the other hand, a large workforce with specific skills and the necessary industries to support that workforce is more important for a city to make a creative city than the creative class []. In the Sasaki’s study, the creative city needs a culture-based production system, a well-balanced system of cultural production and cultural consumption that takes advantage of accumulated cultural capital after empirical analyses of Kanazawa City, Japan. Sasaki’s study suggested the policy and the system for creative city. It supported the opinion that a creative city is not automatically made by the creative class [].
2.2. Urban Service
Urban services are in the context of public services. Urban services include general public services and security, social services (education, health, social welfare, housing, water, culture), and economic services (electricity, agriculture, forestry, fisheries, transport communications) in accordance with the Classification of Functions of Government (COFOG) of UNSD. Urban services are the sum of tangible and intangible assets required by all members of a region. They are services that can sustain the survival and development of residents, including public stability, basic education, medical hygiene, social protection, and disaster prevention. As Table 1 shows, urban services are classified into basic public services and non-basic public services according to basicity and public interest. Non-basic public services include two categories: semi-basic public services and manageable public services, which become the structure of the urban service frame. At the same time, according to the characteristics of each area, various systems such as urban planning, urban public foundation office, and public transportation system will be used [,].

Table 1.
Public services of China.
Public services are goods or services that the government produces or entrusts to private or non-profit organizations and provides to citizens. Public services are determined by the government’s policy and are delivered to citizens, and as a result, the effectiveness or quality of the service is evaluated [].
New public management (NPM) was introduced to improve the inefficiency of the public sector and the efficient execution of public services. NPM has the following features: ‘Being close to its customers; being performance-driven (targets, standards) not rulebound; displaying a commitment to continuous quality improvement; being structured in a lean and flat way- highly decentralized, with street level staff who are ‘empowered’ to be flexible and innovate; practicing tight cost control, with the help of modern, commercial-style accounting systems; using performance-related systems for recruiting, posting, promoting, and paying staff’ []. NPM is a citizen-oriented service as a consumer of public services. Its main purpose is to identify what the citizens want and to provide public service efficiently.
Urban service is related to the decentralization of NPM and consumer-oriented policy management. In this respect, it is necessary to study how the results of urban policy affect citizens, who are consumers.
2.3. Brand Value
Brand value is recognized as the same concept as brand equity []. Generally, brand equity is used to express the values and properties of a certain brand. In the traditional product, service, and corporate brand literature, it has been generally understood as the distinct and relevant elements that constitute a brand and its evaluation, measurement, or both [].
There are discussions to differentiate between brand value and brand equity. Brand value is the net present value of future cash flows from a branded product, in other words, the financial value of brands. Brand equity is a set of perceptions, knowledge, and behavior of customers of a branded product—the customer’s perceptions about a brand []. Brand value measures the financial value of a brand in the future by using the current brand equity. Brand managers’ task is to maximize and leverage brand equity to increase brand value. In this respect, brand value is measured through brand equity, but strictly speaking, brand value and brand equity will be distinguished [,].
As Table 2 shows, brand equity is classified into the following three categories: First, mental brand equity refers to the influence of a brand on consumer consciousness []. Second, brand equity refers to consumers’ reaction to a specific brand []. Third, financial brand equity refers to a brand’s wealth, which is mainly measured by financial indicators such as investment return rate, profit, sales, and price–earnings ratio [,].
Table 2.
Brand equity definition.
There are two ways to measure brand value. The first is the cost approach, which measures the cost of rebuilding a brand. This includes research and development costs, market testing costs, and advertising costs. The second is the empirical method, which converts brand value into the market value of future cash flows []. In other words, brand value refers to the price at which a brand is purchased or initialized [].
Brand value is composed of various factors. Representative factors include brand experience, brand preference, brand awareness, and brand loyalty. First, brand experience is a concept that began in the mid-1980s, which refers to the fantasy, feeling, and pleasure that consumers experience while engaging in consumption []. Brand experience is a series of psychological changes, such as emotions, brand attitudes, satisfaction, and loyalty, that arise from the interaction between consumers and brands. Brand experience includes aesthetic standards, entertainment, education, and escape from reality and is widely embodied in five perspectives: sense, perception, thinking, behavior, and relationship [,]. Second, brand preference is the attitude of consumers toward brand or service differences. It is defined as the attitude toward a brand and reflects the degree to which consumers particularly like a specific brand compared to others []. There are two important influencing factors in the process of forming brand preferences: advertising and marketing. Advertising is a popular dissemination tool that conveys information or changes people’s perceptions and attitudes toward products, and its ultimate goal is to encourage consumers to purchase. Therefore, it is encouraged to try to consume a product or service through marketing []. Third, brand awareness refers to the degree to which consumers are able to recognize or recall a particular brand when they think about a particular product line. The high recollection of a particular brand indicates that the brand has a high level of brand awareness in the market. Because there is a positive link between brand recall and brand selection, marketers need to reinforce their marketing efforts so that consumers can easily recall their brand from their memory [,]. Fourth, brand loyalty is an important concept for obtaining brand value. Brand loyalty means that consumers favor a particular brand and become dependent on the brand’s products and services [,].
Cities are a kind of brand. They can be a product brand, a destination brand, a social brand, and an interest brand []. In city brand, consumer-based brand equity will be more important than the brand value concept, which is the financial outcomes of a branded product []. The brand equity of a city is based on the citizen’s perception of the city and on their experience and learning about the city over time [].
City brand managers try to achieve better city development, position, and promotion. To achieve that, they encourage external consumers to have positive associations of the city and internal consumers to use the city as their residence and the basis of their development. Support for residence, education, and recreation are required for city life []. In this respect, urban services can have an impact on the increase of the city’s brand value.
City brand values are results of perceptions of environments, life experiences, breeding, and education. It is shaped by emotional perceptions, coming from environment and experiences. City brand elements can be categorized as follows: (1) history and heritage, such as anniversaries, historical festivals, national stories, and historical narratives; (2) artifacts and spatial plan, landmarks, buildings, and downtown areas; (3) events and activities, festivals, sport, and hallmark event processes and institutions; and (4) graphics and symbols, logos, pictures, videos, and other visual elements []. Considering these city brand elements, it can be revealed that cultural elements constitute the urban brand value.
The city brand can be measured by the citizens’ perception of the city and the public services for citizens. In Anholt’s model City Brand Hexagon, six key measures were suggested: (1) city position and its status—general recognition and reputation; (2) urban space, delivering living environment, cleanliness and attractions, and architectural and urbanism solutions; (3) residents and living necessities (living conditions, health, education, transport, and sports); (4) residents and their behaviors, warmness, kindness, openness, and culture []. From these previous studies, we find that the cultural elements and the public services of the citizens influence the city brand value.
2.4. Regional Activation
In the early days of promoting regional innovation, in order to increase the potential of regional development, it was mainly relied on policy outcomes such as establishing physical infrastructure, e.g., transportation and communication, industrial complexes, and research parks, or inviting multinational companies. However, as a result, companies and research institutes that were intentionally relocated to underdeveloped areas did not create synergy with the area and remained in an isolated form, which failed to achieve their original purpose. Accordingly, in Europe, since the mid-1990s, there was a widespread awareness that not only the physical infrastructure but also cooperation networks between local entities such as enterprises, universities, local governments, and research institutes were important. Adding to this, socio-cultural norms that promote technology development and innovation were also thought to be important in regional innovation [,].
Regional activation depends on two innovative clusters of factors, namely enterprises and the structure of institutions. The degree of regional activation is influenced by various factors such as politics, economy, society, public management, and ecological environment of the region []. Regional activation is defined as making interactions between the public and non-public sectors and between official and informal institutions into a structure that is advantageous for improving the lives of local residents and the environment and also for the operation and dissemination of knowledge production. The current concept of regional activation seems to be derived from largely two theories. First, it originated from the theory of local science, and at the center of the related theory is the transformation of the social institutional environment based on the influence of regional activation. Second, it was founded by the regional network theory, where the regional network is defined as an integrated system of aggregates, relationships, and attributes [].
The operating system for regional activation is the cooperative innovation structure. The presentation and research of the concept of cooperative innovation were initiated by the German scholar Haken, and it is an effective method of describing the interaction of each system and the structure of cooperative development in a complex system and analyzing the behavior of diversified subjects []. Cooperative innovation is a process in which institutions such as governments, corporations, schools, and scientific research institutes share roles and cooperate to create value in order to achieve a certain goal []. In cooperative innovation, various resources such as knowledge, technology, information, and talent are fully integrated and shared, and each subject helps each other in the process of communication, selection, control, and cooperation []. The innovation that emerges from the cooperation of several subjects drives regional development in many aspects. Since the creation of innovation through cooperation can be effective, open innovation through cooperation can be a driving force in regional development [].
The goals of regional revitalization are to improve the quality of life, the economics, and the openness of regional residents. In the opposing concept of an active urban area, a depressed region has suffered problems such as a lack of jobs, poor quality of life, lack of culture and convenience facilities, and close-mind community. Orr and West studied the revitalization of Rhode Island from the citizen perspective. They assessed what affects public opinion about city success, quality of life, and downtown improvement. Factors such as race relations, street repairs, and political leadership had an effect on the awareness of urban development []. Regional activation can be achieved through activation of the network []. In Japanese studies, the density of the network promoted bonding of the social capital. As a result of bonding the social capital and the cooperation between insiders and outsiders, local problems were solved and developed through the formation of social capital with outsiders [,,]. This shows that openness of information and exchange programs for outsiders can help in urban development.
2.5. Hypotheses
Cultural city has its own history and tradition or well-developed cultural industries by the creative class. These are the uniqueness of the cultural city distinguished from other cities. This uniqueness is the resource for the re-imaging of cities for tourists, investors, and skilled workers [,]. In addition, culture itself is the key ingredient of city identity []. Cultural city has the attractiveness for the creative class, the tourist, and the investors [,]. Because of the attractiveness of cultural city, creative people gather in that area. It helps regional activation. Finally, cultural city has diversity. It has many cultural programs and cultural exchanges. The social tolerance of the city helps to recognize diversity [,].
Cultural city is one of place branding []. Characteristics of a cultural city can affect its brand value. Brand value comes from brand experience, preferences, and awareness [,,,,]. If people experience the attractiveness, uniqueness, and diversity of a cultural city and that experience is good, the city will be a brand and have its own brand value.
Urban service can affect the city’s brand value. Urban services were defined as education, medical care, cultural services, physical education, and social welfare [,]. Urban services can increase citizens’ satisfaction and services for the city as the brand loyalty for a product or service. This can increase the brand value of the city that citizens have. Urban services not only include the basic services that maintain the survival of residents but also various systems according to the characteristics of the area, such as city planning, public infrastructure, and public transportation systems. Therefore, a city with stable and convenient service functions will have positive influences on its development as a cultural city. Thus, we hypothesized that:
Hypothesis 1.
Characteristics of a cultural city affect brand value.
Hypothesis 1a.
Attractiveness of a cultural city affects brand value.
Hypothesis 1b.
Uniqueness of a cultural city affects brand value.
Hypothesis 1c.
Diversity of a cultural city affects brand value.
Hypothesis 2.
Urban service affects brand value.
Hypothesis 2a.
Educational service affects brand value.
Hypothesis 2b.
Medical care service affects brand value.
Hypothesis 2c.
Cultural service affects brand value.
Hypothesis 2d.
Sports service affects brand value.
Hypothesis 2e.
Social welfare affects brand value.
Hypothesis 3.
Urban service affects cultural city characteristics.
The higher the brand value of a city, the more competitive it can become with other regions. Because of this, tourism income will increase, which improves the quality of life and economic level of residents. In addition, migrants will increase, which will affect the vitalization of the region.
The unique culture or environment that a city has is an important factor in constructing the city image. If this is used successfully, the number of tourists visiting to enjoy the city’s individual features will increase, and the region will be activated.
Development of urban services means that it meets the needs of local residents in various aspects such as education, medical care, education, and social welfare. Not only the social and economic development of the residential area but also the quality of life of the residents will be improved, and it will have a positive effect on the activation of the area. Thus we hypothesized that:
Hypothesis 4.
Brand value affects regional activation.
Hypothesis 5.
Cultural city characteristics affect regional activation.
Hypothesis 5a.
Attractiveness of a cultural city affects regional activation.
Hypothesis 5b.
Uniqueness of a cultural city affects regional activation.
Hypothesis 5c.
Diversity of a cultural city affects regional activation.
Hypothesis 6.
Urban service affects regional activation.
Hypothesis 6a.
Educational service affects regional activation.
Hypothesis 6b.
Medical care service affects regional activation.
Hypothesis 6c.
Cultural service affects regional activation.
Hypothesis 6d.
Sports service affects regional activation.
Hypothesis 6e.
Social welfare affects regional activation.
3. Methodology
3.1. Research Model
In this study, brand value was set as a parameter, and the effects of cultural city characteristics and urban services on regional activation were analyzed. This study selected the historic cultural city of Xi’an, China, and aimed to find out whether the characteristics of Xi’an and the function of urban services affect the brand value of the city and ultimately have a meaningful effect on regional activation. The following research model was established:
The study used the research model presented in Figure 1. The variables were measured based on previously validated items and were then further modified as required. The measurement of all variables utilized a five-point Likert scale, where 1 denotes “strongly disagree” and 5 denotes “strongly agree”. The composition of the variable is as follows: Characteristics of cultural city (CCC) includes city attractiveness (CA), city uniqueness (CU), and city diversity (CD). Urban service (US) contains education service (ES), medical service (MS), culture service (CS), physical service (PHS), and social welfare service (SSS). Brand value (BV) is brand experience (BE), brand loyalty (BL), and brand preference (BP). Regional activation (RA) contains life quality (LA), EA (Economy), and openness of city (OOA).
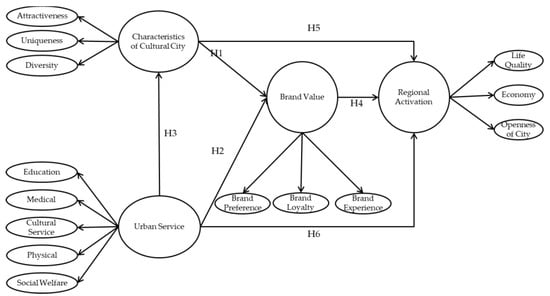
Figure 1.
Research model.
3.2. Data Collection
These data were collected from citizens and tourists in Xi’an to clarify the structural relationship between the characteristics of cultural cities and urban services and to figure out the factors influencing regional activation. Of the 400 online questionnaires sent, we received 366 questionnaires and analyzed 345 questionnaires that had valid responses. The valid response rate was 86%.
The results from the 345 respondents are reported in Table 3. The age of respondents consisted of a relatively similar proportion overall. Of the respondents, approximately 55% had lived in Xi’an for less than ten years, and 94.2% were married.
Table 3.
Demographic characteristics.
4. Analysis of Results
The research model is validated using structural equation modeling, which allows analysis of the relationships (and their strengths) between constructs. Reflecting growing use in management studies [], partial least squares (PLS) is used as the estimation procedure. PLS combines factor analysis with linear regression and does not require large sample sizes; it makes only minimal assumptions about the goal of variance explanation and makes no assumptions regarding the underlying distribution of data []. Structural equation modeling can examine both the path (structural) and factor (measurement) in one model. PLS combines a factor analysis with linear regressions and makes only minimal assumptions, with the goal of variance explanation. The analysis was conducted in two stages to assess the validity and reliability of the measurement model and to assess the structural model. SmartPLS 3.0 and SPSS 24.0 software packages (SmartPLS GmbH, Boenningstedt, Germany) were used for data analysis.
Reliability can be defined as the overall internal consistency of the results. A standardized approach was taken to improve reliability. Construction of a well-defined survey instrument and consistent administration of the survey improved reliability. In this study, multiple items were developed to measure the statements that describe the relationships between constructs. Reliability analysis was conducted using SPSS, using the calculation of Cronbach’s alpha. The majority of individuals correctly used Cronbach’s alpha as the measure of internal consistency. Cronbach’s alpha reliability coefficient normally ranges between 0 and 1. The closer Cronbach’s alpha coefficient is to 1.0, the greater the internal consistency of the items in the scale. Appendix A shows the reliability of each construct and indicates that Cronbach’s alpha values are greater than 0.7, which means that the measurement of the constructs maintained internal consistency.
Exploratory factor analysis is conducted using principal component analysis and varimax orthogonal factor rotation utilizing SPSS. The purposes of exploratory factor analysis are determining the number of fundamental influences underlying the domain of variables, measuring the extent to which each construct is associated with the factors, and acquiring information about their nature by observing which factors influence performance on which variables. Appendix B lists the results of the exploratory factor analysis.
Validity represents effectiveness when producing accurate results and conclusions. Internal validity indicates the overall integrity of the experiment. External validity indicates the ability to generalize the findings of the study to the general population (i.e., beyond the limited sample). Threat sources to validity can be statistical or constructs. Statistical threats are related to concerns of whether the observed results were due to chance or, in fact, they can be attributed to some effect of the independent variable. Construct validity is related to the concept of whether or not the operational definitions are valid measures of the various constructs. Construct validity includes empirical and theoretical support for the interpretation of the construct. There are two kinds of approaches in construct validity. First, convergent validity represents the degree to which a measure is correlated with other measures that it is theoretically predicted to correlate with. Second, discriminant validity represents the extent to which the operational definitions do not correlate with other operational definitions that, theoretically, they should not correlate with.
Convergent validity was evaluated using composite reliability (CR) and average variance extracted (AVE) values for all constructs that are greater than the required validity thresholds. Convergent validity is considered valid if the composite reliability and AVE values are greater than 0.7 and 0.5, respectively []. Appendix A indicates that all of the measures satisfy all of the thresholds, and thus, convergent validity is satisfied. To satisfy discriminant validity, the square root of the AVE values must exceed the correlation coefficients between the construct and the other constructs in the model []. Table 4 indicates that the square roots of the AVE values exceeded the correlation coefficients, thereby verifying discriminant validity. The fact that convergent validity and discriminant validity were satisfied means that all measurements maintain internal consistency.
Table 4.
Discriminant validity and correlation of latent variable scores.
The effects proposed in the model and their significance values were estimated using PLS. Table 5 lists the results of the structural model PLS regressions. The bootstrap method was used to evaluate the path (bootstrap resampling number = 500).
Table 5.
Testing results of structural model.
As shown in Figure 2, Hypothesis 1, which states that characteristics of cultural city are positively associated with brand value, is supported (β = 0.403, p < 0.01). This result shows that the strong characteristics of cultural city are associated with an improvement in brand value. Hypothesis 2, which states that urban service is positively associated with brand value, is supported (β = 0.386, p < 0.01). This result means that the high level of urban service can increase the degree of enforcement of brand value. Hypothesis 3, which states that urban service is positively associated with characteristics of cultural city, is supported. This result shows that the high quality of urban service is associated with an enforcement in characteristics. Hypothesis 4, which states that brand value is positively associated with regional activation, is supported. This result shows that brand value of the region can increase the level of enforcement of regional activation. Hypothesis 5, which states that characteristics of cultural city are positively associated with regional activation, is also supported. This result shows that characteristics of cultural city can increase the level of enforcement of regional activation. Hypothesis 6, which states that urban service is positively associated with regional activation, is supported. This result shows that the high quality of urban service can increase the level of enforcement of regional activation.
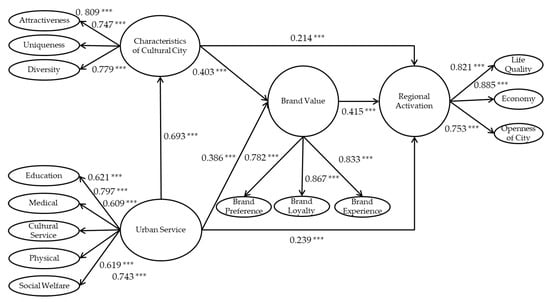
Figure 2.
Results of research model.; *** p < 0.01.
5. Conclusions and Discussion
In past studies, discussion on cultural cities has been focused on tradition or art, but currently, there is an increasing tendency to view cultural cities from the perspective of life, environment, economy, and cities. This study supported these discussions by demonstrating that the inclusion of characteristics of a city as well as urban public services in the frame of a cultural city has a positive impact on urban brand value and regional activation.
The conclusions of this study are as follows. First, urban services have a positive impact on the characteristics of cultural cities, urban brand value, and regional activation. In particular, urban services have a strong influence on the characteristics of cultural cities, meaning that having an infrastructure to enhance the convenience of residents is very important for cultural cities. In other words, cultural urbanists call a city with artistic, religious, mass media, and academic attributes a cultural city, but results show that ordinary people perceive a cultural city as a place with basic public social services to prevent residents and people from other places from feeling uncomfortable. Based on this, cultural cities do not only refer to cities with history and tradition or well-developed cultural industries. In addition, urban services have a significant impact on regional activation. Education services help citizens grow intellectually, and medical services provide convenience for citizens to prevent and treat diseases and accidents. Cultural services help citizens take pride in the region’s history, culture, and cultural heritage. Physical education services help citizens lead healthy lives through physical activities, and social welfare services allow citizens to secure basic living standards and safety. Therefore, the more enhanced urban service levels a city has, the more positive impact on regional activation.
Second, the characteristics of cultural cities have a positive impact on urban brand value and regional activation. Attractiveness of a cultural city indicates the citizens’ pride in many international culture events, local specialties, attractions, and interesting places. The uniqueness of a cultural city means that citizens are proud of the unique history and cultural heritage of their region. The diversity of a cultural city means that they are proud of its facilities, environment, and function. The concept of a cultural city emerged in the urban regeneration process, and various cultural city concepts were created as the positive role of culture was recognized in the process. A city’s distinctiveness is manifested as landmarks, events, and festivals, strengthening the city’s brand image and increasing its brand value. The main insight of this study was that cultural assets such as historicality and traditionality should be linked to residents in cultural cities. Only when residents recognize the characteristics of the cultural city can common goals be set and interactions occur actively, creating urban brand values and regional activation.
Third, urban brand value has a positive impact on regional activation. Based on an integrated approach to recognizing a city as a product, the region will become more socially and economically active as the brand value of the city, which focuses on the spaciality of the city, increases. Increasing the urban brand value by providing high-quality urban services and enhancing the competitiveness of the city with differentiated characteristics will activate the region, improving the citizens’ quality of life as well as the local economy. If the urban brand value is established by solely emphasizing the cultural heritage, it can be temporarily successful but difficult to achieve sustainable and long-term improvement.
Based on the research results, the concept of a cultural city in terms of strategies to activate the region should be combined with other activities in the environmental, social, and economic sectors. In other words, the cultural city frame can obtain growth engines and sustainability only when it has cultural characteristics, public services, and a network structure in which industries and economies form an ecosystem. Synergy and strategic development cannot be expected if cultural cities are limited to culture or art and not combined with other elements of the region. Therefore, an integrated approach is needed to implement strategies for the development of cultural cities. Specifically, cultural cities can be maintained only when history, tradition, art, literature, learning, and lifestyle form an axis of a virtuous circle in the urban ecosystem and when the urban brand value is established to be attractive to residents and others. The support of culture-related industries, the promotion of cultural events, the creation of public spaces, and civic participation should all be considered, and the creation of values that give meaning to consumers should extend from the stages before and after cultural elements are delivered. Therefore, in order for a city of many elements to have an image that it wants and attract the attention of many people, the city itself needs to be a product of a collective and complex nature.
6. Implications and Limitations
Since the 2000s, many researchers and urban policymakers have been interested in cultural cities and have been trying to define their concept. Nevertheless, since most of the studies were case studies or exploratory studies, this study has a significant academic implication in that it has established a cultural city frame, including urban services, through demonstration.
This study has the following practical implications. First, it can be used as a basis for strategies for cultural city development. While there are small and medium-sized cities that are well established as cultural cities, there are also places where the younger population is decreasing and the industrial base is weakening. These cities had followed existing cultural cities to create cultural infrastructure and to plan and host events, but the results did not turn out as expected. These cities had failed to link the citizens’ lives with the characteristics of cultural cities because they were overly focused on building a physical environment. To solve this problem, it is necessary to find ways to secure sustainability as a cultural city from a strategic perspective. For the continuation as a cultural city, a governance environment that supports active civic participation is needed. In addition, as shown in this study, various aspects such as natural and architectural environments, social and symbolic capital, economic activities, and cultural facilities should be prepared for growth and sustainability as a cultural city. If the city’s image is differentiated by endogenous resources, it will have a competitive advantage over other cities. Furthermore, if the quality of life, economic level, and openness of the city increases, it will attract highly skilled workers, resulting in a virtuous cycle of regional activation. Therefore, this study provides policy implementation guidelines to administrators who want to proceed with establishing a cultural city by identifying the success factors necessary to build one.
This study has the following limitations. This study demonstrated Xi’an (China) as a cultural city. However, it is impractical to generalize the survey respondents’ perception of Xi’an as that of the citizens throughout the whole city. In the future, comparative research is needed to expand the scope of the study on other Chinese cities or cultural cities in other countries. In addition, because of the imbalance in regional development in Xi’an, we cannot rule out the possibility that the respondents have responded indifferently to the question of regional activation.
Author Contributions
Conceptualization, J.D. and M.C.; methodology and data curation, J.D.; validation and supervision, M.C.; writing, H.U. and J.J. All authors have read and agreed to the published version of the manuscript.
Funding
This research received no external funding.
Institutional Review Board Statement
Not applicable.
Informed Consent Statement
Informed consent was obtained from all subjects involved in the study.
Data Availability Statement
Data sharing not applicable.
Conflicts of Interest
The authors declare no conflict of interest.
Abbreviations
The following abbreviations are used in this manuscript:
| BV | Brand Value |
| BE | Brand Experience |
| BL | Brand Loyalty |
| BP | Brand Preference |
| CCC | Characteristics of Cultural City |
| CA | City Attractiveness |
| CD | City Diversity |
| CU | City Uniqueness |
| US | Urban Service |
| ES | Education Service |
| MS | Medical Service |
| CS | Culture Service |
| PHS | Physical Service |
| SSS | Social Welfare Service |
| RA | Regional Activation |
| EA | Economy |
| LA | Life Quality |
| OOA | Openness of City |
| PLS | Partial Least Squares |
| AVE | Average Variance Extracted |
Appendix A
Table A1.
Validity and reliability of reflective constructs.
Table A1.
Validity and reliability of reflective constructs.
| Construct | Indicator | Item Loading | Mean | SD | AVE | Composite Reliability | R Square | Cronbach’s Alpha |
|---|---|---|---|---|---|---|---|---|
| BE | Br_Ex_1 | 0.633 | 3.99 | 0.85 | 0.655 | 0.905 | 0.693 | 0.868 |
| Br_Ex_2 | 0.729 | |||||||
| Br_Ex_3 | 0.721 | |||||||
| Br_Ex_4 | 0.734 | |||||||
| Br_Ex_5 | 0.691 | |||||||
| BL | Br_Ly_1 | 0.788 | 3.90 | 0.92 | 0.705 | 0.923 | 0.752 | 0.896 |
| Br_Ly_2 | 0.685 | |||||||
| Br_Ly_3 | 0.756 | |||||||
| Br_Ly_4 | 0.647 | |||||||
| Br_Ly_5 | 0.682 | |||||||
| BP | Br_Pf_1 | 0.742 | 3.98 | 0.99 | 0.781 | 0.915 | 0.611 | 0.860 |
| Br_Pf_2 | 0.775 | |||||||
| Br_Pf_3 | 0.722 | |||||||
| CA | City_Attr_1 | 0.784 | 3.96 | 0.88 | 0.656 | 0.905 | 0.607 | 0.869 |
| City_Attr_2 | 0.730 | |||||||
| City_Attr_3 | 0.724 | |||||||
| City_Attr_4 | 0.762 | |||||||
| City_Attr_5 | 0.667 | |||||||
| CS | Cul_Ser_1 | 0.786 | 4.01 | 0.88 | 0.702 | 0.904 | 0.635 | 0.858 |
| Cul_Ser_2 | 0.748 | |||||||
| Cul_Ser_3 | 0.746 | |||||||
| Cul_Ser_4 | 0.757 | |||||||
| EA | Econo_att_1 | 0.641 | 3.95 | 0.85 | 0.673 | 0.925 | 0.783 | 0.903 |
| Econo_att_2 | 0.669 | |||||||
| Econo_att_3 | 0.659 | |||||||
| Econo_att_4 | 0.711 | |||||||
| Econo_att_5 | 0.755 | |||||||
| Econo_att_6 | 0.724 | |||||||
| ES | Edu_Ser_1 | 0.811 | 3.92 | 0.96 | 0.753 | 0.901 | 0.552 | 0.835 |
| Edu_Ser_2 | 0.746 | |||||||
| Edu_Ser_3 | 0.738 | |||||||
| LA | Life_att_1 | 0.731 | 3.98 | 0.82 | 0.658 | 0.906 | 0.673 | 0.870 |
| Life_att_2 | 0.775 | |||||||
| Life_att_3 | 0.696 | |||||||
| Life_att_4 | 0.719 | |||||||
| Life_att_5 | 0.724 | |||||||
| MS | Med_Ser_1 | 0.776 | 3.85 | 1.00 | 0.821 | 0.902 | 0.386 | 0.784 |
| Med_Ser_2 | 0.837 | |||||||
| CD | Div_att_1 | 0.810 | 3.88 | 1.01 | 0.747 | 0.922 | 0.557 | 0.887 |
| Div_att_2 | 0.765 | |||||||
| Div_att_3 | 0.766 | |||||||
| Div_att_4 | 0.814 | |||||||
| PHS | Phy_Ser_1 | 0.790 | 3.94 | 1.03 | 0.797 | 0.887 | 0.371 | 0.746 |
| Phy_Ser_2 | 0.804 | |||||||
| CU | Uni_att_1 | 0.692 | 3.89 | 0.93 | 0.700 | 0.921 | 0.655 | 0.893 |
| Uni_att_2 | 0.774 | |||||||
| Uni_att_3 | 0.707 | |||||||
| Uni_att_4 | 0.751 | |||||||
| Uni_att_5 | 0.764 | |||||||
| SSS | Social_Ser_1 | 0.788 | 3.96 | 1.01 | 0.811 | 0.896 | 0.383 | 0.767 |
| Social_Ser_2 | 0.820 | |||||||
| OOA | Open_OA_1 | 0.779 | 3.83 | 0.92 | 0.776 | 0.912 | 0.567 | 0.855 |
| Open_OA_2 | 0.646 | |||||||
| Open_OA_3 | 0.736 |
BE: Brand Experience, BL: Brand Loyalty, BP: Brand Preference, CA: City Attractiveness, CS: Culture Service, EA: Economy, ES: Education Service, LA: Life Quality, MS: Medical Service, CD: City Diversity, PHS: Physical Service, CU: City Uniqueness, SSS: Social Welfare Service. See Appendix C.
Appendix B
Table A2.
Exploratory factor analysis.
Table A2.
Exploratory factor analysis.
| Indicator | Component | ||||||||||||||
|---|---|---|---|---|---|---|---|---|---|---|---|---|---|---|---|
| 1 | 2 | 3 | 4 | 5 | 6 | 7 | 8 | 9 | 10 | 11 | 12 | 13 | 14 | ||
| EA | EA5 | 0.755 | 0.237 | 0.167 | 0.133 | 0.085 | 0.085 | 0.108 | 0.111 | 0.082 | 0.047 | 0.119 | -0.002 | 0.017 | 0.109 |
| EA6 | 0.724 | 0.186 | 0.068 | 0.163 | 0.136 | 0.132 | 0.113 | 0.176 | 0.146 | 0.065 | 0.182 | 0.023 | 0.039 | 0.027 | |
| EA4 | 0.711 | 0.056 | 0.151 | 0.103 | 0.099 | 0.127 | 0.120 | 0.103 | 0.189 | 0.017 | −0.051 | 0.136 | 0.178 | 0.140 | |
| EA2 | 0.669 | 0.186 | 0.136 | 0.210 | 0.257 | 0.177 | 0.093 | 0.081 | 0.099 | 0.044 | 0.135 | 0.047 | −0.011 | 0.051 | |
| EA3 | 0.659 | 0.136 | 0.273 | 0.114 | 0.168 | 0.136 | 0.121 | 0.147 | 0.035 | 0.138 | 0.127 | 0.093 | 0.101 | 0.036 | |
| EA1 | 0.641 | 0.149 | 0.243 | 0.216 | 0.185 | 0.189 | 0.086 | 0.072 | 0.080 | 0.100 | 0.135 | 0.076 | 0.073 | 0.112 | |
| CU | CU2 | 0.170 | 0.774 | 0.045 | 0.180 | 0.056 | 0.107 | 0.086 | 0.106 | 0.031 | 0.100 | 0.049 | 0.162 | −0.003 | −0.016 |
| CU5 | 0.137 | 0.764 | 0.167 | 0.123 | 0.137 | 0.126 | 0.088 | 0.106 | 0.139 | 0.076 | 0.066 | 0.049 | 0.115 | 0.046 | |
| CU4 | 0.180 | 0.751 | 0.152 | 0.168 | 0.057 | 0.123 | 0.120 | 0.120 | 0.107 | 0.071 | 0.026 | 0.098 | 0.004 | 0.106 | |
| CU3 | 0.106 | 0.707 | 0.226 | 0.023 | 0.136 | 0.127 | 0.128 | 0.110 | 0.172 | 0.130 | 0.021 | 0.007 | 0.116 | 0.092 | |
| CU1 | 0.188 | 0.692 | 0.148 | 0.084 | 0.054 | 0.109 | 0.166 | 0.086 | 0.181 | 0.158 | 0.018 | 0.039 | 0.159 | 0.113 | |
| LA | LA2 | 0.094 | 0.112 | 0.775 | −0.013 | 0.092 | 0.133 | 0.032 | 0.149 | 0.045 | 0.015 | 0.088 | 0.097 | 0.041 | 0.041 |
| LA1 | 0.230 | 0.128 | 0.731 | 0.079 | 0.190 | 0.114 | 0.015 | 0.035 | 0.068 | 0.114 | 0.045 | 0.046 | 0.100 | 0.028 | |
| LA5 | 0.159 | 0.125 | 0.724 | 0.178 | 0.111 | 0.152 | 0.032 | 0.011 | 0.139 | 0.025 | 0.039 | 0.107 | 0.112 | 0.096 | |
| LA4 | 0.161 | 0.140 | 0.719 | 0.110 | 0.114 | 0.056 | 0.113 | 0.101 | 0.088 | 0.148 | 0.139 | −0.013 | 0.021 | 0.039 | |
| LA3 | 0.141 | 0.182 | 0.696 | 0.111 | 0.095 | 0.137 | 0.102 | 0.163 | 0.106 | −0.018 | 0.261 | −0.075 | −0.088 | 0.072 | |
| CA | CA1 | 0.064 | 0.097 | 0.092 | 0.784 | 0.073 | 0.110 | 0.129 | 0.122 | 0.043 | 0.112 | 0.033 | 0.024 | 0.031 | 0.129 |
| CA4 | 0.177 | 0.094 | 0.109 | 0.762 | 0.063 | 0.151 | 0.104 | 0.072 | 0.111 | 0.078 | 0.045 | 0.019 | 0.029 | 0.057 | |
| CA2 | 0.100 | 0.076 | 0.080 | 0.730 | 0.066 | 0.154 | 0.097 | 0.142 | 0.068 | 0.053 | 0.064 | 0.086 | 0.054 | 0.062 | |
| CA3 | 0.184 | 0.171 | −0.025 | 0.724 | 0.155 | 0.135 | 0.103 | 0.106 | −0.059 | 0.128 | −0.003 | 0.107 | 0.038 | −0.023 | |
| CA5 | 0.174 | 0.103 | 0.169 | 0.667 | 0.150 | 0.089 | 0.124 | 0.124 | 0.114 | 0.075 | 0.078 | 0.046 | 0.137 | 0.082 | |
| BL | BL1 | 0.078 | 0.109 | 0.102 | 0.187 | 0.788 | 0.117 | 0.114 | 0.111 | 0.012 | 0.065 | 0.156 | 0.042 | 0.062 | 0.103 |
| BL3 | 0.206 | 0.038 | 0.190 | 0.070 | 0.756 | 0.137 | 0.144 | 0.109 | 0.027 | 0.049 | −0.029 | 0.046 | 0.113 | 0.098 | |
| BL2 | 0.172 | 0.148 | 0.168 | 0.139 | 0.685 | 0.186 | 0.121 | 0.109 | 0.287 | 0.141 | 0.132 | 0.077 | −0.001 | 0.054 | |
| BL5 | 0.175 | 0.114 | 0.142 | 0.120 | 0.682 | 0.079 | 0.139 | 0.157 | 0.223 | 0.128 | 0.121 | 0.178 | 0.043 | 0.068 | |
| BL4 | 0.245 | 0.094 | 0.124 | 0.078 | 0.647 | 0.268 | 0.195 | 0.134 | 0.222 | 0.059 | 0.108 | 0.069 | 0.070 | 0.076 | |
| BE | BE4 | 0.144 | 0.136 | 0.129 | 0.146 | 0.055 | 0.734 | 0.126 | 0.102 | 0.091 | 0.085 | 0.151 | 0.130 | 0.034 | 0.030 |
| BE2 | 0.108 | 0.096 | 0.097 | 0.106 | 0.159 | 0.729 | 0.174 | 0.114 | 0.037 | 0.080 | 0.106 | 0.030 | 0.135 | 0.119 | |
| BE3 | 0.131 | 0.139 | 0.150 | 0.126 | 0.119 | 0.721 | 0.055 | 0.093 | 0.157 | 0.153 | 0.019 | −0.035 | 0.085 | 0.020 | |
| BE5 | 0.137 | 0.189 | 0.087 | 0.205 | 0.220 | 0.691 | 0.100 | 0.105 | 0.105 | 0.025 | 0.124 | 0.008 | 0.086 | 0.104 | |
| BE1 | 0.199 | 0.050 | 0.195 | 0.189 | 0.137 | 0.633 | 0.042 | 0.145 | 0.206 | 0.191 | 0.037 | 0.069 | −0.029 | −0.039 | |
| CD | CD4 | 0.106 | 0.077 | 0.079 | 0.088 | 0.106 | 0.129 | 0.814 | 0.113 | 0.000 | 0.117 | 0.094 | 0.075 | 0.027 | 0.071 |
| CD1 | 0.088 | 0.180 | 0.078 | 0.172 | 0.114 | 0.076 | 0.810 | 0.104 | 0.054 | 0.064 | 0.154 | 0.097 | 0.068 | 0.020 | |
| CD3 | 0.101 | 0.116 | 0.079 | 0.175 | 0.212 | 0.111 | 0.766 | 0.096 | 0.037 | 0.072 | 0.095 | 0.083 | 0.053 | 0.082 | |
| CD2 | 0.162 | 0.133 | 0.019 | 0.110 | 0.106 | 0.103 | 0.765 | 0.070 | 0.170 | 0.066 | 0.090 | 0.007 | 0.048 | 0.039 | |
| CS | CS1 | 0.077 | 0.082 | 0.066 | 0.148 | 0.089 | 0.179 | 0.110 | 0.786 | 0.058 | 0.118 | 0.070 | 0.047 | −0.019 | 0.093 |
| CS4 | 0.138 | 0.087 | 0.139 | 0.146 | 0.120 | 0.106 | 0.093 | 0.757 | −0.031 | 0.059 | 0.065 | 0.040 | 0.103 | 0.003 | |
| CS2 | 0.149 | 0.112 | 0.077 | 0.094 | 0.108 | 0.084 | 0.068 | 0.748 | 0.066 | 0.149 | 0.039 | 0.052 | 0.116 | 0.093 | |
| CS3 | 0.130 | 0.182 | 0.129 | 0.154 | 0.146 | 0.082 | 0.111 | 0.746 | 0.121 | 0.098 | 0.091 | 0.031 | 0.094 | 0.056 | |
| BP | BP2 | 0.167 | 0.162 | 0.145 | 0.139 | 0.137 | 0.149 | 0.045 | 0.019 | 0.775 | 0.103 | 0.032 | 0.118 | 0.121 | 0.051 |
| BP1 | 0.131 | 0.260 | 0.175 | 0.071 | 0.230 | 0.194 | 0.150 | 0.044 | 0.742 | 0.018 | 0.158 | 0.092 | −0.001 | 0.050 | |
| BP3 | 0.215 | 0.206 | 0.117 | 0.060 | 0.183 | 0.207 | 0.096 | 0.161 | 0.722 | 0.084 | 0.093 | 0.028 | 0.064 | 0.026 | |
| ES | ES1 | 0.096 | 0.146 | 0.091 | 0.131 | 0.104 | 0.143 | 0.152 | 0.147 | 0.015 | 0.811 | 0.126 | 0.028 | 0.075 | 0.040 |
| ES2 | 0.065 | 0.142 | 0.133 | 0.147 | 0.026 | 0.133 | 0.077 | 0.140 | 0.102 | 0.746 | 0.115 | 0.157 | 0.024 | 0.102 | |
| ES3 | 0.101 | 0.169 | 0.027 | 0.150 | 0.197 | 0.158 | 0.094 | 0.146 | 0.080 | 0.738 | 0.158 | 0.070 | 0.056 | 0.021 | |
| OOA | OOA1 | 0.168 | 0.046 | 0.216 | 0.065 | 0.095 | 0.133 | 0.216 | 0.093 | 0.095 | 0.144 | 0.779 | 0.071 | 0.117 | 0.046 |
| OOA3 | 0.165 | 0.039 | 0.221 | 0.133 | 0.203 | 0.133 | 0.155 | 0.072 | 0.086 | 0.216 | 0.736 | 0.072 | 0.052 | 0.089 | |
| OOA2 | 0.227 | 0.083 | 0.161 | 0.023 | 0.140 | 0.195 | 0.170 | 0.162 | 0.106 | 0.142 | 0.646 | 0.146 | 0.182 | 0.144 | |
| MS | MS2 | 0.094 | 0.127 | 0.077 | 0.184 | 0.071 | 0.080 | 0.108 | 0.029 | 0.112 | 0.078 | 0.126 | 0.837 | 0.020 | 0.068 |
| MS1 | 0.143 | 0.178 | 0.074 | 0.052 | 0.230 | 0.057 | 0.138 | 0.139 | 0.086 | 0.168 | 0.073 | 0.776 | 0.110 | 0.104 | |
| PHS | PHS2 | 0.079 | 0.110 | 0.048 | 0.090 | 0.059 | 0.164 | 0.054 | 0.161 | 0.069 | 0.127 | 0.148 | 0.102 | 0.804 | 0.047 |
| PHS1 | 0.168 | 0.176 | 0.112 | 0.146 | 0.146 | 0.078 | 0.117 | 0.105 | 0.083 | 0.005 | 0.091 | 0.009 | 0.790 | 0.098 | |
| SSS | SSS2 | 0.174 | 0.131 | 0.080 | 0.135 | 0.113 | 0.123 | 0.078 | 0.086 | 0.029 | 0.070 | 0.061 | 0.087 | 0.115 | 0.820 |
| SSS1 | 0.140 | 0.119 | 0.139 | 0.141 | 0.183 | 0.052 | 0.114 | 0.140 | 0.074 | 0.077 | 0.137 | 0.075 | 0.029 | 0.788 | |
EA: Economy, CU: City Uniqueness, LA: Life Quality, CA: City Attractiveness, BL: Brand Loyalty, BE: Brand Experience, CD: City Diversity, CS: Culture Service, BP: Brand Preference, ES: Education Service, OOA: Openness of City, MS: Medical Service, PHS: Physical Service, SSS: Social Welfare Service.
Appendix C. Measures of Constructs
- 1.
- Brand Experience (BE)
BE1: I think Xian has a wonderful natural environment.
BE2: I think Xian has a lot of cultural assets.
BE3: I think Xian has a lot of accommodation.
BE4: I think transportation is convenient in Xian.
BE5: I think Xian is easy to access at home and abroad.
- 2.
- Brand Preference (BP)
BP1: I think Xian has high recognition at home and abroad.
BP2: I think Xian is highly recognized as a tourist destination.
BP3: I think Xian has differentiating characteristics from other cities
- 3.
- Brand Loyalty (BL)
BL1: I think I am well aware of Xian.
BL2: I am proud to live in Xian.
BL3: I tend to invite a lot of people to Xian.
BL4: I think Xian is suitable as a cultural city.
BL5: I think Xian is a good place to realize my dream.
- 4.
- City Attractiveness (CA)
CA1: I think Xian has a lot of cultural and artistic tourism events.
CA2: I think Xian is rich in cultural resources.
CA3: I think Xian has many attractions.
CA4: I think Xian has many specialties
CA5: I think Xian has a lot of interesting places.
- 5.
- City Uniqueness (CU)
CU1: I think Xian is famous.
CU2: I think Xian has a unique cultural heritage.
CU3: I think Xian has unique food.
CU4: I think Xian has a unique memorable environment.
CU5: I think Xian has a unique tradition.
- 6.
- City Diversity (CD)
CD1: I think Xian has a good cultural atmosphere.
CD2: I think economic development in Xian is rapid.
CD3: I think Xian is a multicultural city.
CD4: I think Xian has many cultural facilities.
- 7.
- Urban Service (US)
US1: I think Xian is rich in educational resources.
US 2: I think education resources in Xian are average.
US 3: I think higher education is concentrated in Xian
US 4: I think Xian is rich in medical resources.
US5: I think medical resources in Xian are average.
US6: I think Xian has a high proportion of health insurance.
US7: I think Xian has a lot of cultural space and cultural activities.
US8: I think there are many free cultural facilities in Xian.
US9: I think cultural resources in Xian are average.
US10: I think there are many sports facilities in Xian.
US11: I think sports facilities in Xian are average.
US12: I think there are many welfare facilities in Xian.
US13: I think the welfare facilities in Xian are average.
- 8.
- Life Quality (LA)
LA1: I think my life in Xian is generally happy.
LA2: I think I am currently living in Xian under good living conditions.
LA3: I feel at ease in Xian and rarely worry.
LA4: I have few financial problems with my life in Xian.
LA5: Xian helps me live a meaningful and fulfilling life.
- 9.
- Economy (EA)
EA1: I think the industrial structure of Xian is well established.
EA2: I think Xian has a growing economically active population.
EA3: I think Xian is a good environment to invest in.
EA4: I think Xian has a good home economy.
EA5: I think Xian is a good city for businesses to run.
EA6: I think the market economy in Xian works well.
- 10.
- Openness of city (OOA)
OOA1: I think it is easy to obtain information about the Xian.
OOA2: I think Xian has good city exchanges at home and abroad.
OOA3: I think Xian is doing a good job of promoting it externally.
References
- Garcia, B. Deconstructing the city of culture: The long-term cultural legacies of Glasgow 1990. Urban Stud. 2005, 42, 841–868. [Google Scholar] [CrossRef]
- Mihalis, K. Branding the city through culture and entertainment. J. Aesop 2005, 5, 1–7. [Google Scholar]
- Florida, R. Who’s Your City? How the Creative Economy Is Making Where to Live the Most Important Decision of Your Life; Basic Books: New York, NY, USA, 2008. [Google Scholar]
- Sasaki, M. Urban regeneration through cultural creativity and social inclusion: Rethinking creative city theory through a Japanese case study. Cities 2010, 27, S3–S9. [Google Scholar] [CrossRef]
- Ferlie, E.; McLaughlin, K.; Osborne, S.P. New Public Management: Current Trends and Future Prospects; Routledge: London, UK, 2001. [Google Scholar]
- Aaker, D.A. Measuring brand equity across products and markets. Calif. Manag. Rev. 1996, 38. [Google Scholar] [CrossRef]
- Shafranskaya, I.; Potapov, D. An empirical study of consumer-based city brand equity from signalling theory perspective. Place Branding Public Dipl. 2014, 10, 117–131. [Google Scholar] [CrossRef]
- Jensen, O.B. Culture stories: Understanding cultural urban branding. Plan. Theor. 2007, 6, 211–236. [Google Scholar] [CrossRef]
- Bayliss, D. The rise of the creative city: Culture and creativity in Copenhagen. Eur. Plan. Stud. 2007, 15, 889–903. [Google Scholar] [CrossRef]
- Rosenstein, C. Cultural development and city neighborhoods. City Cult. Soc. 2011, 2, 9–15. [Google Scholar] [CrossRef]
- Scott, A.J. Cultural economy and the creative field of the city. Geogr. Ann. Ser. B Hum. Geogr. 2010, 92, 115–130. [Google Scholar] [CrossRef]
- Fan, B.; Yang, W.; Han, T. Impact of basic public service level on pro-environmental behavior in China. Int. Sociol. 2018, 33, 738–760. [Google Scholar] [CrossRef]
- Luozhong, W.; Fan, L. Basic Public Cultural Services in China: Construction of Index System and Measurement of Regional Disparity. Comp. Econ. Soc. Syst. 2013, 1, 184–195. [Google Scholar]
- Sharp, E.B. Urban. Politics and Administration: From Service Delivery to Economic Development; Addison-Wesley Longman Limited: New York, NY, USA, 1990. [Google Scholar]
- Raggio, R.D.; Leone, R.P. Chasing brand value: Fully leveraging brand equity to maximise brand value. J. Brand Manag. 2009, 16, 248–263. [Google Scholar] [CrossRef]
- Lucarelli, A. Unraveling the complexity of “city brand equity”: A three-dimensional framework. J. Place Manag. Dev. 2012, 5. [Google Scholar] [CrossRef]
- Tiwari, M.K. Separation of brand equity and brand value. Glob. Bus. Rev. 2010, 11, 421–434. [Google Scholar] [CrossRef]
- Raggio, R.D.; Leone, R.P. The theoretical separation of brand equity and brand value: Managerial implications for strategic planning. J. Brand Manag. 2007, 14, 380–395. [Google Scholar] [CrossRef]
- Ambler, T.; Barwise, P. The trouble with brand valuation. J. Brand Manag. 1998, 5, 367–377. [Google Scholar] [CrossRef]
- Clifton, R. Brands and Branding; John Wiley & Sons: New York, NY, USA, 2009. [Google Scholar]
- Chandon, P. Note on Measuring Brand Awareness, Brand Image, Brand Equity and Brand Value; Insead: Fontainebleau, France, 2003. [Google Scholar]
- Holbrook, M.B.; Hirschman, E.C. The experiential aspects of consumption: Consumer fantasies, feelings, and fun. J. Consum. Res. 1982, 9, 132–140. [Google Scholar] [CrossRef]
- Schmitt, B. The Concept of Brand Experience. J. Brand Mang. 2009, 16, 417–419. [Google Scholar] [CrossRef]
- Zarantonello, L.; Schmitt, B.H.; Brakus, J.J. Development of the brand experience scale. Adv. Consum. Res. 2007, 34, 580. [Google Scholar]
- Hellier, P.K.; Geursen, G.M.; Carr, R.A.; Rickard, J.A. Customer repurchase intention. Eur. J. Mark. 2003. [Google Scholar] [CrossRef]
- Kotler, P. Marketing’s new paradigms: What’s really happening out there. Plan. Rev. 1992. [Google Scholar] [CrossRef]
- Percy, L.; Rossiter, J.R. A model of brand awareness and brand attitude advertising strategies. Psychol. Market. 1992, 9, 263–274. [Google Scholar] [CrossRef]
- Coelho, P.S.; Rita, P.; Santos, Z.R. On the relationship between consumer-brand identification, brand community, and brand loyalty. J. Retail. Consum. Serv. 2018, 43, 101–110. [Google Scholar] [CrossRef]
- Pompe, A. City brand in the eyes of values. Adv. Bus. Relat. Sci. Res. J. 2017, 8, 9–22. [Google Scholar]
- Florek, M. Measurement of city brand equity. Actual Probl. Econ. 2012, 133, 130–139. [Google Scholar]
- Anholt, S. The Anholt-GMI city brands index: How the world sees the world’s cities. Place Brand. 2006, 2, 18–31. [Google Scholar] [CrossRef]
- Cooke, P. Regional innovation systems: Development opportunities from the ‘green turn’. Tecnol. Anal. Strateg. 2010, 22, 831–844. [Google Scholar] [CrossRef]
- Cooke, P. Systems of innovation and the learning region. Handb. Regional. Sci. 2021, 835–852. [Google Scholar] [CrossRef]
- Asheim, B.T.; Isaksen, A.; Trippl, M. Advanced Introduction to Regional Innovation Systems; Edward Elgar Publishing Limited: Glos, UK, 2019. [Google Scholar]
- Doloreux, D.; Parto, S. Regional innovation systems: Current discourse and unresolved issues. Technol. Soc. 2005, 27, 133–153. [Google Scholar] [CrossRef]
- Haken, H. Synergetics: Introduction and Advanced Topics; Springer Science + Business Media: Stuttgart, Germany, 2013. [Google Scholar]
- Van Den Broek, J.; Boselie, P.; Paauwe, J. Cooperative innovation through a talent management pool: A qualitative study on coopetition in healthcare. Eur. Manag. J. 2018, 36, 135–144. [Google Scholar] [CrossRef]
- Dubberly, H. On Modeling Design in the age of biology: Shifting from a mechanical-object ethos to an organic-systems ethos. Interactions 2008, 15, 35–41. [Google Scholar] [CrossRef]
- Baldwin, C.; Von Hippel, E. Modeling a paradigm shift: From producer innovation to user and open collaborative innovation. Organ. Sci. 2011, 22, 1399–1417. [Google Scholar] [CrossRef]
- Orr, M.; West, D.M. Citizens’ views on urban revitalization: The case of Providence, Rhode Island. Urb. Aff. Rev. 2002, 37, 397–419. [Google Scholar] [CrossRef]
- Horiuchi, S. Affiliative Segregation of Outsiders from a Community: Bonding and Bridging Social Capital in Hachimori-cho, Japan. Int. J. Jpn. Soc. 2008, 17, 91–100. [Google Scholar] [CrossRef]
- Onitsuka, K.; Hoshino, S. Inter-community networks of rural leaders and key people: Case study on a rural revitalization program in Kyoto Prefecture, Japan. J. Rural Stud. 2018, 61, 123–136. [Google Scholar] [CrossRef]
- Horiuchi, S.; Tatsuhiro, T. Globalization and Regional Revitalization in a Local University of Japan; Globalization: Economic, Political and Social Issues; Nova Publisher: New York, NY, USA, 2016; pp. 149–159. [Google Scholar]
- Pavlou, P.A.; Fygenson, M. Understanding and Predicting Electronic Commerce Adoption: An Extension of the Theory of Planned Behavior. MIS Q. 2006, 30, 115–143. [Google Scholar] [CrossRef]
- Chin, W.W. Issues and Opinion on Structural Equation Modeling. MIS Q. 1998, 22, 7–16. [Google Scholar]
Publisher’s Note: MDPI stays neutral with regard to jurisdictional claims in published maps and institutional affiliations. |
© 2021 by the authors. Licensee MDPI, Basel, Switzerland. This article is an open access article distributed under the terms and conditions of the Creative Commons Attribution (CC BY) license (https://creativecommons.org/licenses/by/4.0/).