Article

The Dynamic Impact of Agricultural Fiscal Expenditures and Gross Agricultural Output on Poverty Reduction: A VAR Model Analysis

1
School of Economics and Management, Changsha University, Changsha 410022, China
2
Department of Sociology, Tsinghua University, Beijing 100084, China
3
School of Economics, Renmin University of China, Beijing 100872, China
4
The Institute for Social Governance and Development, Tsinghua University, Beijing 100084, China
*
Authors to whom correspondence should be addressed.
Sustainability 2021, 13(11), 5766; https://doi.org/10.3390/su13115766
Submission received: 21 March 2021 / Revised: 7 May 2021 / Accepted: 9 May 2021 / Published: 21 May 2021

Abstract

:
China was the first developing country to achieve the poverty eradication target of the 2030 Agenda for Sustainable Development Goals (SDG) 10 years ahead of schedule. Its past approach has been, mainly, to allocate more fiscal spending to rural areas, while strengthening accountability for poverty alleviation. However, some literature suggests that poor rural areas still lack the endogenous dynamics for sustainable growth. Using a vector autoregression (VAR) model, based on data from 1990 to 2019, we find that fiscal spending plays a much more significant role in reducing the poverty ratio than agricultural development. When poverty alleviation is treated as an administrative task, each poor village must complete the spending of top-down poverty alleviation funds within a time frame that is usually shorter than that required for successful specialty agriculture. As a result, the greater the pressure of poverty eradication and the more funds allocated, the more poverty alleviation projects become an anchor for accountability, and the more local governments’ consideration of industry cycles and input–output analysis give way to formalism, homogeneity, and even complicity. We suggest using the leverage of fiscal funds to direct more resources to productive uses, thus guiding future rural revitalization in a more sustainable direction.

1. Introduction

According to the World Bank, China has lifted more than 850 million out of poverty since its reforms began in 1978, contributing over 70% to global poverty reduction [1]. China was the first developing country to reach all the Millennium Development Goals (MDG) by 2015 and achieve the poverty eradication target set out in the 2030 Agenda for Sustainable Development Goals (SDG) 10 years ahead of schedule [2]. The country has now set a five-year transition period (2021–2025) gradually shifting the policy focus from poverty alleviation to the comprehensive and holistic promotion of rural vitalization. By 2025, China’s agricultural and rural modernization is expected to make substantial progress, with a more solid agricultural foundation, a narrowing of the income gap between urban and rural residents, and the basic modernization of agriculture where conditions permit [2]. It is, therefore, necessary to sort out the factors behind China’s past triumph over poverty and analyze the dynamic impact of these variables on the effectiveness of poverty reduction at a macro level, in order to better implement future rural revitalization.
Numerous recent policy studies have reviewed China’s campaign against poverty. One of the highlights is the role of cadre residence in the targeted poverty alleviation project. The program has selected 255,000 village-based working groups and more than 3 million village committee first secretaries to be stationed in 832 impoverished counties and 128,000 poor villages to accurately identify the poor population and accompany them with tailored poverty eradication measures. Studies have shown that the match, competency, and effort of resident cadres; the scale of financial support; and the integration of top-down policy and bottom-up autonomy are important factors affecting the effectiveness of poverty eradication [1,3,4,5,6,7].
Another highlight is the ongoing financial commitment. During 2016–2019, China’s national general public budget spending on agriculture and rural areas reached RMB 6.07 trillion (approximately US$925.9 billion). This figure represents an average annual growth of 8.8%, which is higher than the growth of national fiscal expenditures. Over the years, fiscal agricultural and rural expenditures have mainly supported the supply of basic agricultural products, such as grain and pork, poverty eradication, and industrial supply-side structural reform, improvement of weak links related to agriculture and rural areas, and enhancement of the rural governance systems [8]. In the next five years, the financial input to support agriculture and rural areas will be further increased.
However, some researchers have found that, when viewed in a sustainable livelihood framework, fiscal funding at this stage have not been effective in helping poor people build the assets they need to sustain an adequate living income [9]. Similar findings have shown that infrastructure development and promotion of rural labor to urban job markets are the main drivers for poverty alleviation in poor counties in southwest China, while policy tools, such as increasing funding for rural compulsory education, training farmers to equip them with technology, financial support for the new rural cooperative health care system, and providing agricultural insurance and easy access to loans for farmers, have not been effective in alleviating poverty [10]. Other studies have recognized the importance of upgrading in agricultural value chains and other non-fiscal policies that remain inadequate in practice [8,11].
Due to the low profitability of agricultural and sideline products, the public finances of all levels of government are often determined by the level of development of the secondary and tertiary sectors. Public financing in rural areas is, therefore, often more difficult. Support for agriculture and rural areas is channeled directly through various production expenditures by the state treasury to collectives or households, and indirectly through various allocations to public enterprises and institutions, such as rural water conservancy, in addition to being financed by extrabudgetary revenues from local treasuries (such as organizational activities, depreciation funds, and budget contract balances) and low-interest loans from the financial sector. Since the abolition of agricultural taxes in 2006, grassroots governments, which used to rely on taxes and fees collected from the countryside to sustain their operations, have shifted to relying on transfers from higher levels of government, while rural societies have shifted mainly to self-governance. However, in recent years, with the implementation of targeted poverty alleviation, administrative power has been re-extended downwards with the presence of cadre residence and industrial poverty alleviation funds.
In the recent three-year (2018–2020) action plan to eliminate poverty, poverty alleviation by developing industries was treated as an administrative task and every poor village had to complete the spending of top-down industrial poverty alleviation funds within a certain time frame. However, in terms of industry cycles, it takes at least five to ten years for a region’s specialty agriculture to succeed, marked by the formation of a cluster of villages featuring a particular industry with brand recognition and market share. Therefore, the greater the pressure of poverty eradication assessment from the higher-level government and the more funds allocated, the more the lower-level government’s industrial poverty alleviation projects become an anchor of accountability, and the more the local governments’ consideration of industry cycles and input–output analysis gives way to formalism, homogeneity, and even complicity [12].
Various case studies have identified a number of common issues. First, although the three-year action plan has improved the rural living environment, the lack of agriculture infrastructure in less developed rural areas, such as small-scale water conservation, farmland improvement, and agricultural logistics and e-commerce, still hinders agricultural industrialization. Second, cross-regional pairing-off cooperation with various pro-consumption projects as administrative tasks masks a mismatch between supply and demand, a lack of competitiveness of products, and a homogenization of specialty agricultural capacity. Third, the strict regulation of poverty alleviation funds and the obligation to employ local poor people for enterprises using them have raised the cost of doing business, and market-oriented and efficient enterprises lack the incentive to participate in poverty alleviation projects [12,13].

2. Literature and Hypothesis Development

There are two streams of literature summarizing poverty alleviation approaches, one emphasizing exogenous factor, such as participatory poverty alleviation [14], social support network [15,16], and structuralism theory of state intervention [17,18,19], and the other emphasizing endogenous developments, such as economic growth [20], agriculture industrialization [21,22,23,24], cultural tourism development [25,26,27], and technological advances in agriculture [28]. Exogenous drivers, such as national systems and top-down policies, play a crucial role in poverty alleviation, but, as some literature suggests, rural poor areas still lack endogenous dynamics for sustainable growth. Recently, many scholars have started to focus on the issue of long-term mechanism for rural revitalization, which supports that agricultural fiscal expenditures are not sustainable despite their short-to medium-term effectiveness [29,30,31]. The existing literature on the prevalence of a lack of sustainable endogenous development in less developed rural areas is either based on case studies in poor villages or static analyses in selected rural areas, and there are few empirical researches using macroeconomic indicators from a holistic and dynamic perspective. One of the studies used least squares regression to empirically analyze the effect of fiscal policy on agriculture and agricultural economic growth [32], but it did not address the issue of poverty alleviation. This paper is one of the first attempts to empirically analyze the factors affecting the effectiveness of China’s poverty eradication approaches and their dynamic relationships at the macro level.
As shown in Figure 1, from a macroeconomic perspective, poverty alleviation strategies, such as agricultural tax abolition, investment in rural infrastructure, microfinance loans, and interest subsidies for poor households, targeted poverty alleviation through relocation, education, technical assistance, health promotion, photovoltaic power generation and e-commerce, and pairing-off cooperation all involve agricultural fiscal expenditures at one level of government or another at some point. These approaches can be categorized as exogenous financial support to agriculture and rural areas. On the other hand, the opening up of agricultural markets, the development of agricultural industries, the advancement of agricultural technology, and the diversified business activities of rural poor households can be categorized as endogenous development of impoverished rural areas. A body of literature shows that industrial development in poor areas still suffers from a lack of endogenous dynamics [2,30,31].
Here, we put forth two hypotheses:
Hypothesis 1 (H1).
There is a stationary relationship between agricultural fiscal spending (exogenous factor), gross agricultural output (endogenous factor), and poverty alleviation, i.e., their basic processes and the underlying relationships among them are essentially stable.
Hypothesis 2 (H2).
Agricultural fiscal spending (exogenous factor) is statistically more significant than gross agricultural output (endogenous factor) in reducing the proportion of the population living in poverty.
We regress poverty alleviation with lagged explanatory variables including agricultural fiscal expenditure, gross agricultural product and poverty incidence using annual data from the statistical yearbook for the years 1990 to 2019. The dynamic interactions and time lags between fiscal expenditure, agricultural development, and poverty alleviation complicate our identification. To address this issue, we use a vector autoregression (VAR) model, i.e., with minimal economic assumptions, to assess the dynamics of the joint variables and the interactions between them. Our key findings are:
(1)
China’s poverty eradication efforts over the past 30 years have not seen a major shift in mechanism or intensity, but have on the whole been steady, with intensity and results commensurate with each other, and even when it has reached the most difficult populations, it has still achieved stable poverty reduction outcomes through administrative accountability and precision poverty alleviation;
(2)
As the time required for the success of the agricultural industry is much longer than the allocation and assessment cycle of financial support for agriculture, the higher the incidence of poverty and the greater the pressure to eradicate poverty, the more funds to support rural development and production, and the more poverty alleviation projects become an anchor of accountability. Coupled with the fact that these areas are often poorly endowed, local governments’ consideration of industrial cycles and input-output analysis has given way to formalism, homogeneity, and even complicity, and the endogenous impetus for agricultural development remains insufficient. Overall, fiscal spending has played a much greater role in reducing poverty rates than agricultural development.
The rest of the article is outlined as follows. Section 3 discusses the data and research methods. Section 4 presents our empirical tests and result analyses. Section 5 discusses the results, and Section 6 concludes the article.

3. Materials and Methods

3.1. Data

Our analysis is based on data from statistical yearbook complied by National Bureau of Statistics of China from 1990 to 2019. The statistical yearbook contains financial support for agricultural used by governments at all levels, including expenditure for capital construction on agricultural public enterprises and institutions, utility fees, and the science and technology promotion fees. It also contains data on funds used to support rural development and production, such as subsidies for small farmland water conservancy and soil and water conservation, funds to support rural production organizations, subsidies for rural agricultural technology promotion and plant protection, subsidies for rural pasture and livestock protection, subsidies for rural afforestation and forestry protection, and subsidies for rural aquaculture. The Bureau of Statistics also compile statistics on gross agricultural product and nationwide rural poverty incidence by year.

3.2. Variables

In order to reveal the dynamic relationship between agricultural fiscal expenditure at all levels, gross agricultural output and the effectiveness of poverty alleviation, we transformed data into three variables, among which, agricultural fiscal expenditure (ZFTR) includes expenditures on agricultural production and administration, appropriations for capital construction, new product promotion funds, rural relief funds, and others, gross agricultural output (NYCZ) is the total output value of agriculture, forestry, animal husbandry, and fishery, and poverty alleviation (CX) equals 1 minus poverty incidence, and then multiplied by 100. To overcome heteroskedasticity in the data and drastic data fluctuations, the values of each of the three variables were taken as logarithms.

3.3. Methods

Vector autoregression (VAR) is a multivariate forecasting algorithm that is used when two or more time series influence each other. The structure is that each variable is a linear function of past lags of itself and past lags of the other variables, and its standard form is as follows:
Xt = A0 + A1Xt−1 + …+ ApXt−p + et t = 1, 2, ...T
where Xt is the k-dimensional endogenous variable vector and p is the lag order. Ap is the k-dimensional coefficient matrix, et is the k-dimensional random error term vector which is a white noise process, i.e., its elements cannot be correlated with their respective lag terms and variables on the right side of the model. VAR model can be used to evaluate the dynamic relationship of the joint endogenous variables and the interaction among them with minimal economic assumptions [33]. The literature review shows that there is a dynamic interaction among agricultural fiscal spending, gross agricultural output and poverty alleviation. Moreover, there is a certain lag in the role of agricultural fiscal spending and agricultural output on the effectiveness of rural poverty reduction, so the VAR model can be used to reveal the dynamic relationship between these three variables.
Our aim is first to test whether there is some stationary relationship between agricultural fiscal expenditure, gross agricultural product, and poverty alleviation, i.e., whether their time series and their underlying relationships are generally stable such that no major shifts in mechanism or intensity have occurred over the past three decades. We then sort out the statistically more significant factors behind China’s poverty alleviation to see whether it is exogenous fiscal spending or endogenous development.

4. Results

4.1. Unit Root Test

To avoid the problem of spurious regressions, we need to check whether the time series are stationary, i.e., their means and variances are constant over time and do not exhibit any trending behavior. The results of the Augmented Dickey-Fuller (ADF) tests for the presence of unit root are shown in Table 1.
From Table 1, we can see that the three variables lnCX, lnZFTR, and lnNYCZ are non-stationary, but their first-order differences DlnCX, DlnZFTR, and DlnNYCZ are all stationary. This indicates that poverty alleviation, agricultural fiscal expenditure and gross agricultural output, are all integrated of order one. These variables satisfy the necessary condition for cointegration. Thus, we have the following model:
DlnCX t = α + θ 1 DlnZFTR t 1 + + θ p DlnZFTR t p + β 1 DlnNYCZ t 1 + + β p DlnNYCZ t 2 + δ 1 DlnCX t 1 + + δ p DlnCX t p + e t
where t = 1,2, ..., 30 denotes the period from 1990 to 2019, et is the error term, and θ is the coefficient of variables.
The stationary process of first-order differences in agricultural fiscal expenditure, gross agricultural output and poverty alleviation suggests that there has been no major shift in the basic characteristics of China’s agricultural industry, the tilt of fiscal policy towards it or the intensity of poverty alleviation over the past three decades.

4.2. Cointegration Test

The general assumption is that fiscal expenditure and agricultural output affect poverty reduction and therefore these variables may be cointegrated. As a result, they may lead to the estimation of a stationary variable. The Johansen cointegration test in VAR will help to test this. The initial Johansen test is a test of the null hypothesis of no cointegration against the alternative of cointegration, and the results are shown in Table 2.
As can be seen from Table 2, the null hypothesis of no cointegration, at most one cointegration and at most two cointegrations among the three variables DlnCX, DlnZFTR, and DlnNYCZ are rejected, and thus the cointegration of the three variables as in model (2) holds. This suggests that there is a stable long-term equilibrium relationship between agricultural fiscal expenditure, agricultural output, and poverty alleviation and the effectiveness of rural poverty alleviation can be explained by the past values of agricultural fiscal expenditure, agricultural output, and poverty incidence.
To further examine the stationarity of the model and to determine the optimal lags p, the AR(p) model is tested. Since AR(p) processes are VAR processes on a higher-dimensional state space, either both the AR(p) and the VAR are stationary, or neither is. A necessary condition for an AR(p) to be stationary is that all the eigenvalues of the corresponding VAR’s β matrix be inside the unit circle. As shown in Figure 2, when the lag is set from 1 to 5, all the eigenvalues are within the unit circle. However, when the lag is greater than 5, some of the eigenvalues are outside the unit circle. Combining the test results of AR(p) model and the information criterion of Akaike information criterion (AIC), Hannan Quinn information criterion (HQIC), and Schwartz information criterion (SBIC), the optimal lag length is at lag 5.
By choosing lag 5, the VAR model can be constructed and shown in Table 3. The results in Table 3 show that fiscal expenditure has a significant impact on the effectiveness of poverty reduction in the subsequent five years, but the significance of agricultural development only gradually becomes apparent after a lag of five years. In addition, the effectiveness of poverty eradication had a significant impact on itself in the subsequent two years.

4.3. Granger Causality Test

From Table 4, we can draw the following conclusions. First, with lag 1, neither DlnZFTR nor DlnNYCZ are Granger reasons for DlnCX, i.e., the effects of fiscal expenditure and agricultural output in poverty reduction cannot be fully realized in a short period of time. However, with lags from 2 to 5, both DlnZFTR and DlnNYCZ are Granger reasons for DlnCX, i.e., the effects of fiscal expenditure and agricultural output in poverty reduction have since gradually come into play, and the development of fiscal support and agricultural production can jointly contribute to the reduction in rural poverty rate.

4.4. Impulse Response Analysis

Impulse response functions can be used to further analyze the VAR model, whose main purpose is to describe the evolution of the system in reaction to a shock in one or more variables. The results of the impulse response analysis are shown in Figure 3, where the X-axis represents the time period and Y-axis represents the strength of response.
As shown in Figure 3, when DlnCX received one unit shock from itself, it caused its current increase, but after period t = 2, DlnCX quickly approached 0. It means that the impulse of DlnCX only has short-term effects to itself and that the effect of poverty reduction in rural China is relatively stable year by year.
When DlnZFTR receives one unit impact, it drives a small upward trend of DlnCX in the t = 1 to 5 period, and then remained stable. The results indicate that the agricultural fiscal support has a good impact on improving the effect of rural poverty alleviation, and the effect is relatively stable, and the promotion effect will be maintained in the longer term. However, when DlnCX was hit by DlnNYCZ, i.e., the agricultural production had a good impact on improving the effect of rural poverty alleviation, the effect was less than that of agricultural fiscal support. When DlnNYCZ was hit by DlnZFTR in the t = 1 to 5 period, it first showed a relatively large increase, then a decrease, and then remained stable. It means that in the short term, the level of agricultural development is influenced by the agricultural fiscal input, and the fluctuations are relatively large, but in the longer term, the effect remains stable.
Overall, the effects of the nine dynamics listed in Figure 3 eventually leveled off, which means that the VAR impulse response function constructed in this paper is meaningful. It can also be found that when the shock variable changed, the effect of the shocked variable needed to be adjusted after some time before its effect can be revealed.

4.5. Variance Decomposition

The variance decomposition indicates how much information each variable has about the other variables in the auto regression. In order to further understand and compare the contribution degree of fiscal policy and agricultural development on the effectiveness of rural poverty reduction, the variance decomposition can be applied, and the results are shown in Table 5.
As can be seen from Table 5, the effectiveness of rural poverty alleviation (CX) was impacted by itself only in the t = 1 period of variance decomposition, while the impact of fiscal policy (ZFTR) and agricultural development (NYCZ) on the effectiveness of rural poverty reduction only showed up at the t = 2 period of variance decomposition, with their contribution degree of 13.817% and 10.171%, respectively. Thereafter, the contribution degree of ZFTR increased, with small fluctuations, and reached its maximum value of 18.565% at the t = 7 period. Meanwhile, the contribution degree of NYCZ increased relatively slowly, reaching a maximum value of 10.205% at the t = 5 period, and its contribution degree is smaller than that of ZFTR, and the maximum difference of contribution is more than 8%.
This shows that fiscal policy and agricultural development have significant effect on the rural poverty alleviation, and the former has a stronger degree of contribution; meanwhile, under the mutual promotion of these exogenous and endogenous factors, the effectiveness of poverty reduction in rural China has continued to develop in a better direction based on its own effectiveness in the previous stage, and finally achieved the target of extreme poverty eradication for all.

5. Discussion

Recent literature has conducted comprehensive studies and reviewed China’s campaign against poverty, with the highlight being the targeted poverty alleviation project [1,3,4,5,6,7]. But from a macroeconomic perspective, poverty alleviation strategies, such as tax repeal, infrastructure investment, interest subsidies, targeted poverty alleviation, and pairing-off cooperation all involve agricultural fiscal expenditures at one level of government or another. These approaches can be categorized as exogenous financial support to agriculture and rural areas. The opening up of markets, the development of agricultural industries, the advancement of agricultural technology can be categorized as endogenous development of poor rural areas. The overall conclusion is that China’s current achievements in poverty alleviation have been driven more by exogenous fiscal policies, and the lack of sustainable endogenous development is still prevalent in poor rural areas. Our key findings from the VAR model are:
(1)
The constructed VAR model is stable, and the lag order is consistent with the empirical experiences. This suggests that China’s poverty eradication efforts over the past 30 years have not seen a major shift in mechanism or intensity, but have on the whole been steady, with intensity and results commensurate with each other, and even when it has reached the most difficult populations, it has still achieved stable poverty reduction outcomes through administrative accountability and precision poverty alleviation;
(2)
The Granger causality test finds that agricultural fiscal policy at all levels and agricultural development have strong contributions to the effectiveness of rural poverty alleviation. However, conversely, the feedback of achievements of poverty reduction does affect central and local governments’ decisions on fiscal policy and levels of agricultural development in the short run. This suggests that China’s campaign against poverty is based on a longer-range objective, with the aim of significantly reduce disparities in urban-rural development. This conclusion is consistent with what the data on agricultural fiscal expenditures and the gross output of agriculture, forestry, animal husbandry, and fishery industry in the statistical yearbook show. In reality, the increase in government inputs to support agriculture and the growth in agricultural output will obviously promote the effectiveness of poverty alleviation in poor areas, but the effectiveness of poverty alleviation in poor areas does not necessarily promote or reduce the increase in government inputs or the growth in agricultural output value, the latter two being determined by multiple factors;
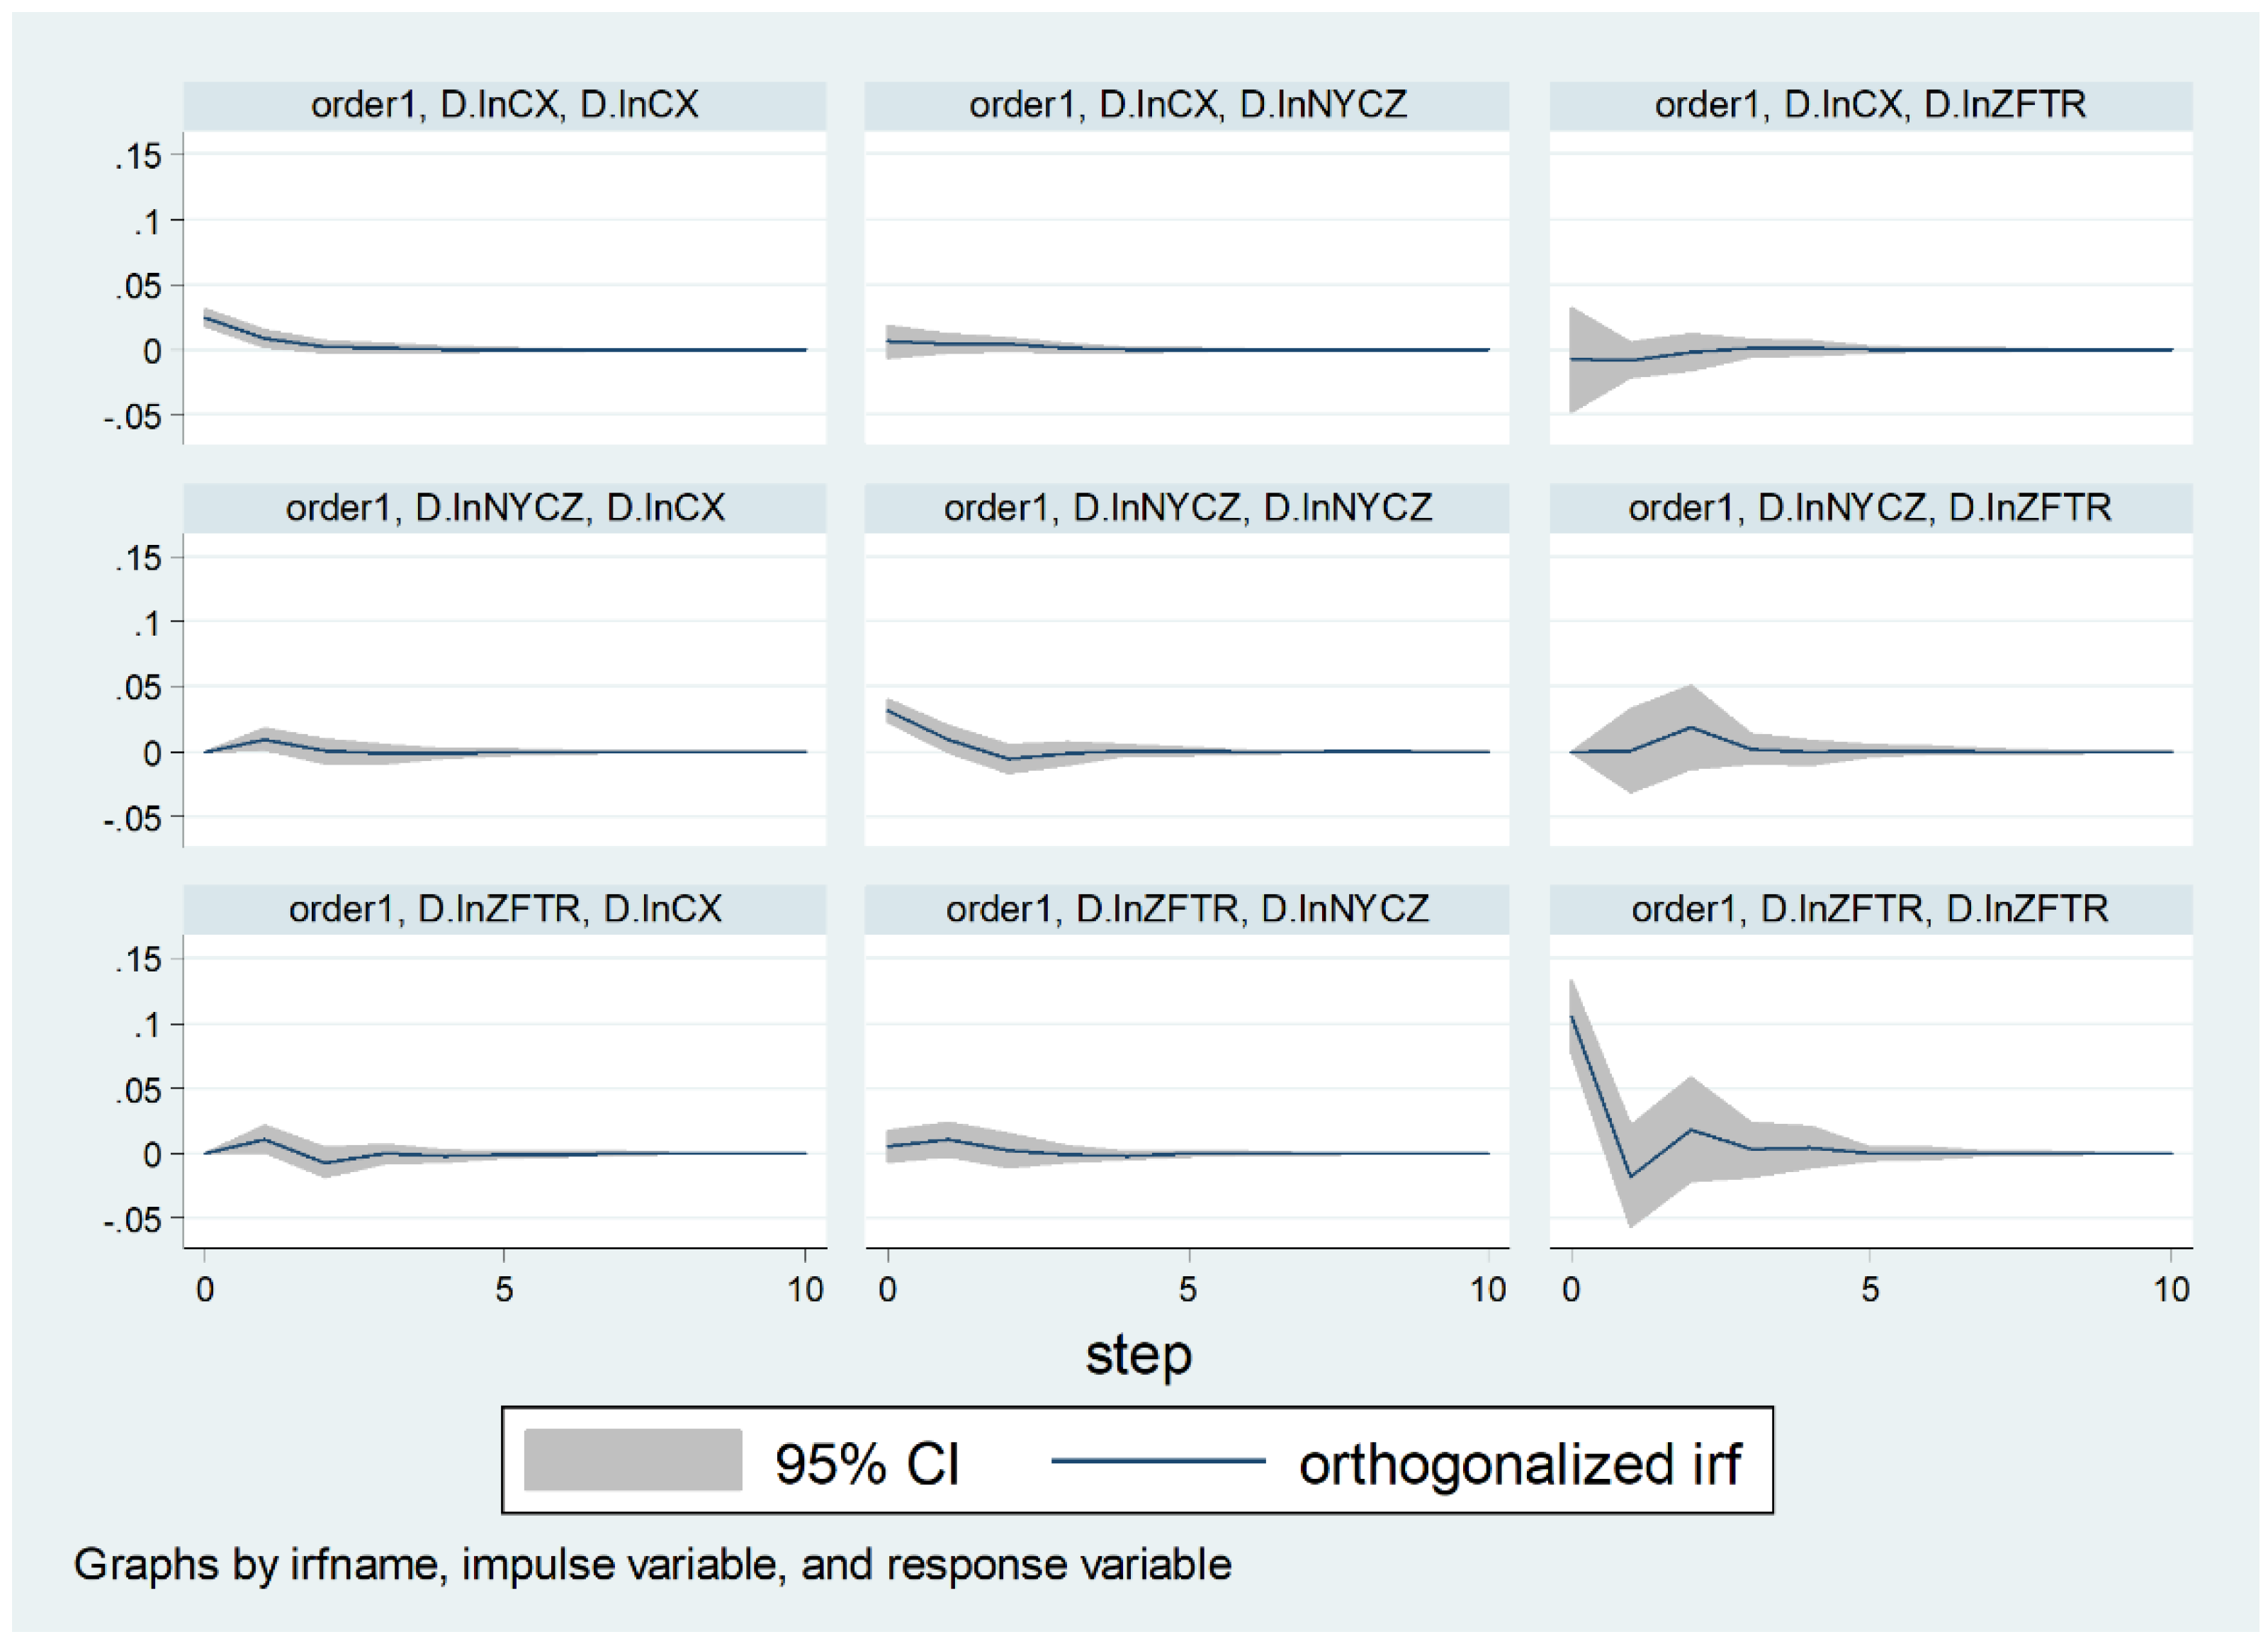
(3)
Impulse response analysis finds that the effects of fiscal inputs and the level of agricultural development on the effectiveness of rural poverty reduction are stable in the long run, although there are some small fluctuations in the short run. Meanwhile, the level of agricultural development in the short run is influenced by the agricultural fiscal support, and this influence is also stable in the long run. Therefore, it can be said that the increasing government financial support to agriculture and the continuous development of agricultural production are the key factors to promote the effectiveness of rural poverty alleviation;
(4)
Variance decomposition finds that the short-term effectiveness of poverty alleviation was continuously improved on the basis of previous effectiveness, but in the long run, fiscal spending has played a significantly larger role. In other words, the effectiveness of rural poverty alleviation relies heavily on the external factor of financial support from governments at all levels, while the endogenous development of agricultural production and rural areas plays a much less significant role. This confirms with the literature that China’s current achievements in poverty eradication have been driven more by exogenous fiscal policies, and the lack of sustainable endogenous development is still prevalent in poor rural areas.

6. Conclusions

China’s approach to poverty alleviation has been mainly to allocated more fiscal spending to rural areas, while strengthening accountability for poverty alleviation. However, some literature suggests that poor rural areas still lack the endogenous dynamics for sustainable growth. Using a VAR model based on data from 1990 to 2019, We find that China’s poverty eradication efforts over the past 30 years have not seen a major shift in mechanism or intensity, and that fiscal spending plays a much more significant role in reducing the poverty ratio than agricultural development.
As the time required for the success of the agricultural industry is much longer than the allocation and assessment cycle of financial support for agriculture, the higher the incidence of poverty and the greater the pressure to eradicate poverty, the more funds to support rural development and production, and the more poverty alleviation projects become an anchor of accountability. Coupled with the fact that these areas are often poorly endowed, local governments’ consideration of industrial cycles and input–output analysis has given way to formalism, homogeneity and even complicity, and the endogenous impetus for agricultural development remains insufficient.
Therefore, in the future, it is necessary to set up a national integrated rural revitalization fund as a vehicle for investment in the agricultural industry, to develop specialty agriculture according to local conditions, to match the investment cycle with the agricultural industrialization cycle, to shift the focus of investment in rural infrastructure to production-oriented infrastructure such as agricultural water conservancy and farmland improvement and agricultural logistics and e-commerce, to establish a national information network for agricultural products to prevent the homogenization of industrial poverty alleviation, as well as to better solve the problems of adverse selection by leading enterprises and the moral hazards of agricultural workers.
This study can be further extended. Firstly, the empirical analysis can go beyond the overall impact of fiscal support for agriculture on poverty alleviation and consider fiscal expenditure on industrial poverty alleviation, education poverty alleviation and rural infrastructure to form a panel structure for multiple regression analysis. Secondly, as China’s economic structure has obvious east-west and north-south differences, the impact of fiscal spending on agriculture on poverty alleviation will vary from region to region, with some regions being essentially industrialization in the periphery and others being essentially modernization of agriculture, so the measure of endogenous dynamics and sustainability is not necessarily just the level of agricultural output. These issues still require further research.

Author Contributions

Conceptualization, G.Z. and C.Z.; methodology, G.Z. and S.L.; software, G.Z.; validation, S.L.; formal analysis, G.Z. and H.S.; investigation, G.Z. and C.Z.; resources, G.Z. and S.L.; data curation, G.Z. and S.L.; writing—original draft preparation, G.Z.; writing—review and editing, H.S.; visualization, G.Z.; supervision, C.Z.; project administration, G.Z. All authors have read and agreed to the published version of the manuscript.

Funding

This research was funded by the National Social Science Foundation of China grant number 18VDL015 and the Social Science Foundation of Beijing grant number 15ZXB015.

Institutional Review Board Statement

Not applicable.

Informed Consent Statement

Not applicable.

Data Availability Statement

Data sharing not applicable.

Conflicts of Interest

The authors declare no conflict of interest.

References

  1. Lu, Y. The social system determines the effectiveness of poverty alleviation. Red. Flag. J. 2020, 10, 21–23. [Google Scholar]
  2. Li, S.; Li, Y.; Li, Q. From absolute poverty to relative poverty: The dynamic evolution of rural poverty in China. J. South. China Norm. Univ. 2020, 6, 30–43. [Google Scholar]
  3. Ravallion, M.; Chen, S. China’s (uneven) progress against poverty. J. Dev. Econ. 2007, 82, 1–42. [Google Scholar] [CrossRef] [Green Version]
  4. Lu, C.; Zhuang, T. A study on the competence of village-based cadres and the effect of poverty alleviation from the perspective of exact matching. J. Nanjing Agric. Univ. 2016, 5, 74–86. [Google Scholar]
  5. Tan, X. A study on the endogenous development of the poor villages: An investigation into the precise poverty alleviation in Xin village in northern Anhui Province. China’s R. Econ. 2018, 11, 48–63. [Google Scholar]
  6. Li, X.; Bai, H. Dual governmental power operation: The governance logic of rural poverty alleviation scenario—An investigation based on the practice of village poverty reduction in national poverty counties. J. Public Adm. 2019, 4, 48–62. [Google Scholar]
  7. Wang, Y.; Ding, S. The effects, experiences and challenges of poverty alleviation in ethnic areas: A case study of “three regions and three states”. J. Southwest Univ. Natl. 2020, 11, 8–16. [Google Scholar]
  8. Li, X. Practice and experience of poverty reduction in China: Effective exertion of government role. Res. Financ. Econ. 2020, 9, 14–17. [Google Scholar]
  9. Li, Z.; Wu, F. Can increasing fiscal transfers improve the quality of poverty relief: An empirical study based on livelihood resilience and CFPS data. Agric. Econ. 2020, 11, 65–76. [Google Scholar]
  10. Feng, C.; Li, H. The influencing factors and practice path of poverty alleviation in poverty-stricken counties: A comparative analysis of the quality of 6 cases in southwest China. J. Yunnan Univ. Financ. Econ. 2020, 11, 46–56. [Google Scholar]
  11. Gao, Q. Coordination of poverty alleviation and rural revitalization: Situation, task and strategic transformation. J. Renmin Univ. China 2020, 6, 29–39. [Google Scholar]
  12. Poverty Alleviation by DEVELOPING Industries, the Hardest Hit by Formalism. Available online: https://www.sohu.com/a/415659422_732417 (accessed on 1 May 2021).
  13. Problems and Suggestions for the Development of Rural Revitalization in China. Available online: https://f.qianzhan.com/xiandainongye/detail/191014-0a908f53.html (accessed on 1 May 2021).
  14. Schneider, H. Participatory governance for poverty reduction. J. Int. Dev. 1999, 11, 521–534. [Google Scholar] [CrossRef]
  15. Thorbecke, E.; Jung, H.-S. A multiplier decomposition method to analyze poverty alleviation. J. Dev. Econ. 1996, 48, 279–300. [Google Scholar] [CrossRef]
  16. Gazso, A.; Mcdaniel, S.; Waldron, I. Networks of social support to manage poverty: More changeable than durable. J. Poverty 2016, 20, 441–463. [Google Scholar] [CrossRef]
  17. Khoo, B.T. Policy Regimes and the Political Economy of Poverty Reduction in Malaysia, 1st ed.; Palgrave Macmillan: Basingstoke, UK; New York, NY, USA, 2012; p. 17. [Google Scholar]
  18. Zeller, M.; Sharma, M. Rural finance and poverty alleviation. In Food Policy Reports 8; International Food Policy Research Institute (IFPRI): Washington, DC, USA, 1998. [Google Scholar]
  19. Minten, B.; Vandeplas, A.; Swinnen, J. Regulations, brokers, and interlinkages: The institutional organization of wholesale markets in India. J. Dev. Stud. 2011, 48, 864–886. [Google Scholar] [CrossRef]
  20. Besley, T.; Burgess, R. Halving global poverty. J. Econ. Perspect. 2003, 17, 3–22. [Google Scholar] [CrossRef] [Green Version]
  21. Irz, X.; Lin, L.; Thirtle, C.; Wiggins, S. Agricultural productivity growth and poverty alleviation. Dev. Policy Rev. 2001, 19, 449–466. [Google Scholar] [CrossRef]
  22. Pingali, P. Agricultural growth and economic development: A view through the globalization lens. Agric. Econ. 2007, 37, 1–12. [Google Scholar] [CrossRef] [Green Version]
  23. Gero, A.A.; Egbendewe, A.Y.G. Macroeconomic effects of semi-subsistence agricultural productivity growth: Evidence from Benin and extension to the WAEMU countries. Sci. Afr. 2020, 7, e00222. [Google Scholar]
  24. Wang, Y.; Chen, Y.; Liu, Z. Agricultural structure adjustment and rural poverty alleviation in the agro-pastoral transition zone of northern China: A case study of Yulin city. Sustainability 2020, 12, 4187. [Google Scholar] [CrossRef]
  25. Zhao, W.; Ritchie, J.R.B. Tourism and poverty alleviation: An integrative research framework. Curr. Issues Tour. 2007, 10, 119–143. [Google Scholar] [CrossRef]
  26. Muganda, M.; Sahli, M.; Smith, K.A. Tourism’s contribution to poverty alleviation: A community perspective from Tanzania. Dev. S. Afr. 2010, 27, 629–646. [Google Scholar] [CrossRef]
  27. Shahbaz, M.; Solarin, S.A.; Azam, M.; Tiwari, A.K. Tourism-induced income distribution in Malaysia: A practical experience of a truly Asian economy. Curr. Issues Tour. 2020, 23, 2910–2929. [Google Scholar] [CrossRef]
  28. You, K.; Bianco, S.D.; Amankwah-Amoah, J. Closing technological gaps to alleviate poverty: Evidence from 17 Sub-Saharan African countries. TFSC 2020, 157, 120055. [Google Scholar] [CrossRef]
  29. Li, S.; Sicular, T.; Tarp, F. Income inequality in China: Development, transition and policy. J. Beijing Technol. Bus. Univ. 2020, 4, 21–31. [Google Scholar]
  30. Liu, W.; Li, W. Effectiveness utilization and experience transmission of poverty alleviation in rural revitalization process. J. Henan Norm. Univ. 2020, 9, 30–37. [Google Scholar]
  31. Zhang, Q. Steadily advancing the link between poverty alleviation and rural revitalization. People’s Forum 2019, 10, 84–86. [Google Scholar]
  32. Yu, H.; Fan, Y. A study on the effect of fiscal policy supporting agriculture on agricultural economic growth. J. Yangzhou Univ. 2012, 6, 23–30. [Google Scholar] [CrossRef]
  33. Cao, Z.; Li, W.; Chen, Y. A study on the relationship among intellectual property protection, intellectual property trade barriers and Sino-US trade: Based on vector autoregression and Granger causality test. Macroecon. Res. 2020, 2, 92–101. [Google Scholar]
Figure 1. A model of factors affecting the effectiveness of poverty alleviation.
Sustainability 13 05766 g001
Figure 2. Cointegration stability test diagram. (a) One—phase lag. (b) Two—phase lag. (c) Three—phase lag. (d) Four—phase lag. (e) Five—phase lag. (f) Six—phase lag.
Sustainability 13 05766 g002
Figure 3. Results of impulse response analysis.
Sustainability 13 05766 g003
Table 1. Data stationary test through augmented Dickey-Fuller (ADF) analysis.
Variables(c,t,p) 1ADF1% Critical Value5% Critical Value10% Critical ValueResult
lnCX(c,t,0)−1.422−3.723−2.989−2.625non-stationary
DlnCX(c,t,0)−10.707−3.730−2.992−2.626stationary
lnZFTR(c,t,0)0.262−3.723−2.989−2.625non-stationary
DlnZFTR(c,t,0)−5.349−3.730−2.992−2.626stationary
lnNYCZ(c,t,0)−1.026−3.723−2.989−2.625non-stationary
DlnNYCZ(c,t,0)−3.859−3.730−2.992−2.626stationary
1 In (c,t,p), c is the constant, t is the trend term, p is the lag order, and D is the first difference.
Table 2. Cointegration relationship through Johansen cointegration test.
Number of Cointegration EquationsEigenvalueTrace5% Significance Level1% Significance LevelResult
None0.8337876.070829.6835.65Rejected
At most 10.5186227.621115.4120.04Rejected
At most 20.253177.88173.766.65Rejected
Table 3. VAR model estimates with lag 5.
Lagging Explanatory VariablesCoefficient (p-Value)Lagging Explanatory VariablesCoefficient (p-Value)Lagging Explanatory VariablesCoefficient (p-Value)
L1D. lnCX0.321 ** (0.021)L1D.lnZFTR0.162 *** (0.000)L1D.lnNYCZ0.204 (0.133)
L2D. lnCX0.236 * (0.094)L2D.lnZFTR−0.061 * (0.075)L2D.lnNYCZ−0.063 (0.634)
L3D. lnCX−0.053 (0.712)L3D.lnZFTR0.070** (0.034)L3D.lnNYCZ−0.086 (0.563)
L4D. lnCX−0.041 (0.526)L4D.lnZFTR−0.069 ** (0.078)L4D.lnNYCZ0.159 (0.244)
L5D. lnCX−0.081 ** (0.010)L5D.lnZFTR−0.119 *** (0.000)L5D.lnNYCZ−0.408 *** (0.001)
Constant0.041 *** (0.004)
Note: t statistics in parentheses * p < 0.1, ** p < 0.05, *** p < 0.01.
Table 4. Causal relationship test through Granger causality analysis.
Null HypothesisLag12345
DlnZFTR is not the Granger reason for DlnCXChi-square0.31111.68713.44822.00359.594
p-value0.5770.0030.0040.0000.000
ResultAcceptRefuseRefuseRefuseRefuse
DlnNYCZ is not the Granger reason for DlnCXChi-square0.0026.8064.7558.52629.46
p-value0.9660.0330.1910.0740.000
ResultAcceptRefuseAcceptRefuseRefuse
DlnCX and DlnZFTR are not the Granger reasons for DlnNYCZ at the same timeChi-square0.31416.4517.99328.98574.615
p-value0.8550.0020.0060.0000.000
ResultAcceptRefuseRefuseRefuseRefuse
Table 5. 10-order variance decomposition of lnCX.
PeriodlnCXlnZFTRlnNYCZ
1100
20.7601190.1381720.101708
30.7208150.1832920.095893
40.7184170.182320.099262
50.7130020.1849480.10205
60.7125270.1854810.101993
70.7123810.1856510.101969
80.7123620.1856480.101991
90.7123540.1856470.101999
100.7123530.1856480.101999
Publisher’s Note: MDPI stays neutral with regard to jurisdictional claims in published maps and institutional affiliations.

