
Indicators for Measuring Intergenerational Fairness of Social Security Systems—The Case of the German Social Health Insurance


Abstract
1. Introduction
2. Methods and Data
2.1. Intertemporal Balance Sheets
2.2. Methodological Similarities and Differences
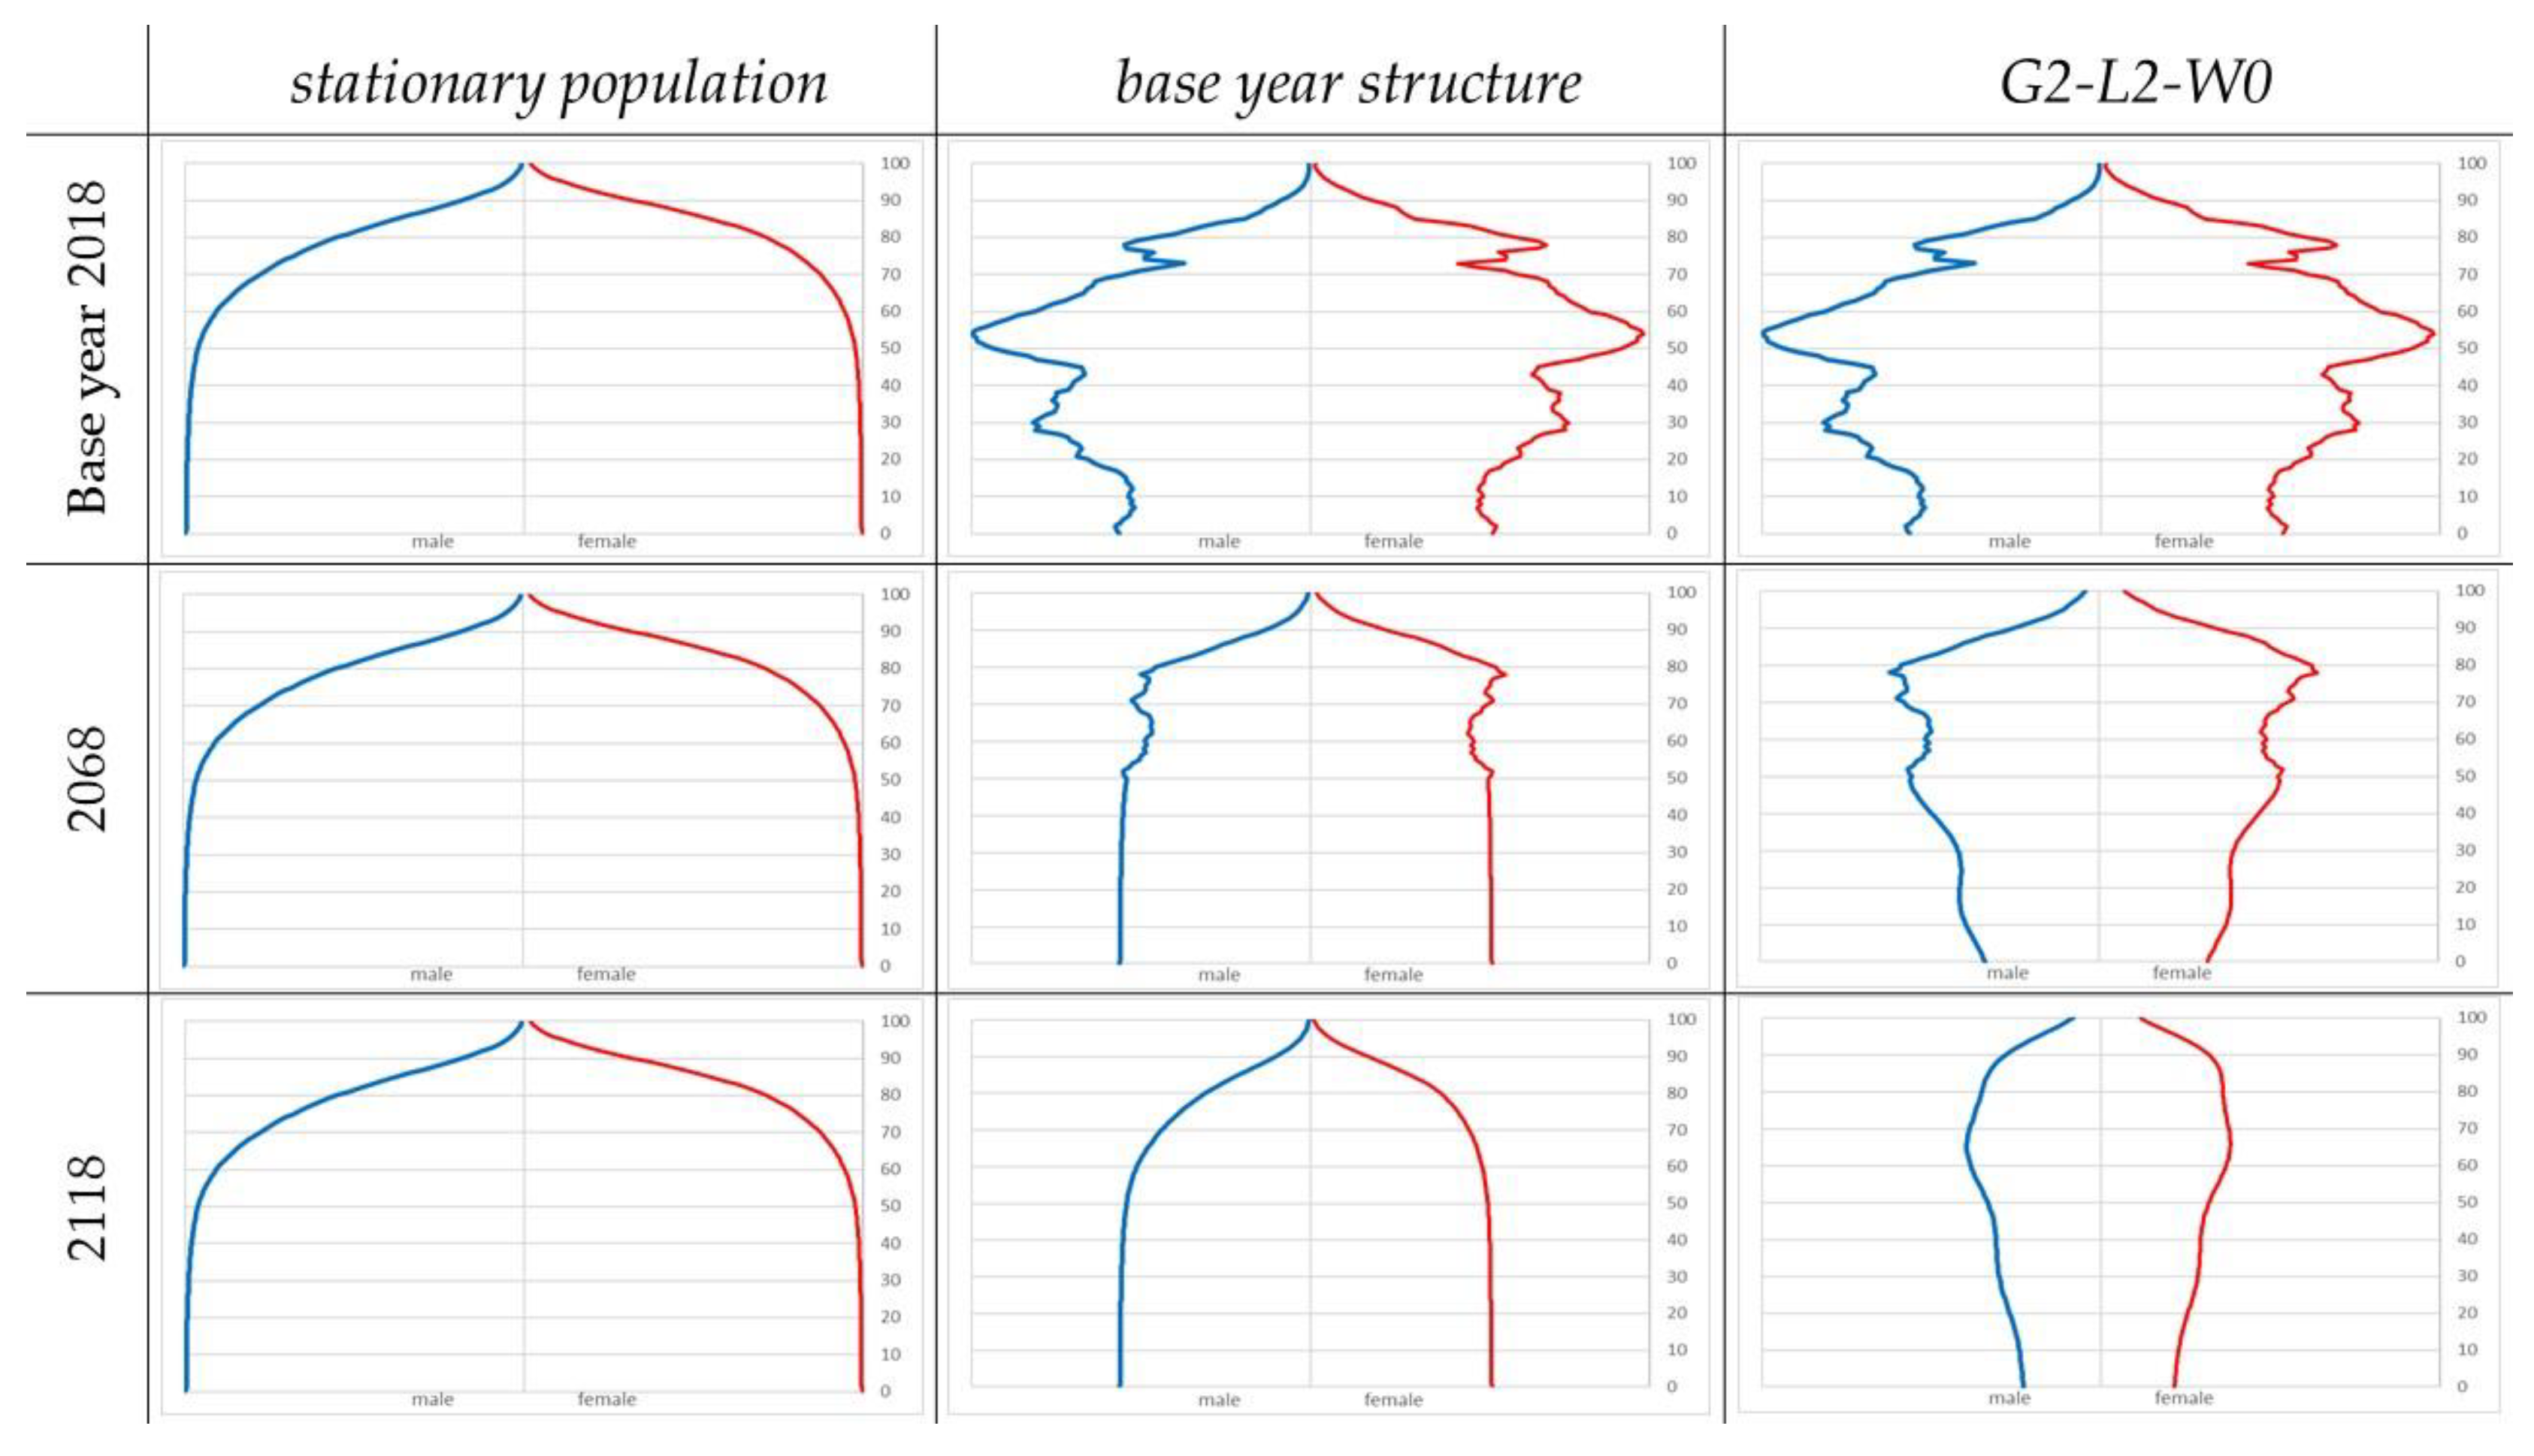
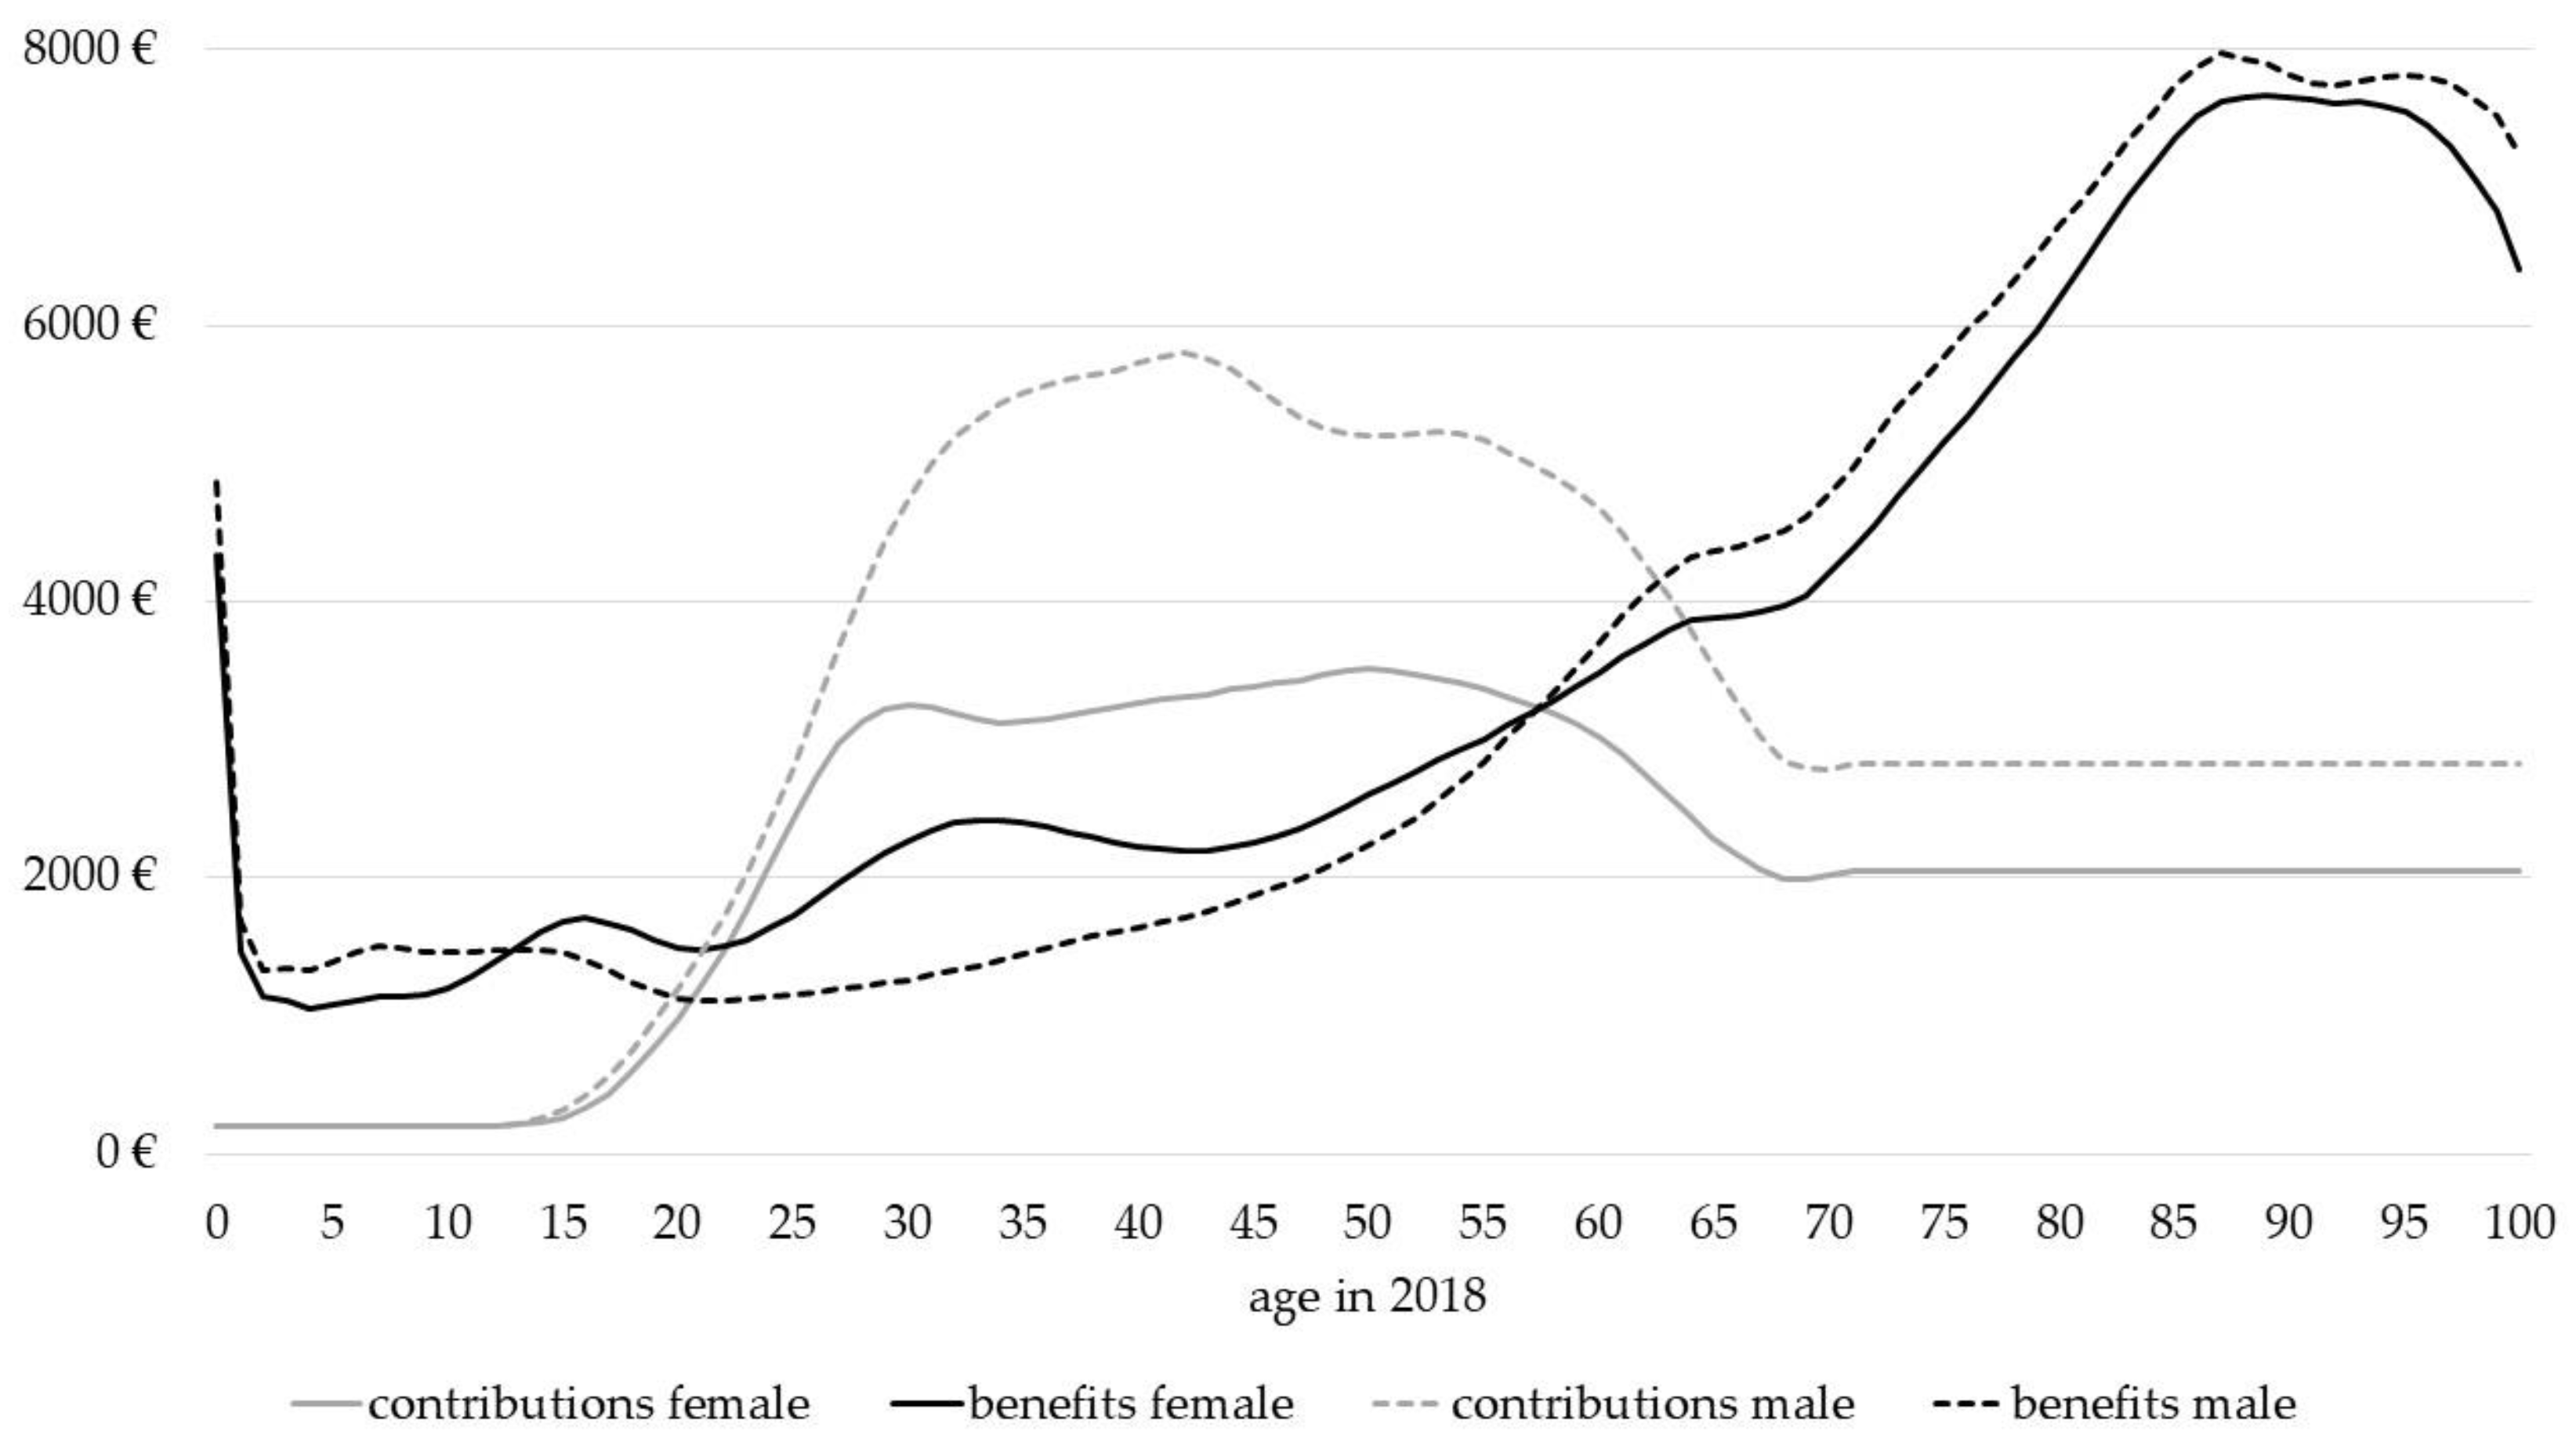
2.3. Data and Assumptions
3. Results
3.1. The “Natural” Amount of Intergenerational Redistribution
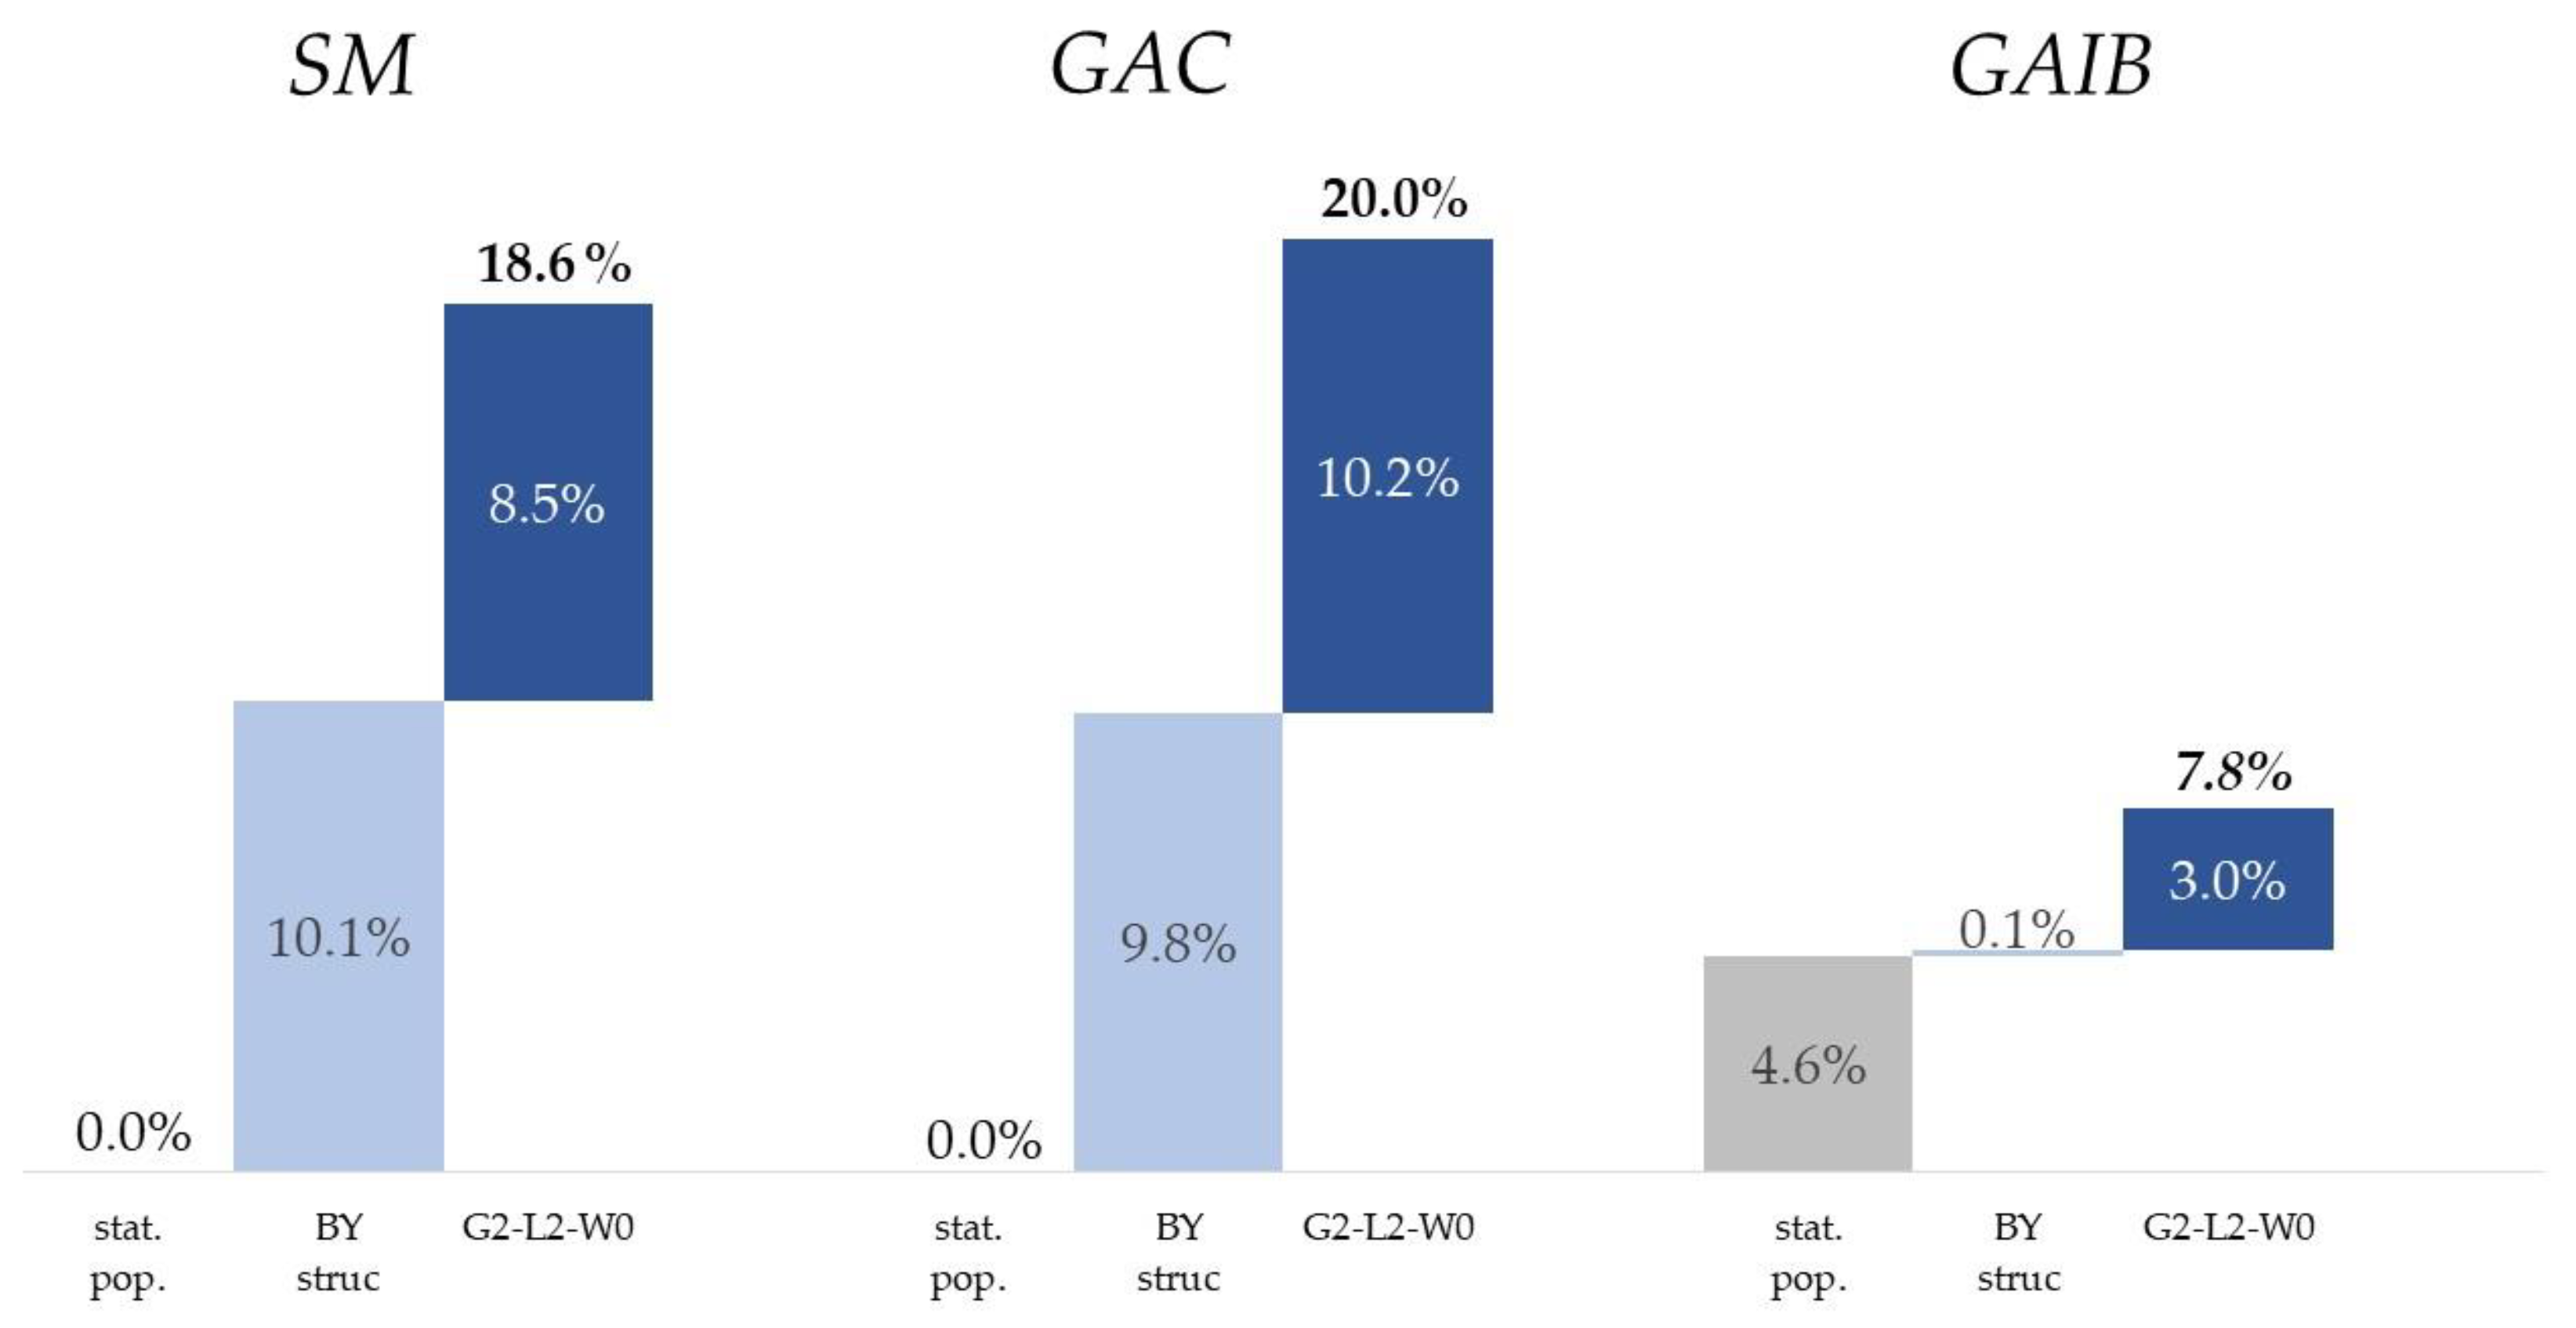
3.2. The Impact of Demographic Change on Intergenerational Redistribution
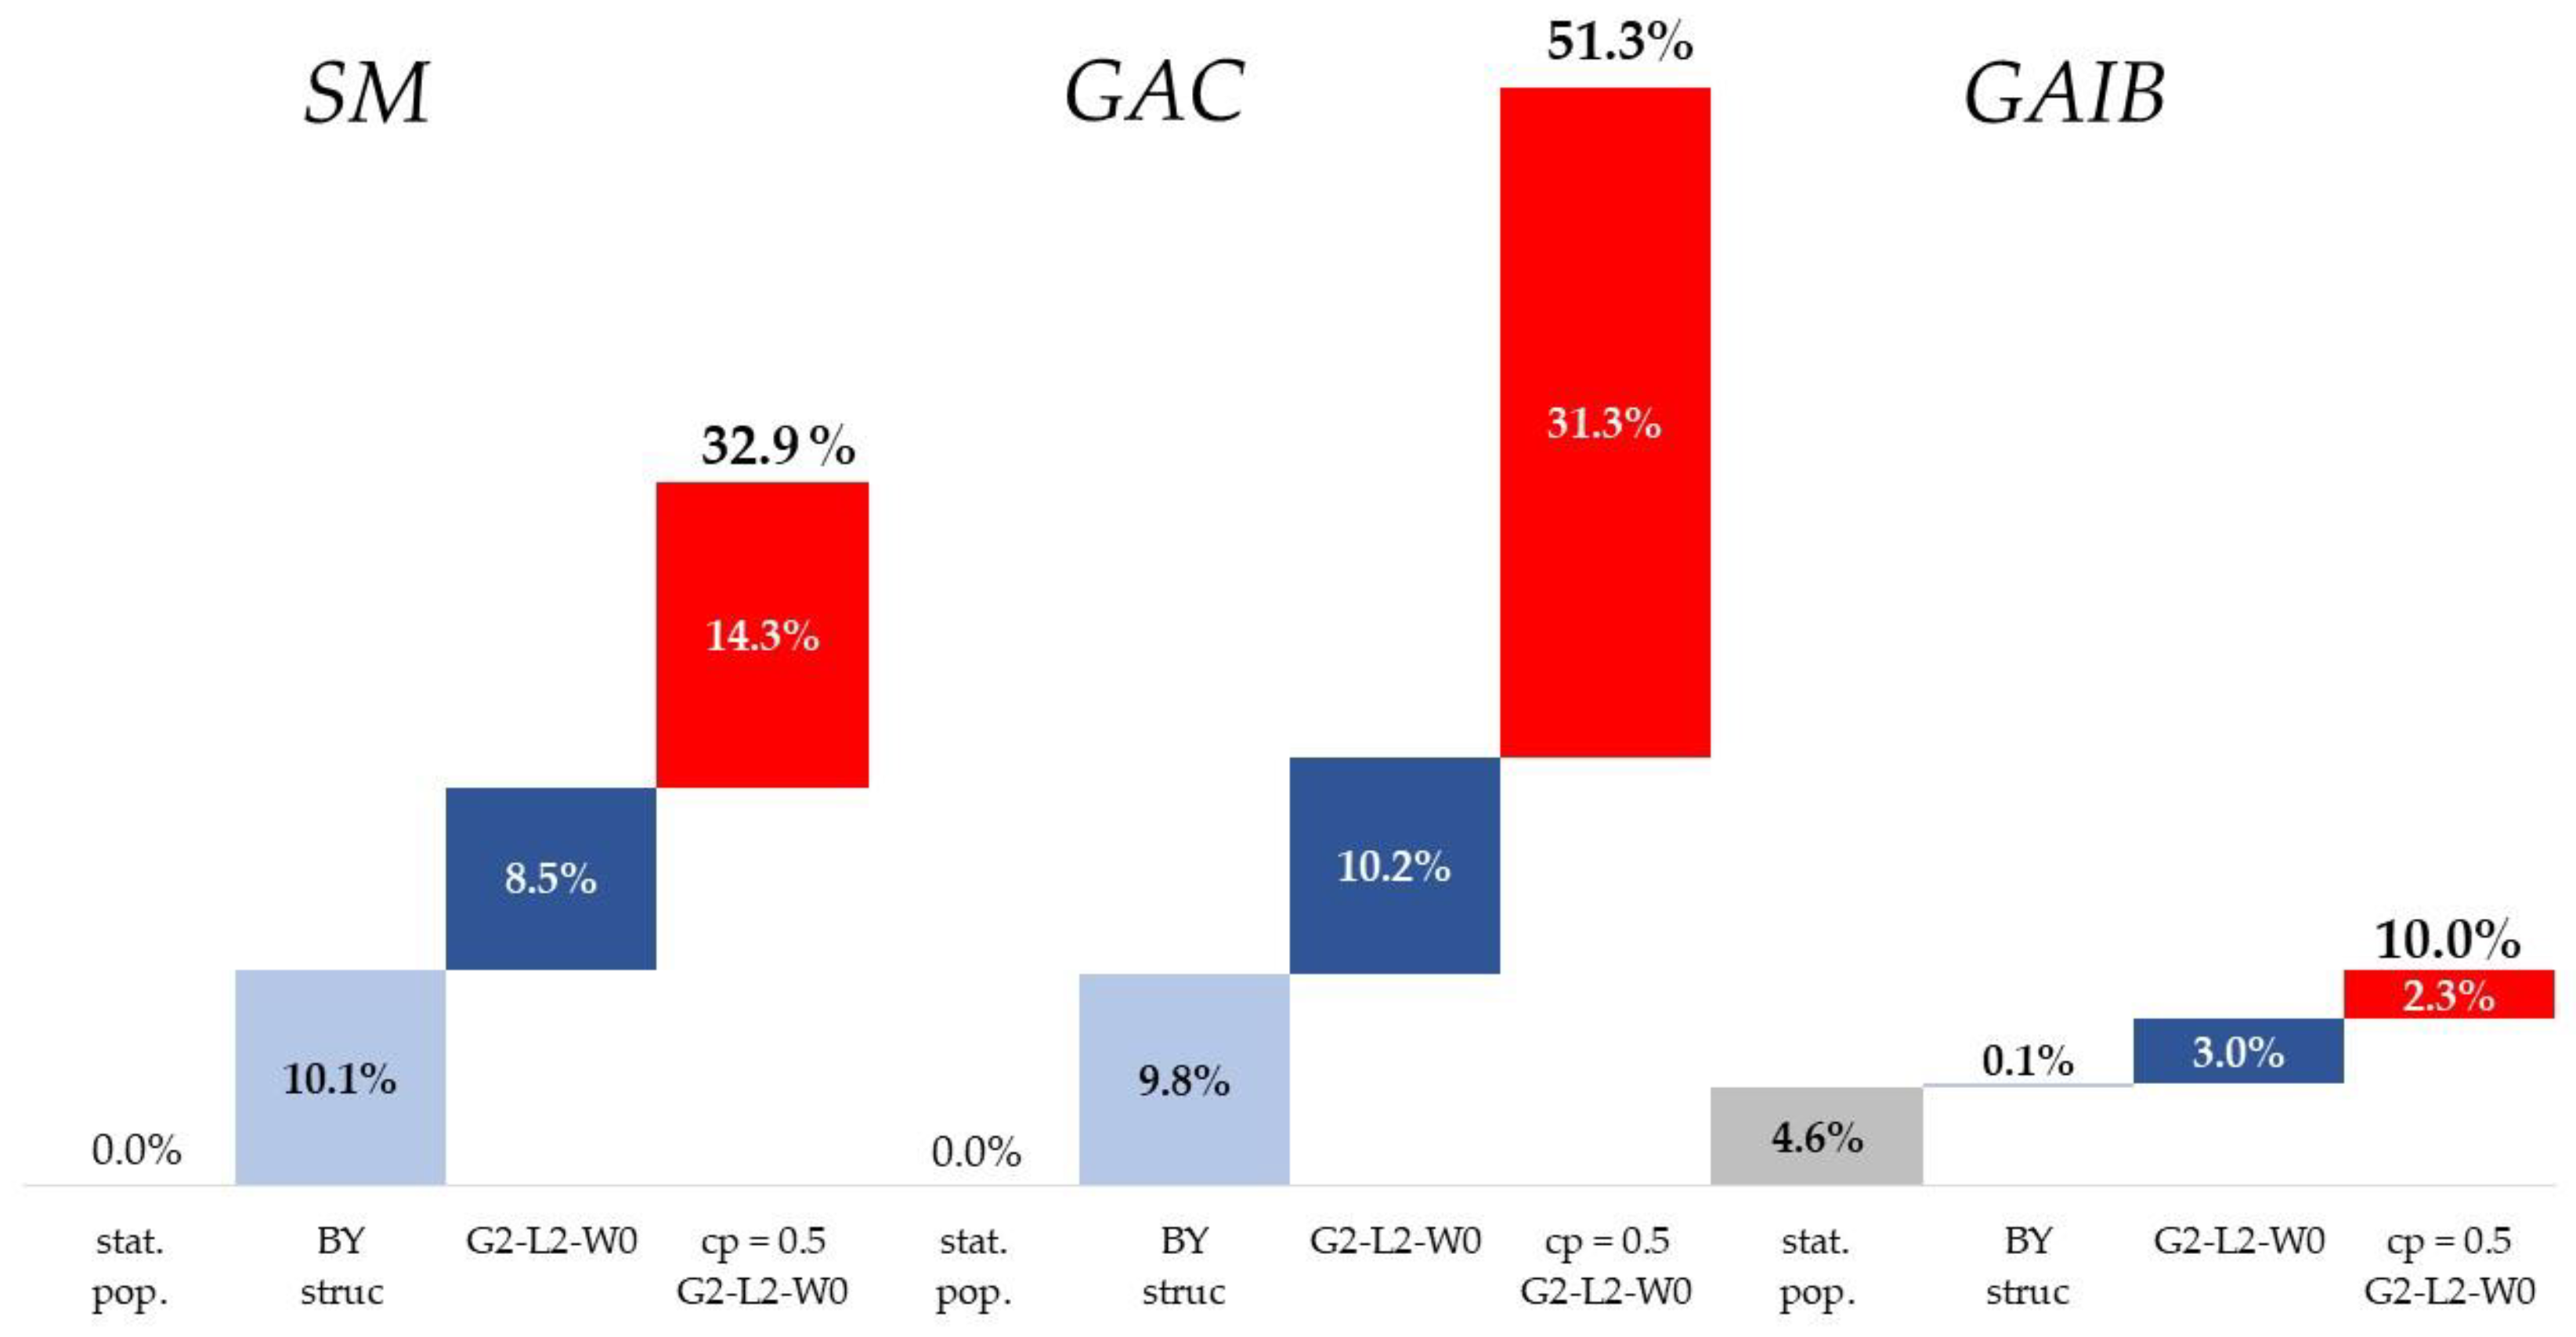
3.3. The Influence of an Ongoing Cost Pressure
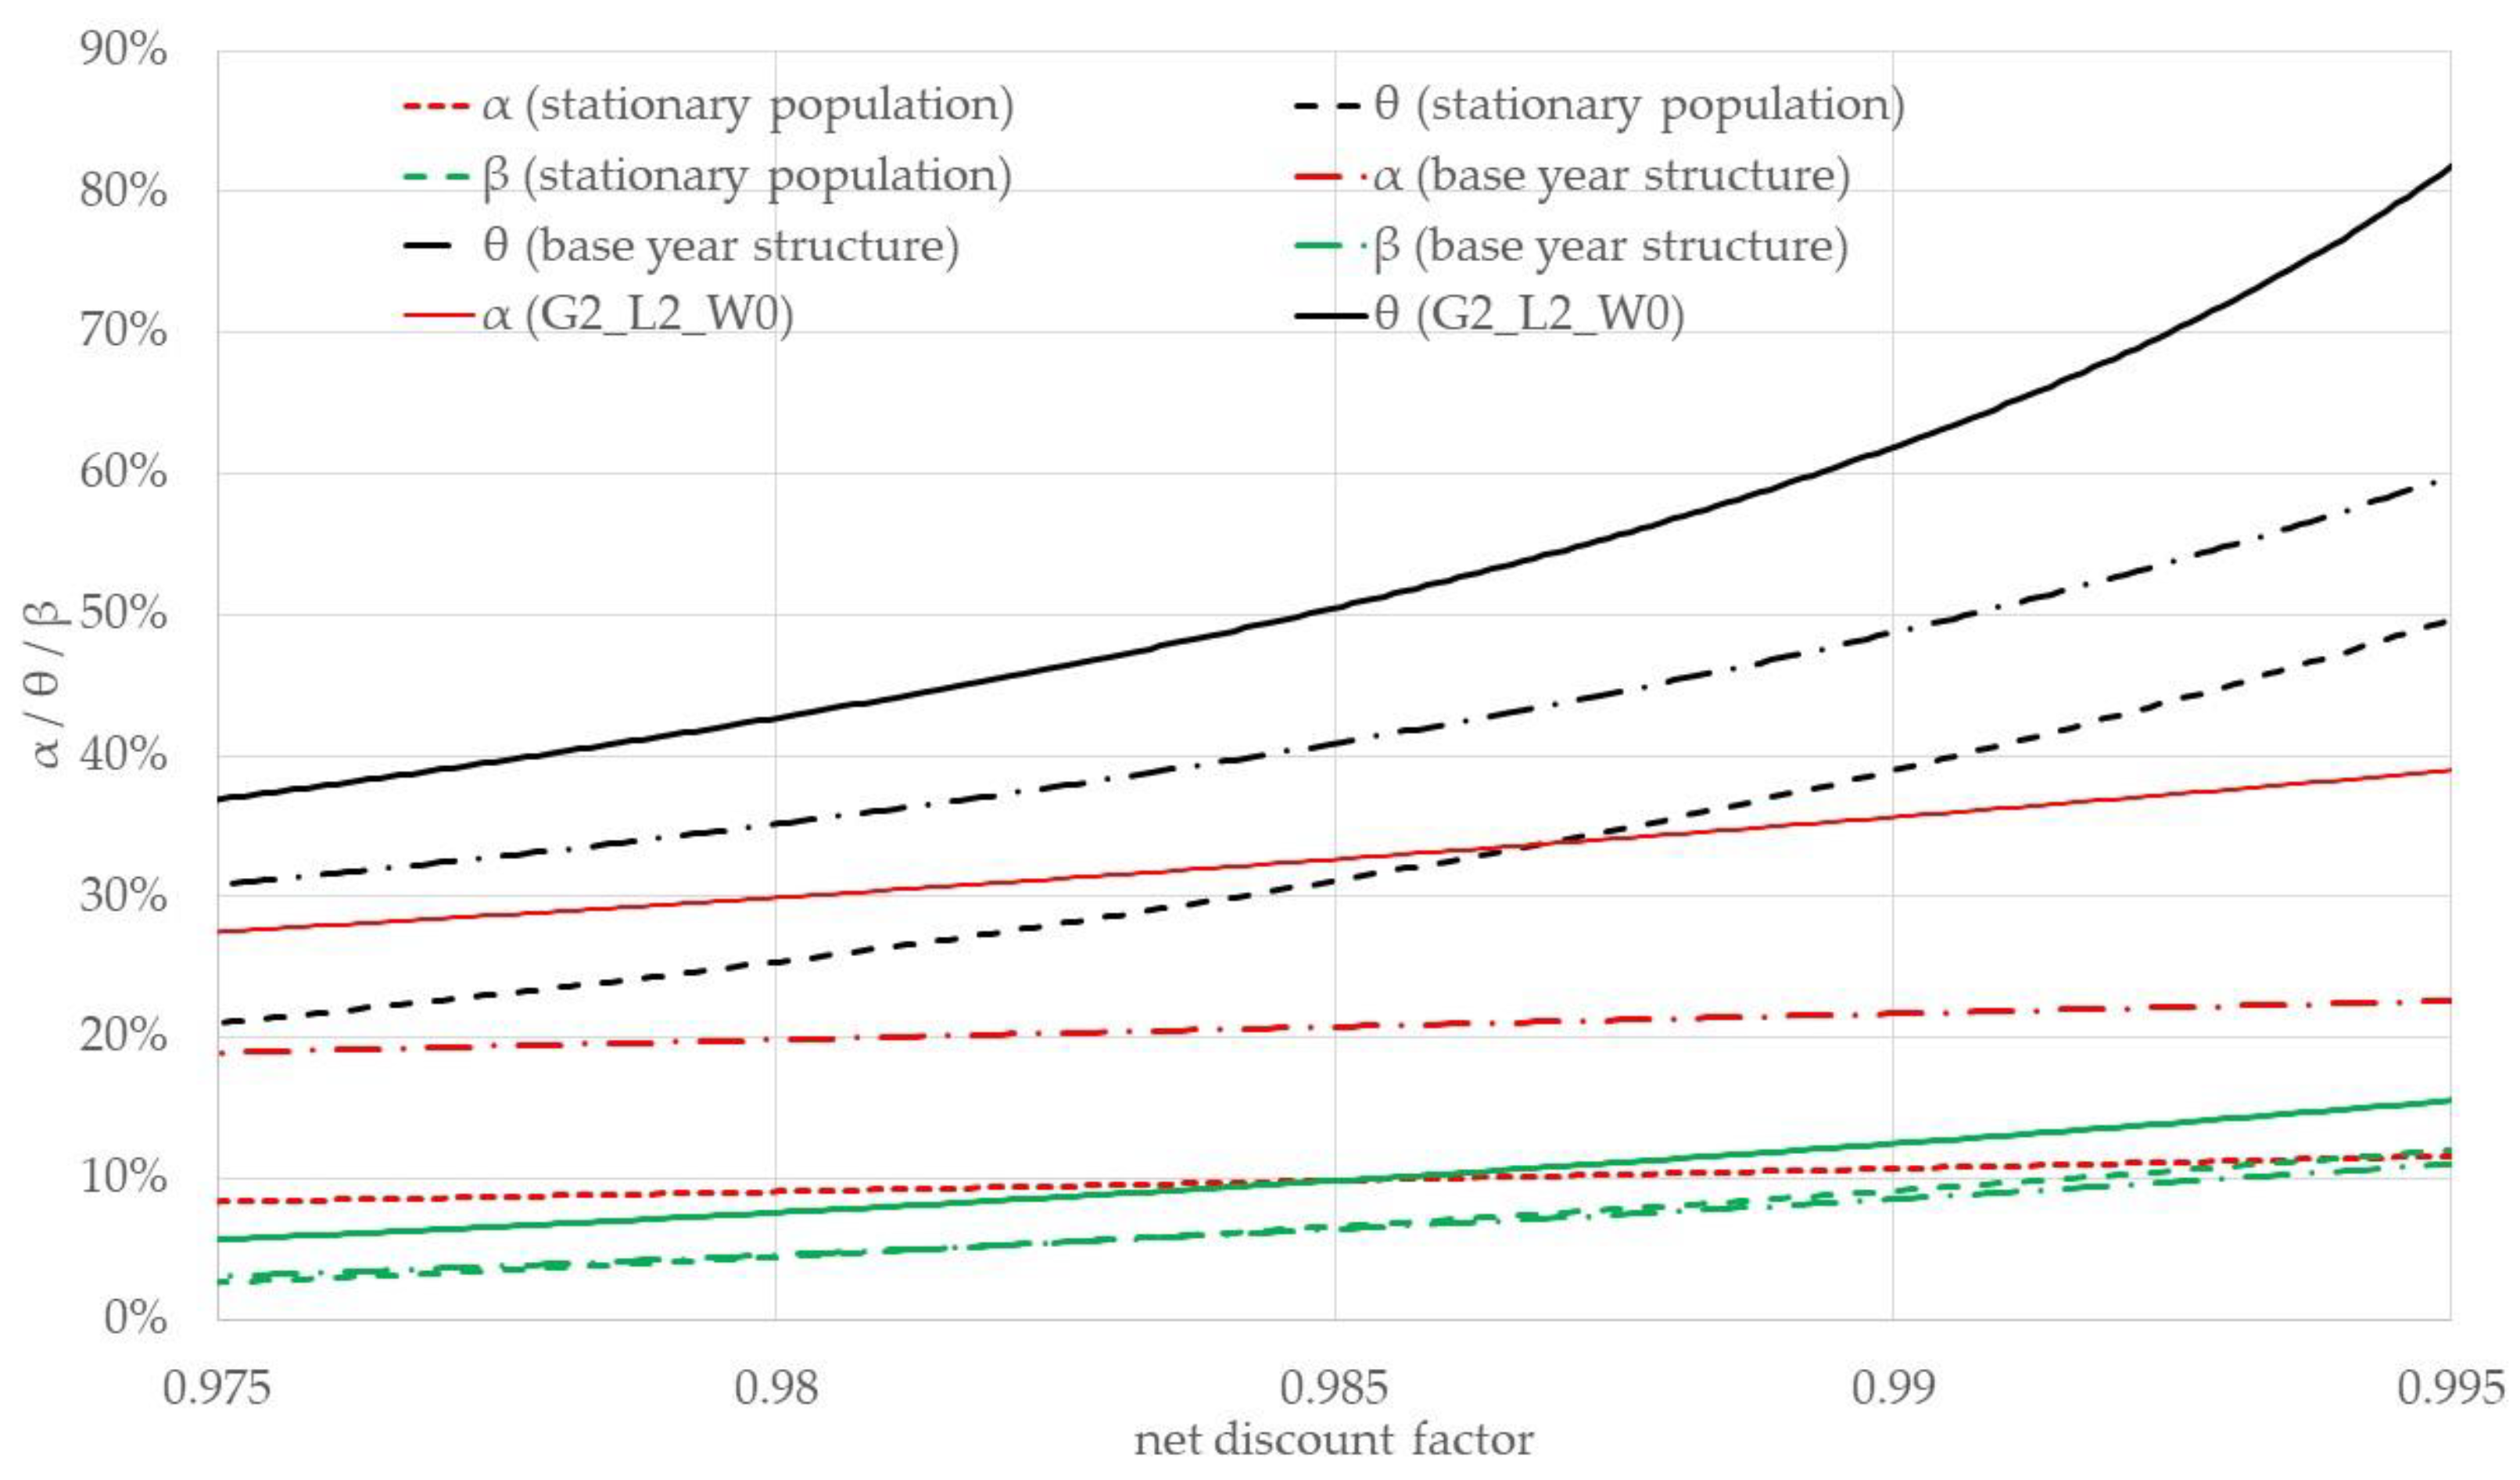
3.4. Sensitivity Analysis
4. Discussion—A Final Statement on the Three Measurement Concepts
5. Conclusions
Author Contributions
Funding
Institutional Review Board Statement
Informed Consent Statement
Data Availability Statement
Acknowledgments
Conflicts of Interest
Appendix A

Appendix B

| Stationary population, ndf = 1 | Stationary population, ndf = 0.985 | |||||||||||
| SM | GAC 1 | GAIB | SM | GAC | GAIB | |||||||
| Item | A | L | A | L | A | L | A | L | A | L | A | L |
| PVCL | 89 | 89 | 89 | 96 | 96 | 96 | ||||||
| PVBL | 100 | 100 | 100 | 100 | 100 | 100 | ||||||
| CA | 11 | 4 | ||||||||||
| PVCF | n.a. | 94 | ||||||||||
| PVBF | n.a. | 90 | ||||||||||
| PVadjCL | 0 | 0 | ||||||||||
| UF/IPL/IB | 0 | n.a. | 11 | 0 | 0 | 4 | ||||||
| α/θ/β | 0.0% | n.a. | 12.1% | 0.0% | 0.0% | 4.6% | ||||||
| Base year structure, ndf = 1 | Base year structure, ndf = 0.985 | |||||||||||
| SM | GAC | GAIB | SM | GAC | GAIB | |||||||
| Item | A | L | A | L | A | L | A | L | A | L | A | L |
| PVCL | 81 | 81 | 81 | 86 | 86 | 86 | ||||||
| PVBL | 100 | 100 | 100 | 100 | 100 | 100 | ||||||
| CA | 10 | 5 | ||||||||||
| PVCF | n.a. | 68 | ||||||||||
| PVBF | n.a. | 69 | ||||||||||
| PVadjCL | 9 | 9 | ||||||||||
| UF/IPL/IB | 9 | n.a. | 10 | 9 | 15 | 5 | ||||||
| α/θ/β | 10.1% | n.a. | 11.0% | 10.1% | 9.8% | 4.7% | ||||||
| G2_L2_W0, ndf = 1 | G2_L2_W0, ndf = 0.985 | |||||||||||
| SM | GAC | GAIB | SM | GAC 2 | GAIB | |||||||
| Item | A | L | A | L | A | L | A | L | A | L | A | L |
| PVCL | 74 | 74 | 74 | 81 | 81 | 81 | ||||||
| PVBL | 100 | 100 | 100 | 100 | 100 | 100 | ||||||
| CA | 7 | 3 | ||||||||||
| PVCF | n.a. | 40 | ||||||||||
| PVBF | n.a. | 46 | ||||||||||
| PVadjCL | 12 | 11 | ||||||||||
| UF/IPL/IB | 19 | n.a. | 13 | 16 | 24 | 7 | ||||||
| α/θ/β | 23.5% | n.a. | 15.5% | 18.6% | 20.0% | 7.8% | ||||||
| Stationary population, ndf = 1 | Stationary population, ndf = 0.985 | |||||||||||
| SM | GAC1 | GAIB | SM | GAC | GAIB | |||||||
| Item | A | L | A | L | A | L | A | L | A | L | A | L |
| PVCL | 75 | 75 | 75 | 83 | 83 | 83 | ||||||
| PVBL | 100 | 100 | 100 | 100 | 100 | 100 | ||||||
| CA | 14 | 8 | ||||||||||
| PVCF | n.a. | 82 | ||||||||||
| PVBF | n.a. | 118 | ||||||||||
| PVadjCL | 12 | 10 | ||||||||||
| UF/IPL/IB | 11 | n.a. | 13 | 9 | 53 | 6 | ||||||
| α/θ/β | 12.5% | n.a. | 15.4% | 9.9% | 31.7% | 6.8% | ||||||
| Base year structure, ndf = 1 | Base year structure, ndf = 0.985 | |||||||||||
| SM | GAC | GAIB | SM | GAC | GAIB | |||||||
| Item | A | L | A | L | A | L | A | L | A | L | A | L |
| PVCL | 69 | 69 | 69 | 76 | 76 | 76 | ||||||
| PVBL | 100 | 100 | 100 | 100 | 100 | 100 | ||||||
| CA | 12 | 7 | ||||||||||
| PVCF | n.a. | 59 | ||||||||||
| PVBF | n.a. | 91 | ||||||||||
| PVadjCL | 19 | 18 | ||||||||||
| UF/IPL/IB | 19 | n.a. | 12 | 17 | 56 | 6 | ||||||
| α/θ/β | 23.5% | n.a. | 13.9% | 20.8% | 41.5% | 6.6% | ||||||
| G2_L2_W0, ndf = 1 | G2_L2_W0, ndf = 0.985 | |||||||||||
| SM | GAC | GAIB | SM | GAC | GAIB | |||||||
| Item | A | L | A | L | A | L | A | L | A | L | A | L |
| PVCL | 62 | 62 | 62 | 70 | 70 | 70 | ||||||
| PVBL | 100 | 100 | 100 | 100 | 100 | 100 | ||||||
| CA | 8 | 5 | ||||||||||
| PVCF | n.a. | 35 | ||||||||||
| PVBF | n.a. | 60 | ||||||||||
| PVadjCL | 22 | 20 | ||||||||||
| UF/IPL/IB | 30 | n.a. | 16 | 25 | 54 | 9 | ||||||
| α/θ/β | 42.5% | n.a. | 19.0% | 32.9% | 51.3% | 10.0% | ||||||
Appendix C


References
- Auerbach, A.J.; Gokhale, J.; Kotlikoff, L.J. Generational accounts: A meaningful alternative to deficit accounting. In Tax Policy and the Economy; Bradford, D.F., Ed.; The MIT Press: Cambridge, MA, USA, 1991; Volume 5, pp. 55–110. ISBN 0-262-02295-8. [Google Scholar]
- Auerbach, A.J.; Gokhale, J.; Kotlikoff, L.J. Generational accounting: A new approach to understanding the effects of fiscal policy on saving. Scand. J. Econ. 1992, 94, 303. [Google Scholar] [CrossRef]
- Auerbach, A.J.; Gokhale, J.; Kotlikoff, L.J. Generational accounting: A meaningful way to evaluate fiscal policy. J. Econ. Perspect. 1994, 8, 73–94. [Google Scholar] [CrossRef]
- Blanchard, O.; Chouraqui, J.-C.; Hagemann, R.P.; Sartor, N. The sustainability of fiscal policy: New answers to an old question. OECD Econ. Stud. 1990, 15, 7–36. [Google Scholar]
- Gál, R.I.; Monostori, J. Economic sustainability and intergenerational fairness: A new taxonomy of indicators. Intergener. Justice Rev. 2018, 11. [Google Scholar] [CrossRef]
- Settergren, O.; Mikula, B.D. The rate of return of pay-as-you-go pension systems: A more exact consumption-loan model of interest. J. Pension Econ. Financ. 2005, 4, 115–138. [Google Scholar] [CrossRef]
- Swedish Pensions Agency. Orange Report–Annual Report of the Swedish Pension System 2019; Swedish Pensions Agency: Stockholm, Sweden, 2020. [Google Scholar]
- Vidal-Meliá, C.; del Carmen Boado-Penas, M.; Settergren, O. Automatic balance mechanisms in pay-as-you-go pension systems. SSRN Electron. J. 2009. [Google Scholar] [CrossRef]
- Vidal-Meliá, C. An assessment of the 2011 Spanish pension reform using the Swedish system as a benchmark. J. Pension Econ. Financ. 2014, 13, 297–333. [Google Scholar] [CrossRef]
- Metzger, C. An actuarial balance sheet of the Swiss old-age pension scheme: An actuarial balance sheet of the Swiss pension scheme. Int. Soc. Secur. Rev. 2018, 71, 25–49. [Google Scholar] [CrossRef]
- Metzger, C. Accounting of the German statutory pension scheme: Balance sheet, cross-sectional internal rate of return and implicit tax rate. Fisc. Stud. 2019, 40, 239–270. [Google Scholar] [CrossRef]
- Hagist, C.; Kotlikoff, L. Who’s Going Broke? Comparing Growth in Healthcare Costs in Ten OECD Countries; National Bureau of Economic Research: Cambridge, MA, USA, 2005; p. w11833. [Google Scholar]
- Breyer, F.; Ulrich, V. Gesundheitsausgaben, Alter Und Medizinischer Fortschritt: Eine Regressionsanalyse / Ageing, Medical Progress and Health Care Expenditures: A Regression Analysis. Jahrb. Für Natl. Stat. 2000, 220, 1–17. [Google Scholar] [CrossRef]
- Breyer, F.; Lorenz, N.; Niebel, T. Health care expenditures and longevity: Is there a Eubie Blake effect? Eur. J. Health Econ. 2015, 16, 95–112. [Google Scholar] [CrossRef] [PubMed]
- Jakovljevic, M.; Potapchik, E.; Popovich, L.; Barik, D.; Getzen, T.E. Evolving health expenditure landscape of the BRICS nations and projections to 2025: BRICS health spending. Health Econ. 2017, 26, 844–852. [Google Scholar] [CrossRef] [PubMed]
- Chernew, M.E.; Newhouse, J.P. Health care spending growth. In Handbook of Health Economics; Elsevier: Amsterdam, The Netherlands, 2011; Volume 2, pp. 1–43. ISBN 978-0-444-53592-4. [Google Scholar]
- Busse, R.; Blümel, M.; Knieps, F.; Bärnighausen, T. Statutory health insurance in Germany: A health system shaped by 135 years of solidarity, self-governance, and competition. Lancet 2017, 390, 882–897. [Google Scholar] [CrossRef]
- Fetzer, S.; Benz, U. Indicators for measuring fiscal sustainability: A comparison of the OECD method and generational accounting. FinanzArchiv 2006, 62, 367. [Google Scholar] [CrossRef]
- Boll, S. Intergenerational Redistribution through the Public Sector–Methodology of Generational Accounting and Its Empirical Application to Germany; Diskussionspapier/Volkswirtschaftliche Forschungsgruppe der Deutschen Bundesbank; Deutsche Bundesbank: Frankfurt, Germany, 1996; ISBN 978-3-932002-46-5. [Google Scholar]
- Raffelhüschen, B. Generational accounting: Method, data and limitations. Eur. Econ. Eur. Comm. Dir. Gen. Econ. Financ. Aff. Rep. Stud. 1999, 99, 17–28. [Google Scholar]
- Bonin, H. Generational Accounting; Population Economics; Springer: Berlin/Heidelberg, Germany, 2001; ISBN 978-3-642-07601-5. [Google Scholar]
- Felder, S. Vom “Deficit Accounting” zum „Generational Accounting”: Eine Anwendung für die Schweiz. Swiss J. Econ. Stat. 1997, 133, 497–512. [Google Scholar]
- Bahnsen, L.; Fetzer, S.; Franke, F.; Hagist, C. Gone with the windfall–Germany’s second LTC strengthening act and its intergenerational implications. J. Econ. Ageing 2020, 17, 100254. [Google Scholar] [CrossRef]
- Hagist, C.; Moog, S.; Raffelhüschen, B. Generationengerechte politik? Eine analyse der aktuellen politik der bundesregierung anhand der generationenbilanz. Z. Für Staats- Eur. 2014, 12, 529–548. [Google Scholar] [CrossRef]
- Felder, S.; Fetzer, S. Kapitaldeckung in der gesetzlichen krankenversicherung: Wer bezahlt den übergang?/Funding social health insurance: Who pays for the transition? Jahrb. Für Natl. Stat. 2007, 227. [Google Scholar] [CrossRef]
- Drouin, A.; Plamondon, P.; Lloret, C. Towards a fair assessment of social security liabilities under pay-as-you-go and partially funded schemes. Int. Soc. Secur. Rev. 2018, 71, 81–103. [Google Scholar] [CrossRef]
- Kaier, K.; Müller, C. New figures on unfunded public pension entitlements across Europe: Concept, results and applications. Empirica 2015, 42, 865–895. [Google Scholar] [CrossRef]
- Holzmann, R.; Palacios, R.; Zviniene, A. On the economics and scope of implicit pension debt: An international perspective. Empirica 2001, 28, 97–129. [Google Scholar] [CrossRef]
- Franco, D. Pension Liabilities—their use and misuse in the assessment of fiscal policies. In Economic Papers; European Commission: Brussels, Belgium, 1995; Volume 110. [Google Scholar]
- Vidal-Meliá, C.; del Carmen Boado-Penas, M. Compiling the actuarial balance for pay-as-you-go pension systems. Is it better to use the hidden asset or the contribution asset? Appl. Econ. 2013, 45, 1303–1320. [Google Scholar] [CrossRef]
- Ventura-Marco, M.; Vidal-Meliá, C. An actuarial balance sheet model for defined benefit pay-as-you-go pension systems with disability and retirement contingencies. ASTIN Bull. 2014, 44, 367–415. [Google Scholar] [CrossRef]
- Garvey, A.M.; Ventura-Marco, M.; Vidal-Meliá, C. Does the pension system’s income statement really matter? A proposal for an NDC scheme with disability and minimum pension benefits. Econ. Res.-Ekon. Istraživanja 2020, 1–19. [Google Scholar] [CrossRef]
- Aaron, H. The social insurance paradox. Can. J. Econ. Polit. Sci. 1966, 32, 371. [Google Scholar] [CrossRef]
- Solow, R.M. A contribution to the theory of economic growth. Q. J. Econ. 1956, 70, 65. [Google Scholar] [CrossRef]
- Diamond, P.A. National debt in a neoclassical growth model. Am. Econ. Rev. 1965, 55, 1126–1150. [Google Scholar]
- Destatis. Bevölkerung Deutschlands Bis 2060: Ergebnisse Der 14. Koordinierten Bevölkerungsvorausberechnung; Statistisches Bundesamt: Wiesbaden, Germany, 2019. [Google Scholar]
- Max Planck Institute for Demographic Research. Human Mortality Database. Available online: www.mortality.org (accessed on 6 January 2020).
- Federal Social Insurance Authority GKV-Ausgabenprofile Nach Alter, Geschlecht Und Hauptleistungsbereichen, 1996–2019, Stand 29.01.2021. Available online: www.bundesamtsozialesicherung.de (accessed on 3 February 2021).
- Federal Ministry of Health–BMG Gesetzliche Krankenversicherung–Endgültige Rechnungsergebnisse 2018, Stand 24.6.2019. Available online: www.bundesgesundheitsministerium.de (accessed on 3 February 2021).
- Forschungsdatenzentren Der Statistischen Ämter Des Bundes Und Der Länder Einkommens- und Verbrauchsstichprobe 2018–Grundfile 3 (AAGSHB), SUF, Version 0 2018. Available online: https://www.da-ra.de/dara/study/web_show?res_id=760847&lang=en&mdlang=en&detail=true (accessed on 3 February 2021).
- Hagist, C.; Moog, S.; Raffelhüschen, B.; Vatter, J. Public debt and demography–An international comparison using generational accounting. Cesifo Dice Rep. 2009, 4, 29–36. [Google Scholar]
- Moog, S.; Raffelhüschen, B.; Reeker, G. Ehrbare staaten? Update 2015: Die nachhaltigkeit der öffentlichen finanzen in Europa. Argum. Zu Marktwirtsch. Polit. 2016, 133. Available online: https://www.econstor.eu/handle/10419/145312 (accessed on 3 February 2021).
- European Commission. Directorate general for economic and financial affairs. In The 2018 Ageing Report: Underlying Assumptions and Projection Methodologies; European Commission: Luxembourg, 2017. [Google Scholar]
- Barro, R. R Minus g; National Bureau of Economic Research: Cambridge, MA, USA, 2020; p. w28002. [Google Scholar]
- Blanchard, O. Public debt and low interest rates. Am. Econ. Rev. 2019, 109, 1197–1229. [Google Scholar] [CrossRef]
- Ehing, D.; Moog, S. Erwerbspersonen- und Arbeitsvolumenprojektionen bis ins Jahr 2060. J. Labour Mark. Res. 2013, 46, 167–182. [Google Scholar] [CrossRef][Green Version]
- Breyer, F.; Lorenz, N. The “Red Herring” after 20 years: Ageing and health care expenditures. Eur. J. Health Econ. 2020, s10198-020-01203–x. [Google Scholar] [CrossRef] [PubMed]
- Zweifel, P.; Felder, S.; Meiers, M. Ageing of population and health care expenditure: A red herring? Health Econ. 1999, 8, 485–496. [Google Scholar] [CrossRef]
- Zweifel, P.; Felder, S.; Werblow, A. Population ageing and health care expenditure: New evidence on the “red herring”. Geneva Pap. Risk Insur. Issues Pract. 2004, 29, 652–666. [Google Scholar] [CrossRef]
- Felder, S.; Werblow, A.; Zweifel, P. Do red herrings swim in circles? Controlling for the endogeneity of time to death. J. Health Econ. 2010, 29, 205–212. [Google Scholar] [CrossRef] [PubMed]
- Newhouse, J.P. Medical care costs: How much welfare loss? J. Econ. Perspect. 1992, 6, 3–21. [Google Scholar] [CrossRef] [PubMed]
- Breyer, F.; Lorenz, N.; Pruckner, G.J.; Schober, T. Looking into the black box of “medical progress”: Rising health expenditures by illness type and age. Working paper, No. 2101. 2021. Available online: https://www.econstor.eu/handle/10419/231468 (accessed on 3 February 2021).
- Starr, M.; Dominiak, L.; Aizcorbe, A. Decomposing growth in spending finds annual cost of treatment contributed most to spending growth, 1980–2006. Health Aff. 2014, 33, 823–831. [Google Scholar] [CrossRef]
- Milan, V.; Fetzer, S.; Hagist, C. Healing, surviving, or dying?–Projecting the German future disease burden using a Markov illness-death model. BMC Public Health 2021, 21, 123. [Google Scholar] [CrossRef]
- Kelly, M. Health capital accumulation, health insurance, and aggregate outcomes: A neoclassical approach. J. Macroecon. 2017, 52, 1–22. [Google Scholar] [CrossRef]
- Reibling, N.; Ariaans, M.; Wendt, C. Worlds of healthcare: A healthcare system typology of OECD countries. Health Policy 2019, 123, 611–620. [Google Scholar] [CrossRef] [PubMed]
- Jakovljevic, M.M. Comparison of historical medical spending patterns among the BRICS and G7. J. Med. Econ. 2016, 19, 70–76. [Google Scholar] [CrossRef] [PubMed]
- Marten, R.; McIntyre, D.; Travassos, C.; Shishkin, S.; Longde, W.; Reddy, S.; Vega, J. An assessment of progress towards universal health coverage in Brazil, Russia, India, China, and South Africa (BRICS). Lancet 2014, 384, 2164–2171. [Google Scholar] [CrossRef]
- World Bank Group. High-Performance Health Financing for Universal Health Coverage; World Bank: Washington, DC, USA, 2019. [Google Scholar]
- Jakovljevic, M.; Getzen, T.E. Growth of global health spending share in low and middle income countries. Front. Pharmacol. 2016, 7. [Google Scholar] [CrossRef] [PubMed]
- Jakovljevic, M.; Groot, W.; Souliotis, K. Editorial: Health care financing and affordability in the emerging global markets. Front. Public Health 2016, 4. [Google Scholar] [CrossRef] [PubMed]
- Jakovljevic, M.; Jakab, M.; Gerdtham, U.; McDaid, D.; Ogura, S.; Varavikova, E.; Merrick, J.; Adany, R.; Okunade, A.; Getzen, T.E. Comparative financing analysis and political economy of noncommunicable diseases. J. Med. Econ. 2019, 22, 722–727. [Google Scholar] [CrossRef] [PubMed]


| SM Concept | GAC Concept | GAIB Concept | |||
|---|---|---|---|---|---|
| Initial intertemporal balance sheet | |||||
| Assets | Liabilities | Assets | Liabilities | Assets | Liabilities |
| PVCL | PVBL | PVCL | PVBL | PVCL | PVBL |
| CA | PVCF | PVBF | PVadjCL | ||
| UF | IPL | IB | |||
| Indicator for intergenerational fairness | |||||
| Closed intertemporal balance sheet | |||||
| Assets | Liabilities | Assets | Liabilities | Assets | Liabilities |
| PVBL | PVBL | PVBL | |||
| PVBF | |||||
| SM | GAC | GAIB | ||||
|---|---|---|---|---|---|---|
| Item | Assets | Liabilities | Assets | Liabilities | Assets | liabilities |
| PVCL | 96 | 96 | 96 | |||
| PVBL | 100 | 100 | 100 | |||
| CA | 4 | |||||
| PVCF | 94 | |||||
| PVBF | 90 | |||||
| PVadjCL | 0 | |||||
| UF/IPL/IB | 0 | 0 | 4 | |||
| α/θ/β | 0.0% | 0.0% | 4.6% | |||
| SM Concept | GAC Concept | GAIB Concept | |
|---|---|---|---|
| Basis concept | Settergren/Mikula [6] | Classical generational accounting approaches | Generational accounting with intergenerational distribution effects |
| Theoretical background | Aaron [33] | Solow [34] and Diamond [35] | Solow [34] and Diamond [35] |
| Assumptions | |||
| Original objective of measuring | Balance rule | Fiscal sustainability | Intergenerational distribution effects |
| Considered assets in the intertemporal budget sheet | Contribution asset | Present value of future generations contributions and benefits from pay-as-you go | Necessary increase (or decrease) of contributions to reach annually balanced budgets |
| Indicator | |||
| Results indicator stationary population | No adjustment | No adjustment | Increase (net benefits of present generations have to be financed by future generations) |
| Results indicator population base year structure | Necessary adjustment (the current German population structure will ceteris paribus induce a higher benefit contribution ratio) | Necessary adjustment (the current German population structure will ceteris paribus induce a higher benefit contribution ratio) | A priori uncertain (higher benefits for living generations are compensated through their higher contribution payments) |
| Results indicator increase of life expectancy (G2L2W0 vs. base year structure) | Necessary adjustment as the current German population structure will ceteris paribus induce a higher benefit contribution ratio | Necessary adjustment, as the current German population structure will ceteris paribus induce a higher benefit contribution ratio | Necessary comparatively low adjustment (higher benefits for living generations are partly compensated through their higher contribution payments) |
| Results indicator cost pressure due to medical progress | Necessary adjustment, comparable with the demographic components | Necessary adjustment that is higher than the effect of demographic components because future generations also benefit from the medical progress | Necessary comparatively low adjustment (higher benefits for living generations are partly compensated through their higher contribution payments) |
| Sensitivity analysis (variations of growth and interest rates) | Comparatively robust results | Comparatively robust results when there is a significant difference between g and r; Comparatively less robust results when there is a small difference between g and r | Linear increase of with the net discount factor due to the market-based assumption that a larger amount of contributions must be saved when young to pay for benefits when old |
Publisher’s Note: MDPI stays neutral with regard to jurisdictional claims in published maps and institutional affiliations. |
© 2021 by the authors. Licensee MDPI, Basel, Switzerland. This article is an open access article distributed under the terms and conditions of the Creative Commons Attribution (CC BY) license (https://creativecommons.org/licenses/by/4.0/).
Share and Cite
Fetzer, S.; Moog, S. Indicators for Measuring Intergenerational Fairness of Social Security Systems—The Case of the German Social Health Insurance. Sustainability 2021, 13, 5743. https://doi.org/10.3390/su13105743
Fetzer S, Moog S. Indicators for Measuring Intergenerational Fairness of Social Security Systems—The Case of the German Social Health Insurance. Sustainability. 2021; 13(10):5743. https://doi.org/10.3390/su13105743
Chicago/Turabian StyleFetzer, Stefan, and Stefan Moog. 2021. "Indicators for Measuring Intergenerational Fairness of Social Security Systems—The Case of the German Social Health Insurance" Sustainability 13, no. 10: 5743. https://doi.org/10.3390/su13105743
APA StyleFetzer, S., & Moog, S. (2021). Indicators for Measuring Intergenerational Fairness of Social Security Systems—The Case of the German Social Health Insurance. Sustainability, 13(10), 5743. https://doi.org/10.3390/su13105743