Article

Crash Severity Analysis of Highways Based on Multinomial Logistic Regression Model, Decision Tree Techniques, and Artificial Neural Network: A Modeling Comparison

1
Faculty of Civil Engineering and Transportation, University of Isfahan, Isfahan 8174673441, Iran
2
Lyles School of Civil Engineering, Purdue University, West Lafayette, IN 47907, USA
3
Department of Transportation Engineering, Isfahan University of Technology, Isfahan 8415683111, Iran
*
Author to whom correspondence should be addressed.
Sustainability 2021, 13(10), 5670; https://doi.org/10.3390/su13105670
Submission received: 24 March 2021 / Revised: 6 May 2021 / Accepted: 11 May 2021 / Published: 18 May 2021
(This article belongs to the Section Sustainable Transportation)

Abstract

:
The classification of vehicular crashes based on their severity is crucial since not all of them have the same financial and injury values. In addition, avoiding crashes by identifying their influential factors is possible via accurate prediction modeling. In crash severity analysis, accurate and time-saving prediction models are necessary for classifying crashes based on their severity. Moreover, statistical models are incapable of identifying the potential severity of crashes regarding influencing factors incorporated in models. Unlike previous research efforts, which focused on the limited class of crash severity, including property damage only (PDO), fatality, and injury by applying data mining models, the present study sought to predict crash frequency according to five severity levels of PDO, fatality, severe injury, other visible injuries, and complaint of pain. The multinomial logistic regression (MLR) model and data mining approaches, including artificial neural network-multilayer perceptron (ANN-MLP) and two decision tree techniques, (i.e., Chi-square automatic interaction detector (CHAID) and C5.0) are utilized based on traffic crash records for State Highways in California, USA. The comparison of the findings of the relative importance of ten qualitative and ten quantitative independent variables incorporated in CHAID and C5.0 indicated that the cause of the crash (X1) and the number of vehicles (X5) were known as the most influential variables involved in the crash. However, the cause of the crash (X1) and weather (X2) were identified as the most contributing variables by the ANN-MLP model. In addition, the MLR model showed that the driver’s age (X11) accounts for a larger proportion of traffic crash severity. Therefore, the sensitivity analysis demonstrated that C5.0 had the best performance for predicting road crash severity. Not only did C5.0 take a shorter time (0.05 s) compared to CHAID, MLP, and MLR, it also represented the highest accuracy rate for the training set. The overall prediction accuracy based on the training data was approximately 88.09% compared to 77.21% and 70.21% for CHAID and MLP models. In general, the findings of this study revealed that C5.0 can be a promising tool for predicting road crash severity.

1. Introduction

More than 1.3 million people die worldwide, and as many as 50 million are annually injured in road crashes. According to official statistics by the World Health Organization [1], traffic crashes are projected to be the fifth leading cause of death in the world by 2030. Every year, traffic crashes impose tremendous costs in terms of human casualties, agony, and economic losses on the people and governments worldwide [2,3,4]. The HSIS claims that in California, there were 3898 fatal crashes in 2017, which have increased 34.29% since 2012. Most of the drivers involved were speeding at the time of the crashes, and two vehicles were involved in the crash occurrence [5].
Crashes vary in terms of fatality and injury levels. However, other studies focus on introducing crash severity such as fatality and injury and property damage only (PDO). Thus, studying further details of crash severity helps researchers to identify the most influencing factors on crash occurrence [6,7]. The significance of road traffic crashes and the need to curb them has compelled researchers to extensively focus on crash analysis efforts. The capability of crash analysis is vital for reducing fatalities and injuries resulting from vehicles on roads [6]. Thus, the reliable analysis of road crashes requires accurate knowledge of the influential factors on crashes. However, a starting approach has mostly been using statistical models, including logit and ordered probit models to predict crash severity. Previous experiences reveal that these models are based on predefined functions, which decrease the accuracy. This deficiency leads to the unintentional ignoring of missing values in the dataset. Data mining techniques have recently shown to be non-parametric tools capable of managing outliers and missing values [8,9,10].
PDO, fatality, severe injury, other visible injuries, and complaint of pain have important rules in the proportions of crashes which should be considered in crash analysis. Accordingly, this classification provides more and better details regarding crash severity compared to three typical levels of fatality, injury, and PDO severity. Crash prediction models also have their unique benefits and limitations, and there is no consensus on the best one. On the other hand, crash prediction models still encompass various limitations and have not achieved optimal performance. Therefore, more extensive model comparisons should be conducted to determine which data mining techniques better fit crash severity analysis data. To facilitate this importance, this study mainly aimed to investigate five classes of crash severity, including PDO, fatality, severe injury, other visible injuries, and complaint of pain based on the highway safety information system (HSIS) data for all state highways in California, the USA in 2012–2014. The study further sought to find the most appropriate model among other models by finding the best fit on the data in crash severity analysis using Waikato environment for knowledge analysis (WEKA) software. Subsequently, the obtained data were from this model were compared with those of other models such as the multinomial logistic regression (MLR) model and data mining techniques such as C5.0 and Chi-square automatic interaction detector (CHAID) algorithms, and artificial neural network-multilayer perceptron (ANN-MLP) by accuracy parameters. The remaining sections of this study are organized as follows.
The Section 2 discusses works related to predicting crash severity via statistical and data mining approaches. In addition, the gap of working on crash severity between previous studies and the present study is characterized regarding the five classes of crash severity. In the Section 3, the research method is presented based on studying the HSIS database in 2012–2014 and applying the MLR and data mining techniques (i.e., C5.0, CHAID), and ANN-MLP models according to hyper-parameter settings using WEKA software in order to predict crash severity. In addition, the modeling findings and discussions of the proposed models are explained in the Section 4, followed by explaining a sensitivity analysis among the proposed models in order to select the best predictive model. Conclusions are described in the fifth part of this study.

2. Literature Review

Researchers have recently focused on different crash analysis types resulting from traffic crashes, specifically the development and application of crash severity prediction models. Crash severity models attempt to estimate the probability that a crash will fall into various severity levels including PDO, minor injury (other visible injuries, and complaint of pain), severe injury, and fatality based on contributing factors [11,12,13,14,15]. Researchers in crash severity evaluations employ different modeling processes, the most prominent of which are regression and data mining techniques. Regression techniques such as Logit and Probit have been used to analyze traffic crash severity [16]. Crash severity can be generally considered as a random event, thus statistical models, particularly regression analysis, have been widely applied to explore the associated contributing factors [17,18]. Compared with other types of regression models, choice and logistic regression models have been employed more frequently. However, most regression models have their model assumptions and predefined relationships between dependent and independent variables. Therefore, any violation of these assumptions may lead to entirely erroneous predictions.
Rezapour et al. [19] used multinomial regression model in order to identify parameters impacting traffic barrier crash severity. The results indicated that multinomial logistic regression model is appropriate for both non-interstate and interstates crashes involved in traffic barriers. Moreover, factors including road surface conditions, age, driver restraint, and curve negotiation were found to be the most effective factors on the severity of traffic barrier crashes in non-interstate highways. Wahab and Jiang [20] used multinomial regression model in order to explore the factors affecting motorcycle crash severity in Ghana and found that motorcycle crashes occurring during the daytime, in curves of roads, and adverse weather conditions decrease the probability of fatal injury. Rezapour and Ksaibati [21] compared the performance of injury severity prediction of truck crashes using multinomial and ordinal logistic regression models and reported that multinomial logistic regression could predict injury severity of truck crashes better than ordinal logistic regression model due to not assuming normality and linearity in violation and crash data. Pradipta et al. [22] also used multinomial logistic regression in order to identify factors influencing crash severity in West Nusa Tenggara of Indonesia. They found that road function, vehicle type, crash type, possession of a driving license, use of driver safety equipment, distraction of the driver, and location of the crash have a significant correlation with the severity of crashes. Vajari et al. [23] used a multinomial logit model for the prediction of motorcycle crash severity at Australian intersections. The results indicated that factors such as female motorcyclists, snowy, stormy or foggy weather, rainy weather, evening rush hours crashes, and unpaved roads reduced the probability of fatal injuries. Further, some studies used multinomial logistic regression model in order to find factors contributing to crash severity modeling. The results indicated that multinomial logistic regression appropriately can predict crash severity level according to factors leading to crash occurrence, appropriately [24,25,26]. Since crash analysis is performed based on various variables, drawing upon multinomial logistic regression in order to investigate the effect of various variables on crash severity. In addition, previous studies used multinomial logistic regression properly to examine factors associated with crash severity and results indicated that multinomial logistic regression has better capability in predicting different levels of crash severity than other statistical methods such as the discriminant and ordered logit models [21,24,27].
In contrast to statistical models, the data mining classification technique consists of several distinct subsets such as support vector machine (SVM), Bayesian classifier, ANN, and decision trees. ANNs are non-parametric methods that are widely employed by researchers in crash severity evaluations. Abdelwahab and Abdel-Aty [28] employed an ANN to predict vehicle collisions at signalized intersections in central Florida. They compared ANN data with those of the fuzzy approach, and the ANN classification showed relatively better performance. Further, Shirmohammadi et al. [29] used a clustering analysis approach to classify drivers’ behaviors regarding road crash severity. Shirmohammadi et al. [30] also identified crash-prone road locations in the light of the wavelet theory and the multi-criteria decision-making method and concluded that the combination of this theory based on ANN with the mentioned method could be a new road crash severity technique. Likewise, Alkheder et al. [31] used WEKA data mining software to build ANN classifiers in order to predict the injury severity of traffic crashes based on 5973 traffic crash records that occurred in Abu Dhabi during 2008–2013 and demonstrated that developed ANN classifiers can predict crash severity with reasonable accuracy. In another study, Taamneh et al. [32] also reported that clustering data prior to classification resulted in a higher precision compared to no clustering. Similarly, Mokhtarimousavi et al. [33] used SVM models for work zone crash injury severity prediction. Wahab and Jiang [34] developed algorithms to predict motorcycle crash severity based on machine learning. In their study, Amiri et al. [35] focused on predicting the severity of fixed object crashes among elderly drivers using ANN models and a hybrid intelligent genetic algorithm. Some studies represented that machine learning techniques have a better performance in improving safety in transport modes, including pedestrians and motorcycle crash severity, compared with ANN models [36,37,38]. Chang and Chien [39] focused on decision trees (DTs) to study crash severity as another data mining technique. Chong et al. [40] compared DTs and neural network data mining methods to model the severity of head-on collisions. The accuracy of the neural network and DT models varied depending on the severity type for prediction. Furthermore, Beshah and Hill [41] evaluated the performance of DTs, naive Bayes, and K-nearest neighbor classifiers in the crash severity evaluation and found that the accuracy of these three types of data mining techniques was 80.20%, 79.90%, and 80.82%, respectively. Other researchers preferred the Chi-square automatic interaction detector (CHAID) algorithm due to its distinct structure in crash analysis and concluded that the CHAID has an acceptable prediction accuracy in fatality severity [42,43,44,45,46]. Behbahani et al. [47] used an extreme learning machine (ELM) as an advanced model, which is highly fast in comparing other algorithms and can predict precisely. In comparison with other algorithms, ELM as a feedforward neural network with random weights was of quite noticeable benefits. It can be such an effective predictive effect in dealing with crash data, especially when the amount of the labeled data is relatively small. Amiri et al. [48] employed five different data mining methods, including Bayesian network, ANN-MLP, ANN-radial basis function, SVM-polynomial and SVM-sigmoid to determine which of these techniques better perform in predicting crash severity. Moreover, Iranitalab and Khattak [49] compared several statistical and machine learning methods for crash severity prediction. Singh et al. [50] applied a deep neural network-based predictive model to quantify the effects of various variables on crash frequency and provide a ranked list of variables based on their importance.
A review of previous studies revealed that crash severity analysis has so far been limited only to PDO, fatality, and injury levels. To the best of our knowledge, nearly no study has focused on investigating different classes of crash severity. In the light of the review of the relevant literature, the novelty of the present study is two-fold. First, this study applies different classes of crash severity, including PDO, fatality, severe injury, other visible injuries, and complaint of pain to provide an accurate analysis of influencing factors on crashes. Second, the present study evaluates and compares the MLR model with different data mining techniques including the ANN-MLP model and two DT algorithms (i.e., C5.0, and CHAID) using the HSIS dataset for all state highways in California, the USA, and proposes the most accurate models for crash prediction purposes. The applied data source in this study includes three years of crashes linked to system-wide roadway characteristics, traffic volumes, and crash data. Using the HSIS data helps determine how much different countermeasures can reduce road crash potentials.

3. Research Method

The present study considers a comprehensive classification of crash severity such as PDO, fatality, severe injury, other visible injuries, and complaint of pain based on the HSIS dataset in 2012–2014. It then seeks to find the most appropriate predictive model using the MLR model and data mining techniques (i.e., C5.0, CHAID), and the ANN-MLP model by finding the best fit on data in crash severity analysis. According to the HSIS dataset, qualitative and quantitative independent variables are determined, and then crash severity is examined in five severity classes. The MLR models for severity classes are proposed based on training, validation, and correlation analysis. Data mining approaches including C5.0, CHAID, and ANN-MLP models are applied by means of hyper-parameters settings, the relative importance of variables, and correctly and incorrectly classified instances in WEKA software. Additionally, accuracy, the receiver operating characteristic (ROC) curves (AUCs), and classification time are taken into consideration within prediction crash severity. Then, sensitivity analysis is applied based on the running time of classifying crash severity. Figure 1 presents the overall flowchart and the process for evaluating the credibility and precision (performance evaluation) of the selected models in explaining the nominated five classes of severity.

3.1. Data Description

Because of the importance of the needed comprehensive data for this study, the crash data were obtained from the California HSIS database for all State highways and comprising crash information for years of 2012–2014. The response variable of the model is crash severity which is classified into five levels of PDO, fatality, severe injury, other visible injuries, and complaint of pain.
Table 1 provides a total of 20 qualitative and quantitative explanatory (independent) variables evaluated in this study. The qualitative variables are divided into different categories (codes) with descriptions, including the cause of the crash, weather conditions, road surface conditions, lighting conditions, the number of involved vehicles, median type, facility access, design speed, surface type, and gender. Quantitative variables in the areas of humans, environments, roads, and vehicles contributing to the occurrence of crashes are also listed in Table 1.
There are 145,142, 131,508, and 152,908 crash records, most of which are of PDO severity, followed by the complaint of pain and visible injuries during 2012–2014. As shown in Figure 2, 66% of crashes belong to PDO. Meanwhile, fatality and severe injuries constitute approximately 3% of all crashes. In addition, other visible injuries consist of 12% of crashes, while complaint of pain accounts for 21% of crashes.
Information on the percentage of each condition within which the crashes have occurred is presented in Table 1. Except for the cause of the crash, the number of the involved vehicles in the crash and design speed, and lightening and surface conditions do not reflect the potential for increasing crash occurrence in comparison with others of the same variable since the exposure of the traffic volume to these conditions is not equal. For instance, the slippery surface is known to be an influential factor in increasing traffic crashes. However, most crashes took place on a dry surface (Table 1). This is because the period when the surface is slippery is far less than the period that it is dry, thus the traffic volume is less exposed to a slippery surface, and fewer crashes are expected accordingly. Therefore, judgments based upon these percentages are misleading, and further investigation is required in this regard. On the other hand, data reveal that speeding is the major cause of crashes comprising nearly half of them, followed by other violations (hazardous) and improper turns. Roads with design speeds greater than 70 miles per hour are prone to crashes significantly greater than those with a lower design speed. Moreover, traffic crashes are mostly due to two-vehicle involvement and single-vehicle crashes, respectively. The statistics of quantitative variables are summarized in Table 2.

3.2. MLR Model

In the present study, to apply the MLR model for predicting crash severity, dependent variables are followed as Y, which has i degrees, sequenced with values from low to high which include the crash severity (PDO, fatality, severe injury, other visible injuries, and complaint of pain) when given values i = 1 to 5 and k indexes the observation (crashes). Independent variables are considered as Xi1, Xi2,∙∙∙, Xij and j is the number of predictors based on the dataset in Table 1. Thus, the multinomial logistic regression model for the crash k having severity level i can be expressed as Equation (1) as follows [51,52,53]:
Logit ( P k ( Y ij i X j ) ) = Ln P k ( Y ij i X j ) 1 P k ( Y ij i X j ) = Ln P k ( Y ij i X j ) P k ( Y ij > i X j ) = α i + β i 1 X i 1 + β i 2 X i 2 + + β ij X ij = α i + j = 1 J β ij X ij
where αi, and βij, represent the constant for the crash severity level i, and the regression coefficient, respectively. P k ( Y ij i X j ) is the cumulative probability Y ij under the conditional form of i X j regarding the crash severity level i (Y = 1 (PDO); Y = 2 (fatality); Y = 3 (severe injury); Y = 4 (other visible injuries); Y = 5 (complain of pain)) and i = 1 I P k ( Y ij i X j ) = 1 . Thus, the multinomial logistic probability model can be expressed as Equation (2):
P k ( Y ij i X j ) = exp ( α i + i = 1 I β ij X ij ) 1 + exp ( α i + i = 1 I β ij X ij ) i = 1 , 2 , , 5 ; j = 1 , 2 , , J
Pearson’s χ2 is obtained by comparing the model prediction of the crash, and the actual observation of the severity of the crash has a negligible difference to the model test of the goodness of fit [54]. The calculation formula is expressed by Equation (3):
χ 2 = k K O k E k 2 E k
where K, Ok, and Ek denote the number of the covariant type, the observed frequency in j covariant type, and the predicted frequency in j covariant type. The smaller statistic of Pearson χ2 indicates the predicted values between the model and the actual of no significant difference, the model fitting effect is highly good. On the other hand, the means model fitting effect is poor [55].

3.3. ANN-MLP Model

ANN-MLP is a supervised learning technique applied for the classification and regression of datasets in different applications [56,57]. In addition, this technique creates a feed-forward artificial neural network that consists of multiple nodes organized in three or more layers (i.e., the input layer, the output layer, and one or more hidden layer/layers in between). The input variables are mapped onto the output variables using one or more hidden layer/layers [58,59]. ANN-MLP has been successfully used to solve many difficult problems by utilizing a backpropagation algorithm in training the generated networks. MLP has the capability of separating data that are not linearly separable [56,57,60]. In this study, the ANN-MLP technique was employed to generate a classifier to accurately predict crash severity. It is noteworthy that this method is capable of approximating any finite nonlinear function with extremely high accuracy, thus it can be practical in the present study. In training, ANN-MLP is the inputs of the first layer multiplied in weight coefficients that could be any randomly selected number and then is entered into the neurons in the second layer. Therefore, to predict crash severity in the present study based on WEKA software, the initial setting of hyper-parameters about ANN-MLP (e.g., hidden layers, learning rates, momentum, and normalizing attributes) is summarized in Table 3.

3.4. DT Techniques

The DT technique is a decision support means in which tree-like graphs and their feasible outcomes are used to visually display the data [61]. These outcomes are made of internal nodes and diverse branches and leaf nodes. Each internal node expresses a “test” of an attribute, each branch represents the outcome of the test, and each leaf node describes a class label. The paths from the root to the leaf express classification rules [62]. The DT algorithm is a new tool for analyzing the existing crash dataset and predicting crash severity [63]. In the DT, the value of a particular criterion is generally used to specify each internal node. More details about the hyper-parameter setting were selected according to Table 3 to yield the best performance for DTs based on WEKA software. Therefore, each applied algorithm in the present paper has been provided as follows:

3.4.1. C5.0 DT Technique

The C5.0 algorithm is the generalized form of the Iterative Dichotomiser 3 algorithm which uses the gain ratio for selecting the most important attributes [61]. C5.0 can generate classifiers displayed either as DTs or rulesets. Many studies prefer rulesets over DTs since they are easier to understand compared to DTs. The process of C5.0 algorithm is that, in the first step, it makes a large tree based on all of the attribute values. Then, it finalizes the decision rule by pruning. In the second step, a heuristic approach is applied for pruning by considering statistical significance of splits. In the third step, the branch nodes are proceeded and sent after fixing the best rule. Finally, the final class value in the last node is made which is called the leaf node [64,65]. Thus, to predict crash severity based on WEKA software in the present study, the initial setting of hyper-parameters about the C5.0 DT technique is provided in Table 3.

3.4.2. CHAID DT Technique

A CHAID tree is a DT that is formed by repeatedly splitting the subsets of the space into two or more child nodes, beginning with the entire data set [66]. To determine the best split at any node, any permissible pair of the categories of predictor variables is merged until there is no statistically significant difference within the pair with respect to the objective variable [63,66,67]. Chi-square tests are applied at each stage in building the CHAID tree to ensure that each branch is associated with a statistically significant predictor of the response variable [68,69]. The process of the CHAID algorithm is that in the first step, the best partition for each predictor is selected. Then, data are subgrouped based on the selected predictor. In the second step, each of these subgroups is analyzed again for producing further subgroups for analysis. In the third step, for each selected pair, the CHAID algorithm is examined for p-values greater than the certain threshold in order to merge the values and search for an additional potential pair to be merged. Finally, this procedure is continued until no significant pairs are found [65,70].
Therefore, to predict crash severity in the present study, the initial setting of hyper-parameters regarding the CHAID DT technique based on WEKA software is presented in Table 3.
Table 4 provides only the most significant rules identified in the present study because of space constraints. The frequency of each input attribute in the PDO, fatality, severe injury, other visible injuries, and complaint of pain is illustrated in Figure 3 and Figure 4. Based on data in Figure 3, the number of generated rules based on C5.0 for PDO, fatality, severe injury, other visible injuries, and complaint of pain is 12, 25, 96, 135, and 189, respectively. As shown, CAUSE (X1), the number of involved vehicles (NUMVEHS (X5)) in the crash, road surface conditions (RDSURF (X3)), design speed (DESG_SPD (X8)), and WEATHER (X2) are the primary splitters in the C5.0 model. This implies that these variables are critical in classifying PDO, fatality, severe injury, other visible injuries, and complaint of pain in traffic crashes regarding the C5.0 model. The number of generated rules based on the CHAID model for PDO, fatality, severe injury, other visible injuries, and complaint of pain is 23, 35, 110, 145, and 198, respectively (Figure 4). According to the CHAID model, four variables are the primary splitters in the CHAID model, including the CAUSE (X1), the number of vehicles (NUMVEHS (X5)), WEATHER (X2), and AADT (X15). This indicates that these variables are essential in categorizing PDO, fatality, severe injury, other visible injuries, and complaint of pain in traffic crashes regarding the CHAID model.

3.5. Performance Evaluation of Classifier Accuracy

To determine which algorithm yields the most accurate outcome, comparing and evaluating the findings of the modeling techniques are essential. Several most effective measures are considered in performance evaluations. However, the performance of classification algorithms is usually checked by evaluating the correctness of the classification. Accuracy is a fraction that represents the overall success of the classification [71]. Equation (4) presents the general form of the applied accuracy in the comparison process. Table 5 provides the 2 × 2 confusion matrix for a binary classifier that has only positive and negative classes (in our case, it becomes 4 × 4 as we have 4 classes). TP, TN, FP, and FN can be described as follows [65,66,70]:
TPi = True positive, namely, instances observed to be from class i are classified (predicted) correctly as belonging to class i
FNi = False negative, namely, instances observed to be from class i are classified incorrectly as belonging to a class other than i
FPi = False positive, namely, instances not observed to be from class i are classified incorrectly as belonging to class i
TNi = True negative, namely, instances not observed to be from class i are classified correctly as belonging to a class other than i
Other evaluation measures commonly used to evaluate the effectiveness of a classifier for each class are the true positive rate (TPR), the false positive rate (FPR), and the ROC curve. Equations (4) and (5) explain how to calculate these measures for class Positive in Table 5.
Recall = TP TP + FN
Recall is the proportion of instances classified as Positive, among all instances belonging to the class Positive. Note that the overall accuracy of a classifier can also be calculated by taking the weighted average of all recall values.
The FPR or (1-specificity) is the proportion of instances classified as class Positive while belonging to a different class, among all instances which are not of class Positive as shown in Equation (5):
FPS = TP TP + FN
Finally, the ROC curve is a plot of the TPR (i.e., recall) against the FPR at various threshold settings showing the trade-offs between true positive (benefits) and false positive (costs).

4. Results

After initializing the MLR model, the data of MLR equations were compared with each other by means of training and validation, correlation analysis between independent variables and crash severity, and the significant level of independent variables in order to find the most appropriate MLR equation for crash severity predictions. The findings of DT techniques (i.e., C5.0, and CHAID), and the ANN-MLP model in WEKA software for predicting crash severity are presented throughout correctly and incorrectly classified instances, accuracy, AUCs, and the classification time of crash severity. The process of DT techniques (i.e., C5.0 and CHAID) and the ANN-MLP model includes using the entire dataset because of the need regarding the training set for the algorithm, followed by finding the precision of the classifier which is normally based on the level of accuracy in predicting the class of every crash. As the second stage, the cross-validation technique was employed with 10-folds to evaluate accuracy. To this end, the entire dataset was randomly placed into 10 subsets. Out of the 10 subsets, a single subset was selected and applied as the testing data and the remaining subsets were used in the process as the training data and then repeated 10 times. Each of the 10 subsets was precisely employed once as the testing data. As a result, the entire dataset was used for validation. In the third step, the overall performance was determined by averaging the 10 data from the folds. As the final step and for controlling any problem resulting from the imbalanced distribution of crash severity in the dataset, the dataset was resampled to bias the crash severity distribution toward a uniform distribution. The cross-validation with a 10-fold cross-validation was then re-used to evaluate its performance. Hence, a sensitivity analysis is taken into consideration based on the running time of classifying crash severity and 10-fold cross-validation, training set, and resampled training set to find the best model. Thus, the findings of the proposed models are presented as follows:

4.1. Correlation Analysis of Independent Variables

To examine the correlation analysis of independent variables on the dependent variable, seven types of logistic regression model were run, namely, MLR Main, MLR Inter, MLR Poly, MLR Main Inter, MLR Main Poly, MLR Inter Poly, and MLR Main Inter Poly. Based on the obtained data (Table 6), MLR Inter, MLR Main Inter, MLR Inter Poly, and MLR Main Inter Poly had the greatest over fit since all of them showed a considerable rate on the training set but poorly performed on the validation set. This is actually resulting from a large gap between the training and validation sets. Thus, these four models are unsuitable as a predictive model for this set of data. Therefore, MLR Main was found to be the best model for logistic regression since it had the highest percentage of accuracy as compared to MLR Poly and MLR Main Poly, even though there was slightly overfitting on that particular model. Based on the correlation analysis between independent variables and severity crash, seven independent variables demonstrated significant correlations (p < 0.05), including the cause of the crash (X1), weather conditions (X2), road surface conditions (X3), lighting conditions (X4), the number of vehicles (X5), design speed (X8), and from the driver’s aspect, driver’s age (X11). The significance levels are shown in Table 7. According to lower values of the Akaike information criterion (AIC), Bayesian information criterion (BIC), and Pearson’s Chi-squared test (χ2) in comparison with other variables in Table 7, driver’s age (X11) accounts for a larger proportion of traffic crash severity among the independent variables. Thus, traffic crashes are closely related to human factors.

4.2. Results of the MLR Model

The data related to the MLR model for the crash severity of PDO (1), fatality (2), severe injury (3), other visible injuries (4), and complain of pain (5) are summarized in Table 8. According to Table 8, for each crash severity, the proposed MLR models with their variables are indicated.

4.3. Testing Goodness of Fit on the Models

Table 9 presents the result of Pearson χ2 and deviance statistics fitting goodness test. As shown, the p-value of Pearson χ2 and deviance statistics are both >0.05, thus at the significance level α = 0.05 conditions, establish that the model fitting effect is acceptable.

4.4. DT Techniques and the ANN-MLP Model

Graphical representation in Figure 5 is presented for a more comfortable grasp of the relative importance of independent variables when employing C5.0, CHAID, and ANN-MLP models. Based on data in Figure 5, C5.0 has one-quarter of the relative importance to CAUSE (X1), another one-quarter to the number of vehicles (NUMVEHS(X5)) involved in the crash, and the remaining cases related to other variables. According to C5.0, CAUSE (X1), the number of vehicles (NUMVEHS(X5)), road surface conditions (RDSURF (X3)), design speed (DESG_SPD (X8)), and WEATHER (X2) were categorized as the most influential variables in the occurrence of crashes.
On the other hand, CHAID attributes one-third of the weight of the crash frequency model to CAUSE (X1) and a quarter to the number of vehicles (NUMVEHS (X5)) involved in the crash and the remaining cases to other variables. Based on CHAID, the CAUSE (X1), number of vehicles (NUMVEHS(X5)), WEATHER(X2), and AADT (X15) were classified as the most influential variables in the occurrence of crashes. Unlike DT models, ANN-MLP has a reasonably homogeneous distribution of relative importance, thus variations are less palpable compared to DT models. However, two variables, including the CAUSE (X1) and WEATHER (X2), are significantly important in the occurrence of crashes.
Generally, based upon C5.0 and CHAID, CAUSE (X1) and NUMVEHS (X5) were identified as the most influential variables on the occurrence of crashes. On the other hand, CAUSE (X1) and WEATHER (X2) were reported as the most contributing variables in the ANN-MLP model.
In order to show the performance of each decision tree technique for crash severity, the accuracy was taken into consideration for each sample dataset including training set, cross-validation, and resampled training set based on the correctly classified instances, incorrectly classified instances, Equation (4), and Table 10, Table 11 and Table 12. Thus, the accuracy results were calculated and shown in Table 10 for C5.0 model. Regarding Table 10, it was found that, for C5.0 prediction accuracy based on the training dataset, crash severity such as PDO, fatality, severe injury, other visible injuries, and complaint of pain was 86.72%, 23.67%, 39.65%, 55.78%, and 69.80%, respectively. Therefore, for the C5 model, the overall prediction accuracy based on the training data was approximately 88.09%. Moreover, based on the 10-fold cross-validation in Table 10, the prediction accuracy for PDO, fatality, severe injury, other visible injuries, and complaint of pain was 78.56%, 10.82%, 17.45%, 25.11%, and 45.78%, respectively. The overall prediction accuracy for the 10-fold cross-validation was nearly 72.08%. However, after resampling for PDO, fatality, severe injury, other visible injuries, and complaint of pain was 94.53%, 76.87%, 83.26%, 89.10%, and 90.33%, respectively. For C5.0 models after resampling, the overall prediction accuracy of the training data was approximately 89.45%. Based on these data, an enhancement was observed in the prediction accuracy after resampling the training set.
In addition, the CHAID classifier is shown according to the correctly classified instances, incorrectly classified instances in Equation (4) and Table 11 in order to represent accuracy. According to Table 11, it was found that, for CHAID prediction accuracy based on the training dataset crash severity such as PDO, fatality, severe injury, other visible injuries, and complaint of pain was calculated and shown to be as 86.73%, 23.67%, 36.78%, 68.95%, and 10.99%, respectively. The overall prediction accuracy based on the training data was nearly 77.21%. According to the 10-fold cross-validation, the correctly classified instances, incorrectly classified instances, and Equation (4), the prediction accuracy for PDO, fatality, severe injury, and other visible injuries, and complaints of pain was 67.99%, 17.31%, 22.71%, 35.76%, and 8.89%, respectively. The overall prediction accuracy was approximately 51.55%. However, the prediction accuracy after resampling the training dataset for PDO, fatality, severe injury, other visible injuries, and complaints of pain was reported to be 88.61%, 76.60%, 45.78%, 65.90%, and 76.89%, respectively. Accordingly, the overall prediction accuracy was nearly 80.49% after resampling. Thus, an increase was found in the prediction accuracy after resampling the training data.
The prediction findings for the ANN-MLP classifier are presented in Table 12. The MPL classifier prediction accuracy based on the training data set for PDO, fatality, severe injury, other visible injuries, and complaints of pain was 63.67%, 45.89%, 65.81%, 28.90%, and 16.54%, respectively. The overall prediction accuracy based on the training data was approximately 70.21%. Based on 10-fold cross-validation in Table 12, the prediction accuracy for PDO, fatality, severe injury, other visible injuries, and complaints of pain was 64.22%, 30.89%, 25.10%, 19.23%, and 9.26%, respectively, and the overall prediction accuracy was around 53.80%. The findings further revealed that prediction accuracy after resampling the training dataset was 88.61%, 85.67%, 78.90%, 82.38%, and 85.57% for PDO, fatality, severe injury, other visible injuries, and complaints of pain, respectively. The overall prediction accuracy after resampling was nearly 76.24%. Thus, an enhancement was observed regarding the prediction accuracy after resampling the training data (Table 12).

4.5. Sensitivity Analysis

Sensitivity analysis was performed on prediction crash severity for DT techniques, and the MLP model. The obtained data in Table 10, Table 11 and Table 12 indicated that building the MLP classifier takes a longer time compared to other classifiers (approximately 179 s) whereas that of the C5.0 and CHAID classifiers take 0.05 and 0.76 s, respectively. Figure 6 shows that the overall accuracy of DTs for the C5.0 classifier is more than that of the CHAID classifier and the ANN-MLP classifier in predicting crash severity in 10-fold cross-validation, the training set, and the resampled training set. The high accuracy of C5.0 in predicting crash severity indicates that C5.0 is the best predictive model in comparison with other models. Additionally, the prediction accuracy of the classifiers increased after resampling the training set, indicating an increase in the performance of prediction crash severity for proposed models.
Figure 7 illustrates the findings of the comparison analysis among the proposed models via identified variables contributing to the crash occurrence. As shown, C5.0 was chosen as the best predictive model with five variables for predicting the types of road crash severity since it represented the highest accuracy rate for training and the validation set compared to CHAID, ANN-MLP, and MLR models.

5. Conclusions

The classification of crashes based on their severity is crucial since not all crashes are have the same financial and injury values. Further, in crash severity analysis, accurate and time-saving prediction models are necessary for classifying crashes based on their severity. The crash frequencies of different levels of severity such as PDO, fatality, severe injury, other visible injuries, and complaint of pain were predicted using the MLR model, DT algorithms such as C5.0 and CHAID, and the ANN-MLP model for all state highways in California, USA during 2012–2014 were undertaken in the present study. Influential independent qualitative and quantitative variables (10 variables for each of them) were used for modeling purposes. The following conclusions could be drawn based on the obtained data:
(1)
Using MLR models, it was observed that independent variables of the cause of the crash (X1), weather conditions (X2), road surface conditions (X3), lighting conditions (X4), the number of vehicles (X5), design speed (X8), and from the driver’s aspect and age (X11) showed significant correlations in crash severity. In addition, regarding the lower values of the AIC, BIC, and χ2 in comparison with other variables, it was found that driver’s age (X11) accounts for a larger proportion of traffic crash severity among the independent variables.
(2)
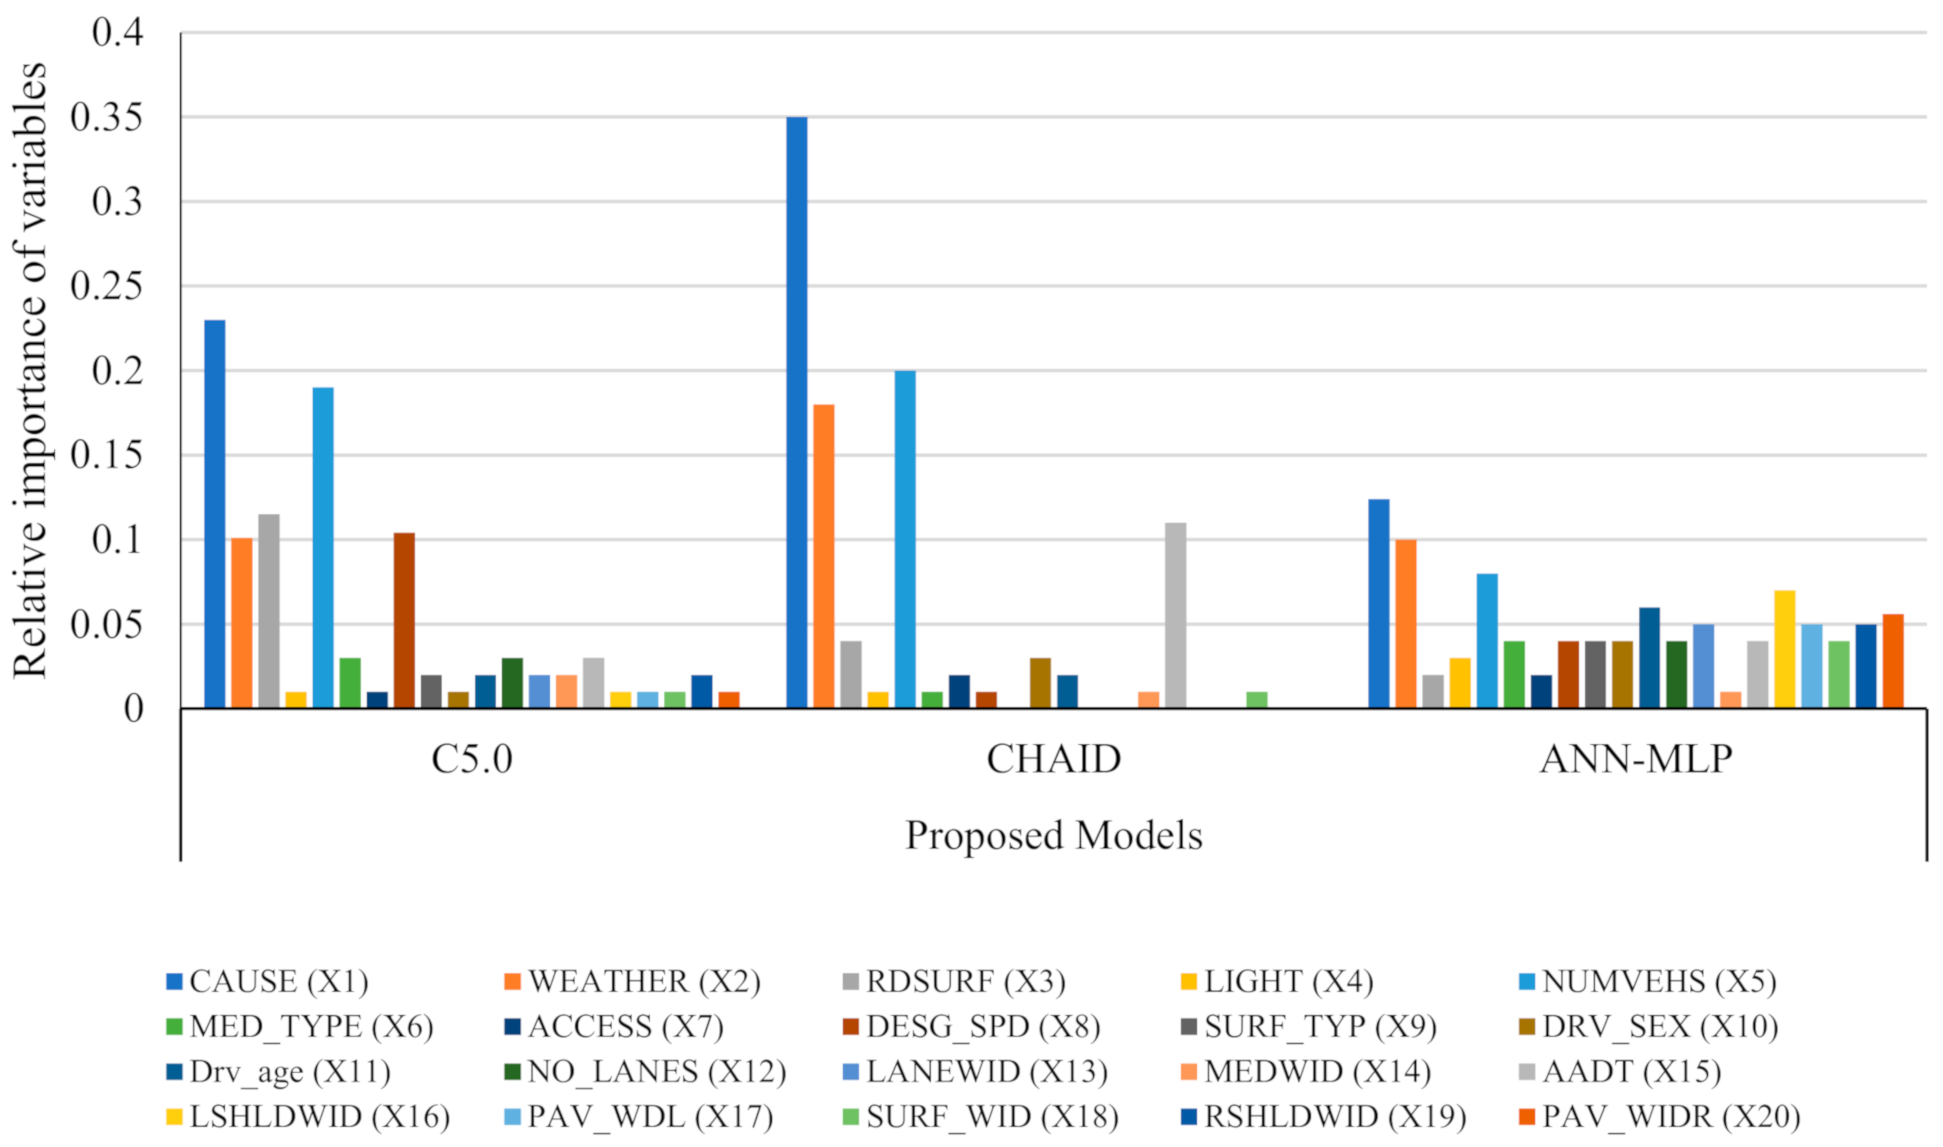
The use of C5.0 and CHAID models indicated that the cause of the crash (CAUSE(X1)) and the number of vehicles (NUMVEHS(X5)) were the most important variables involved in the occurrence of crashes.
(3)
The ANN-MLP model indicated that CAUSE (X1) and WEATHER (X2) were as the most influential variables in crash severity.
(4)
When using the DT model (C5.0), the prediction accuracy was 94.53%, 76.87%, 83.26%, 89.10%, and 90.33% for the entire applied dataset as a training set with 10-fold cross-validation and after resampling for PDO, fatal, severe injury, other visible injuries, and complaint of pain, respectively. For the CHAID classifier, the prediction accuracy was reported 88.61%, 76.60%, 45.78%, 65.90%, and 76.89% for the entire used dataset as the training set, with 10-fold cross-validation and after resampling for PDO, fatality, severe injury, other visible injuries, and complaint of pain, respectively. For the ANN-MLP classifier, the prediction accuracy for the entire applied dataset as a training set, with 10-fold cross-validation and after resampling for PDO, fatality, severe injury, other visible injuries, and complaint of pain was 88.61%, 85.67%, 78.90%, 82.38%, and 85.57%, respectively. Finally, sensitivity analysis showed that the C5.0 model was selected as the best predictive model with five variables regarding predicting road crash severity since it demonstrated the highest accuracy rate for training and the validation set compared to CHAID, ANN-MLP, and MLR models.

Author Contributions

Conceptualization, G.S. and R.K.; methodology, G.S.; software, R.K.; validation, G.S., R.K. and R.I.; formal analysis, G.S. and R.K.; investigation, G.S. and R.K.; resources, R.I.; data curation, R.I.; writing—original draft preparation, G.S. and R.K.; writing—review and editing, G.S., R.K. and R.I.; visualization, G.S. and R.K.; supervision, G.S.; project administration, G.S. All authors have read and agreed to the published version of the manuscript.

Funding

This study received no financial support.

Institutional Review Board Statement

Not applicable.

Informed Consent Statement

Not applicable.

Data Availability Statement

The data are available based on the request from the corresponding author.

Conflicts of Interest

The authors declare no conflict of interest.

References

  1. Global Status Report on Road Safety; World Health Organization (WHO): Geneva, Switzerland, 2015.
  2. Zong, F.; Zhang, H.; Xu, H.; Zhu, X.; Wang, L. Predicting Severity and Duration of Road Traffic Accident. Math. Probl. Eng. 2013, 2013, 1–9. [Google Scholar] [CrossRef]
  3. Hasheminezhad, A.; Hadadi, F.; Shirmohammadi, H. Investigation and prioritization of risk factors in the collision of two passenger trains based on fuzzy COPRAS and fuzzy DEMATEL methods. Soft Comput. 2021, 25, 4677–4697. [Google Scholar] [CrossRef]
  4. Afandizadeh, S.; Hassanpour, S. Evaluating the Effect of Roadway and Development Factors on the Rural Road Safety Risk Index. Adv. Civ. Eng. 2020, 2020, 7820565. [Google Scholar] [CrossRef]
  5. HSIS. Highway Safety Information System. 2017. Available online: https://www.hsisinfo.org. (accessed on 15 October 2018).
  6. Mannering, F.L.; Bhat, C.R. Analytic methods in accident research: Methodological frontier and future directions. Anal. Methods Accid. Res. 2014, 1, 1–22. [Google Scholar] [CrossRef]
  7. Ratanavaraha, V.; Suangka, S. Impacts of accident severity factors and loss values of crashes on ex-pressways in Thailand. IATSS Res. 2014, 37, 130–136. [Google Scholar] [CrossRef] [Green Version]
  8. Mafi, S.; Abdelrazig, Y.; Doczy, R. Machine Learning Methods to Analyze Injury Severity of Drivers from Different Age and Gender Groups. Transp. Res. Rec. 2018, 2672, 171–183. [Google Scholar] [CrossRef]
  9. Hazaa, M.A.; Saad, R.M.; Alnaklani, M.A. Prediction of Traffic Accident Severity Using Data Mining Techniques in IBB Province, Yemen. Int. J. Softw. Eng. Comput. Syst. 2019, 5, 77–92. [Google Scholar] [CrossRef]
  10. Mokoatle, M. Road Traffic Accident Analysis Using Machine Learning Techniques for Soshanguve, Pretoria. Ph.D. Thesis, North-West University, Potchefstroom, South Africa, 2019. [Google Scholar]
  11. Abdel-Aty, M. Analysis of driver injury severity levels at multiple locations using ordered probit models. J. Saf. Res. 2003, 34, 597–603. [Google Scholar] [CrossRef]
  12. Abdel-Aty, M.A.; Abdelwahab, H.T. Predicting Injury Severity Levels in Traffic Crashes: A Modeling Comparison. J. Transp. Eng. 2004, 130, 204–210. [Google Scholar] [CrossRef]
  13. Milton, J.C.; Shankar, V.N.; Mannering, F.L. Highway accident severities and the mixed logit model: An exploratory empirical analysis. Accid. Anal. Prev. 2008, 40, 260–266. [Google Scholar] [CrossRef]
  14. Anjana, S.; Anjaneyulu, M.V.L.R. Development of safety performance measures for urban roundabouts in India. J. Transp. Eng. 2015, 141, 04014066. [Google Scholar] [CrossRef]
  15. Campos, C.I.D.; Santos, M.C.D.; Pitombo, C.S. Characterization of municipalities with high road traffic fatality rates using macro level data and the CART algorithm. J. Appl. Res. Technol. 2018, 16, 79–94. [Google Scholar] [CrossRef] [Green Version]
  16. Kashani, A.T.; Mohaymany, A.S. Analysis of the traffic injury severity on two-lane, two-way rural roads based on classification tree models. Saf. Sci. 2011, 49, 1314–1320. [Google Scholar] [CrossRef]
  17. Mansouri, M.; Kargar, M.J. Analysis and Monitoring of the Traffic Suburban Road Accidents Using Data Mining Techniques; A Case Study of Isfahan Province in Iran. Open Transp. J. 2014, 8, 39–49. [Google Scholar] [CrossRef] [Green Version]
  18. Wang, S.; Li, Z. Exploring the mechanism of crashes with automated vehicles using statistical modeling approaches. PLoS ONE 2019, 14, e0214550. [Google Scholar] [CrossRef] [Green Version]
  19. Rezapour, M.; Molan, A.M.; Ksaibati, K. Application of Multinomial Regression Model to Identify Parameters Impacting Traffic Barrier Crash Severity. Open Transp. J. 2019, 13, 57–64. [Google Scholar] [CrossRef]
  20. Wahab, L.; Jiang, H. A multinomial logit analysis of factors associated with severity of motorcycle crashes in Ghana. Traffic Inj. Prev. 2019, 20, 521–527. [Google Scholar] [CrossRef]
  21. Rezapour, M.; Ksaibati, K. Application of multinomial and ordinal logistic regression to model injury severity of truck crashes, using violation and crash data. J. Mod. Transp. 2018, 26, 268–277. [Google Scholar] [CrossRef] [Green Version]
  22. Pradipta, P.; Siregar, M.L.; Kusuma, A. Modelling of severity level causes factors in the traffic accident victims in the province of West Nusa Tenggara. IOP Conf. Ser. 2020, 426, 012027. [Google Scholar] [CrossRef]
  23. Vajari, M.A.; Aghabayk, K.; Sadeghian, M.; Shiwakoti, N. A multinomial logit model of motorcycle crash severity at Australian intersections. J. Saf. Res. 2020, 73, 17–24. [Google Scholar] [CrossRef]
  24. Abdulhafedh, A. Incorporating the Multinomial Logistic Regression in Vehicle Crash Severity Modeling: A Detailed Overview. J. Transp. Technol. 2017, 7, 279–303. [Google Scholar] [CrossRef] [Green Version]
  25. Shirmohammadi, H.; Hadadi, F. Assessment of drowsy drivers by fuzzy logic approach based on multinomial logistic regression analysis. Int. J. Comput. Sci. Netw. Secur. 2017, 17, 298. [Google Scholar]
  26. Gholizadeh, P.; Esmaeili, B. Developing a Multi-variate Logistic Regression Model to Analyze Accident Scenarios: Case of Electrical Contractors. Int. J. Environ. Res. Public Health 2020, 17, 4852. [Google Scholar] [CrossRef]
  27. Chen, Z.; Fan, W.D. A multinomial logit model of pedestrian-vehicle crash severity in North Carolina. Int. J. Transp. Sci. Technol. 2019, 8, 43–52. [Google Scholar] [CrossRef]
  28. Abdelwahab, H.T.; Abdel-Aty, M.A. Development of Artificial Neural Network Models to Predict Driver Injury Severity in Traffic Accidents at Signalized Intersections. Transp. Res. Rec. 2001, 1746, 6–13. [Google Scholar] [CrossRef]
  29. Shirmohammadi, H.; Hadadi, F.; Saeedian, M. Clustering analysis of drivers based on behavioral characteristics regarding road safety. Int. J. Civ. Eng. 2019, 17, 1327–1340. [Google Scholar] [CrossRef]
  30. Shirmohammadi, H.; Najib, A.S.; Hadadi, F. Identification of Road Critical Segments Using Wavelet Theory and Multi-Criteria Decision-Making Method. Eur. Transp. 2018, 68, 1–14. [Google Scholar]
  31. Alkheder, S.; Taamneh, M.; Taamneh, S. Severity Prediction of Traffic Accident Using an Artificial Neural Network. J. Forecast. 2017, 36, 100–108. [Google Scholar] [CrossRef]
  32. Taamneh, M.; Taamneh, S.; Alkheder, S. Clustering-based classification of road traffic accidents using hierarchical clustering and artificial neural networks. Int. J. Inj. Control Saf. Promot. 2017, 24, 388–395. [Google Scholar] [CrossRef]
  33. Mokhtarimousavi, S.; Anderson, J.C.; Azizinamini, A.; Hadi, M. Improved Support Vector Machine Models for Work Zone Crash Injury Severity Prediction and Analysis. Transp. Res. Rec. 2019, 2673, 680–692. [Google Scholar] [CrossRef]
  34. Wahab, L.; Jiang, H. A comparative study on machine learning based algorithms for prediction of motorcycle crash severity. PLoS ONE 2019, 14, e0214966. [Google Scholar] [CrossRef]
  35. Amiri, A.M.; Sadri, A.; Nadimi, N.; Shams, M. A comparison between artificial neural network and hybrid intelligent genetic algorithm in predicting the severity of fixed object crashes among elderly drivers. Accid. Anal. Prev. 2020, 138, 105468. [Google Scholar] [CrossRef]
  36. Ooi, S.Y.; Tan, S.C.; Cheah, W.P. Temporal Sleuth Machine with decision tree for temporal classification. Soft Comput. 2018, 22, 8077–8095. [Google Scholar] [CrossRef]
  37. Banerjee, A.; Raoniar, R.; Maurya, A.K. Pedestrian overpass utilization modeling based on mobility friction, safety and security, and connectivity using machine learning techniques. Soft Comput. 2020, 24, 17467–17493. [Google Scholar] [CrossRef]
  38. Mondal, A.R.; Bhuiyan, A.E.; Yang, F. Advancement of weather-related crash prediction model using nonparametric machine learning algorithms. SN Appl. Sci. 2020, 2, 1–11. [Google Scholar] [CrossRef]
  39. Chang, L.-Y.; Chien, J.-T. Analysis of driver injury severity in truck-involved accidents using a non-parametric classification tree model. Saf. Sci. 2013, 51, 17–22. [Google Scholar] [CrossRef]
  40. Chong, M.M.; Abraham, A.; Paprzycki, M. Traffic accident analysis using decision trees and neural networks. arXiv 2004, arXiv:cs/0405050. [Google Scholar]
  41. Beshah, T.; Hill, S. Mining road traffic accident data to improve safety: Role of road-related factors on accident severity in Ethiopia. In AAAI Spring Symposium: Artificial Intelligence for Development; The AAAI Press: Menlo Park, CA, USA, 2010; Volume 24, pp. 1173–1181. [Google Scholar]
  42. O′Connor, A. An Analysis of the Predictive Capability of C5. 0 and Chaid Decision Trees and Bayes Net in the Classification of fatal Traffic Accidents in the UK. Master′s Thesis, Technological University, Dublin, Ireland, 2015. [Google Scholar]
  43. Sut, N.; Simsek, O. Comparison of regression tree data mining methods for prediction of mortality in head injury. Expert Syst. Appl. 2011, 38, 15534–15539. [Google Scholar] [CrossRef]
  44. Prati, G.; Pietrantoni, L.; Fraboni, F. Using data mining techniques to predict the severity of bicycle crashes. Accid. Anal. Prev. 2017, 101, 44–54. [Google Scholar] [CrossRef]
  45. Hezaveh, A.M.; Azad, M.; Cherry, C.R. Pedestrian Crashes in Tennessee: A Data Mining Approach. Presented at the Transportation Research Board 97th Annual Meeting, Washington, DC, USA, 7–11 January 2018. [Google Scholar]
  46. Saracoglu, A.; Ozen, H. Estimation of Traffic Incident Duration: A Comparative Study of Decision Tree Models. Arab. J. Sci. Eng. 2020, 45, 8099–8110. [Google Scholar] [CrossRef]
  47. Behbahani, H.; Amiri, A.M.; Imaninasab, R.; Alizamir, M. Forecasting accident frequency of an urban road network: A comparison of four artificial neural network techniques. J. Forecast. 2018, 37, 767–780. [Google Scholar] [CrossRef]
  48. Amiri, A.M.; Nadimi, N.; Ragland, D.R.; Imaninasab, R. Predicting Crash Severity Based on Its Related Collision Type Using Five Data Mining Techniques. Presented at the Transportation Research Board 97th Annual Meeting, Washington DC, USA, 7–11 January 2018. [Google Scholar]
  49. Iranitalab, A.; Khattak, A. Comparison of four statistical and machine learning methods for crash severity prediction. Accid. Anal. Prev. 2017, 108, 27–36. [Google Scholar] [CrossRef] [PubMed]
  50. Singh, G.; Pal, M.; Yadav, Y.; Singla, T. Deep neural network-based predictive modeling of road accidents. Neural Comput. Appl. 2020, 32, 12417–12426. [Google Scholar] [CrossRef]
  51. Al-Ghamdi, A.S. Using logistic regression to estimate the influence of accident factors on accident severity. Accid. Anal. Prev. 2002, 34, 729–741. [Google Scholar] [CrossRef]
  52. Xi, J.; Liu, H.; Zhao, Z.; Ding, T. Correlation Analysis of Driver Factors to Traffic Accident Severity. In Proceedings of the ICTE 2013: Safety, Speediness, Intelligence, Low-Carbon, Innovation, Chengdu, China, 19–20 October 2013. [Google Scholar]
  53. Eboli, L.; Forciniti, C.; Mazzulla, G. Factors influencing accident severity: An analysis by road accident type. Transp. Res. Procedia 2020, 47, 449–456. [Google Scholar] [CrossRef]
  54. McCullagh, P.; Nelder, J. Generalized Linear Models, 2nd ed.; Chapman & Hall: London, UK, 1989. [Google Scholar]
  55. Çamdeviren, H.; Yazici, A.; Akkus, Z.; Bugdayci, R.; Sungur, M. Comparison of logistic regression model and classification tree: An application to postpartum depression data. Expert Syst. Appl. 2007, 32, 987–994. [Google Scholar] [CrossRef]
  56. Zeng, P. Neural Computing in Mechanics. Appl. Mech. Rev. 1998, 51, 173–197. [Google Scholar] [CrossRef]
  57. Priddy, K.L.; Keller, P.E. Artificial Neural Networks: An Introduction; SPIE Press: Bellingham, WS, USA, 2005. [Google Scholar]
  58. Ghorbani, M.A.; Zadeh, H.A.; Isazadeh, M.; Terzi, O. A comparative study of artificial neural network (MLP, RBF) and support vector machine models for river flow prediction. Environ. Earth Sci. 2016, 75, 1–14. [Google Scholar] [CrossRef]
  59. Shamsashtiany, R.; Ameri, M. Road accidents prediction with multilayer perceptron MLP modelling case study: Roads of Qazvin, Zanjan and Hamadan. J. Civ. Eng. Mater. Appl. 2018, 2, 181–192. [Google Scholar]
  60. Meireles, M.; Almeida, P.; Simoes, M. A comprehensive review for industrial applicability of artificial neural networks. IEEE Trans. Ind. Electron. 2003, 50, 585–601. [Google Scholar] [CrossRef] [Green Version]
  61. Wilkinson, L. Tree structured data analysis: AID, CHAID and CART. In Proceedings of the Sawtooth/SYSTAT Join Software Conference, Idaho, ID, USA, 1992. [Google Scholar]
  62. Wu, X.; Kumar, V.; Quinlan, J.R.; Ghosh, J.; Yang, Q.; Motoda, H.; McLachlan, G.J.; Ng, A.; Liu, B.; Yu, P.S.; et al. Top 10 algorithms in data mining. Knowl. Inf. Syst. 2008, 14, 1–37. [Google Scholar] [CrossRef] [Green Version]
  63. Yuan, Y.; Wang, S.; Liu, Z.; Cui, G.; Wang, Y. Influencing factors analysis of side right-angle collisions severity at intersections based on decision tree. Int. J. Crashworthiness 2020, 1–11. [Google Scholar] [CrossRef]
  64. Pandya, R.; Pandya, J. C5. 0 Algorithm to Improved Decision Tree with Feature Selection and Reduced Error Pruning. Int. J. Comput. Appl. 2015, 117, 18–21. [Google Scholar] [CrossRef]
  65. Milanović, M.; Stamenković, M. CHAID Decision Tree: Methodological Frame and Application. Econ. Themes 2016, 54, 563–586. [Google Scholar] [CrossRef] [Green Version]
  66. Kass, G.V. An Exploratory Technique for Investigating Large Quantities of Categorical Data. J. R. Stat. Soc. Ser. C 1980, 29, 119. [Google Scholar] [CrossRef]
  67. Atti, A.; Dodo, D. Chi-Square Automatic Interaction Detection (Chaid) Analysis for Home Quality Status Segmentation. Am. J. Eng. Res. 2018, 7, 183–188. [Google Scholar]
  68. Althuwaynee, O.F.; Pradhan, B.; Park, H.J.; Lee, J.H. A novel ensemble decision tree-based CHi-squared Automatic Interaction Detection (CHAID) and multivariate logistic regression models in landslide susceptibility mapping. Landslides 2014, 11, 1063–1078. [Google Scholar] [CrossRef]
  69. Cruz, A.P.D. Predicting the relapse category in patients with tuberculosis: A chi-square automatic interaction detector (CHAID) decision tree analysis. Open J. Soc. Sci. 2018, 6, 29. [Google Scholar] [CrossRef] [Green Version]
  70. Susanti, Y.; Zukhronah, E.; Pratiwi, H.; Respatiwulan; Sulistijowati, H.S. Analysis of Chi-square Automatic Interaction Detection (CHAID) and Classification and Regression Tree (CRT) for Classification of Corn Production. J. Phys. Conf. Ser. 2017, 909, 12041. [Google Scholar] [CrossRef]
  71. Šimundić, A.-M. Measures of Diagnostic Accuracy: Basic Definitions. EJIFCC 2009, 19, 203–211. [Google Scholar]
Figure 1. The flowchart and process for the prediction of crash severity in the present study. Note: ANN-MLP: Artificial neural network- multilayer perceptron; HSIS: Highway safety information system; PDO: Property damage only; MLR: Multinomial logistic regression; CHAID: Chi-square automatic interaction detector.
Sustainability 13 05670 g001
Figure 2. Crash Severity of Highways in California, USA in 2012–2014. Note: PDO: Property damage only.
Sustainability 13 05670 g002
Figure 3. Distribution of Five Severity Classes Regarding the C5.0 Model; Note: PDO: Property damage only.
Sustainability 13 05670 g003
Figure 4. Distribution of Five Severity Classes Regarding the CHAID Model; Note: PDO: Property damage only; Note. CHAID: Chi-square automatic interaction detector.
Sustainability 13 05670 g004
Figure 5. Relative Importance of Variables Based on the Proposed Models; Note: ANN-MLP: Artificial neural network-multilayer perceptron; CHAID: Chi-square automatic interaction detector.
Sustainability 13 05670 g005
Figure 6. Overall Prediction Performance Using Different Techniques; Note: ANN-MLP: Artificial neural network-multilayer perceptron; AUC: Area under the curve; CHAID: Chi-square automatic interaction detector.
Sustainability 13 05670 g006
Figure 7. Prediction data Using Different Proposed Models Based on Accuracy and the Number of Variables; Note: ANN-MLP: Artificial neural network-multilayer perceptron; CHAID: Chi-square automatic interaction detector.
Sustainability 13 05670 g007
Table 1. Qualitative and Quantitative Independent Variables Employed in the Models (2012–2014).
VariablesAbbreviationVariable SymbolData TypeCode/UnitDescriptionPercentage of Total Crashes (%)
201220132014
Cause of crashCAUSEX1Qualitative1Driving under influence6.78.710.6
2Following too closely1.97.414.9
3Failure to yield2.97.342.50
4Improper turn16.714.5913.99
5Speeding46.939.7950.82
6Other violations (Hazardous)19.917.7711.89
7Other improper driving0.21.20.9
8Alcohol/drug use4.82.53.2
9Fell asleep00.71.2
Weather conditionWEATHERX2Qualitative1Clear79.463.8054.32
2Cloudy15.919.8935.88
3Raining3.79.735.1
4Snowing0.33.182.7
5Fog0.32.81.6
6Wind000
7Other0.10.60.3
8Not stated0.300.1
Road surface conditionRDSURFX3Qualitative1Dry88.777.8967.21
2Wet1019.4528.14
3Snowy or icy0.82.063.7
4Slippery or muddy0.10.60.95
5Not stated0.400
Lighting conditionsLIGHTX4Qualitative1Daylight697884.52
2Dusk—Dawn3.45.83.7
3Dark—Street Lights15119.18
4Dark—No Street Lights12.12.91.7
5Dark—Street Lights Not Functioning0.31.90.9
6Not stated0.30.40
Number of vehiclesNUMVEHSX5Qualitative1–91 to 9 vehicles involved in a crash22.7; 60.5; 12.9; 3; 0.7; 0.2; 0; 0.26.7; 59.5; 10.9; 1.7; 0.8; 0.4; 0; 018.87; 47.8; 19.9; 11.63; 0.9; 0.3; 0.6; 0.
10–1510 to 15 vehicles involved in a crash0; 0; 0; 0; 0; 0.0; 0; 0; 0; 0; 0.0; 0; 0; 0; 0; 0.
Median typeMED_TYPEX6Qualitative1Undivided, Not Separated or Striped0.10.30.2
2Undivided, Striped10.47.9712.6
3Undivided, Reversible Peak Hour Lane (S)000
4Divided, Two-Way Left Turn Lane0.90.40.7
5Divided, Continuous Left-Turn Lane2.21.90.8
6Divided, Paved Median49.859.6848.89
7Divided, Unpaved Median17.216.6620.51
8Divided, Separate Grades3.81.92.9
9Divided, Separate Grades with Retaining Wall0.100
10Divided, Sawtooth (Paved)000
11Divided, Separate Structure14.510.713.4
12Divided, Railroad or Rapid Transit0.30.50
13Divided, Bus Lanes000
14Divided, Other0.600
Facility accessACCESSX7Qualitative1Conventional—No Access Control20.329.7820.97
2Expressway—Partial Access Control8.16.534.8
3Freeway—Full Access Control71.163.6974.23
4One-Way City Street—No Access Control0.400
Design speedDESG_
SPD
X8Qualitative1<30 mile/h0.20.10
230 mile/h0.40.70.8
335 mile/h0.71.30.9
440 mile/h1.83.81.7
545 mile/h3.22.91.5
650 mile/h3.91.94.5
755 mile/h2.72.013.90
860 mile/h8.35.78.7
965 mile/h8.810.69.04
10>70 mile/h70.170.9968.96
Surface typeSURF_TYPX9Qualitative1PCC, Bridge Deck27.919.9120.89
2PCC, Concrete36.432.7837.89
3Unpaved-Earth000
4Unpaved-Undetermined000
5AC, Base & Surface 7” Thick33.343.8634.67
6AC, Base & Surface < 7” Thick1.22.663.7
7AC, Oiled Earth-Gravel0.100.55
8AC, Bridge Deck (2” Or Greater)000
9Not stated10.82.3
GenderDRV_SEXX10Qualitative1Male59.865.2169.89
2Female33.834.7930.11
3Not stated6.400
Driver’s ageDRV_AGEX11Quantitative0Age from 16 to 2517.5622.6728.17
126 to 3547.8056.0749.96
236 to 4522.1311.6313.71
3above 4612.519.638.16
Number of lanesNO_
LANES
X12Quantitative-
Lane widthLANEWIDX13QuantitativeFt
Median widthMEDWIDX14QuantitativeFt
Annual Average Daily TrafficAADTX15Quantitative(Veh/year)
Left shoulder widthLSHLDWIDX16QuantitativeFt
Left paved shoulder widthPAV_WDLX17QuantitativeFt
Surface widthSURF_WIDX18QuantitativeFt
Right shoulder widthRSHLDWIDX19QuantitativeFt
Right paved shoulder widthPAV_WIDRX20QuantitativeFt
Table 2. Statistical Analysis of Quantitative Variables.
VariablesMeanMedianStd. DeviationRangeMin.Max.
Drv_age37.553615.311841599
No_LANES6.1362.66712214
LANEWID40.964218.69286389
MEDWID32.632231.85199099
AADT11,866.6991,50085,212.204354,7720354,772
LSHLDWID4.8353.87426026
PAV_WID4.5343.87426026
SURF_WID37.113616.51983083
RSHLDWID7.0583.91620020
PAV_WIDR6.8184.00920020
Range = Max − Min.
Table 3. Hyper-parameter Settings for All Classifiers in the Present Study.
ClassifierParameterDescriptionValues
C5.0Binary splitsWhether to use binary splits on nominal attributes when building the treesFalse
Min Num ObjMinimum number of instance per leaf2
Num foldsDetermination of the amount of data used for reduced-error pruning3
Confidence factorThe confidence factor used for pruning0.25
UnprunedWhether pruning is performableFalse
CHAIDBinary splitsWhether to use binary splits on nominal attributes when building the treesFalse
Min Num ObjMinimum number of instance per leaf2
Num foldsDetermination of the amount of data used for reduced error pruning3
Confidence factorThe confidence factor used for pruning0.25
UnprunedWhether pruning is performableFalse
ANN-MLPHidden layersThe number of hidden layersa (i.e., one hidden layer with 10 nodes)
Learning rateThe amount of the weights is updated0.3
MomentumMomentum applied to the weights during updating0.2
Normalize attributesThis will normalize the attributesTrue
ResetThis will allow the network to reset with a lower learning rateTrue
Note: ANN-MLP: Artificial neural network-multilayer perceptron; CHAID: Chi-square automatic interaction detector.
Table 4. Partial Output of the Decision Tree (C5.0 and CHAID) Rules.
Decision Tree TechniquesClass AttributeNumber of RulesGenerated RulesTotal Number of Instances/Misclassified Instances
C5.0PDO12CAUSE (X1) = Other Violations (Hazardous) AND NUMVEHS (X5) = Two vehicles involved in a crash AND RDSURF (X3) = Dry AND DESG_SPD (X8) = 60 mile/h AND WEATHER (X2) = Clear AND
Drv_age (X11) = 36 to 45
10
Fatal25CAUSE (X1) = Speeding AND NUMVEHS (X5) = Two vehicles involved in a crash AND RDSURF (X3) = Dry25.0/3.0
CAUSE (X1) = Speeding AND NUMVEHS (X5) = Two vehicles involved in a crash AND DESG_SPD (X8) = >70 mile/h AND WEATHER (X2) = Clear AND Drv_age (X11) = 26 to 3523.0/8.0
Severe injury96CAUSE (X1) = Speeding AND NUMVEHS (X5) = Two vehicles involved in a crash AND RDSURF (X3) = Dry AND DESG_SPD (X8) = >70 mile/h AND Drv_age (X11) = 26 to 35 And LIGHT (X4) = Daylight And DRV_SEX (X10) = Male18.0/5.0
CAUSE (X1) = Speeding AND NUMVEHS (X5) = Two vehicles involved in a crash AND WEATHER (X2) = Clear AND DRV_SEX (X10) = Female15.0/4.0
CAUSE (X1) = Speeding AND NUMVEHS (X5) = Two vehicles involved in a crash AND WEATHER (X2) = Cloudy AND Drv_age (X11) = 26 to 35 AND DRV_SEX (X10) = Male11.0/3.0
Other visible injuries135CAUSE (X1) = Other Violations (Hazardous) AND NUMVEHS (X5) = Two vehicles involved in a crash AND DESG_SPD (X8) >65 mile/h AND Drv_age (X11) = 26 to 3587.0/12.0
DESG_SPD (X8) = >65 mile/h AND LIGHT (X4) = Dark − Street Lights AND ACCESS (X7) = Conventional − No Access Control66.0/11.0
NUMVEHS (X5) = Two vehicles involved in a crash AND DESG_SPD (X8) = >65 mile/h AND DRV_SEX (X10) = Male43.0
DESG_SPD (X8) = >65 mile/h AND Drv_age (X11) = 26 to 35
AND RDSURF (X3) = Dry
37.0/7.0
CAUSE (X1) = Other Violations (Hazardous) AND NUMVEHS (X5) = Two vehicles involved in a crash AND DESG_SPD (X8) = >65 mile/h55.0/9.0
Complain of pain189CAUSE (X1) = Other Violations (Hazardous) AND Drv_age (X11) = 36 to 4545.0/6.0
NUMVEHS (X5) = Two vehicles involved in a crash AND DESG_SPD (X8) = >65 mile/h AND AADT (X15) AND DRV_SEX (X10) = Male78.0/21.0
NUMVEHS (X5) = Three vehicles involved in a crash AND SURF_TYP = PCC, Bridge Deck AND Drv_age (X11) =36 to 45123.0/34.0
CAUSE (X1) = Improper turn AND NUMVEHS (X5) = Two vehicles involved in a crash AND LIGHT (X4) = Daylight98.0/33.0
CHAIDPDO23CAUSE (X1) = Other Violations (Hazardous) AND NUMVEHS (X5) = Two vehicles involved in a crash WEATHER(X2) = Dry20.0/2.0
Fatal35CAUSE (X1) = Speeding AND NUMVEHS(X5) = Two vehicles involved in a crash WEATHER(X2) = Dry AND AADT (X15)30.0/3.0
CAUSE (X1) = Speeding AND NUMVEHS(X5) = Two vehicles involved in a crash AND DRV_SEX (X10) = Male19.0/2.0
Severe injury110CAUSE (X1) = Speeding AND NUMVEHS(X5) = Two vehicles involved in a crash WEATHER(X2) = Dry AND Drv_age (X11) = 26 to 3588.0/7.0
CAUSE (X1) = Speeding AND NUMVEHS (X5) = Two vehicles involved in a crash AND DESG_SPD (X8) = >65 mile/h AND DRV_SEX (X10) = Male65.0/12.0
DESG_SPD (X8) = >70 mile/h AND WEATHER (X2) = Clear AND LIGHT(X4) = Daylight40.0/9.0
Other visible injuries145CAUSE (X1) = Other Violations (Hazardous) AND NUMVEHS (X5) = Two vehicles involved in a crash AND DRV_SEX (X10) = Male121.0/13.0
CAUSE (X1) = Other Violations (Hazardous) AND NUMVEHS (X5) = Two vehicles involved in a crash AND WEATHER (X2) = Raining76.0/15.0
SURF_TYP = PCC, Concrete AND Drv_age (X11) = 26 to 35 AND RDSURF (X3) = Wet59.0/13.0
DRV_SEX = Male AND LIGHT (X4) = Dark − Street Lights
AND Drv_age (X11) = 26 to 35
33.0/4.0
Complain of pain198CAUSE (X1) = Other Violations (Hazardous) AND
Drv_age (X11) = 36 to 45
134.0/22.0
NUMVEHS (X5) = Two vehicles involved in a crash AND AADT (X15)And LIGHT (X4) = Daylight AND DRV_SEX (X10) = Male89.0/13.0
NUMVEHS (X5) = One vehicle involved in a crash AND SURF_TYP (X9) = PCC, Concrete AND Drv_age (X11) = 36 to 45 AND AADT (X15)64.0/18.0
CAUSE (X1) = Other Violations (Hazardous) AND NUMVEHS (X5) = Three vehicles involved in a crash AND Drv_age (X11) = 36 to 4546.0/11.0
CAUSE (X1) = Improper turn AND NUMVEHS (X5) = Two vehicles involved in a crash AND DESG_SPD (X8) = >65 mile/h38.0
Note. PDO: Property damage only; CHAID: Chi-square automatic interaction detector.
Table 5. Confusion Matrix.
True ClassPredicted Class
PositiveNegative
PositiveTPFN
NegativeFPTN
Note: TP: True positive; FP: False positive; FN: False negative; TN; True negative.
Table 6. Different Proposed Types of Logistic Regression Equations.
Model TypeDescriptionSimulating PerformanceAccuracy Rate (%)
MLR MainIn the proposed models, all sets of the variable are applied.Training68.21%
Validation59.37%
MLR InterTraining82.34%
Validation44.27%
MLR PolyTraining55.10%
Validation38.61%
MLR Main InterIn the proposed models, considering two factors interaction for class variable sets used are included.Training91.56%
Validation34.77%
MLR Main PolyTraining74.29%
Validation54.44%
MLR Inter PolyTraining66.10%
Validation44.89%
MLR Main Inter PolyPoly Term is in the model polynomial which terms up to the degree specified for all interval variables used. Poly Degree specifies the polynomial degree when the term is included in the proposed modelTraining77.22%
Validation51.98%
Note: MLR: Multinomial logistic regression.
Table 7. Significance Level of Independent Variables.
VariableAIC *BIC *Simplified Model Negative Twice Logarithmic Likelihood Valuesχ2Df *Significance Level
Effect of the intercept1.20 × 1041.43 × 1041.03 × 10400---
X11.23 × 1041.40 × 1041.08 × 1041830.018
X21.24 × 1041.42 × 1041.12 × 1041560.001
X31.25 × 1041.44 × 1041.16 × 1042690.004
X41.28 × 1041.47 × 1041.13 × 1043750.011
X51.32 × 1041.52 × 1041.24 × 1042820.026
X61.36 × 1041.58 × 1041.29 × 1041780.189
X71.28 × 1041.66 × 1041.22 × 1041870.870
X81.21 × 1041.55 × 1041.14 × 10445100.005
X91.24 × 1041.45 × 1041.17 × 1043440.086
X101.26 × 1041.61 × 1041.18 × 1042260.177
X111.12 × 1041.22 × 1041.16 × 1041450.031
X121.29 × 1041.68 × 1041.21 × 1042330.121
X131.20 × 1041.38 × 1041.13 × 1045470.091
X141.19 × 1041.37 × 1041.12 × 10431110.220
X151.30 × 1041.50 × 1041.23 × 10425170.178
X161.18 × 1041.36 × 1041.11 × 10427120.101
X171.17 × 1041.34 × 1041.09 × 1042110.231
X181.20 × 1041.35 × 1041.10 × 1041730.183
X191.15 × 1041.32 × 1041.05 × 1041920.224
X201.22 × 1041.39 × 1041.14 × 1041620.351
* Note: AIC: Akaike information criterion of the simplified model; BIC: Bayesian information criterion of the simplified model. Lower values of AIC, BIC, and χ2 value indicate lower penalty terms, hence, an important variable is selected in the model. df: Degree of freedom.
Table 8. MLR model for crash severity.
Crash SeverityMLR ModelVariable
PDO p y 1 = exp 1.45 + 0.543 x 1 0.344 x 2 0.32 x 3 + 0.42 x 4 + 0.67 x 5 + 0.71 x 8 0.25 x 11 1 + exp 1.45 + 0.543 x 1 0.344 x 2 0.32 x 3 + 0.42 x 4 + 0.67 x 5 + 0.71 x 8 0.25 x 11 X1 = 5; X2 = 1; X3 = 1; X4 = 1; X5 = 5; X8 = 9;
X11 = 1;
Fatality y 2 = exp 2.08 + 0.52 x 1 0.44 x 2 0.31 x 3 + 0.22 x 4 + 0.47 x 5 + 0.51 x 8 0.27 x 11 1 + exp 2.08 + 0.52 x 1 0.44 x 2 0.31 x 3 + 0.22 x 4 + 0.47 x 5 + 0.51 x 8 0.27 x 11 X1 = 5; X2 = 1; X3 = 1; X4 = 1; X5 = 2; X8 = 10;
X11 = 0;
Severe injuries y 3 = exp 3.21 + 0.42 x 1 0.21 x 2 0.12 x 3 + 0.56 x 4 + 0.43 x 5 + 0.61 x 8 0.33 x 11 1 + exp 3.21 + 0.42 x 1 0.21 x 2 0.12 x 3 + 0.56 x 4 + 0.43 x 5 + 0.61 x 8 0.33 x 11 X1 = 4; X2 = 1; X3 = 2; X4 = 1; X5 = 1; X8 = 9;
X11 = 0;
Other visible injuries y 4 = exp 4.21 + 0.22 x 1 0.11 x 2 0.37 x 3 + 0.55 x 4 + 0.23 x 5 + 0.11 x 8 0.47 x 11 1 + exp 4.21 + 0.22 x 1 0.11 x 2 0.37 x 3 + 0.55 x 4 + 0.23 x 5 + 0.11 x 8 0.47 x 11 X1 = 6; X2 = 2; X3 = 2; X4 = 2; X5 = 3; X8 = 10;
X11 = 0;
Complaint of pain y 5 = exp 5.12 + 0.17 x 1 0.49 x 2 0.61 x 3 + 0.15 x 4 + 0.39 x 5 + 0.57 x 8 0.38 x 11 1 + exp 5.12 + 0.17 x 1 0.49 x 2 0.61 x 3 + 0.15 x 4 + 0.39 x 5 + 0.57 x 8 0.38 x 11 X1 = 5; X2 = 1; X3 = 1; X4 = 1; X5 = 4; X8 = 9;
X11 = 1;
Table 9. Goodness of Fit.
Statistical Parameterχ2dfSignificance Level
Pearson13,764.6412,948.010.076
Deviation12,100.3812,948.010.083
Table 10. Data of Prediction Crash Severity Regarding the C5.0 Model.
AlgorithmSampleCrash SeverityCorrectly Classified InstancesIncorrectly Classified InstancesAccuracy
(Recall)
AUCsTime
(Seconds)
C5.0Using training setPDO = 193,09914,25786.72%0.9230.05
Fatal = 23210323.67%0.912
Severe injury = 38312639.65%0.907
Other visible injury = 438430455.78%0.915
Complaint of pain = 5169073169.80%0.956
Overall95,28812,88388.09%0.950
Cross validation (10-fold)PDO = 170,62019,27378.56%0.7820.03
Fatal = 2182150010.82%0.678
Severe injury = 321099317.45%0.699
Other visible injury = 4631188225.11%0.641
Complaint of pain = 5885104845.78%0.781
Overall89,76134,76772.08%0.832
Resampled training setPDO = 189,920520394.53%0.9670.87
Fatal = 237811476.87%0.954
Severe injury = 352910683.26%0.938
Other visible injury = 484110389.10%0.977
Complaint of pain = 5143415490.33%0.981
Overall93,10210,98189.45%0.985
Note: PDO: Property damage only; AUC: Area under the curve.
Table 11. Data of Prediction Crash Severity Regarding the CHAID Model.
AlgorithmSampleCrash SeverityCorrectly Classified InstancesIncorrectly Classified InstancesAccuracy
(Recall)
AUCsTime
(Seconds)
CHAIDUsing training setPDO = 185,50213,08286.73%0.9530.76
Fatal = 2901290623.67%0.932
Severe injury = 32930503636.78%0.920
Other visible injury = 4384157668.95%0.921
Complaint of pain = 53528410.99%0.928
Overall93,20927,51277.21%0.945
Cross validation
(10-fold)
PDO = 182,03238,62167.99%0.6211.59
Fatal = 2345616,50917.31%0.634
Severe injury = 3489716,66622.71%0.678
Other visible injury = 41230241335.76%0.731
Complaint of pain = 5899128.89%0.760
Overall91,70486,18951.55%0.794
Resampled training setPDO = 186,13411,07288.61%0.9830.78
Fatal = 2240973676.60%0.985
Severe injury = 33080364845.78%0.871
Other visible injury = 489746465.90%0.890
Complaint of pain = 51283976.89%0.850
Overall92,64822,45780.49%0.961
Note: PDO: Property damage only; AUC: Area under the curve; CHAID: Chi-square automatic interaction detector.
Table 12. Data of Prediction Crash Severity Regarding the ANN-MLP Model.
AlgorithmSampleCrash SeverityCorrectly Classified InstancesIncorrectly Classified InstancesAccuracy
(Recall)
AUCsTime
(Seconds)
ANN-MLPUsing training setPDO = 190,97151,90763.67%0.763179.0
Fatal= 276189745.89%0.785
Severe injury = 31588265.81%0.943
Other visible injury = 430374528.90%0.952
Complaint of pain = 5922465216.54%0.955
Overall93,11539,50970.210.876
Cross validation
(10-fold)
PDO = 187,59148,80164.22%0.567379
Fatal = 28318630.89%0.618
Severe injury = 33410125.10%0.721
Other visible injury = 419983619.23%0.745
Complaint of pain = 578476829.26%0.789
Overall88,69176,16253.80%0.804
Resampled training setPDO = 179,210101,18288.61%0.921384
Fatal = 2263444085.67%0.935
Severe injury = 3128934578.90%0.956
Other visible injury = 4314067282.38%0.867
Complaint of pain = 5432072885.57%0.892
Overall90,59328,23376.24%0.926
Note: ANN-MLP: Artificial neural network-multilayer perceptron; AUC: Area under the curve; PDO: Property damage only.
Publisher’s Note: MDPI stays neutral with regard to jurisdictional claims in published maps and institutional affiliations.

