Article

How Do Brazilian Consumers Relate to Chocolate Brands? Validity and Reliability Evidence of the Chocolate Brands Relationship Scale

1
Graduate Program in Business Administration (PPGA/UnB), University of Brasília, Brasília 70910-900, Brazil
2
Graduate Program in Business Administration (PPGAdm/UFSC), Federal University of Santa Catarina, Florianópolis 88040-900, Brazil
*
Author to whom correspondence should be addressed.
Sustainability 2021, 13(10), 5635; https://doi.org/10.3390/su13105635
Submission received: 29 March 2021 / Revised: 8 May 2021 / Accepted: 11 May 2021 / Published: 18 May 2021
(This article belongs to the Special Issue Consumers’ Preferences and Food Products)

Abstract

:
Although the chocolate market has become increasingly larger and more competitive, no diagnostic measures were found to evaluate relationship marketing from customer perspectives in this very attractive market in the B2C context. Thus, the main purpose of this paper is to obtain validity evidence for the Chocolate Brands Relationship Scale (CBR Scale), a scientific instrument that enables the identification and measurement of the prime aspects perceived by chocolate brands’ customers as relevant in their relationship with such brands. Additionally, we tested the influence of the relationship, evaluated from the validated CBR Scale, with the chocolate consumers’ satisfaction. We conducted a survey with 523 Brazilian consumers, and data were analyzed using Confirmatory Factor Analysis. The CBR Scale is composed of 21 items divided into three factors: Brand Trust, Shopping Experience and Perceived Quality. As theoretical implications, we produce a valid and reliable operational measure, offering a useful starting point from which further theoretical and empirical research of customer relationship management, branding strategies, brand loyalty, and brand experience in the chocolate market can be built. Managerially, the CBR Scale is a valid instrument for practitioners and managers in the chocolate sector to access customers, establishing and developing long-term relationships with them.

1. Introduction

Chocolate consumption has changed in the past years from a commodity product to a self-indulgent treat [1], a symbolic consumption product [2], a consumption experience [3], a high luxury good [4] and even an addiction [5]. This transformation in consumer behavior is linked to the expansion of the brands in this sector, from the supermarket treats to gift boxes, from dark chocolate to the sweetest flavors, and from handcrafted to sophisticated chocolate [6]. Consequently, competition has increased, leading brands to invest in branding strategies in order to achieve sustainable competitive advantages in this market [7].
One of the main goals of a branding strategy is to foster relationships between brands and consumers [8], the context in which relational strategies have contributed to promoting affective and emotional bonds between consumers and brands and, from this, foster long-term relationships [9], creating relational benefits for both parts [10]. This is a topic of major interest in marketing literature [11], since the relationship between brands and customers is known to promote brand attachment, brand passion and commitment to the brand, important predictors of brand loyalty, conducting brands’ performance in the long-term [12].
From this discussion, it is reasonable to say that the relational strategies are a paramount element for chocolate brands differentiation, leading us to the relationship marketing research and its focus on attracting, maintaining and developing relationships with customers, a process based on transforming indifferent customers in loyal customers to the brand [13]. This means that consumers, in order to relate with a brand, consider not only the tangible attributes, encompassing intangible characteristics such as the positive associations and perception about a specific brand [10]. In this sense, relationship marketing is an adequate path to investigate the relationship between customers and chocolate brands, since consumers’ decision for these brands are based on the taste, texture, flavor, price and product size [14] and also on hedonic aspects like the psychological meaning of eating chocolate, the emotional aspect of consumption and the gratification feeling brought by chocolate [5].
However, research has signaled that customer loyalty is associated with the product itself, not to a specific brand, meaning that consumers may seek for the product and not for the brand [15], setting for chocolate brands the imperative of differentiation. Moreover, the chocolate market has become increasingly larger and more competitive. However, no confirmatory studies have been found that aim to access the relationship with customers in this vibrant and attractive market, constituting a literature gap. Based on the possibilities brought by relational strategies as drivers of several branding dimensions, we wonder: how to evaluate the relationship with chocolate brands, from the perspective of consumers?
To address this question, the main purpose of this paper is to obtain validity evidence for the Chocolate Brands Relationship Scale (CBR Scale), an unprecedented measurement model that enables the evaluation of the relationship between consumers and chocolate brands, from the perspective of consumers. In addition, we tested both the association and the influence of the relationship perception and its dimensions (Brand Trust, Shopping Experience and Perceived Quality), based on the validated CBR Scale, on the chocolate consumers satisfaction, in order to assess the behavior of the scale with different constructs, providing evidence of the possibility to include the variable “relationship with chocolate brand” in future structural models tests.
Our proposal is meaningful for scholars because, as defended by Churchill [16] and Rossiter [17], the development of better measures is a paramount element in the evolution of marketing knowledge, also contributing to better managerial practices. In the field of relationship marketing, scientific measurements play an important role for both academics and practitioners, as scales represent a valid measure of a construct, enabling the assessment of relationship marketing variables in other marketing and organizational variables [18]. This is particularly important in future relational studies, as the development of scientific scales provides a safe path for researchers to really measure what they say they are measuring [19].
Besides, the more a scale is validated in different sectors, cultures and countries, the more external validity and generalization it gains [20], making it an increasingly valid operational measure for the development of scientific relational studies. Thus, the CBR Scale offers a useful starting point from which further theoretical and empirical research of customer relationship management in the chocolate market can be built. For practitioners, the CBR Scale proved to be a valid and reliable operational instrument to evaluate customers’ perceptions, working as a diagnostic tool to help managers in the chocolate industry develop more effective branding, product positioning and advertising strategies.
Considering the discussion on relationship marketing, we raised the possibility of validating a scale customized for the chocolate brands sector, a large retail sector, being its consumption being a combination of tangible and intangible factors [1,3,5], which calls for specific attention to the particularities of this segment.
Additionally, previous studies [11,21,22,23,24] have indicated the relevance of brand-relationship in the satisfaction with the products consumed, in this case, chocolates. On that basis, we also intend to test the association between the dimensions of the relationship with chocolate brands (Brand Trust, Shopping Experience and Perceived Quality) and satisfaction with products.
By providing a scientific measurement for marketing and consumer behavior research, as well as by investigating the association between customer–brand relationship and customer satisfaction, our study also contributes by shedding light on the relationship between brands and consumers in an emerging economy, as the locus of the research is Brazil. The country has been facing challenges regarding adopting relational strategies and sustainability practices to promote a closer relationship with customers, a topic that is addressed in the CBR Scale and shown as relevant, which can contribute not only with the literature concerning consumer–brand relationship but consumer perception about brands’ actions towards sustainability.

2. Theoretical Background

The seminal paper of Susan Fournier, in 1998, initiated a research tradition dedicated to the relationship between consumers and their brands [12,25]. The relationship between consumers and brands starts in the lived experience [26], based on the opinions, attitudes, feelings, perceptions and evaluations the consumer has about the brand [11]. However, as proposed by Allen et al. [25], the understanding of brands and their relationship with the public must go beyond branding strategies in order to maintain competitiveness, covering aspects that address the consumer perspective, corporate strategies and the cultural background. In this context, relationship marketing can be a helpful path to better understanding the customer–brand relationship.
Theoretically, relationship marketing is a business philosophy that promotes and enhances the relationship between companies, customers and partners with the objective of creating relations value for the involved actors [21]. Relationship marketing has set, since the 1980′s, a paradigm shift in marketing research and practice: from the attraction and acquisition of consumers, with the main objective of selling, brands and organizations are now focused on developing a long term relationship with customers [13], in which relational benefits arise for both customers and companies [27].
This research paradigm gained popularity, particularly on the managerial perspective, during the 1990′s with the rise of Customer Relationship Management (CRM), a set of strategic aspects combining the purposes of relationship marketing and the potential of information and communication technology (ICT) in order to manage the relationship with customers and generate shareholder value [28]. Conceptually, it is important to understand the differences between the constructs, being relationship marketing broader strategic management philosophy, since it is concerned with relationships with multiple stakeholders, while the focus of CRM should be primarily on the customer being developed through ICT [29,30].
It is also important to clarify that CRM is not a technological tool or a set of software. Having its origin in relationship marketing, it is a strategic and holistic organizational approach, which uses ICT to achieve its objectives of strengthening the relationship with customers [31]. According to these authors, such distinction is not a matter of semantic preciousness, but an important recognition that affects not only managerial practice, but also the advance in the academic literature on this matter. In this scenario, we must also shed light on the conceptual confusions between relationship marketing as a synonym for repurchase, retention rate analysis or loyalty programs, being these specific relational strategies encompassed by the major construct of relationship marketing [21,27].
Accessing a bigger share of consumers’ “heart, mind, and wallet” [32] (p. 23) remains a contemporary challenge of relational strategies. According to Grönroos [10], companies must develop a relationship marketing readiness in order to maintain and enhance relationships with consumers, which means broadening their touchpoints and interactions. The product is only in part responsible for consumer value, indicating the need of providing better service along with emotional connection [10]. The best way to do it, as indicated by Gómez-Suárez et al. [9], is to focus on taking care of consumers, understanding them not merely as consumers, but as complex human beings, accessing what they are looking for when choosing a brand between many other brands in the market.
In the relationship marketing research, a recent literature review confirms the focus on consumers as the main driver of organizational results, indicating customer loyalty as one of the main trends to be addressed by the role of branding, loyalty programs and the use of social media as a relational tool [33]. These results are in line with the meta-analysis of Fetscherin and Heinrich [12] and the literature review published by Gómez-Suárez et al. [9] on customer–brand relationship, both addressing relational strategies to be closer to customers and develop strong and lasting bonds with them. Furthermore, the efforts of the Journal of Product and Brand Management in publishing a special issue dedicated only to the latest research on brand relationships reinforce the relevance of relationship marketing to access consumers’ opinions, attitudes and feelings, understanding the actions to be followed in order to reach consumers’ preference and loyalty [11]. In this regard, brands need to focus on identifying and understanding consumers’ needs, habits, and lifestyles, enabling the creation of value proposals in consumers’ perception [10,27].
Empirical research on relationship marketing has shown that the adoption and implementation of relational strategies, that intend to approximated customers and brands, has proved to be an important driver of new products development [34], innovative capacity [35], consumer satisfaction [36], commitment to the brand [37], consumer loyalty [38] and brands’ profit and market share [8]. However, the advance of these relational strategies is connected to the customer recognition of the relationship with a brand/company, the reason why Grönroos [27] affirms that consumer perception is the first step into developing a relationship, since there will be no relationship if consumers do not recognize the nature of such bonds. Similarly, Fournier and Alvarez [39] shed light on the dialogue between consumers’ perception and its effect on customer–brand relationships, suggesting that the way consumers perceive a brand can influence the way they relate to the brand.
This discussion led us to customer perception, a relationship marketing construct proposed by Rozzett and Demo [40] as the main aspects perceived by consumers that enable the establishment and the development of long-term relationships. Their contribution was a scale to measure customer relationship perception under the business-to-consumer perspective, which was further validated in the United States [41] and France [42], certifying its validity and reliability, in other words, its capacity of measuring customer relationship perception.
In line with the idea of respecting the context and product category, the above-mentioned scale was validated for specific sectors of the economy, in an attempt not only to validate the internal structure of the scale, but to respect the particularities of each context of analysis. The scale was validated for luxury brands [43], resulting in the factors brand experience, loyalty and brand image. In the context of airline brands [44], the dimensions attitudinal loyalty, purchase experience, flight experience, and service were found. As for telecommunication brands, the authors identified the factors quality, service and attitudinal loyalty [45]. In the supermarket scenario, customer relationship perception is composed of shopping experience, value experience and attitudinal loyalty. Lastly, in the context of games [46], the factors attitudinal loyalty and satisfaction have emerged.
By analyzing the analytical framework on customer relationship perception, we observe the relevance of experience as an important dimension of customer relationship perception (brand experience, shopping experience, purchase experience, flight experience and value experience), along with trust, attitudinal loyalty, service/customer care and quality. It is reasonable to say that, respecting the context of analysis, these are the empirical building blocks of customer relationship perception.
As expected results of a well-established consumer–brand relationship, we can mention word-of-mouth behavior [47], behavioral loyalty [48,49] and satisfaction [22,23,24,50]. Thus, we are able to propose our first research hypothesis:
Hypothesis 1 (H1).
There is a positive association between relationship with chocolate brands and satisfaction with products.
Specifically considering the dimensions proposed here for the CBR Scale, the influence of trust on customer satisfaction [51] and of quality on customer satisfaction [49] is already consensual in the literature, which allows us to define the second and third hypotheses.
Hypothesis 2 (H2).
There is a positive association between trust in chocolate brands and customer satisfaction.
Hypothesis 3 (H3).
There is a positive association between perceived chocolate brands quality and customer satisfaction.
Recently, the influence of customer experience on customer satisfaction has been tested [52], providing the foundation for our fourth research hypothesis.
Hypothesis 4 (H4).
There is a positive association between shopping experience with chocolate brands and customer satisfaction.

3. Methods

This article reports a survey with customers of chocolate brands with the purpose of getting validity evidence of the Chocolate Brands Relationship Scale (CBR Scale), using Confirmatory Factor Analysis (CFA). So, the research can be classified as descriptive and instrumental, conducted through a survey, with a quantitative and cross-sectional design [53].
Regarding the development of the CBR Scale, the items that compose it, as well as its factors, were originated, in addition to the literature review on relationship marketing, from previous qualitative analyses. First, 27 interviews were conducted, 21 with chocolate consumers in general and 6 with managers and employees working in the chocolate sector (e.g., stores, factories). The analysis of thematic categorical content [54] of these interviews revealed the 3 factors presented here, namely Brand Trust, Shopping Experience and Perceived Quality. Then, following the assumptions of Kerlinger and Lee [55], an analysis of judges was carried out, with 6 participants, 4 professors from Brazilian universities and 2 specialists in the chocolate market, to assess the pertinence of the items and the scale factors to the “relationship marketing” construct. Finally, a semantic analysis was carried out by 22 Business Administration undergraduate students from a Brazilian university, with the objective of verifying the clarity of the items on the scale, functioning as a pre-test for its application.
After these qualitative analyses, a previous exploratory study of the CBR Scale reached an instrument of 30 items [56]. Synthesizing the results regarding this exploratory factor analysis (EFA), first of all, the sample of 367 participants was adequate for factor analysis (KMO = 0.83). Regarding the determination of the number of factors to be extracted, both scree plot and parallel analysis considered the most reliable test in 92% of the cases [57], indicated 3 factors. Next, we adopted the Promax oblique rotation, considering that behavioral studies presuppose correlations between variables. The minimum acceptable factor load was 0.55 so that the scale included only good, very good and excellent items [58].
Thus, the results of the exploratory validation of the CBR Scale revealed a multifactorial structure containing 30 items distributed in 3 factors, supported theoretically and consistent with the content analysis carried out in the qualitative stage, called: Brand Trust, Shopping Experience and Perceived Quality. These factors explained about 40% of the total variance of the “relationship” construct and were highly reliable according to Nunnally and Bernstein [59] (Cronbach’s Alpha indexes 0.80 for Brand Trust; 0.88 for Shopping Experience; 0.85 for Perceived Quality).
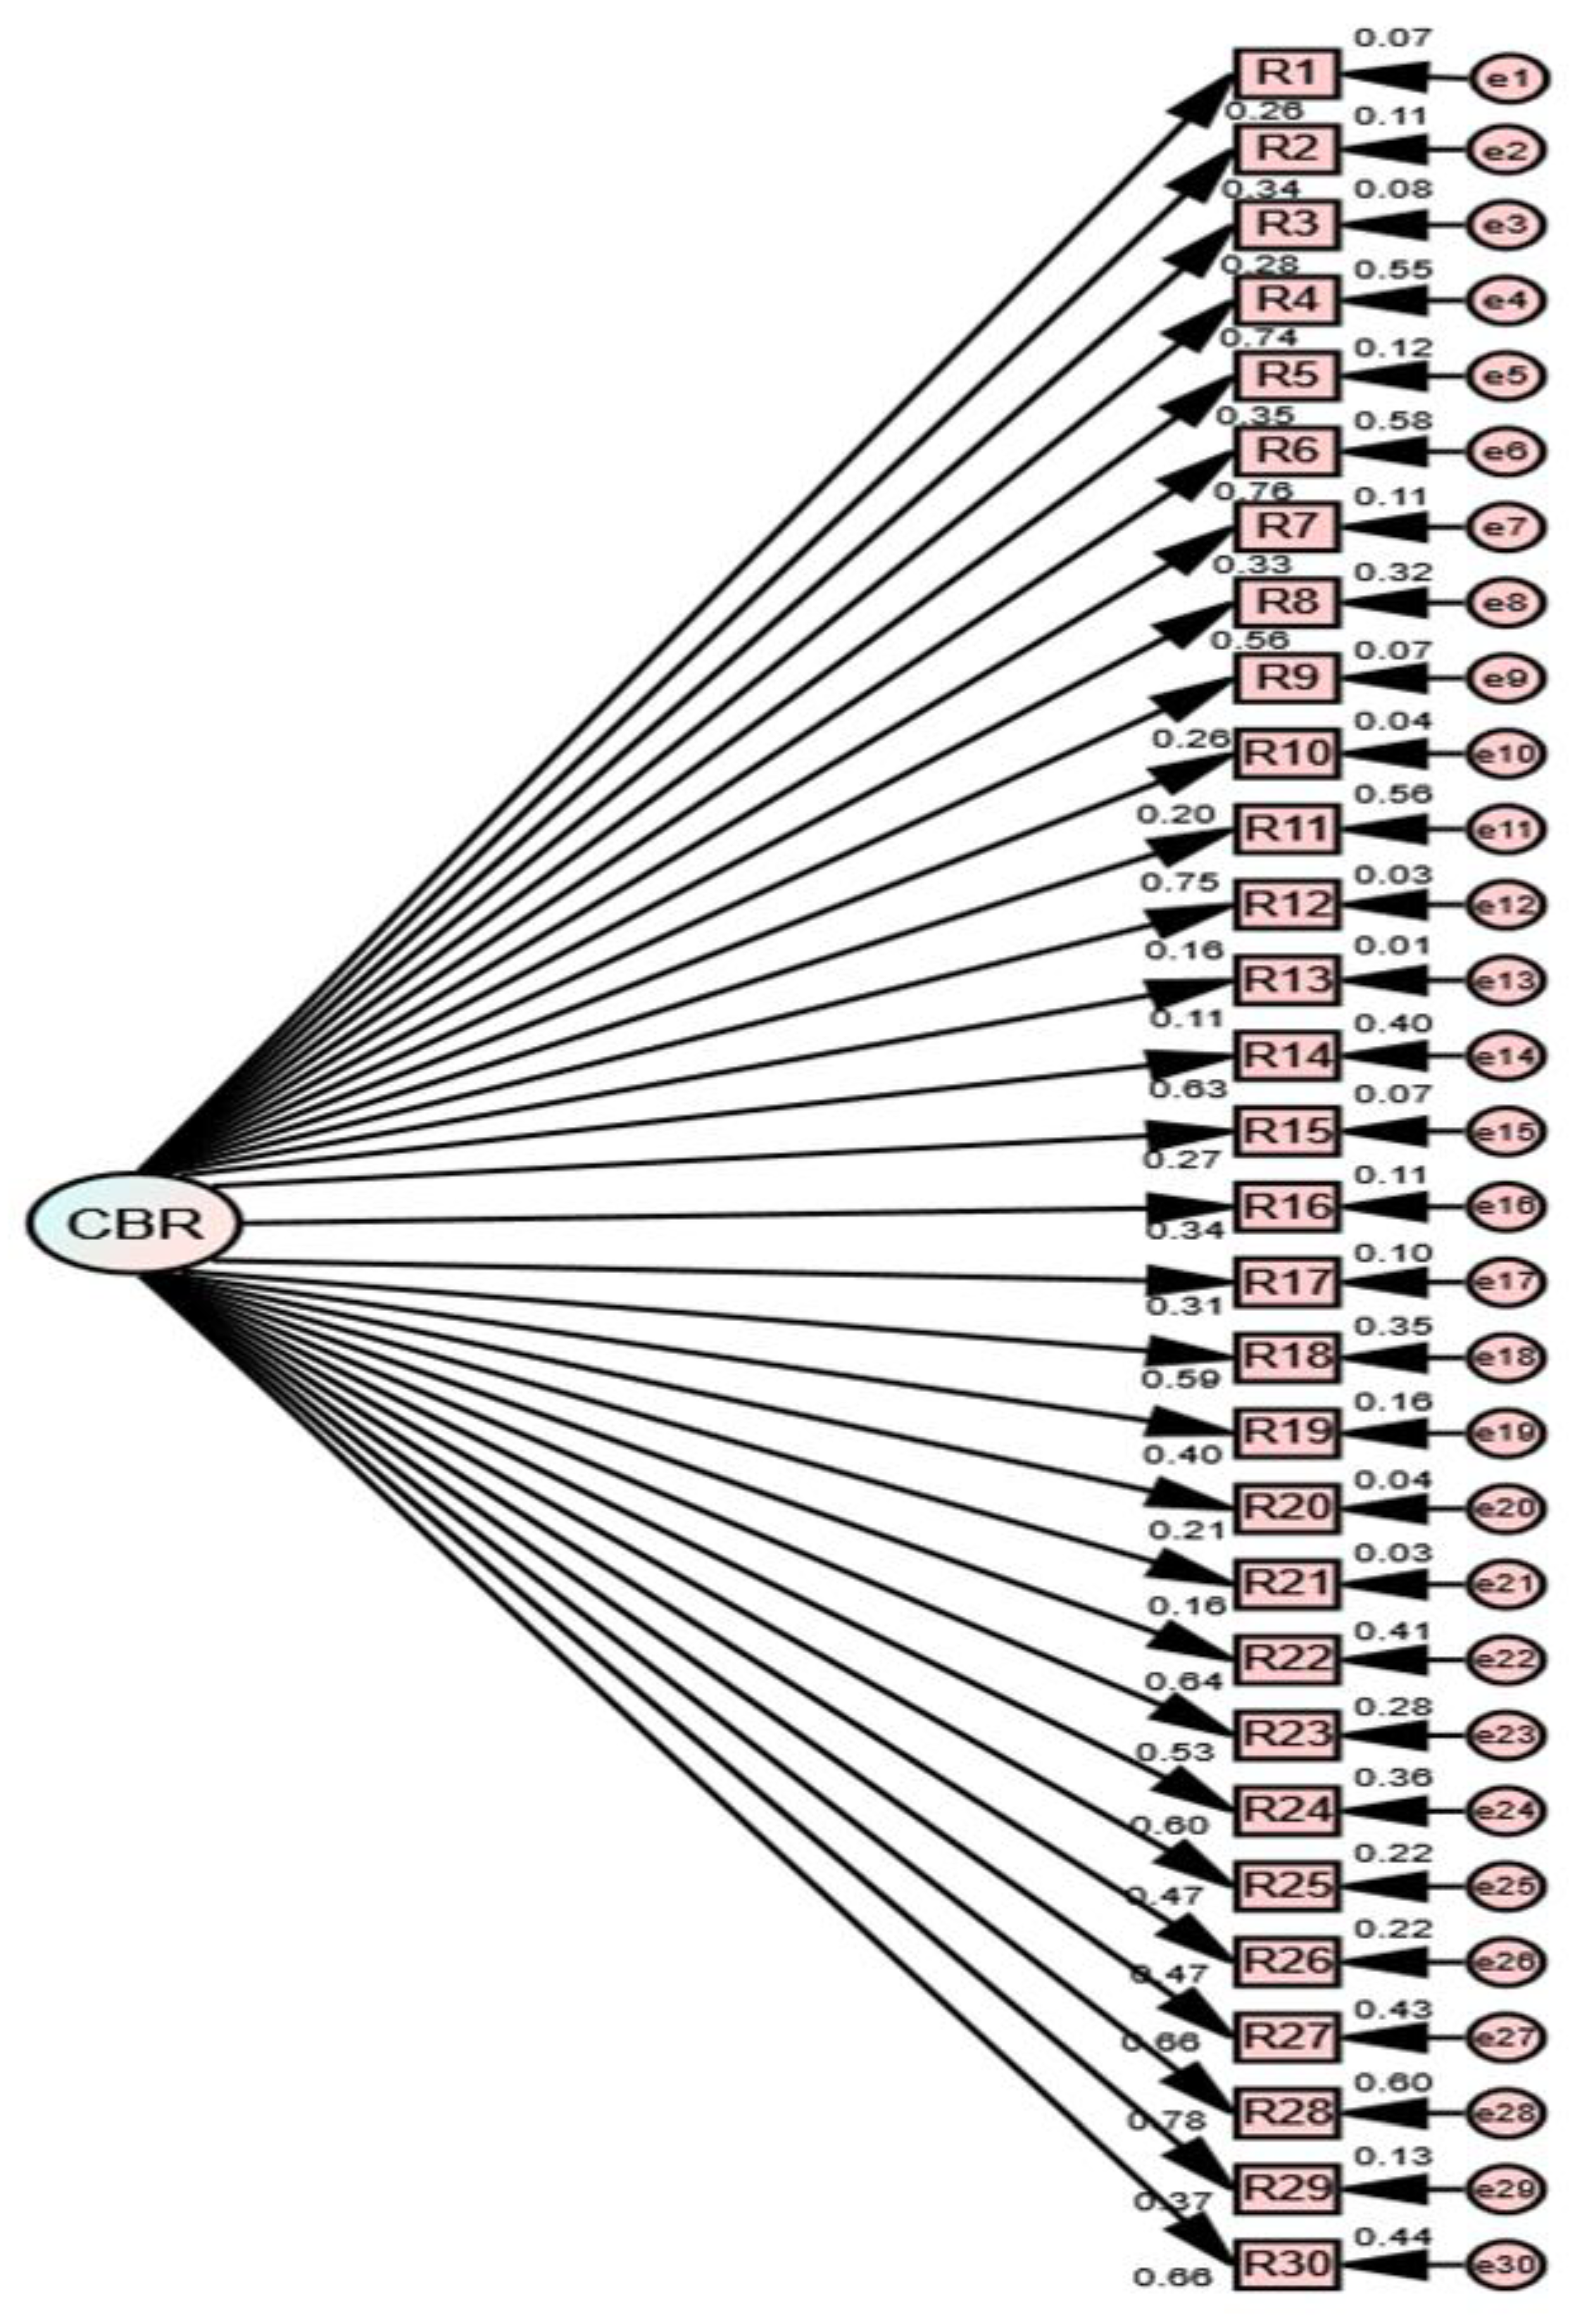
In the present study, we conducted a confirmatory factor analysis (CFA) of the exploratory structure obtained through the exploratory factor analysis described. The sample is characterized as non-probabilistic, since Brazilian chocolate consumers tend to an incalculable number, so the sample admits to being non-probabilistic [60]. Additionally, we worked with convenience sampling, where individuals who volunteered to participate and offer relevant information to the study participated in the research [53].
An electronic survey using the platform Google Forms was made available by the social networks “Instagram” and “WhatsApp”, using the “snowball” technique. Baldin and Munhoz [61] conceptualize the “snowball” technique as a way of non-probabilistic by convenience sampling used in social surveys whose initial participants in a study indicate new participants who, in turn, indicate other participants and so forth, until the desired quantity is reached.
Our target included Brazilian consumers of chocolate from different regions of the country, with a minimum age of 18 years. The questionnaire was answered by 601 participants. This is an adequate and representative number to perform CFA, in line with the criteria of 10 to 20 subjects per item of the scale [20,62,63], considering the number of items of the original scale. The questionnaire was formed by the initial question “please, write the name of your favorite chocolate brand”, followed by the 30 objective items regarding the relationship between consumer and brand, ending with sociodemographic questions in order to characterize the sample.
The sampling profile is shown in Table 1. We can see that the majority of the sample of Brazilian chocolate consumers was composed of women, aged between 18 and 25, with graduate degrees, being consumers of the chosen chocolate brand between 5 and 10 years and making a casual consumption of these brands.
Regarding the ethical procedures of this research, it is noteworthy that, according to the Sole Paragraph of Article 1 of Resolution No. 510/16 of the National Health Council (CNS) of Brazil, consultative public opinion surveys that have their samples composed by unidentified subjects and the confidentiality of the data ensured, as is the case with this research, are exempted from ethical analysis by the Research Ethics Committees (CEP) and by the National Research Ethics Commission (CONEP) of Brazil.
Data were analyzed in the software Statistical Package for Social Sciences (SPSS). The first step of data analysis was a data treatment phase, following the guidance of Tabachnick and Fidell [64], encompassing descriptive statistics. Next, performing the listwise procedure to identify missing values, 40 questionnaires were excluded. By using the Mahalanobis method in order to diagnose outliers, another 38 questionnaires were excluded, based on the chi-square table, with a significance index of p < 0.001 and considering 30 variables, with a resulting value of χ2 = 59.703.
Additionally, we analyzed multicollinearity and singularity, and no problems were detected for the sample. Lastly, we tested the assumptions for the use of multivariate analysis, as established by Hair et al. [63]. Data were analyzed using statistical tests, normal probability plots, residual plots, histogram and P–P Plot, in order to verify normality, linearity and homoscedasticity of the data. Univariate and multivariate normality was also verified according to Marôco’s criteria [65], using Amos statistical program. All the assumptions were confirmed.
The final sample after the treatment phase was composed of 523 subjects, in line with the statistical criteria presented above. The sample of the study is predominantly between 18 and 25 years old (54%), with a college degree (32%), being consumers of the chosen chocolate brand for 5–10 years (37%), with an eventual average frequency of purchase (65%).

4. Findings

4.1. Confirmatory Factor Analysis

In order to obtain validity evidence of the Chocolate Brands Relationship Scale (CBR Scale), we performed the evaluation of the fit of a measurement model for the customer–brand relationship in the chocolate brands sector, using confirmatory factor analysis, via structural equation modeling (SEM), using the maximum likelihood estimation method. The choice of this method was justified by the fact that this is the most used estimation method in SEM, given its robustness regarding problems of normality and effectiveness in different sample sizes [63].
The test of the measurement model with the structure of 30 items revealed the following fit indexes: NC = 6.62; CFI = 0.70; and RMSEA = 0.10. However, satisfactory values for a structural model must meet the following criteria, according to Kline [19]: NC (CMIN/DF) must range between 2.0 and 3.0 and, at most, up to 5.0; CFI must be equal to or greater than 0.90, and RMSEA must be less than 0.06 or even 0.08. Thus, subsequent analyses were necessary for the indexes to meet the criteria indicated as satisfactory.
First, we evaluated the factorial loads of the items, identifying the correlation of the items with their respective factors [66]. The items 5, 15, 19, 20, 26 and 29 had low factor loads, below 0.45, being considered “poor” items [58]. Following the guidance of Hair et al. [63], these items were excluded from the model. We established a minimum load of 0.55 to keep in the model only good, very good and excellent quality items [58].
To improve the adjustment obtained through the CFA, we analyzed the highest modification indices (M.I.) values, according to the guidelines of Kline [19]. The M.I. suggested between the errors of the variables R16 (In the stores of this chocolate brand, I do not take long in the queue to pay) and R17 (In the stores of this chocolate brand, I am quickly assisted) was 311.40. The M.I. between R4 (This chocolate brand offers me personalized service) and R6 (I feel like a special customer for this chocolate brand) was 141.10. Therefore, a double arrow was introduced between the errors of the mentioned variables.
After adjustment, item 16 presented a low factor load, less than 0.45, being excluded from the model. We also introduced a double arrow between the errors of the variables R18 (This chocolate brand has environmental preservation programs/actions) and R22 (This chocolate brand is recognized for its social responsibility), based on a suggested M.I. of 82.19. Additionally, in an attempt to further improve the fit, we decided to remove item R17 from the model since it had a factor load lower than 0.55.
Based on the described adjustments, we obtained the final indexes of the model: χ2 (184) = 646.72; p < 0.001; NC = 3.52; CFI = 0.91; and RMSEA = 0.07, with a very satisfactory fit. Figure 1 illustrates the CBR Scale model, with the respective fit parameters.
Table 2 shows the regression weights of the CBR Scale measurement model obtained through the confirmatory factor analysis. All items loaded significantly to the scale dimensions or factors.
Additionally, according to Byrne’s parsimony recommendations [62], a single factor structure of CBR Scale was compared with the multifactorial structure obtained in Figure 1. However, the single-factor model, as shown in Figure 2, presented much worse adjustment indexes: χ2 (405) = 4567.17, p < 0.001; NC = 11.28; CFI = 0.45; SRMR = 0.17 and RMSEA = 0.14.
Furthermore, the χ2 difference proved to be quite significant (Δχ2 (221) = 3920.45, p < 0.001). Therefore, we confirmed that the multifactorial structure is the most adequate to measure customer–brand relationships in the chocolate brands’ sector. Table 3 shows the comparison between the models.
The comparison between models was also important because we used only one data source, which can lead to the common-method variance issues. Hence, confirmatory factor analysis was applied using one-factor structural equations, as recommended by Podsakoff, MacKenzie, Lee and Podsakoff [67]. According to the authors, if the one-factor model presents adjustment, there is common-method variance. Nevertheless, the results indicated that the adjustment of the one-factor model was not acceptable (χ2 (405) = 4567.17; p < 0.001; NC = 11.28; CFI = 0.45; RMSEA = 0.14). Thus, we may conclude that the common-method variance alone does not explain the results.

4.2. Evidence of Validity and Reliability of the CBR Scale

First of all, we analyzed the internal validity, or the quality of the scale items, by investigating the factorial loads of its items. Comrey and Lee [58] suggest that loads with values between 0.55 and 0.62 should be classified as good; between 0.63 and 0.70 are considered very good; and loads greater than 0.71 are considered excellent. Our findings revealed items with factor loads ranging from 0.56 to 0.80, as Table 2 shows. Thus, the model has only good, very good and excellent items [58], demonstrating good quality in the loads and, therefore, the internal validity of the CBR Scale [63].
In the following, we tested reliability, using the Jöreskog Rho (ρ), a reliability measure more recommended than Cronbach’s alpha for SEM, since it has the factorial loads as a reference, rather than the correlations observed between the variables [68]. The factor “Brand Trust” obtained ρ = 0.82; the factor “Shopping Experience” obtained ρ = 0.91; and, finally, the factor “Perceived Quality” presented ρ = 0.75. Therefore, following the criterion of Chin [68], in which the index must be greater than 0.7, the scale has satisfactory indices and can be considered reliable. Additionally, the variance extracted from the three factors (Brand Trust = 0.43; Shopping Experience = 0.48; and Perceived Quality = 0.44), although not ideal, they reached the minimum of 0.4, recommended by Hair et al. [63]. Table 4 gathers the evidence of the validity and reliability of the CBR Scale. All factor loadings are significant at the 0.01 level (p < 0.01).
Next, we tested convergent, divergent and nomological validity in order to reach construct validity for the CBR Scale. The validity of a construct concerns how much a set of measurement items explains the theoretical construct that the construct should measure [63]. Convergent validity is the degree of agreement between the items and their factor [63], and is obtained through the analysis of three main indicators: factorial loads, Joreskog’s Rho, and extracted variance. All the items of the model reached loads above 0.55, meeting the criteria of a minimum of 0.5 [69]. Furthermore, the CBR Scale has all Jöreskog Rho’s above 0.7, satisfying the criteria for convergent validity proposed by Hair et al. [63]. As for the extracted variance of each factor of the scale, the CBR Scale reached the recommendations of a minimum of 0.4 [70]. On that basis, the scale has convergent validity.
We also tested divergent validity, or the degree to which each scale measures a different construct, in other words, if the factors explain different constructs. The divergent validity occurs when the estimated extracted variance of each factor is greater than the square of the correlation between them (values below the diagonal), according to the Fornell–Larcker criterion [70], who says that a latent construct should explain its item measurements better than another construct. Results indeed confirm the divergent validity between the three factors of the scale, as shown in Table 5.
To access nomological validity and also to test our first study hypothesis (H1), we should analyze the behavior of the scale in relation to other constructs as predicted in both theoretical and empirical literature [63]. We tested the correlations between constructs, in the light of the theory of relationship marketing, by calculating the mean of the answers given by the individuals to the items of the final model of the scale, which measures the relationship perception regarding the chocolate brands, and correlated it to the average of the results of the answers given to the Net Promote Score (NPS) question, an index that, according to the Reichheld [71], aims to measure the degree of customer satisfaction.
The results showed in Table 6 demonstrated, through Pearson’s coefficient, a significant, positive and strong correlation (r = 0.57) at the 0.01 level between relationship and satisfaction, endorsing the results of previous work that indicate that it is possible to identify a significant and strong correlation between satisfaction and relationship constructs [11,22,23], attesting the scale nomological validity and the expected behavior of the CBR Scale in such association. Moreover, customer satisfaction is one of the main guiding assumptions of relationship marketing [21], as well as an important component of customer relationship management [24].
It was also possible to verify in Table 6 that although all relationship dimensions have presented significant and positive relationships with satisfaction, brand trust was the one that showed the highest correlation, attesting the strategic role of trust in the brand in consumer satisfaction [51]. Furthermore, the regression coefficient R2 indicated that 47% of the satisfaction variance can be explained by the dimensions of the CBR Scale, constituting a great prediction effect, according to Cohen [69].
Table 7 presents the test of the four research hypotheses, showing that all were confirmed. All correlations between the variables were significant and positive. Relationship and brand trust showed strong associations with satisfaction (r > 0.5), while shopping experience showed a moderate association (0.3 < r < 0.5) and perceived quality revealed the weakest association with satisfaction (r < 0.3), although positive and significant [69].
Even though the scale shows good evidence of internal and construct validity besides good reliability it is also important to certify face, criteria and content validity. Face validity consists of the prior analysis of judges to verify whether the content of the scale items effectively reflects the construct they intend to operationalize [55,72], in this case, the relationships with chocolate consumers. Face validity for the CBR Scale was conducted in the phase of judges analyses as we described in the Method section. As stated by Kerlinger and Lee [55], criterion validity (or criterion-related validity) measures how well one measure predicts an outcome for another measure. In our study, we used the Net Promoter Score satisfaction indicator to verify whether the CBR Scale is an adequate predictor of satisfaction. The significant, positive and strong correlation between the variables (r = 0.57; p < 0.01) confirmed the scale’s criterion validity.
Finally, we provided theoretical evidence for each item on the scale, in order to confirm its content validity, that is, the items need to be theoretically supported in the scientific literature. All the 21 items in the CBR scale present theoretical support, as Table 8 demonstrates.

4.3. CBR Scale Application to Survey Respondents

The descriptive statistical analyses of the responses of the research participants in relation to each of the factors of the CBR Scale are summarized in Table 9.
The chocolate brand consumers that participated in the survey were asked to mark their level of perception on a 5-point Likert scale, in which 1 represented “totally disagree” and 5 represented “totally agree”, being 3 the neutral point of the scale.
From the results of Table 5, we observe that the Perceived Quality factor was the most perceived dimension of the relationship between customers and chocolate brands, as it is the factor with the highest mean (4.65/SD = 0.42). In this sense, we can say that among the relational strategies practiced by chocolate brands, initiatives related to quality, both in the products as well as the environment, are the elements more easily perceived by consumers. On that basis, we conclude that consumers perceive the brand’s investment in quality products, different options and variety, clean environments and efforts in product exposure, they evaluate such actions as positive, an association that promoter their relationships with the chocolate brand.
With a similar result, the Brand Trust factor has a good result on consumers’ perception, with a significant mean (4,46/SD = 0.51), which reveals the relational strategies associated to trust and loyalty are well received by consumers. Thus, we interpret that consumers do see the chocolate brand as trustworthy and reliable, perceptions that foster their preference and their willingness of recommending the brand, indicating attitudinal loyalty, and also their repurchase intention (behavioral loyalty). On the other side, the results from the Shopping Experience factor (2,87/SD = 0.89) are below the neutral point of the scale (3), indicating that the relational strategies under these dimensions were not perceived and need to be better designed and developed by sellers and branding managers.

5. Discussion

The main purpose of this paper was to validate the Chocolate Brands Relationship Scale (CBR Scale) in order to identify and measure the main aspects chocolate brands’ customers perceive as relevant in their relationship with such brands. As a result, the CBR Scale is composed of 21 items divided into three factors: Brand Trust (6 items), Shopping Experience (11 items) and Perceived Quality (4 items).
We also tested the influence of the relationship, evaluated from the validated CBR Scale, with the chocolate consumers’ satisfaction, finding a high explanatory power of brand relationship on customer satisfaction.
The factor Brand Trust covers the items related to consumers’ perception about the reputation of the brand, consumers’ willingness to repurchase and word-of-mouth, indicating a reliable brand. Furthermore, the items encompassed by this factor are intrinsic linked to consumers’ loyalty [21], as they reveal an attitudinal loyalty towards the chocolate brand. When consumers state they say good things about the brand (item 25), they intend to keep buying from the brand (item 7), they recommend the brand (item 2) or they prefer the brand when compared to other brands (item 1), they are being loyal to the brand. It is important to mention at this point that loyalty does not mean only repurchase (an indicator of behavioral loyalty), as consumers demonstrate attitudinal loyalty when maintaining their preference to the brand, patronizing it or making recommendations [82,83]. Additionally, these scholars agree that attitudinal loyalty is a driver of behavioral loyalty, demonstrating that consumers’ perceptions and positive associations about a brand affect the way they relate to the brand indeed.
Regarding the name of the factor, Brand Trust, it is important to explain that, in the context of brands, trust concerns how much the customer sees the brand as reliable, meaning the brand will perform as expected, confirming a sense of security for consumers [84]. In this sense, literature signalizes that consumers tend to build relationships with brands based on how much trust the brand evokes [12]. As proposed by Grönroos [27], the ability of brands to keep the promises made to consumers is one of the main aspects of relational strategies. In addition, trust is a building block of relationship marketing [21], being also an important driver of customer loyalty, the main objective of brands’ relational strategies [8].
In this context, chocolate can be a representative product category of habitual buying behavior. Habitual behavior represents the repeat purchases made by consumers, based on habits or routines that are developed in order to simplify the decision-making process [85]. On this kind of behavior, consumers tend to be high on brand loyalty, remaining committed to purchasing one specific brand over any others. According to Krishna and Shylajan [86], perceived quality, price, trust, among others, are fundamental for the choice of consumers with habitual buying behavior. The factors validated in the CBR Scale, as described in the following paragraphs, confirm chocolate as a product of habitual buying behavior indeed, since the representative items of the factors denote high involvement of consumers with chocolates, directing their preferences in the decision-making process, as well as their loyalty to specifics brands.
For its turn, the factor Shopping Experience encompasses tangible and intangible aspects of the interaction between consumers and brands during the consumer journey, including purchase and after purchase experience, including service, assistance, communication and consumers’ perception of the branding efforts to promote their interaction [80]. According to these authors, those aspects are related to the multiple touchpoints between customers and brands that create the experience with the brand. In this sense, given the large scope of this factor, there may be a certain overlap with the other factors of the scale, since intangible aspects such as Brand Trust and tangible aspects, such as Perceived Quality, will compose the experience of consumers as a whole [87,88].
The items in this factor are in line with the literature, since brand experience is a set of sensations, feelings and behavioral responses from consumers to brands’ efforts, including brands’ tangible and intangible elements [81]. In line with the relational paradigm of relationship marketing, research on brand experience confirms the influence of consumer experience with an affective commitment to the brand and loyalty [89]. Furthermore, chocolate consumption generates complex consumption experiences due to the subjectivity involved in this type of consumption, which is motivated by physiological need, sensorial gratification and escapism [5], being aspects a brand must rely on in order to build a long-term relationship with customers.
Finally, the factor Perceived Quality was defined as the consumer’s judgment of the overall excellence of a product or service [90]. These authors developed a model to assess perceived quality, composed of some factors, including tangibility. Tangible factors, according to the authors, include, in addition to the quality of the product itself (in the case of chocolates, the texture and flavor), diversity and variety of the offer, the physical environment of the stores and the appearance of products at sale’s points. The CBR Scale gathered in the Perceived Quality factor precisely these items referring to tangibility, although we know that there are other dimensions of service quality, such as readiness, empathy, guarantees, which might be explored in future validations of the scale.
Moreover, Perceived Quality concerns consumers’ perception of the quality of the products and the quality of the environment in which they interact with the brand. In the case of chocolate, quality is associated with flavor, value for money, packaging and place of purchase [5], confirming such aspects are connected to customer–brand relationships. In the case of the retail store, research has previously confirmed the impact of perceived quality on brands’ purchase intention [75]. Moreover, perceived quality has proved to be an important antecedent of brand loyalty, increasing brand equity and, from this, the maintenance of brands’ competitive advantages [91].

Implications, Limitations and Research Agenda

Based on the above discussion about the relation between the three factors that compose the CBR Scale and the theoretical background on both customer-brand relationship and relationship marketing, we foresee a few implications of our findings.
As for theoretical contributions, this research advances by proposing a scientific instrument, presenting confirmatory validity indexes under the relational paradigm of marketing on the business to consumer (B2C) context, the CBR Scale, which will allow future works on branding strategies, brand loyalty and brand experience. Additionally, the three factors present three independent scales, due to the confirmed divergent validity, enabling relational studies with other marketing variables.
In addition, the research hypothesis tests indicated that 47% of the satisfaction variance can be greatly predicted by the dimensions of the CBR Scale (Brand Trust, Shopping Experience and Perceived Quality). In other words, a significant part of consumer satisfaction is influenced by the perception of relationships with chocolate brands, so that we can infer that new structural models to be tested in further studies including satisfaction should comprise indicators of brand trust, brand experience and product/service quality [22].
Although all the three relationship dimensions of the CBR Scale have shown significant and positive associations with the satisfaction index of the chocolate consumers surveyed, brand trust was the one that showed the strongest one, revealing the strategic role played by brand trust in consumer satisfaction. Therefore, future research that intends to develop and validate scales to assess the relationship with customers in other sectors needs to cover items that assess trust in the brand as a way to access brand loyalty [23].
Indeed, trust can effectively play down the uncertainties experienced by customers in their decision-making purchase process, helping to develop their belief in the reliability and integrity of a brand, thereby paving the way for their attitudinal and behavioral loyalty [92]. Furthermore, our study brought new insights regarding the contribution of both shopping experience and perceived quality to consumer–brand relationship models.
As managerial implications, the CBR Scale is a valid instrument for marketing practitioners and branding managers in the chocolate sector to identify the best way of accessing customers, providing better experiences and building an effective path to long-term and profitable relationships. In fact, brand experiences have been increasingly relevant in developing long-term consumer–brand relationships [38].
Thus, the CBR Scale might be used as a diagnostic tool to help managers better understand how to meet clients’ needs. When assessing consumers’ perceptions regarding the specific dimensions of the relationship, that means, brand trust, shopping experience and perceived quality of products, managers will be able to identify where improvements are needed in order to deliver high-value products and positive brand experiences and to set profitable relationships with them. Consequently, the scale is able to support managers’ decision-making and problem-solving processes towards evidence-based management in order to produce better organizational outcomes.
Regarding the limitations of the study and a subsequent agenda, a first limitation is that the present findings are therefore indicative rather than conclusive. In spite of the scale’s validation in Brazil, it would be useful to further access the generalizability of the CBR Scale to other business environments and different cultures and countries. In addition, with more replicative and creative research, an improved comprehensive conceptual framework related to relationship marketing can be developed in the future. In this meaning, there could be a need for alteration or deletion of original items even to improve the extracted variance of the factors.
Additionally, our study used only one data source, and is therefore subject to the common-method variance problems. The comparison between the one-factor and the three-factor structures (refer to Table 3) of the CBR Scale showed that if the one-factor model presents adjustment, there is common-method variance. As this did not happen, we may conclude that the common-method variance alone does not explain the results.
Another limitation is due to the cross-sectional design, as questions regarding causality remain unanswered. In this sense, the development of a time-series database and the testing of the CBR Scale and its antecedents and consequents in a longitudinal framework would provide more insights into probable causation. We also recommend the validation of the scale in other sectors in an effort to cover the specificities of each context, particularly those of experiential consumption such as food and beverage brands, restaurants and hotels.
We also found other scales in the literature to assess the relationship with alcoholic beverages and soft drink customers [93], as well as supermarket customers [94]. It is possible that our CBR Scale can be adapted for other treats, such as ice creams and confectioneries. Nevertheless, we defend the relevance of developing scales properly customized for different sectors and products, embracing its particularities that make the experience of its customers unique, in order to produce more reliable diagnoses of the specific needs of customers so that managers can develop more effective branding strategies to improve consumers brand experience as a whole.
To advance in the proposition of a research agenda for further studies, we encourage further research to advance towards testing more complex structural models, including variables such as lifestyle and motivation to purchase chocolate as a representative product category of habitual buying behavior.
Additionally, it would be interesting to test associations with variables normally studied in the field of consumer behavior and social psychology, such as product meaning and brand personality, in order to evaluate their influence on the relationship with chocolate consumers, paving the way for new research lines.
Previous studies have already tested the influence of brand personality on relationships with Disney theme park visitors [95], with luxury market customers [43], with consumers of products for curly hair care [96], with social network users [97] and with fast-food consumers [98]. These studies unveiled the “reliable” (credibility) brand personality as the main driver to build long-term relationships.
Studies have also tested the influence of the meaning attributed to products in the relationships with Apple [99] and Louis Vuitton [100] showing the symbolic meaning (embracing subjective and emotional components) as the main predictor of relationship with these companies.
Therefore, new research dedicated to analyzing the role of brand personality and the product meaning in the relationship with consumers in the unique chocolate market would be fruitful, given that the CBR Scale validated in this article is now available to evaluate such relationships (CBR Scale). The analysis of these relationships can bring useful insights for managers in the chocolate sector to define in a more effective way branding, positioning and advertising strategies.
Finally, research with a multi-method approach, combining both quantitative and qualitative techniques, is necessary and timely to go beyond measurement, providing a better understanding of the determinant aspects for choosing and developing long-term relationships with chocolate consumers. Multimethod designs bring greater validity, reliability and reflexivity to the studies by revealing different nuances of the same phenomenon, since it is analyzed under different epistemological assumptions.

6. Conclusions

We may conclude, in spite of the limitations pointed, that the main objective of this study was reached and an instrument to assess the relationship with chocolate brands, from the perspective of consumers was produced. The CBR Scale has internal validity, reliability, construct validity and content validity, constituting a valid and reliable operational measure to be applied in relational studies in the areas of marketing and consumer behavior, as well as represents a diagnostic tool for managers in the chocolate industry to evaluate their relationship with customers. The findings found here are not intended to be conclusive or limiting, but offer a useful starting point from which further theoretical and empirical research of customer relationship management in the chocolate market can be built.

Author Contributions

Conceptualization, G.D. and K.C.; Methodology, G.D. and G.A.; Software, G.D.; Validation, G.D., K.C. and F.S.; Formal Analysis, G.D. and K.C.; Investigation, G.D., K.C. and G.A.; Data Curation, G.D. and F.S.; Writing—Original Draft Preparation, G.D. and F.S.; Writing—Review & Editing, G.D. and F.S.; Visualization, F.S.; Supervision, G.D.; Project Administration, G.D. All authors have read and agreed to the published version of the manuscript.

Funding

This research received no external funding.

Institutional Review Board Statement

Not applicable.

Informed Consent Statement

Not applicable.

Conflicts of Interest

The authors declare no conflict of interest.

References

  1. Rousseau, S. The role of organic and fair trade labels when choosing chocolate. Food Qual. Prefer. 2015, 44, 92–100. [Google Scholar] [CrossRef] [Green Version]
  2. Naylor, G.; Kleiser, S.B.; Baker, J.; Yorkston, E. Using transformational appeals to enhance the retail experience. J. Retail. 2008, 84, 49–57. [Google Scholar] [CrossRef]
  3. Jeon, H.M.; Yoo, S.R.; Kim, S.H. The relationships among experience, delight, and recollection for revisit intention in chocolate exposition. Sustainability 2020, 12, 8644. [Google Scholar] [CrossRef]
  4. Kim, S.H.; Jeon, H.M. Chocolate choice motives and attitudes in foodservice market: Fine store product vs. manufactured product consumers. J. Foodserv. Bus. Res. 2020, 23, 149–168. [Google Scholar] [CrossRef]
  5. Zarantonello, L.; Luomala, H.T. Dear Mr. Chocolate: Constructing a typology of contextualized chocolate consumption experiences through qualitative diary research. Qual. Market. Res. 2011, 14, 55–82. [Google Scholar] [CrossRef]
  6. Kazemi, F.; Esmaeili, M. The role of media on consumer brand choice a case study of chocolate industry. Int. J. Bus. Manag. 2010, 5, 147–154. [Google Scholar] [CrossRef] [Green Version]
  7. Hossien, E. Determinants of brand equity: Offering a model to chocolate industry. World Acad. Sci. Eng. Technol. 2011, 59, 1205–1213. [Google Scholar]
  8. Khamitov, M.; Wang, X.; Thomson, M. How well do consumer-brand relationships drive customer brand loyalty? Generalizations from a meta-analysis of brand relationship elasticities. J. Consum. Res. 2019, 46, 435–459. [Google Scholar] [CrossRef]
  9. Gómez-Suárez, M.; Martínez-Ruiz, M.P.; Martínez-Caraballo, N. Consumer-brand relationships under the marketing 3.0 paradigm: A literature review. Front. Psychol. 2017, 8, 252. [Google Scholar] [CrossRef] [Green Version]
  10. Grönroos, C. Relationship marketing readiness: Theoretical background and measurement directions. J. Serv. Mark. 2017, 31, 218–225. [Google Scholar] [CrossRef]
  11. Fetscherin, M.; Guzman, F.; Veloutsou, C.; Cayolla, R.R. Latest research on brand relationships: Introduction to the special issue. J. Prod. Brand Manag. 2019, 28, 133–139. [Google Scholar] [CrossRef]
  12. Fetscherin, M.; Heinrich, D. Consumer brand relationships research: A bibliometric citation meta-analysis. J. Bus. Res. 2015, 68, 380–390. [Google Scholar] [CrossRef]
  13. Berry, L.L. Relationship marketing. Emerg. Perspect. Serv. Mark. 1983, 66, 33–47. [Google Scholar]
  14. Thaichon, P.; Jebarajakirthy, C.; Tatuu, P.; Gajbhiyeb, R.G. Are you a chocolate lover? An investigation of the repurchase behavior of chocolate consumers. J. Food Prod. Mark. 2018, 24, 163–176. [Google Scholar] [CrossRef]
  15. Kuikka, A.; Laukkanen, T. Brand loyalty and the role of hedonic value. J. Prod. Brand Manag. 2012, 21, 529–537. [Google Scholar] [CrossRef]
  16. Churchill, G.A., Jr. A paradigm for developing better measures of marketing constructs. J. Mark. Res. 1979, 16, 64–73. [Google Scholar] [CrossRef]
  17. Rossiter, J.R. The C-OAR-SE procedure for scale development in marketing. Int. J. Res. Mark. 2002, 19, 305–335. [Google Scholar] [CrossRef] [Green Version]
  18. Sin, L.Y.; Alan, C.B.; Yau, O.H.; Chow, R.P.; Lee, J.S.; Lau, L.B. Relationship marketing orientation: Scale development and cross-cultural validation. J. Bus. Res. 2005, 58, 185–194. [Google Scholar] [CrossRef]
  19. Podsakoff, N.P.; Podsakoff, P.M.; MacKenzie, S.B.; Klinger, R.L. Are we really measuring what we say we’re measuring? Using video techniques to supplement traditional construct validation procedures. J. Appl. Psychol. 2013, 98, 99. [Google Scholar] [CrossRef]
  20. Kline, R.B. Principles and Practice of Structural Equation Modeling; Guilford Press: New York, NY, USA, 2015. [Google Scholar]
  21. Scussel, F.B.C.; Petroll, M.M.; Semprebon, E.; Rocha, R.A. O que é, afinal, marketing de relacionamento? Uma proposta de conceito unificador. Rev. Ciências Adm. 2017, 20, 9–23. [Google Scholar]
  22. Jamshidi, D.; Rousta, A. Brand commitment role in the relationship between brand loyalty and brand satisfaction: Phone industry in Malaysia. J. Promot. Manag. 2021, 27, 151–176. [Google Scholar] [CrossRef]
  23. Veloutsou, C. Brand evaluation, satisfaction and trust as predictors of brand loyalty: The mediator-moderator effect of brand relationships. J. Consum. Mark. 2015, 32, 405–421. [Google Scholar] [CrossRef] [Green Version]
  24. Al-Khouri, A.M. Customer relationship management: Proposed framework from a government perspective times. J. Manag. Strategy 2012, 3, 34. [Google Scholar] [CrossRef]
  25. Allen, C.T.; Fournier, S.; Miller, F. Brands and their meaning makers. In Handbook of Consumer Psychology; Haugtvedt, C.P., Herr, P.M., Kardes, F.R., Eds.; Marketing and Consumer Psychology Series; Taylor & Francis Group: Abingdon, UK, 2008; Volume 4, pp. 781–822. [Google Scholar]
  26. Fournier, S. Consumers and their brands: Developing relationship theory in consumer research. J. Consum. Res. 1998, 24, 343–373. [Google Scholar] [CrossRef]
  27. Grönroos, C. Marketing as promise management: Regaining customer management for marketing. J. Bus. Ind. Mark. 2009, 24, 351–359. [Google Scholar] [CrossRef]
  28. Payne, A. Handbook of CRM: Achieving Excellence in Customer Relationship Management; Elsevier: Burlington, MA, USA, 2012. [Google Scholar]
  29. Ryals, L.; Payne, A. Customer relationship management in financial services: Towards information-enabled relationship marketing. J. Strateg. Mark. 2001, 9, 3–27. [Google Scholar] [CrossRef]
  30. Frow, P.E.; Payne, A.F. Customer relationship management: A strategic perspective. J. Bus. Market Manag. 2009, 3, 7–27. [Google Scholar] [CrossRef]
  31. Demo, G.; Fogaça, N.; Ponte, V.; Fernandes, T.; Cardoso, H. Marketing de relacionamento (CRM): Estado da arte, revisão bibliométrica da produção nacional de primeira linha, institucionalização da pesquisa no Brasil e agenda de pesquisa. Rev. Adm. Mackenzie 2015, 16, 127–160. [Google Scholar] [CrossRef] [Green Version]
  32. Storbacka, K.; Lehtinen, J.R. Customer Relationship Management: Creating Competitive Advantage Through Win-Win Relationship Strategies; McGraw-Hill: Singapore, 2001. [Google Scholar]
  33. Enes, Y.; Lima, T.; Demo, G.; Scussel, F. The intellectual structure of relationship marketing scientific field: Proposing new avenues of research from a systematic review. Consum. Behav. Rev. 2021, 5, 110–127. [Google Scholar] [CrossRef]
  34. Ernst, H.; Hoyer, W.D.; Krafft, M.; Krieger, K. Customer relationship management and company performance—the mediating role of new product performance. J. Acad. Mark. Sci. 2011, 39, 290–306. [Google Scholar] [CrossRef]
  35. Battor, M.; Battor, M. The impact of customer relationship management capability on innovation and performance advantages: Testing a mediated model. J. Mark. Manag. 2010, 26, 842–857. [Google Scholar] [CrossRef]
  36. Abbade, E.B. A percepção de clientes universitários sobre o relacionamento com suas operadoras de telefonia móvel. REGE-Rev. Gest. 2014, 21, 433–448. [Google Scholar]
  37. Walsh, M.F.; Winterich, K.P.; Mittal, V. Do logo redesigns help or hurt your brand? The role of brand commitment. J. Prod. Brand Manag. 2010, 19, 76–84. [Google Scholar] [CrossRef]
  38. Kaufmann, H.R.; Loureiro, S.M.C.; Manarioti, A. Exploring behavioural branding, brand love and brand co-creation. J. Prod. Brand Manag. 2016, 25, 516–526. [Google Scholar] [CrossRef]
  39. Fournier, S.; Alvarez, C. Brands as relationship partners: Warmth, competence, and in-between. J. Consum. Psychol. 2012, 22, 177–185. [Google Scholar] [CrossRef]
  40. Rozzett, K.; Demo, G. Desenvolvimento e validação da escala de relacionamento com clientes (ERC). Rev. Adm. Empresas 2010, 50, 383–395. [Google Scholar] [CrossRef]
  41. Demo, G.; Rozzett, K. Customer relationship management scale for the business-to-consumer market: Exploratory and confirmatory validation and models comparison. Int. Bus. Res. 2013, 6, 29–42. [Google Scholar] [CrossRef] [Green Version]
  42. Demo, G.; Watanabe, E.A.D.M.; Chauvet, D.C.V.; Rozzett, K. Customer relationship management scale for the B2C market: A cross-cultural comparison. Rev. Adm. Mackenzie 2017, 18, 42–69. [Google Scholar] [CrossRef]
  43. Scussel, F.; Demo, G. The relational aspects of luxury consumption in Brazil: The development of a luxury customer relationship perception scale and the analysis of brand personality influence on relationship perception on luxury fashion brands. Braz. Bus. Rev. 2019, 16, 174–190. [Google Scholar] [CrossRef]
  44. Demo, G.; Rozzett, K.; Fogaça, N.; Souza, T. Desenvolvimento e validação de uma escala de relacionamento com clientes de companhias aéreas. Braz. Bus. Rev. 2018, 15, 105–119. [Google Scholar] [CrossRef]
  45. Demo, G.; Fogaça, N.; Cardoso, H. Desenvolvimento e validação de uma escala de relacionamento para clientes de telecom. Negócios Proj. 2017, 8, 28–49. [Google Scholar]
  46. Demo, G.; Batelli, L.; Albuquerque, P. Customer relationship management scale for video games’ players: Exploratory and ordinal factor analysis. Rev. Organ. Contexto 2015, 11, 285–312. [Google Scholar] [CrossRef]
  47. Kranzbühler, A.M.; Kleijnen, M.H.; Morgan, R.E.; Teerling, M. The multilevel nature of customer experience research: An integrative review and research agenda. Int. J. Manag. Rev. 2018, 20, 433–456. [Google Scholar] [CrossRef]
  48. Scussel, F.B.C. Is consumer experience the next best thing? Reflections from a systematic review and research agenda proposition. Consum. Behav. Rev. 2019, 3, 57–69. [Google Scholar]
  49. Taylor, S.A.; Baker, T.L. An assessment of the relationship between service quality and customer satisfaction in the formation of consumers’ purchase intentions. J. Retail. 1994, 70, 163–178. [Google Scholar] [CrossRef]
  50. Trasorras, R.; Weinstein, A.; Abratt, R. Value, satisfaction, loyalty and retention in professional services. Mark. Intel. Plan. 2009, 27, 615–632. [Google Scholar] [CrossRef]
  51. Morgan, R.M.; Hunt, S.D. The commitment-trust theory of relationship marketing. J. Mark. 1994, 58, 20–38. [Google Scholar] [CrossRef]
  52. Pei, X.L.; Gu, J.N.; Wu, T.J.; Zhou, W.X.; Yeh, S.P. Does the effect of customer experience on customer satisfaction create a sustainable competitive advantage? A comparative study of different shopping situations. Sustainability 2020, 12, 7436. [Google Scholar] [CrossRef]
  53. Hair, J.F.; Babin, B.; Money, A.H.; Samouel, P. Essentials of Business Research Methods; Johns Wiley & Sons: Hoboken, NJ, USA, 2003. [Google Scholar]
  54. Bardin, L. Análise de Conteúdo; Almedina: Lisboa, Portugal, 2016. [Google Scholar]
  55. Kerlinger, F.N.; Lee, H.B. Foundations of Behavioral Research; Wadsworth Thomson: Independence, KY, USA, 2008. [Google Scholar]
  56. Demo, G.; Garcia, E.; Bastos, T.; Scussel, F. Chocólatras assumidos: Desenvolvimento e validação de uma escala de percepção de relacionamento do consumidor com marcas de chocolate. In Proceedings of the 31 anais do Encontro Nacional de Cursos de Graduação em administração, Enangrad, São Paulo, Brazil, 11 November 2020. [Google Scholar]
  57. Hayton, J.C.; Allen, D.G.; Scarpello, V. Factor retention decisions in exploratory factor analysis: A tutorial on parallel analysis. Organ. Res. Methods 2004, 7, 191–205. [Google Scholar] [CrossRef]
  58. Comrey, A.L.; Lee, H.B. A First Course in Factor Analysis; Psychology Press: New York, NY, USA, 2013. [Google Scholar]
  59. Nunnally, J.C.; Bernstein, I.H. Psychometric Theory (McGraw-Hill Series in Psychology); McGraw-Hill: New York, NY, USA, 1994. [Google Scholar]
  60. Cochran, W. Sampling Techniques; John Wiley & Sons: New York, NY, USA, 2007. [Google Scholar]
  61. Baldin, N.; Munhoz, E.M.B. Educação ambiental comunitária: Uma experiência com a técnica de pesquisa snowball (bola de neve). Rev. Eletrôn. Mestrado Educ. Ambient. 2011, 27, 46–60. [Google Scholar]
  62. Byrne, B.M. Structural Equation Modelling with AMOS: Basic Concepts, Applications, and Programming; Routledge: New York, NY, USA, 2016. [Google Scholar]
  63. Hair, J.F.; Black, W.C.; Babin, B.J.; Anderson, R.E. , Tatham, R.L. Multivariate Data Analysis; Pearson: Essex, UK, 2016. [Google Scholar]
  64. Tabachnick, B.G.; Fidell, L.S. Using Multivariate Statistics; Pearson Allyn And Bacon: Boston, MA, USA, 2013. [Google Scholar]
  65. Marôco, J. Análise de Equações Estruturais; ReportNumber: Lisboa, Portugal, 2010. [Google Scholar]
  66. Field, A. Descobrindo a Estatística Usando o SPSS; Artmed: Porto Alegre, Brazil, 2009. [Google Scholar]
  67. Podsakoff, P.M.; MacKenzie, S.B.; Lee, J.Y.; Podsakoff, N.P. Common method biases in behavioral research: A critical review of the literature and recommended remedies. J. Appl. Psychol. 2003, 88, 879–903. [Google Scholar] [CrossRef]
  68. Chin, W.W. The partial least squares approach to structural equation modeling. Modern Methods Bus. Res. 1998, 295, 295–336. [Google Scholar]
  69. Cohen, J. A power primer. Psychol. Bull. N. Y. 1992, 112, 155–159. [Google Scholar] [CrossRef]
  70. Hair, J.F., Jr.; Hult, G.T.M.; Ringle, C.; Sarstedt, M. A Primer on Partial Least Squares Structural Equation Modeling; Sage Publications: Los Angeles, CA, USA, 2014. [Google Scholar]
  71. Reichheld, F. A Pergunta Definitiva 2.0—Como as Empresas que Utilizam o Net Promoter Score Prosperam em um Mundo Voltado aos Clientes; Elsevier: Rio de Janeiro, Brazil, 2011. [Google Scholar]
  72. Pasquali, L. Validade dos testes psicológicos: Será possível reencontrar o caminho? Psicol. Teor. Pesqui. 2007, 23, 99–107. [Google Scholar] [CrossRef]
  73. Buttle, F.A. Word of mouth: Understanding and managing referral marketing. J. Strateg. Mark. 1998, 6, 241–254. [Google Scholar] [CrossRef]
  74. Veloutsou, C.; Moutinho, L. Brand relationships through brand reputation and brand tribalism. J. Bus. Res. 2009, 62, 314–322. [Google Scholar] [CrossRef]
  75. Calvo-Porral, C.; Lévy-Mangin, J.P. Store brands’ purchase intention: Examining the role of perceived quality. Eur. Res. Manag. Bus. Econ. 2017, 23, 90–95. [Google Scholar] [CrossRef]
  76. Kivetz, R.; Simonson, I. Earning the right to indulge: Effort as a determinant of customer preferences toward frequency program rewards. J. Mark. Res. 2002, 39, 155–170. [Google Scholar] [CrossRef] [Green Version]
  77. Barroso-Méndez, M.J.; Galera-Casquet, C.; Valero-Amaro, V. Partnerships between businesses and NGOs in the field of corporate social responsibility: A model of success from the perspective of relationship marketing. J. Relationsh. Mark. 2014, 13, 1–27. [Google Scholar] [CrossRef]
  78. Lindgreen, A.; Swaen, V.; Johnston, W. The supporting function of marketing in corporate social responsibility. Corp. Reput. Rev. 2009, 12, 120–139. [Google Scholar] [CrossRef]
  79. Navarro, S.; Andreu, L.; Cervera, A. Value co-creation among hotels and disabled customers: An exploratory study. J. Bus. Res. 2014, 67, 813–818. [Google Scholar] [CrossRef]
  80. Lemon, K.N.; Verhoef, P.C. Understanding customer experience throughout the customer journey. J. Mark. 2016, 80, 69–96. [Google Scholar] [CrossRef]
  81. Brakus, J.J.; Schmitt, B.H.; Zarantonello, L. Brand experience: What is it? How is it measured? Does it affect loyalty? J. Mark. 2009, 73, 52–68. [Google Scholar] [CrossRef]
  82. Bennett, R.; Rundle-Thiele, S. A comparison of attitudinal loyalty measurement approaches. J. Brand Manag. 2002, 9, 193–209. [Google Scholar] [CrossRef] [Green Version]
  83. Bandyopadhyay, S.; Martell, M. Does attitudinal loyalty influence behavioral loyalty? A theoretical and empirical study. J. Retail. Consum. Serv. 2007, 14, 35–44. [Google Scholar] [CrossRef]
  84. Chaudhuri, A.; Holbrook, M.B. The chain of effects from brand trust and brand affect to brand performance: The role of brand loyalty. J. Mark. 2001, 65, 81–93. [Google Scholar] [CrossRef] [Green Version]
  85. Simonson, I. The effect of purchase quantity and timing on variety-seeking behavior. J. Mark. Res. 1990, 27, 150–162. [Google Scholar] [CrossRef]
  86. Krishna, G.R.; Shylajan, C.S. Determinants of habitual buying behavior: A study of branded apparels. Icfai J. Mark. Manag. 2007, 6, 6–21. [Google Scholar]
  87. Reichheld, F.; Sasser, W.E. Zero defections: Quality comes to services. Harv. Bus. Rev. 1990, 68, 105–111. [Google Scholar]
  88. Rousseau, F.M.; Sitkin, S.B.; Burt, R.S.; Camerer, C. Not so different after all: A cross-discipline view of trust. Acad. Manag. Rev. 1998, 23, 393–404. [Google Scholar] [CrossRef] [Green Version]
  89. Iglesias, O.; Singh, J.J.; Batista-Foguet, J.M. The role of brand experience and affective commitment in determining brand loyalty. J. Brand Manag. 2011, 18, 570–582. [Google Scholar] [CrossRef]
  90. Parasuraman, A.; Zeithaml, V.; Berry, L. Reassessment of expectations as a comparison standard in measuring service quality: Implications for further research. J. Mark. 1994, 58, 111–124. [Google Scholar] [CrossRef]
  91. Golkar, M.; Golkar, A.; AbbasianKasgari, A.; HosseiniToudeshki, E. Determining the factors influencing the brand equity from the perspective of the consumer in Iran chocolate industry (Baraka Chocolate). J. Soc. Sci. Humanit. Res. 2014, 2, 40–48. [Google Scholar]
  92. Zhang, S.; Yao-Ping Peng, M.; Peng, Y.; Zhang, Y.; Ren, G.; Chen, C. Expressive brand relationship, brand love, and brand loyalty for tablet PCs: Building a sustainable brand. Front. Psychol. 2020, 11, 231. [Google Scholar] [CrossRef] [PubMed] [Green Version]
  93. Demo, G.; Lopes, C. Guaraná Antarctica e Cerveja Skol: Desenvolvimento e validação de escalas de relacionamento com clientes. In Perspectivas Contemporâneas em Marketing; Águas, P., Santos, M., Correia, M., Ramos, C., Eds.; TMS Conference Series; TMS: Lisboa Portugal, 2014; pp. 183–199. [Google Scholar]
  94. Magrini, G.; Demo, G. Clientes fiéis, supermercados mais rentáveis: Desenvolvimento e validação de uma escala de relacionamento com clientes de supermercados. Rev. Gest. Ind. 2017, 12, 237–257. [Google Scholar] [CrossRef]
  95. Dias, G.N.; Demo, G.; Scussel, F.B.C.; Watanabe, E.A.M. The magical world of Disney: Building relationships with clients from the brand personality. Tour. Manag. Stud. 2020, 16, 39–49. [Google Scholar] [CrossRef]
  96. Oliveira, M.K.S.; Demo, G. Credibilidade, Sensibilidade, Sofisticação e Alegria: Personalidades de Marca que fazem a cabeça das mulheres com cabelos cacheados e crespos. Mark. Tour. Rev. 2018, 3, 1–24. [Google Scholar] [CrossRef] [Green Version]
  97. Demo, G.; Silva, T.L.; Watanabe, E.; Scussel, F.B.C. Credibility, audacity and joy: Brand personalities that connect users to social media. Braz. Adm. Rev. 2018, 15, 1–20. [Google Scholar]
  98. Delmondez, F.; Demo, G.; Scussel, F.B.C. Você é o que você vende: A influência da personalidade de marca no relacionamento com clientes de empresas de fast-food. Rev. Bras. Mark. 2017, 16, 563–578. [Google Scholar] [CrossRef]
  99. Demo, G.; Guanabara, M. Marketing de relacionamento com an Apple: O papel do julgamento e significado de produto na escolha do iPhone. Rev. Eletrôn. Adm. 2015, 21, 170–199. [Google Scholar] [CrossRef]
  100. Demo, G.; Santos, F.T.; Watanabe, E. Relacionamento com Louis Vuitton: O papel do significado de produto e da personalidade de marca. Rev. Gest. Inov. Sustentab. 2018, 4, 116–134. [Google Scholar]
Figure 1. Confirmatory Factor Analysis for the Chocolate Brands Relationship (CBR) Scale. Note. χ2 (184) = 646.72; p < 0.001; NC = 3.52; CFI = 0.91; RMSEA = 0.07.
Sustainability 13 05635 g001
Figure 2. Single-factor version of the CBR Scale. Note. χ2 (405) = 4567.17; p < 0.001; NC = 11.28; CFI = 0.45; RMSEA = 0.14.
Sustainability 13 05635 g002
Table 1. Sampling Profile.
Age (Years Old)Percentage
18–2553.9%
26–4028.4%
41–6015.2%
Older than 612.5%
Gender
Male30%
Female70%
Educational level
Elementary/Middle School1.1%
High School31.4%
Graduate degree61.8%
Masters degree4.8%
PhD degree1%
Relationship time with the chocolate brand
Less than 1 year7.1%
Between 1–5 years34.9%
Between 5–10 years36.4%
More than 10 years21.6%
Consumption frequency
Daily1.3%
Weekly3.8%
Biweekly19.9%
Casual65%
Table 2. Regression Weights of the Confirmatory Factor Analysis (CFA).
FactorScale ItemsStandardized EstimatesUnstandardized EstimatesS.E.C.R.p
Brand Trust (BT)R250.701.110.0911.55***
R100.650.660.0611.06***
R70.660.970.0811.07***
R30.680.890.0711.27***
R20.691.120.0911.38***
R10.561
Shopping Experience (SE)R40.721
R60.741.020.0423.93***
R80.600.780.0513.23***
R110.730.860.0516.11***
R140.710.860.0515.70***
R180.650.660.0414.27***
R220.700.760.0415.43***
R230.560.600.0512.32***
R240.650.770.0514.24***
R280.800.970.0617.68***
R300.701.040.0715.37***
Perceived Quality (PQ)R90.701
R120.600.730.0611.97***
R130.720.870.0614.19***
R210.610.810.0712.27***
Note. SE = standardized error; CR = critical ratio or t test; *** = p < 0.001.
Table 3. Comparison between the models.
IndexesSingle-Factor ModelMultifactorial Model
χ2χ2 (405) = 4567.17χ2 (184) = 646.72
NC11.283.52
CFI0.450.91
SRMR0.170.06
RMSEA0.140.07
Δχ2 (221) = 3920.45 p < 0.001
Table 4. Psychometric parameters of the CBR Scale.
ItemFactor LoadingsQuality of the Item
Brand TrustShopping ExperiencePerceived Quality
25. I say good things about this chocolate brand0.70 Very good
10. This chocolate brand has a good reputation in the market0.65 Very good
7. I intend to keep buying from this chocolate brand0.66 Very good
3. I trust this chocolate brand0.68 Very good
2. I recommend this chocolate brand to friends and family0.69 Very good
1. I prefer this chocolate brand when compared to other brands0.56 Good
4. This chocolate brand offers me personalized assistance (for example, knows my name and my consumption preferences) 0.72 Excellent
6. I feel a special customer for this chocolate brand 0.74 Excellent
8. This chocolate brand has loyalty programs 0.60 Good
11. This chocolate brand worries about my well-being 0.73 Excellent
14. This chocolate brand promotes events to be closer to customers 0.71 Excellent
18. This chocolate brand has social responsibility programs/actions 0.65 Very good
22. This chocolate brand is known for its social responsibility 0.70 Very good
23. This chocolate brand worries about disabled customers in the stores (for example, corridors for wheelchair users, braille menu options) 0.56 Good
24. This chocolate brand offers gifts or discounts for customers on special days (for example, birthdays, mothers’ day) 0.65 Very good
28. This chocolate brand worries about my interests 0.80 Excellent
30. I interact with this chocolate brand on social media 0.70 Very good
9. This chocolate brand uses quality ingredients 0.70Very good
12. This chocolate brand offers a variety of options (truffles, bars, boxes) 0.60Good
13. The chocolates of this brand are sold in clean environments 0.72Excellent
21. The chocolates of this brand are exposed in the store in an attractive way 0.61Good
Composite Reliability (Jöreskog Rho)0.820.910.75
Extracted Variance0.430.480.44
Table 5. CBR Scale Divergent Validity.
FactorBrand Trust (BT)Shopping Experience (SE)Perceived Quality (PQ)
Brand Trust (BT) 0.43 ª
Shopping Experience (SE)0.010.48 ª
Perceived Quality (PQ)0.0300.44 ª
Note. ª extracted variance.
Table 6. Correlation and Regression Tests.
Net Promoter Score (Satisfaction)Brand TrustShopping ExperiencePerceived QualityRelationshipRegression Coefficient (R2)
Pearson Correlation10.684 **0.276 **0.460 **0.568 *** 0.47
** p < 0.01. * F = 154.86 p < 0.01.
Table 7. Hypothesis Tests.
AssociationsPearson Correlation (r)Results
H1: R ⇔ S0.568 **Confirmed
H2: BT ⇔ S0.684 **Confirmed
H3: SE ⇔ S0.276 **Confirmed
H4: PQ ⇔ S0.460 **Confirmed
** p < 0.01. Note. BT = BrandTrust; SE = Shopping Experience; PQ = Perceived Quality; R = Relationship; S = Satisfaction.
Table 8. CBR Scale Content Validity.
FactorItem DescriptionTheoretical Support
Brand Trust25. I say good things about this chocolate brandWord of mouth, or the act of reporting good evaluations about a brand, is a major influence on how people know, feel and do about a product, company or brand [73]
10. This chocolate brand has a good reputation in the marketTo be successful and lucrative, brands must reach a positive reputation in the market, which will lead brands to attract more customers and fulfill their needs and desires [74]
7. I intend to keep buying from this chocolate brandBrands’ stores, price and quality promote consumers’ value perception, conducting their repurchase intention [75]
3. I trust this chocolate brandTrust is one of the building blocks of relationship marketing [21]
2. I recommend this chocolate brand to friends and familyConsumers recommend brands that promoted good service along with good products [73]
1. I prefer this chocolate brand when compared to other brandsRelational strategies promote consumers’ preference [41]
Shopping Experience4. This chocolate brand offers me personalized assistance (for example, knows my name and my consumption preferences)Consumers tend to relate to brands when they have a closer intimacy with the brand, which is seen as a hedonic benefit [43]
6. I feel a special customer for this chocolate brandRelationship marketing represents the transition from the focus on the transaction to the focus on the consumer [41]
8. This chocolate brand has loyalty programsFrequency and rewards programs promote customers’ loyalty as they value the relational benefits [27,76]
11. This chocolate brand worries about my well-beingConsumers value companies that offer them social support [73] and acknowledge theirs needs [41]
14. This chocolate brand promotes events to be closer to customersConsumers feel special when invited to events of a brand, they feel a part of the brands’ world [43]
18. This chocolate brand has social responsibility programs/actionsConsumers value brands that foster partnerships with social programs and actions, such as the support for NGOs [77]
22. This chocolate brand is known for its social responsibilityCorporate social responsibility is a major topic on relationship marketing, promoting transparency for brands, consumers, suppliers and investors [78]
23. This chocolate brand worries about disabled customers in the stores (for example, corridors for wheelchair users, braille menu options)The assistance to disabled customers is set as a new reality for service providers, helping brands and companies to co-create value with customers, as well as promoting social inclusion [79]
24. This chocolate brand offers gifts or discounts for customers on special days (for example, birthdays, mothers’ day)Consumers tend to feel special and more valued when they receive attention and special offers on important days [41]
28. This chocolate brand worries about my interestsConsumers tend to relate to brands when they feel intimate, acknowledge and special [43]
30. I interact with this chocolate brand on social mediaThe next phase of relationship marketing concerns relational strategies on the virtual environment, shedding light on the need of connecting with customers on social media [33]
Perceived Quality9. This chocolate brand uses quality ingredientsThe more the consumers perceive quality in a brand, the more they tend to relate with such brand [10]
12. This chocolate brand offers a variety of options (truffles, bars, boxes)The presentation of the chocolate and the options consumers promote consumers’ preference and their loyalty to the brand [5]
13. The chocolates of this brand are sold in clean environmentsThe ambiance of the place of the experience is a major driver of consumers’ preference and repurchase intention [80]
21. The chocolates of this brand are exposed in the store in an attractive wayThe experience consumers have with the context of the brand is an important driver of consumers’ loyalty [81]
Table 9. Descriptive analyses of the scale factors.
FactorMeanStandard DeviationMode
Perceived Quality4.650.425.00
Brand Trust4.460.515.00
Shopping Experience2.870.892.45
Publisher’s Note: MDPI stays neutral with regard to jurisdictional claims in published maps and institutional affiliations.

