
Experimental Investigation of Communication Performance of Drones Used for Autonomous Car Track Tests


Abstract
1. Introduction
- Improving Reliability for Wireless Links
- Enhanced significantly. Enhancing Flexibility for Infrastructures
- Providing Connectivity for Resource-less Scenarios
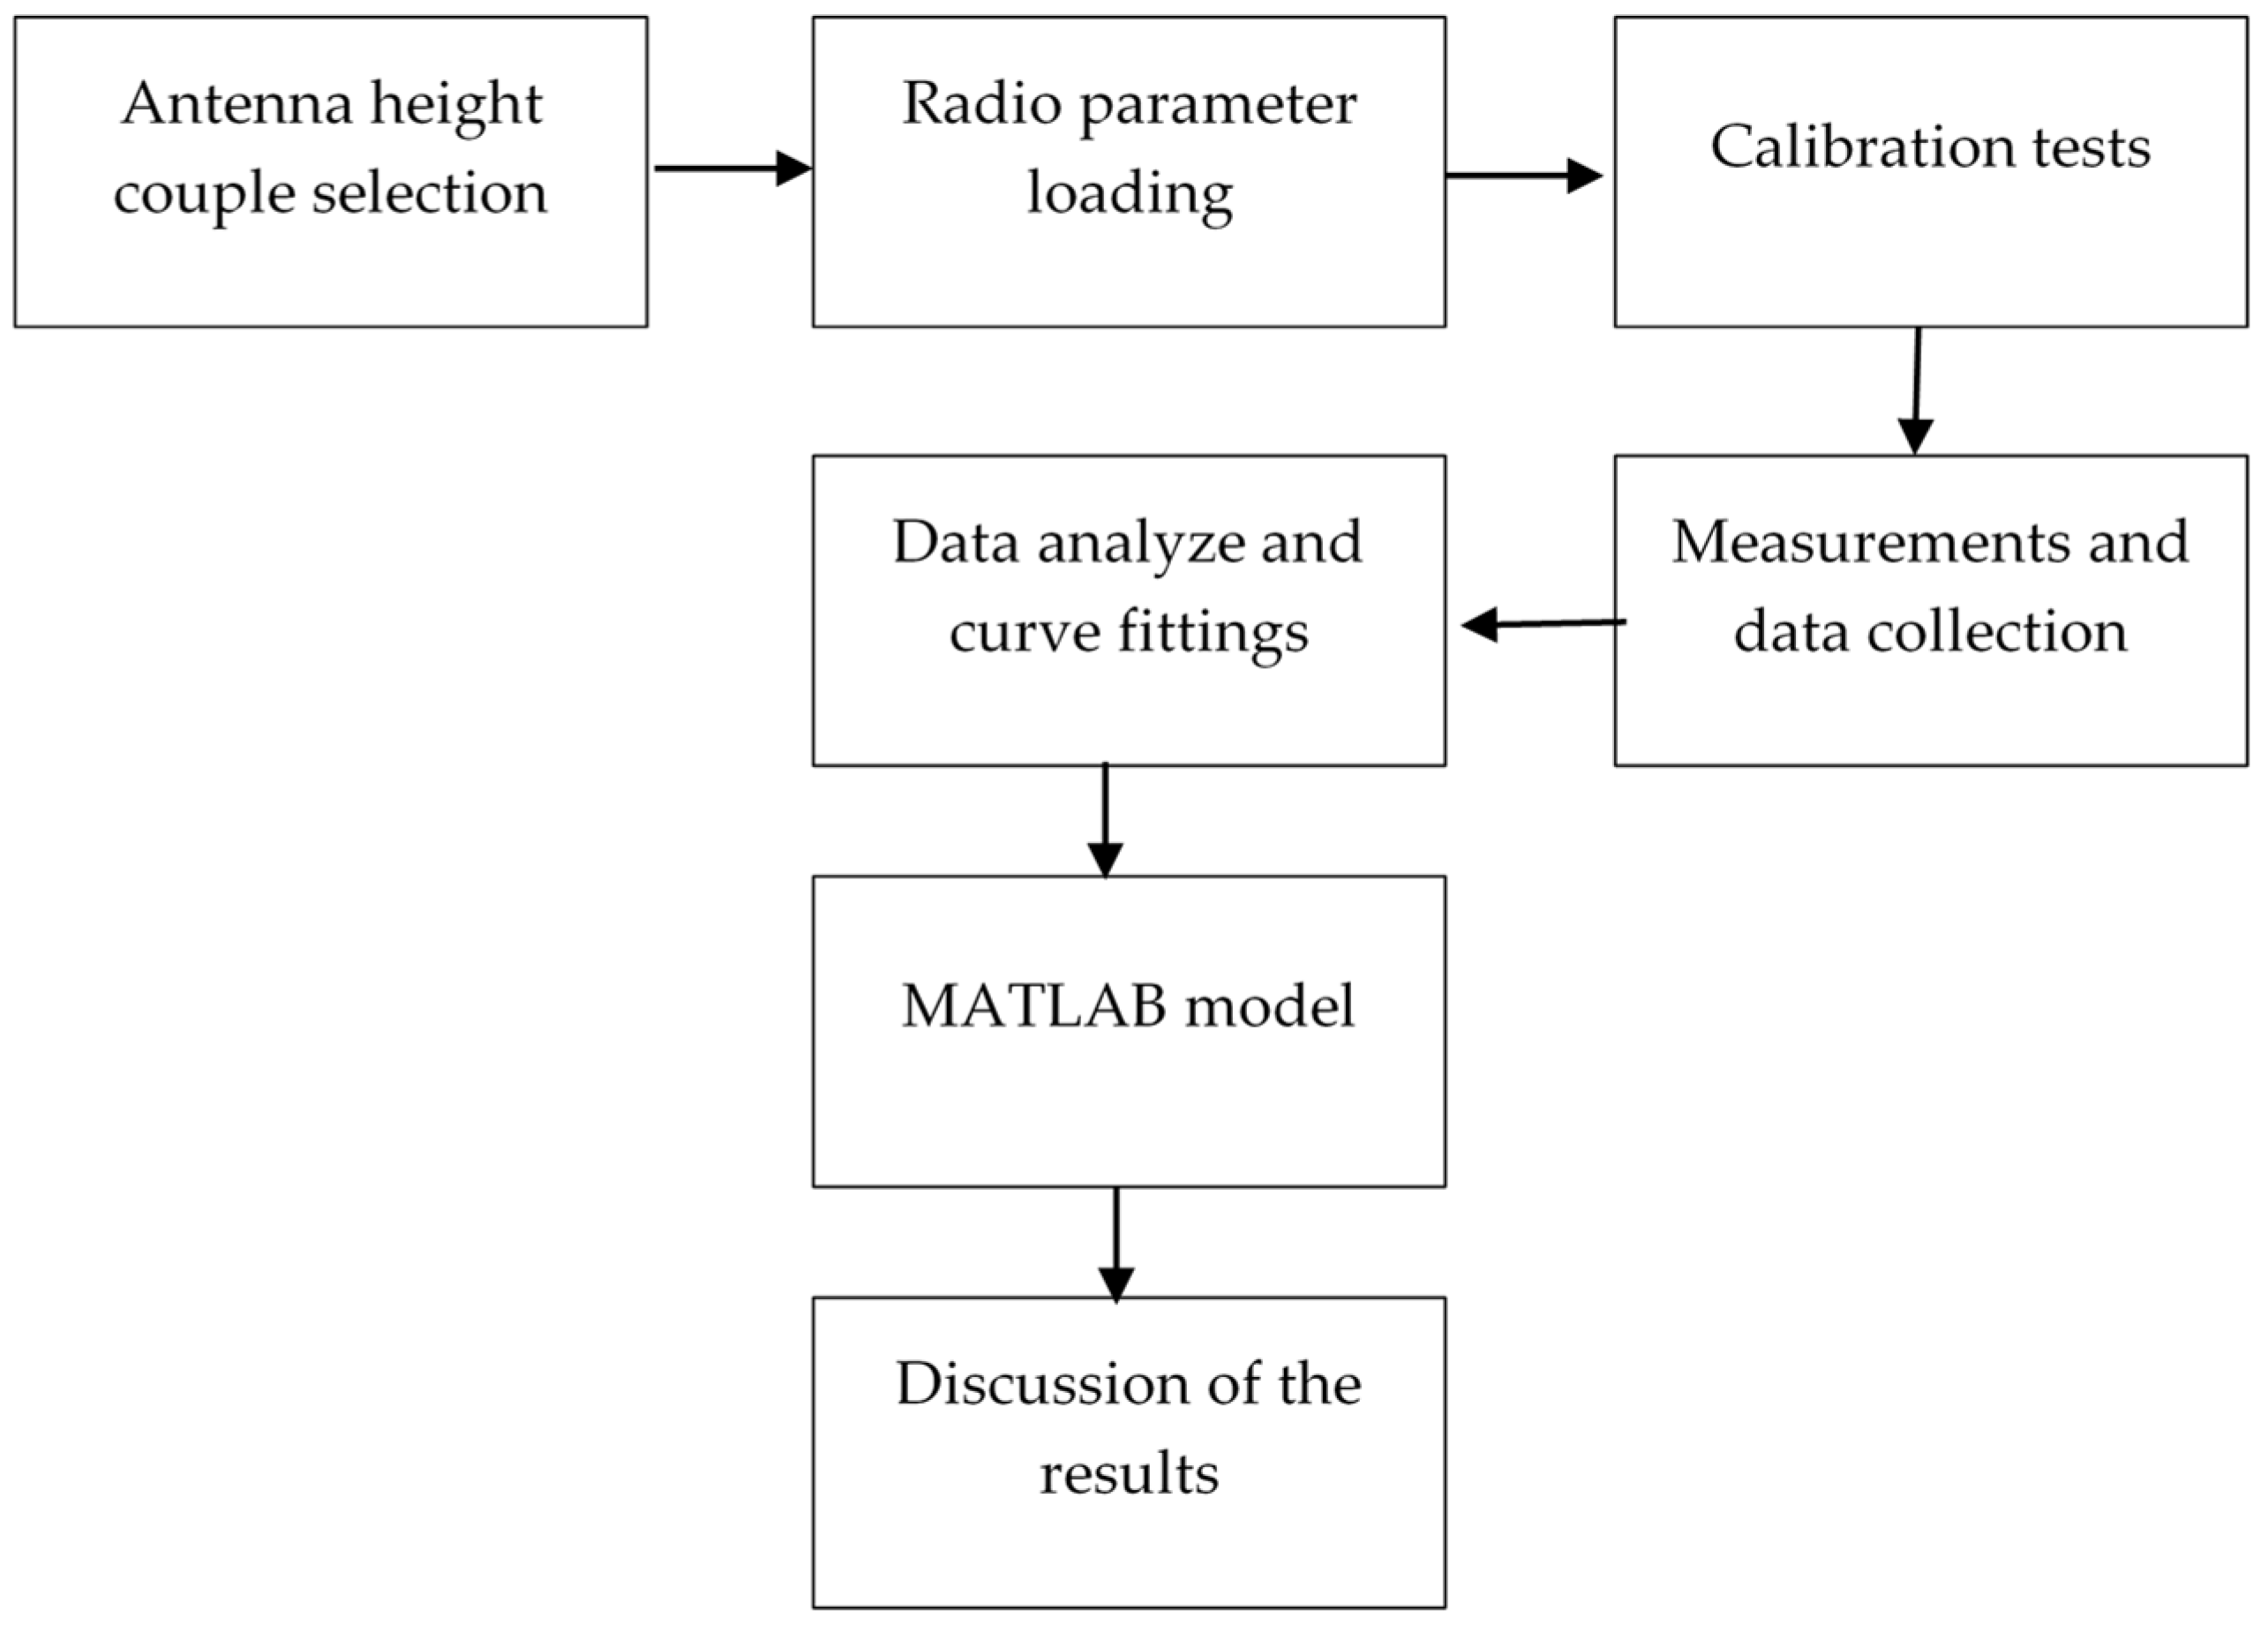
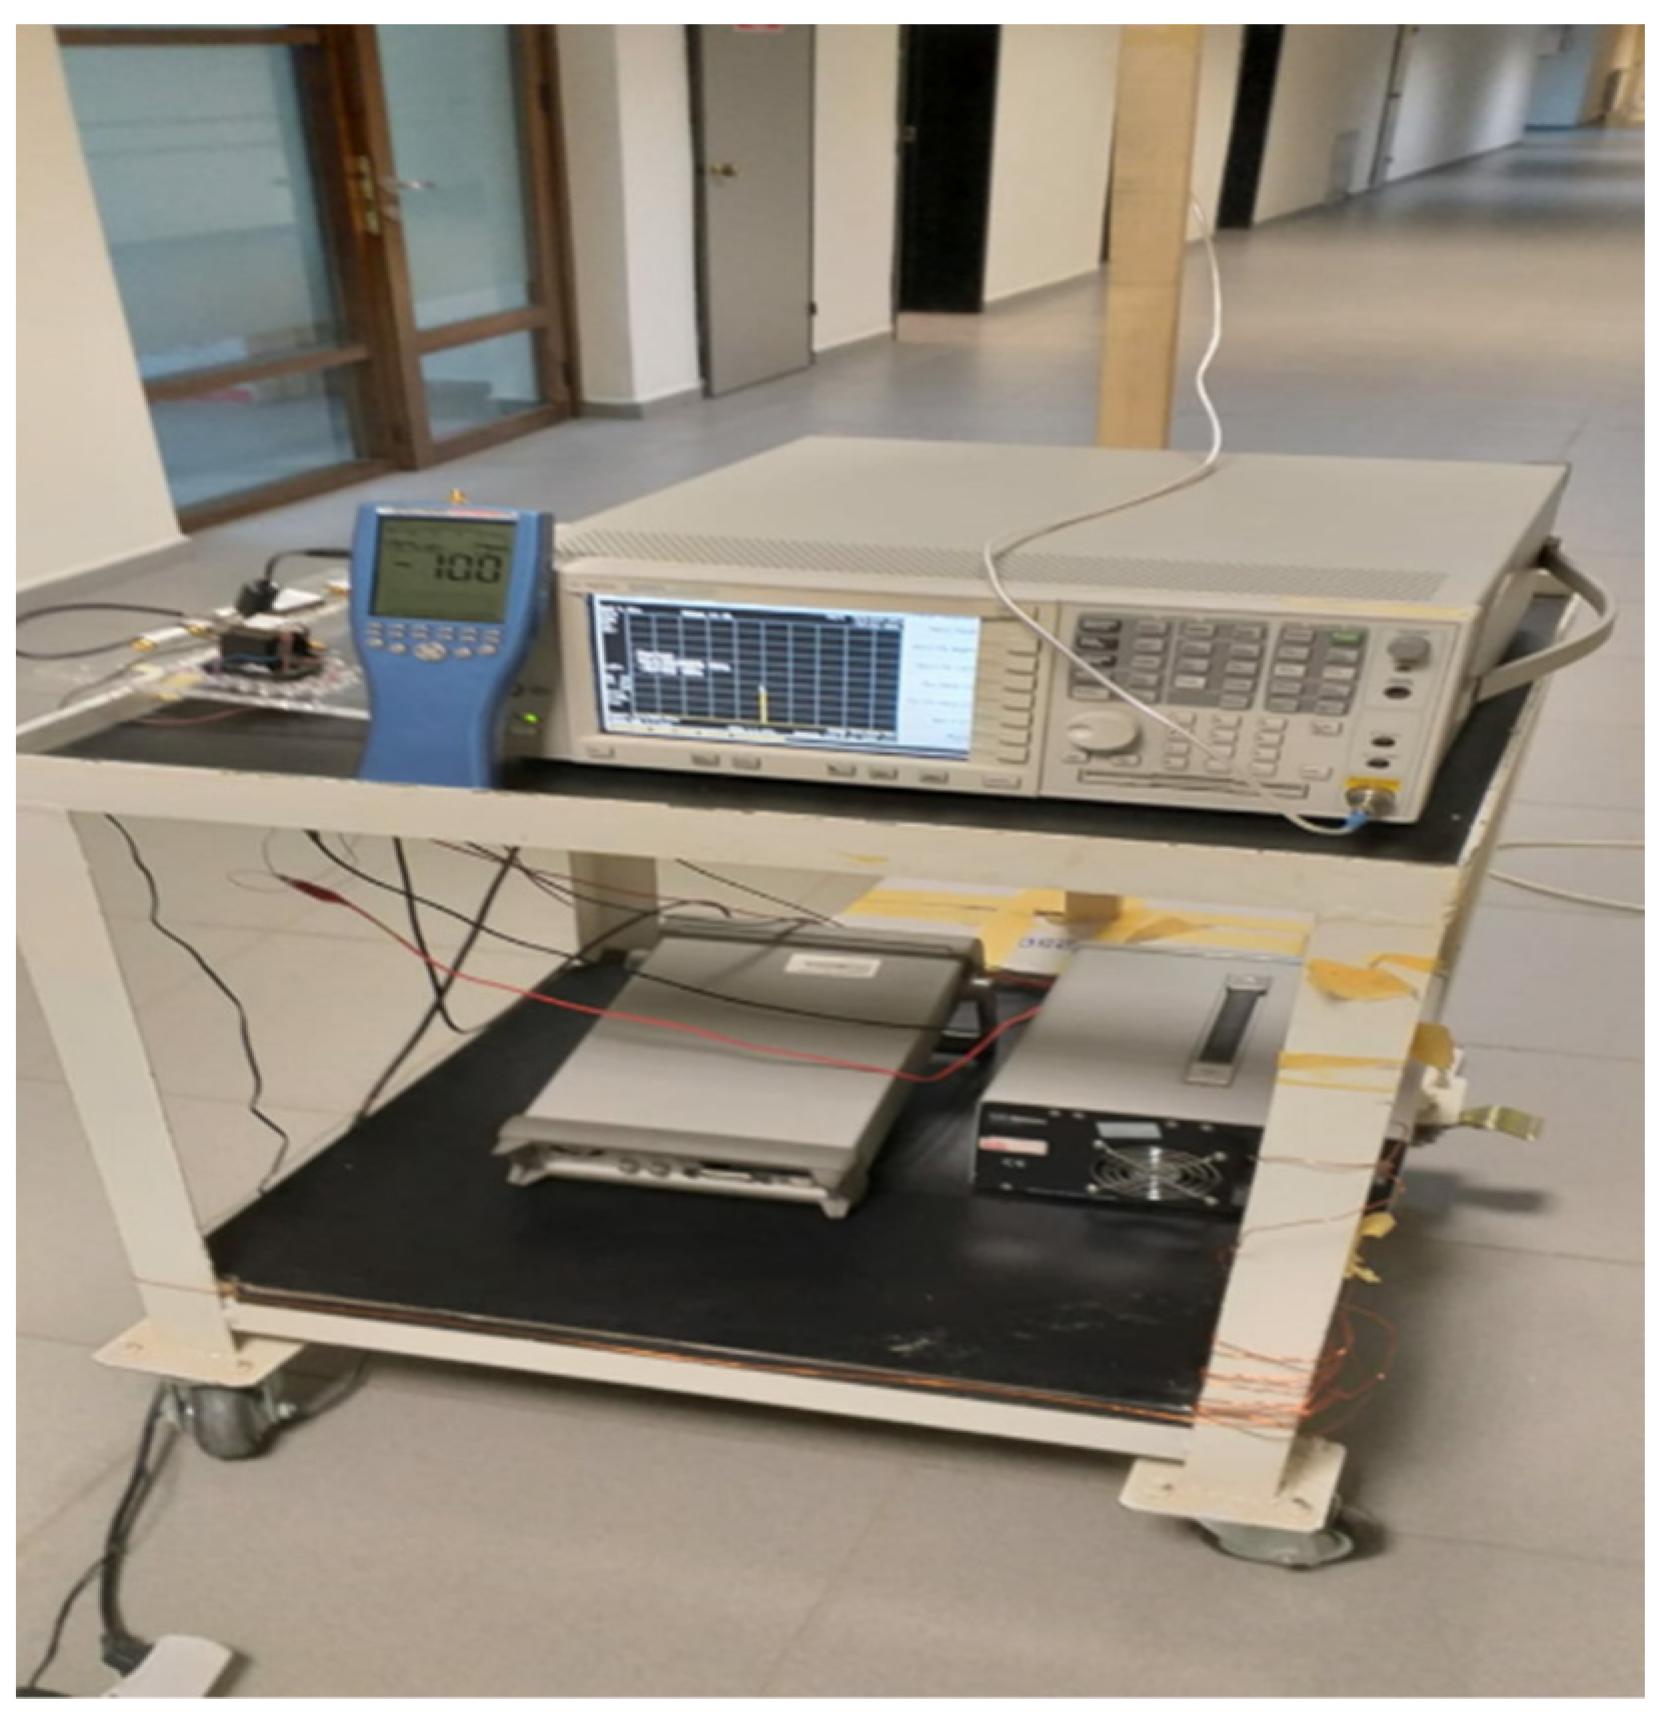
2. Methodology
- Frequency: 434 MHz, (half of the 868 MHz)
- Bandwidth: 125 kHz.
- Link spreading factor: 9.
- Output power: 17 dBm.
- The gain of the receiver LNA: 0 (automatic gain control)
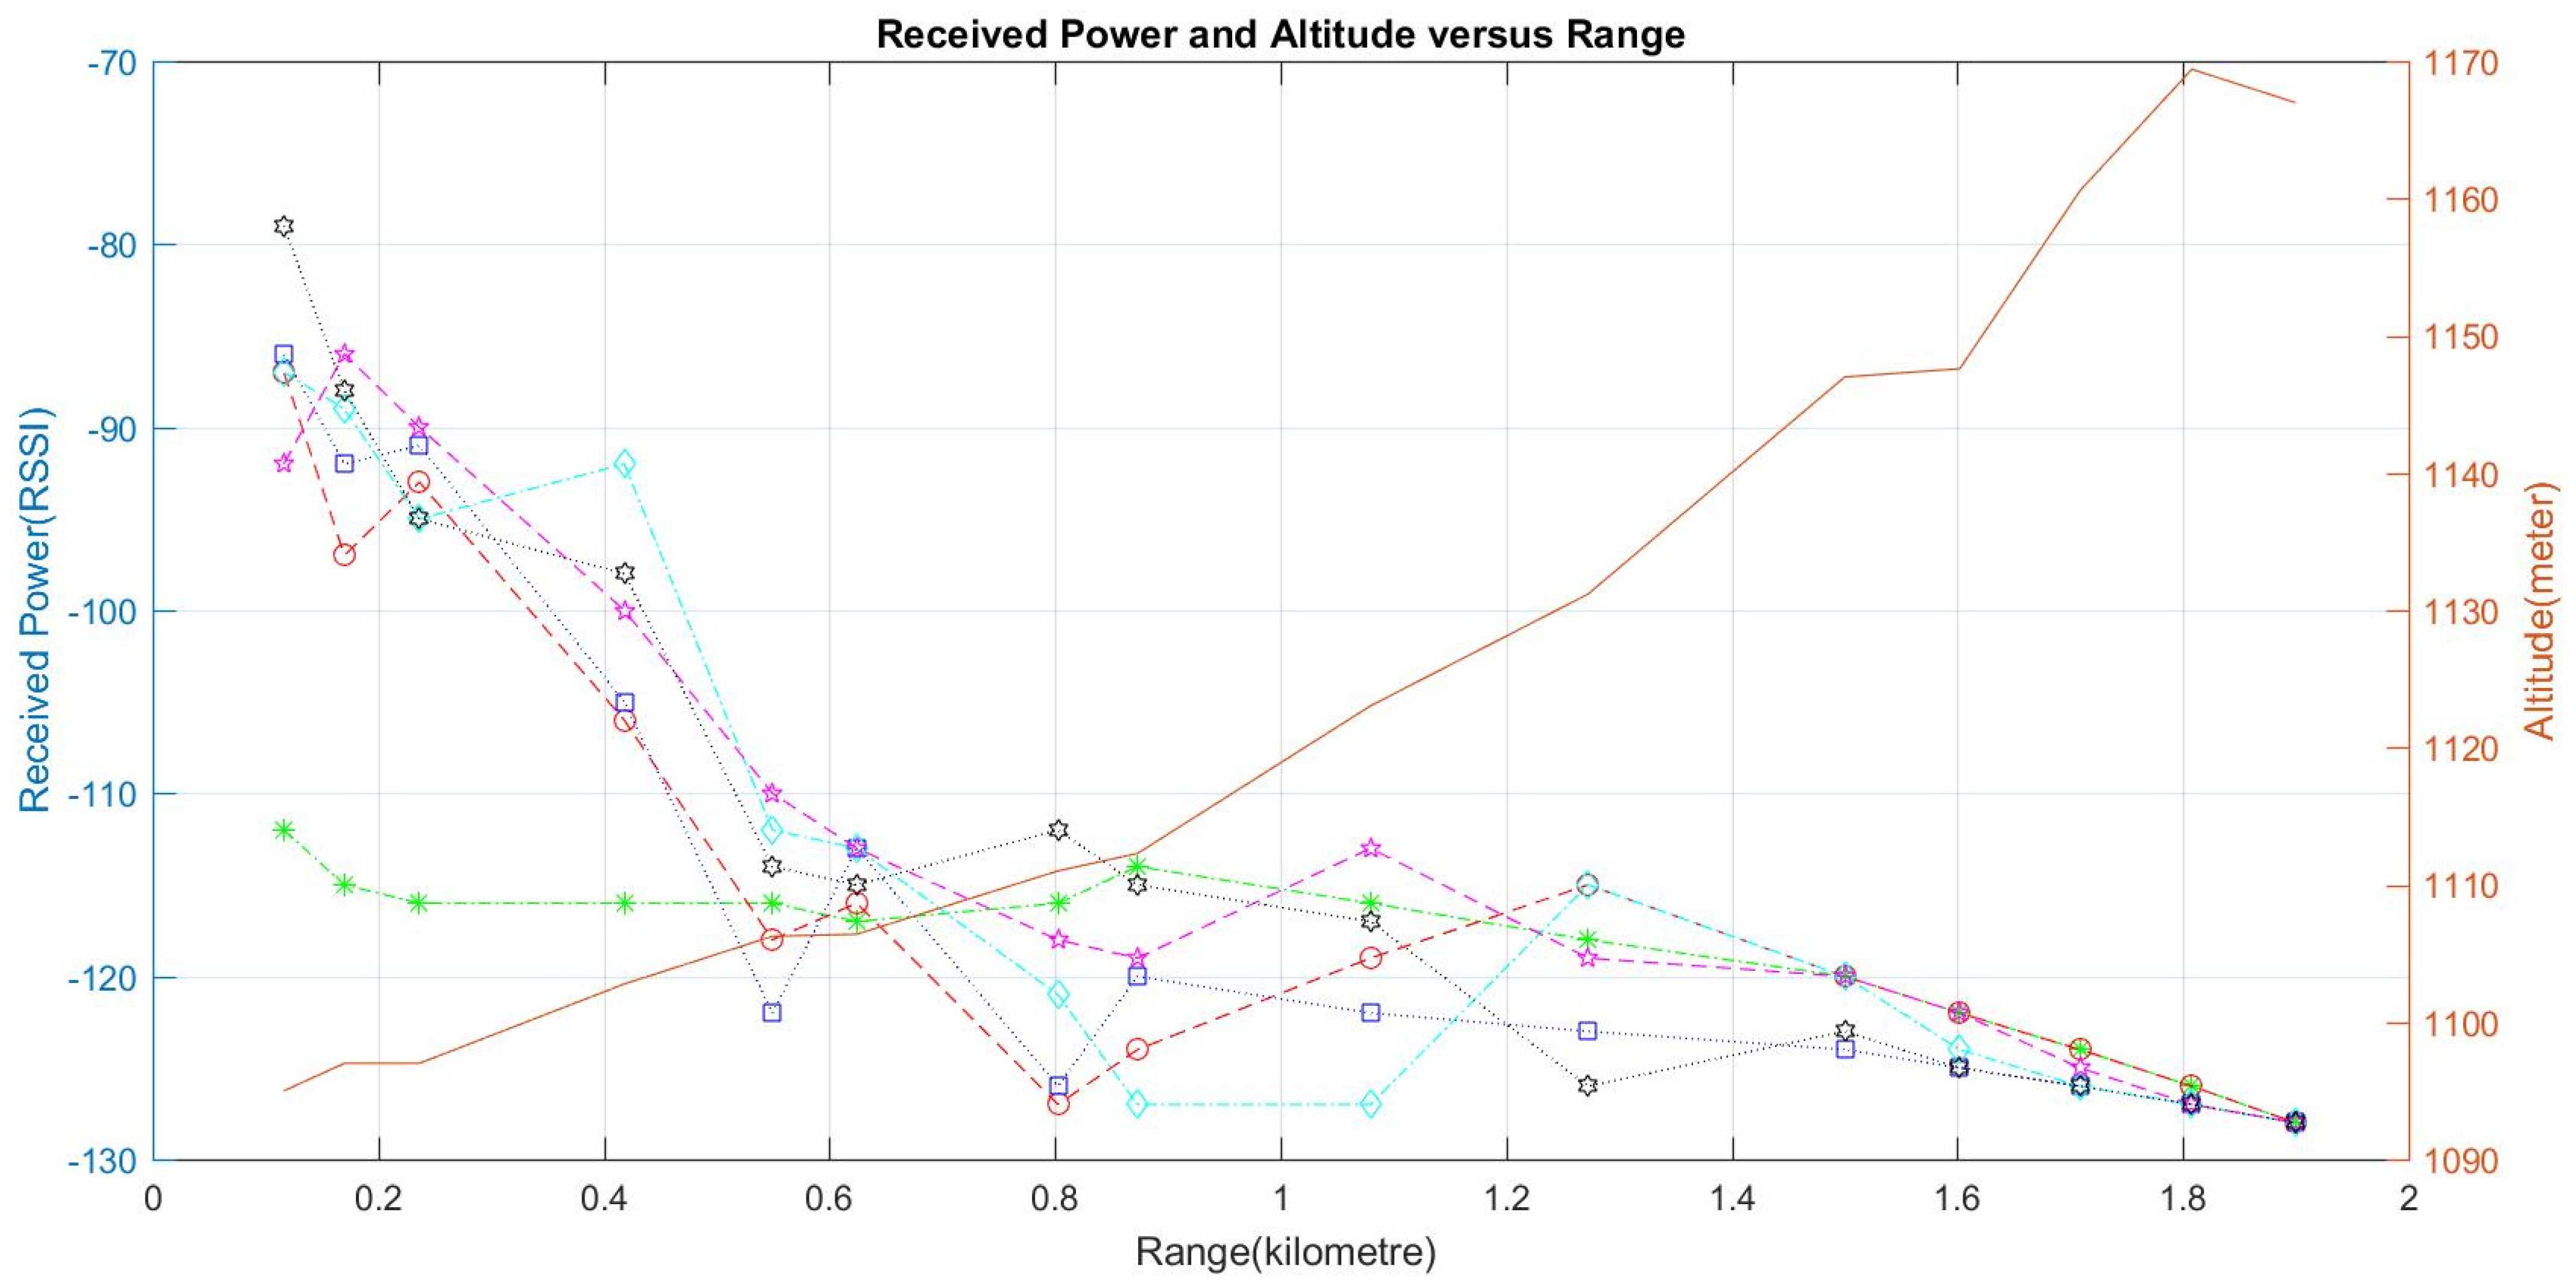
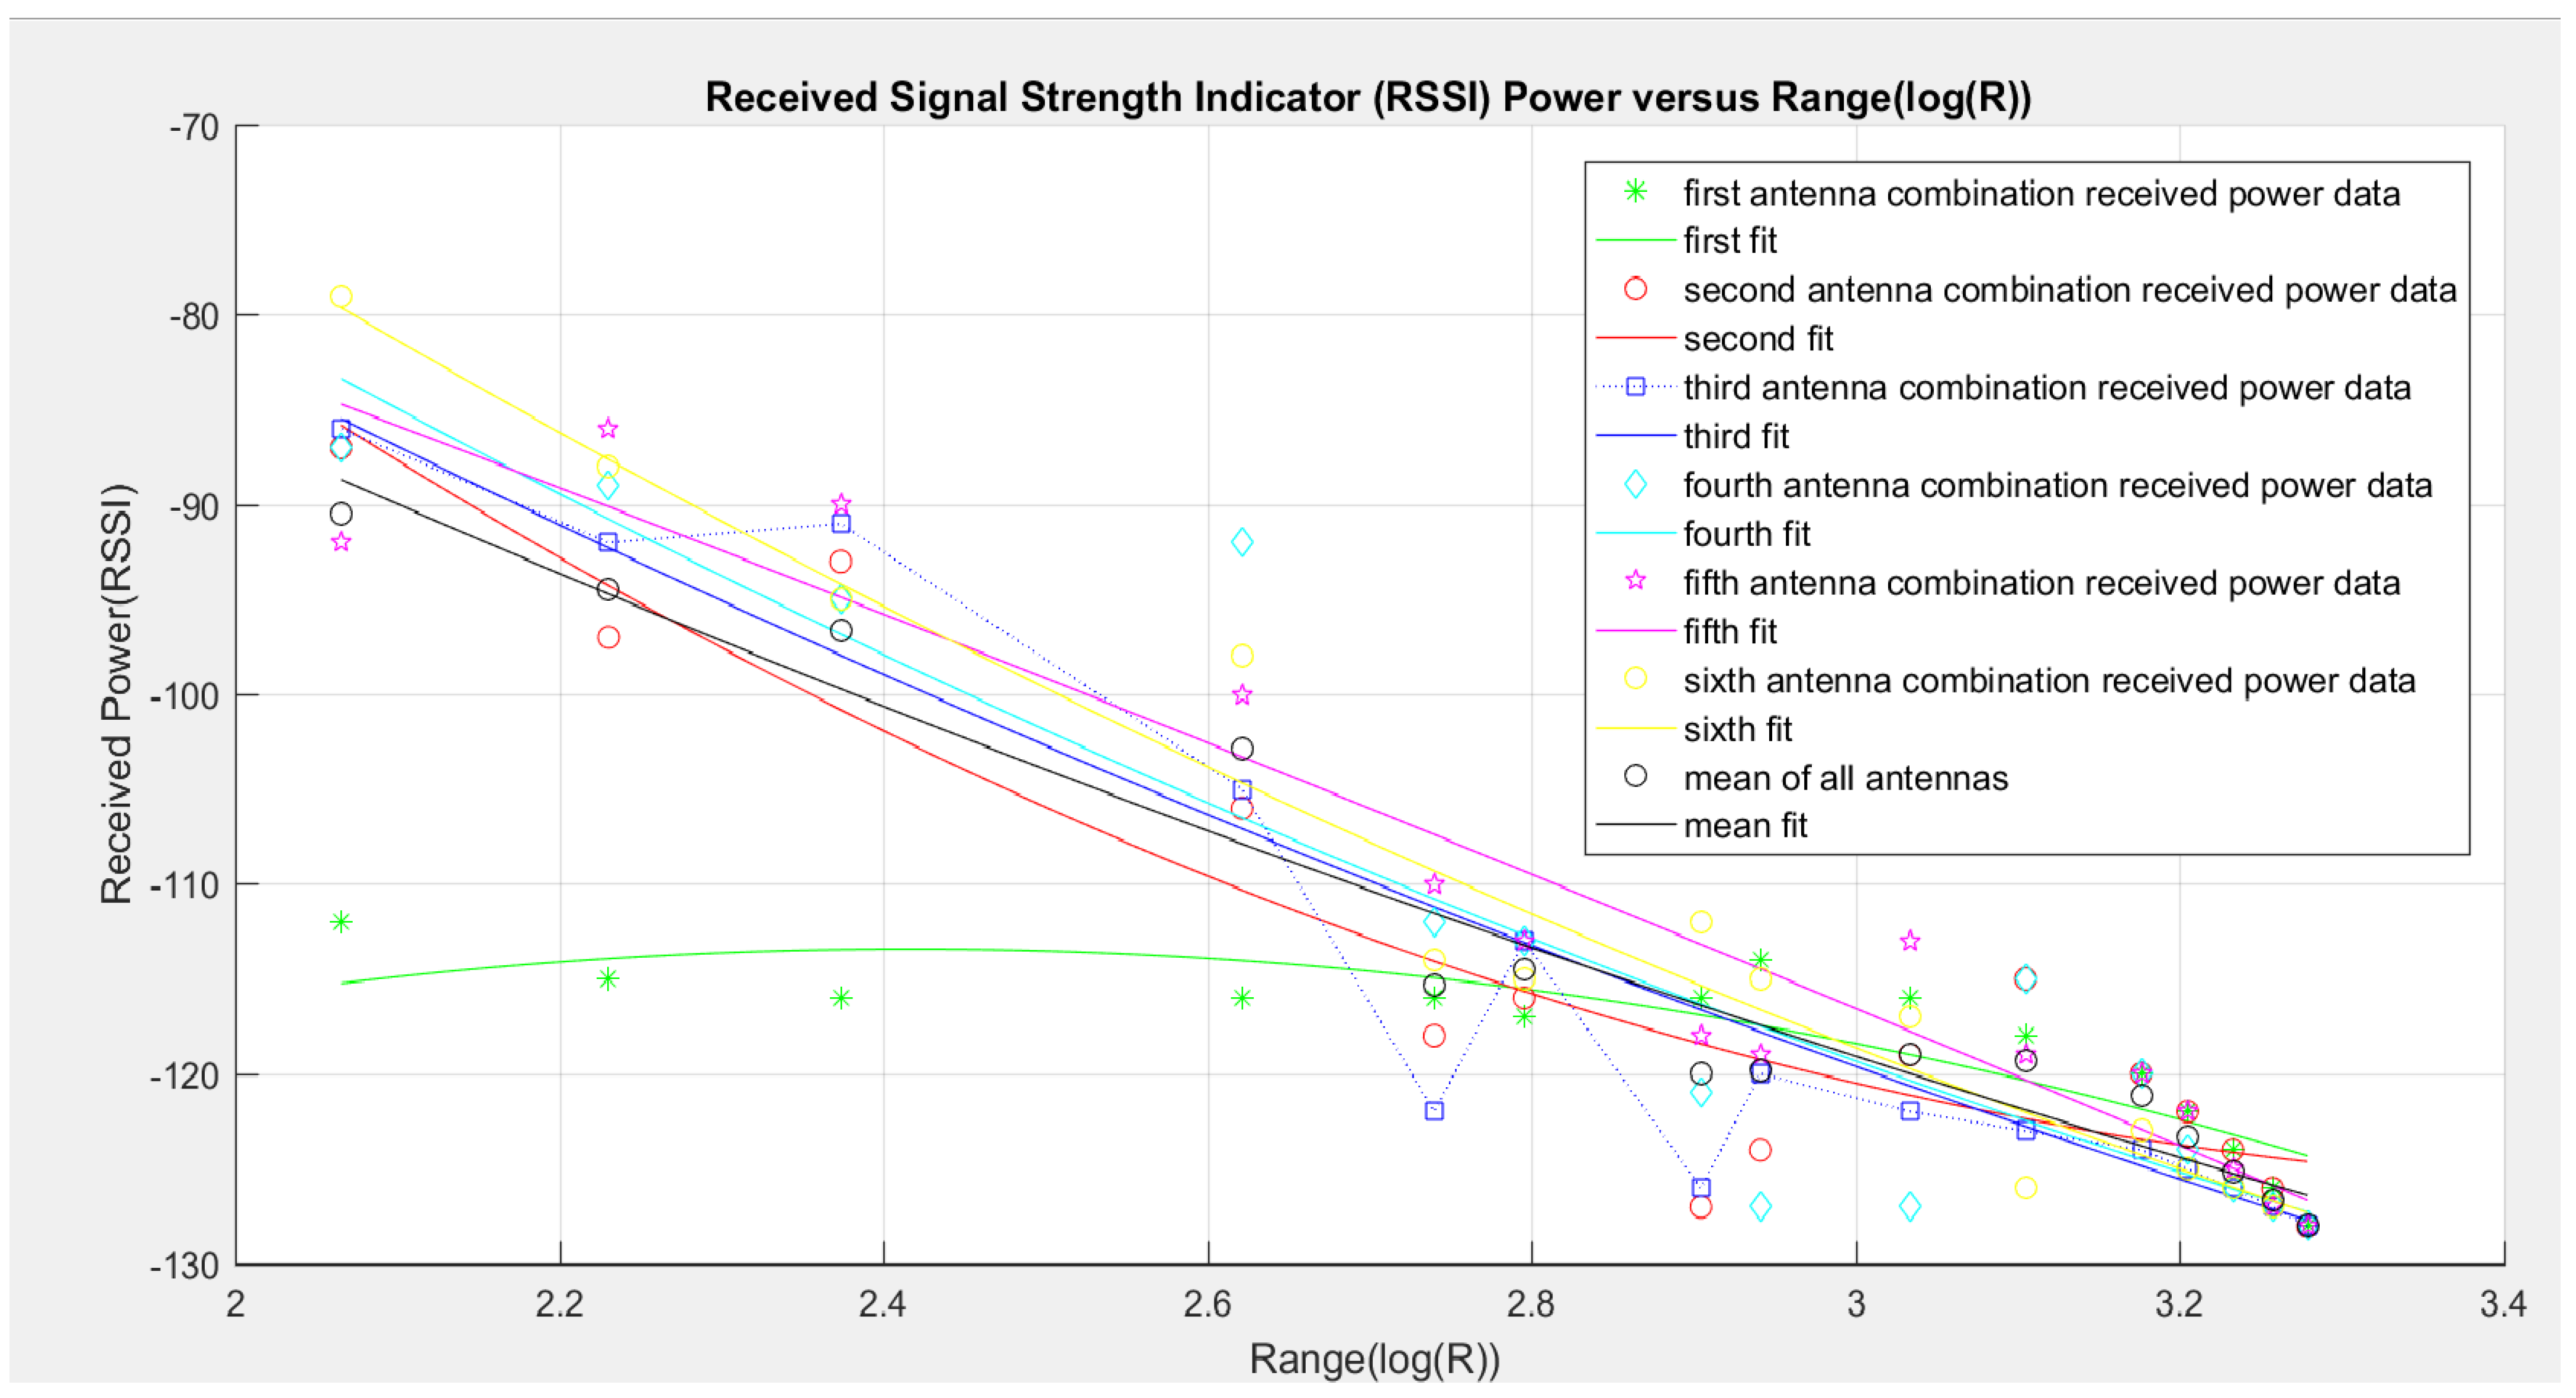
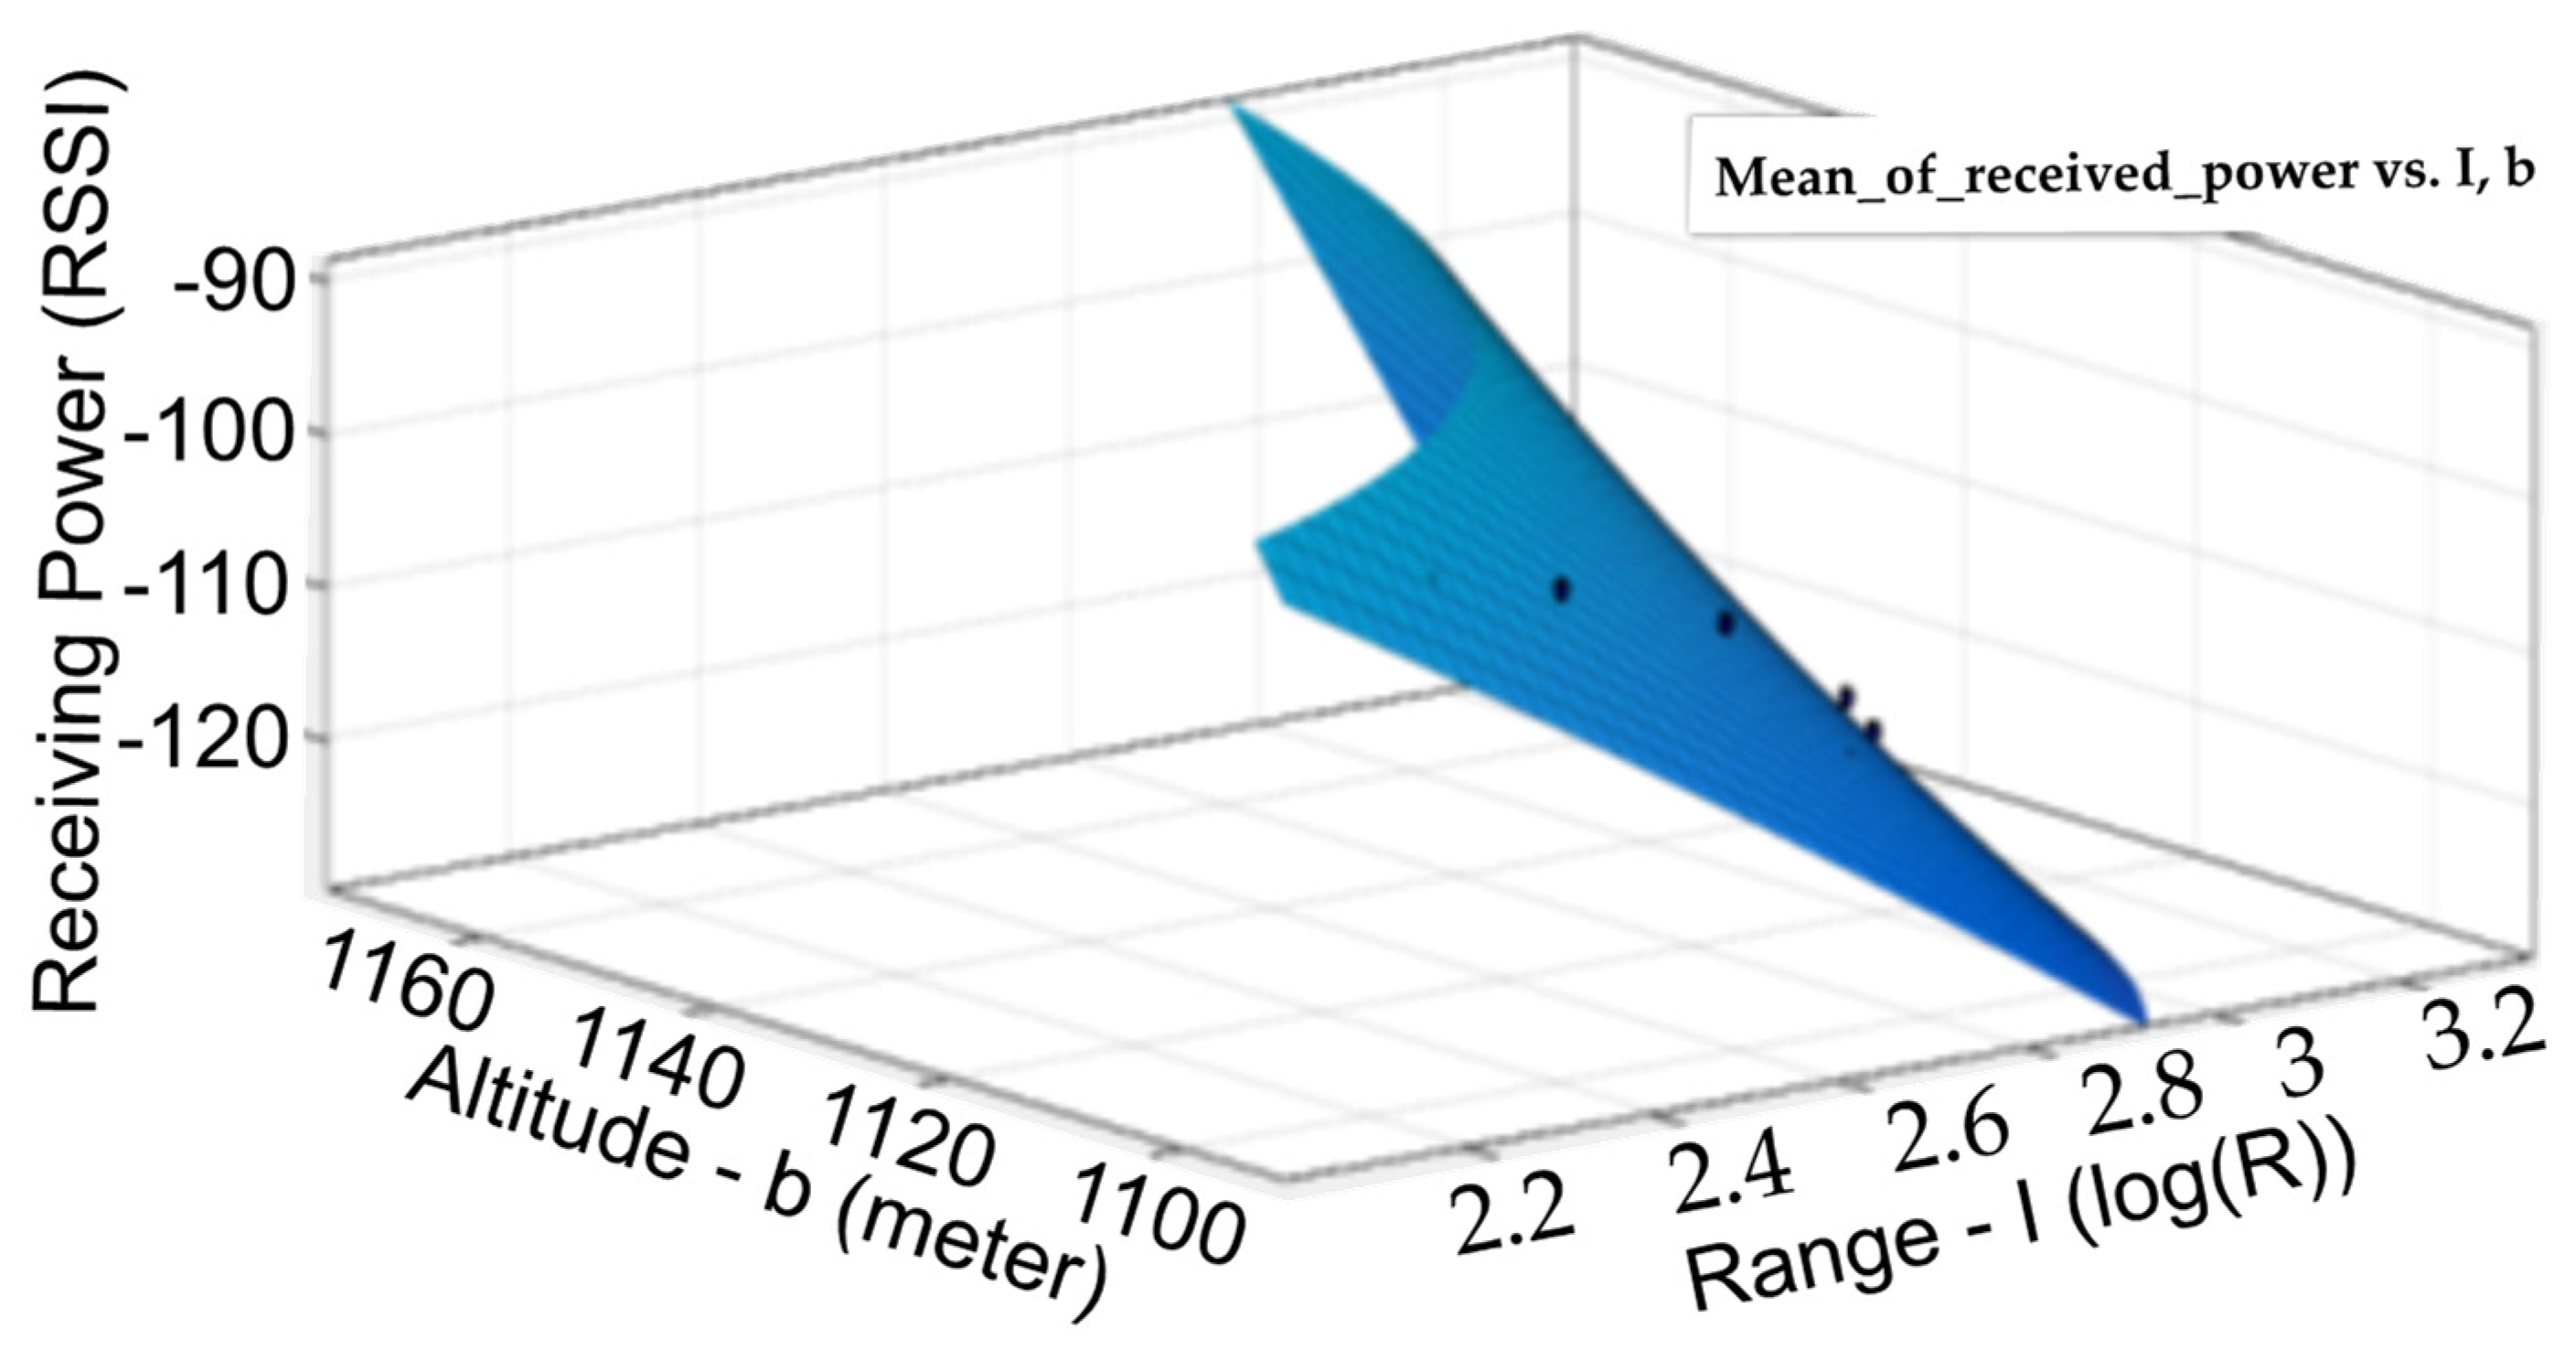
3. Results
- The SSE value range: 75 to 462.
- R2 value varies between 0.75 and 0.96.
- The DFE value: 12 for all combinations.
- The AdjustedR2 between about 0.70 and 0.96.
- RMSE between 2.50 and 6.20.
- The independent variable, called x, is normalized to an average of 6.594 for all combinations.
- The standard deviation of 0.8979 is the same for all combinations.
4. Discussion
5. Conclusions
6. Future Work
Author Contributions
Funding
Institutional Review Board Statement
Informed Consent Statement
Data Availability Statement
Acknowledgments
Conflicts of Interest
References
- Mayor, V.; Estepa, R.; Estepa, A.; Madinabeitia, G. Deploying a Reliable UAV-Aided Communication Service in Disaster Areas. Wirel. Commun. Mob. Comput. 2019. [Google Scholar] [CrossRef]
- Seliem, H.; Ahmed, M.H.; Shahidi, R.; Shehata, M.S. Delay analysis for drone-based vehicular Ad-Hoc Networks. In Proceedings of the 2017 IEEE 28th Annual International Symposium on Personal, Indoor, and Mobile Radio Communications (PIMRC), Montreal, QC, Canada, 8–13 October 2017; pp. 1–7. [Google Scholar] [CrossRef]
- Shi, W.; Zhou, H.; Li, J.; Xu, W.; Zhang, N.; Shen, X. Drone Assisted Vehicular Networks: Architecture, Challenges and Opportunities. IEEE Netw. 2018, 32, 130–137. [Google Scholar] [CrossRef]
- Wang, X.; Fu, L.; Zhang, Y.; Gan, X.; Wang, X. VDNet: An infrastructure-less UAV-assisted sparse VANET system with vehicle location prediction. Wirel. Commun. Mob. Comput. 2016, 16, 2991–3003. [Google Scholar] [CrossRef]
- Zhou, Y.; Cheng, N.; Lu, N.; Shen, X.S. Multi-UAV-Aided Networks: Aerial-Ground Cooperative Vehicular Networking Architecture. IEEE Veh. Technol. Mag. 2015, 10, 36–44. [Google Scholar] [CrossRef]
- Oubbati, O.S.; Lakas, A.; Lagraa, N.; Yagoubi, M.B. UVAR: An intersection UAV-assisted VANET routing protocol. In Proceedings of the 2016 IEEE Wireless Communications and Networking Conference, Doha, Qatar, 3–6 April 2016; pp. 1–6. [Google Scholar] [CrossRef]
- Chen, L.-W.; Tseng, Y.-C.; Syue, K.-Z. Surveillance on-the-road: Vehicular tracking and reporting by V2V communications. Comput. Netw. 2014, 67, 154–163. [Google Scholar] [CrossRef]
- Abdolmaleki, M.; Masoud, N.; Yin, Y. Vehicle-to-vehicle wireless power transfer: Paving the way toward an electrified transportation system. Transp. Res. Part C Emerg. Technol. 2019, 103, 261–280. [Google Scholar] [CrossRef]
- Nguyen, B.C.; Tran, X.N.; Dung, L.T. On the performance of roadside unit-assisted energy harvesting full-duplex amplify-and-forward vehicle-to-vehicle relay systems. AEU-Int. J. Electron. Commun. 2020, 123, 153289. [Google Scholar] [CrossRef]
- Al-Hourani, A.; Kandeepan, S.; Lardner, S. Optimal LAP Altitude for Maximum Coverage. IEEE Wirel. Commun. Lett. 2014, 3, 569–572. [Google Scholar] [CrossRef]
- Meng, Y.S.; Lee, Y.H.; Ng, B.C. Empirical near ground path loss modeling in a forest at VHF and UHF bands. IEEE Trans. Antennas Propag. 2009, 57, 1461–1468. [Google Scholar] [CrossRef]
- Kurnaz, O.; Helhel, S. Near ground propagation model for pine tree forest environment. AEU-Int. J. Electron. Commun. 2014, 68, 944–950. [Google Scholar] [CrossRef]
- Hejselbaek, J.; Nielsen, J.O.; Fan, W.; Pedersen, G.F. Empirical Study of Near Ground Propagation in Forest Terrain for Internet-of-Things Type Device-to-Device Communication. IEEE Access 2018, 6, 54052–54063. [Google Scholar] [CrossRef]
- Wu, H.; Zhang, L.; Miao, Y. The Propagation Characteristics of Radio Frequency Signals for Wireless Sensor Networks in Large-Scale Farmland. Wirel. Pers. Commun. 2017, 95, 3653–3670. [Google Scholar] [CrossRef]
- Pojda, J.; Wolff, A.; Sbeiti, M.; Wietfeld, C. Performance analysis of mesh routing protocols for UAV swarming applications. In Proceedings of the 2011 8th International Symposium on Wireless Communication Systems, Aachen, Germany, 6–9 November 2011; pp. 317–321. [Google Scholar] [CrossRef]
- Kuschnig, R.; Bettstetter, C. Channel Measurements over 802. 11a-Based UAV-to-Ground Links. In Proceedings of the 2011 IEEE GLOBECOM Workshops (GC Wkshps), Houston, TX, USA, 5–9 December 2011; pp. 1280–1284. [Google Scholar]
- Santa, J.; Gómez-Skarmeta, A.F.; Sánchez-Artigas, M. Architecture and evaluation of a unified V2V and V2I communication system based on cellular networks. Comput. Commun. 2008, 31, 2850–2861. [Google Scholar] [CrossRef]
- Dey, K.C.; Rayamajhi, A.; Chowdhury, M.; Bhavsar, P.; Martin, J. Vehicle-to-vehicle (V2V) and vehicle-to-infrastructure (V2I) communication in a heterogeneous wireless network—Performance evaluation. Transp. Res. Part C Emerg. Technol. 2016, 68, 168–184. [Google Scholar] [CrossRef]
- Zafar, W.; Khan, B.M. A reliable, delay bounded and less complex communication protocol for multicluster FANETs. Digit. Commun. Netw. 2017, 3, 30–38. [Google Scholar] [CrossRef]
- Asadpour, M.; Giustiniano, D.; Hummel, K.A. From ground to aerial communication: Dissecting WLAN 802.11n for the drones. In Proceedings of the 8th ACM International Workshop on Wireless Network Testbeds, Experimental Evaluation & Characterization, Miami, FL, USA, 30 September 2013; pp. 25–32. [Google Scholar] [CrossRef]
- Shaikh, Z.; Baidya, S.; Levorato, M. Robust Multi-Path Communications for UAVs in the Urban IoT. In Proceedings of the2018 IEEE International Conference on Sensing, Communication and Networking (SECON Workshops), Hong Kong, China, 11 June 2018; pp. 1–5. [Google Scholar] [CrossRef]
- Gomez, K.; Rasheed, T.; Reynaud, L.; Kandeepan, S.; Chavez, K.M.G. On the performance of aerial LTE base-stations for public safety and emergency recovery. In Proceedings of the 2013 IEEE Globecom Workshops (GC Wkshps), Atlanta, GA, USA, 9–13 December 2013; pp. 1391–1396. [Google Scholar] [CrossRef]
- Motlagh, N.H.; Bagaa, M.; Taleb, T. UAV-Based IoT Platform: A Crowd Surveillance Use Case. IEEE Commun. Mag. 2017, 55, 128–134. [Google Scholar] [CrossRef]
- Kuang, H.; Wang, M.-T.; Lu, F.-H.; Bai, K.-Z.; Li, X.-L. An extended car-following model considering multi-anticipative average velocity effect under V2V environment. Phys. A Stat. Mech. Its Appl. 2019, 527, 121268. [Google Scholar] [CrossRef]
- Szalay, Z.; Tettamanti, T.; Esztergár-Kiss, D.; Varga, I.; Bartolini, C. Development of a Test Track for Driverless Cars: Vehicle Design, Track Configuration, and Liability Considerations. Period. Polytech. Transp. Eng. 2017, 46, 29. [Google Scholar] [CrossRef]
- Szalay, Z.; Hamar, Z.; Nyerges, Á. Novel design concept for an automotive proving ground supporting multilevel CAV development. Int. J. Veh. Des. 2019, 80, 1–22. [Google Scholar] [CrossRef]
- Koschuch, M.; Sebron, W.; Szalay, Z.; Torok, A.; Tschiurtz, H.; Wahl, I. Safety & Security in the Context of Autonomous Driving. In Proceedings of the 2019 IEEE International Conference on Connected Vehicles and Expo (ICCVE), Graz, Austria, 4–8 November 2019; pp. 1–7. [Google Scholar] [CrossRef]
- Szalay, Z. Next Generation X-in-the-Loop Validation Methodology for Automated Vehicle Systems. IEEE Access 2021, 9, 35616–35632. [Google Scholar] [CrossRef]
- Medetov, S.; Bakhouya, M.; Gaber, J.; Wack, M. Evaluation of an energy-efficient broadcast protocol in mobile ad hoc networks. ICT 2013 2013, 1–5. [Google Scholar] [CrossRef]
- Williams, E.; Das, V.; Fisher, A. Assessing the Sustainability Implications of Autonomous Vehicles: Recommendations for Research Community Practice. Sustainability 2020, 12, 1902. [Google Scholar] [CrossRef]
- Peters, L. Reviews and abstracts—IEEE standard test procedures for antennas. IEEE Antennas Propag. Soc. Newsl. 1981, 23, 28. [Google Scholar] [CrossRef]
- Gay-Fernandez, J.A.; Cuinas, I. Peer to peer wireless propagation measurements and path-loss modeling in vegetated environments. IEEE Trans. Antennas Propag. 2013, 61, 3302–3311. [Google Scholar] [CrossRef]


| Technology | LTE [19] | WiFi [20] | ZigBee [21] |
|---|---|---|---|
| IEEE | LTE | 802.11n | 802.15.4 |
| Operating Frequency | >20 MHz | 2.4/5 GHz | 868–915 MHz |
| Licensed Spectrum | Yes | No | No |
| Outdoor Range | 100 km | 250 m | 10–20 m |
| Transfer Rate | 300 Mbps | 600 Mbps | 200 Kbps |
| Latency | 10 ms | <5 ms | <70 ms |
| Physical Infrastructure | Yes | No | No |
| Topology | Plan | AD Hoc, Star, Mesh, Hybrid | Mesh, Point-to-Point, Point-Multipoint |
| Technology | Application |
|---|---|
| WiFi [20] | Emergency network establishment in disaster |
| LTE [22] | Surveillance in urban areas |
| Expansion of coverage of the network | |
| WiFi and ZigBee [19] | Image and data transfer in UAV network |
| ZigBee [23] | Cluster and swarm communication |
| Features | RF Module-1 | RF Module-2 |
|---|---|---|
| Frequency Range | 820/950 MHz | 868/915 MHz |
| Feeding Voltage | 2/3.6 V | 1.8/3.6 V |
| Modulation Technique | FSK/GFSK/OOK | FSK/GFSK/MSK/LoRa |
| Communication Interface | SPI | SPI |
| Sensitivity (Max) | −123 dBm | −139 dBm |
| Exit Power | 16 dBm | 20 dBm |
| Data Velocity (Max) | 1.2 Mbps | 300 kbps |
| Antenna Out | 50 ohm | 50 ohm |
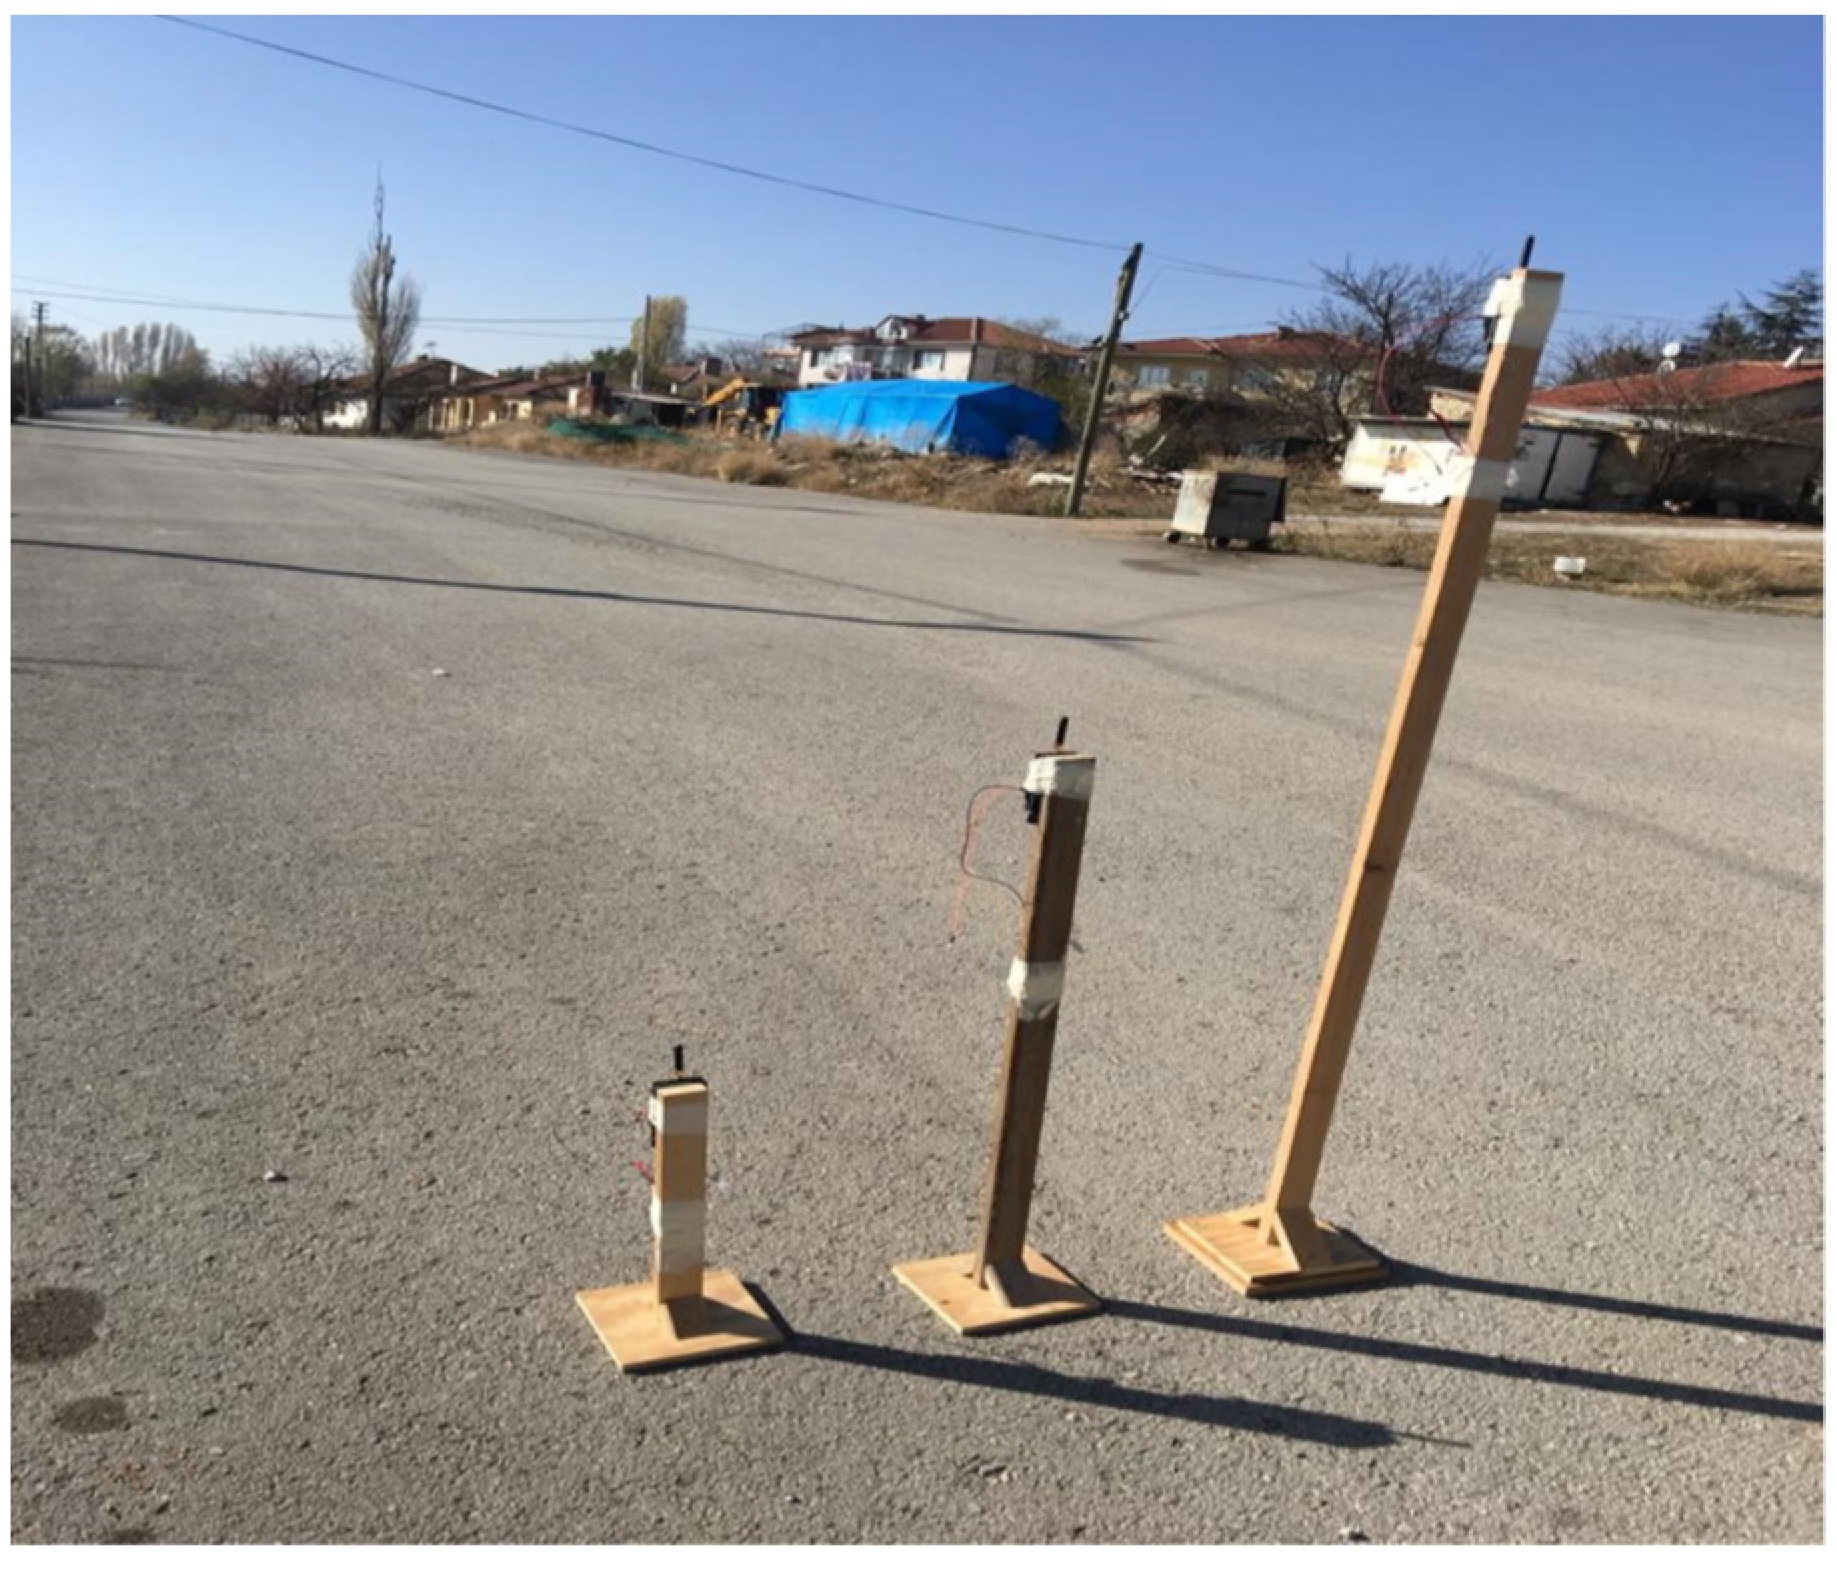
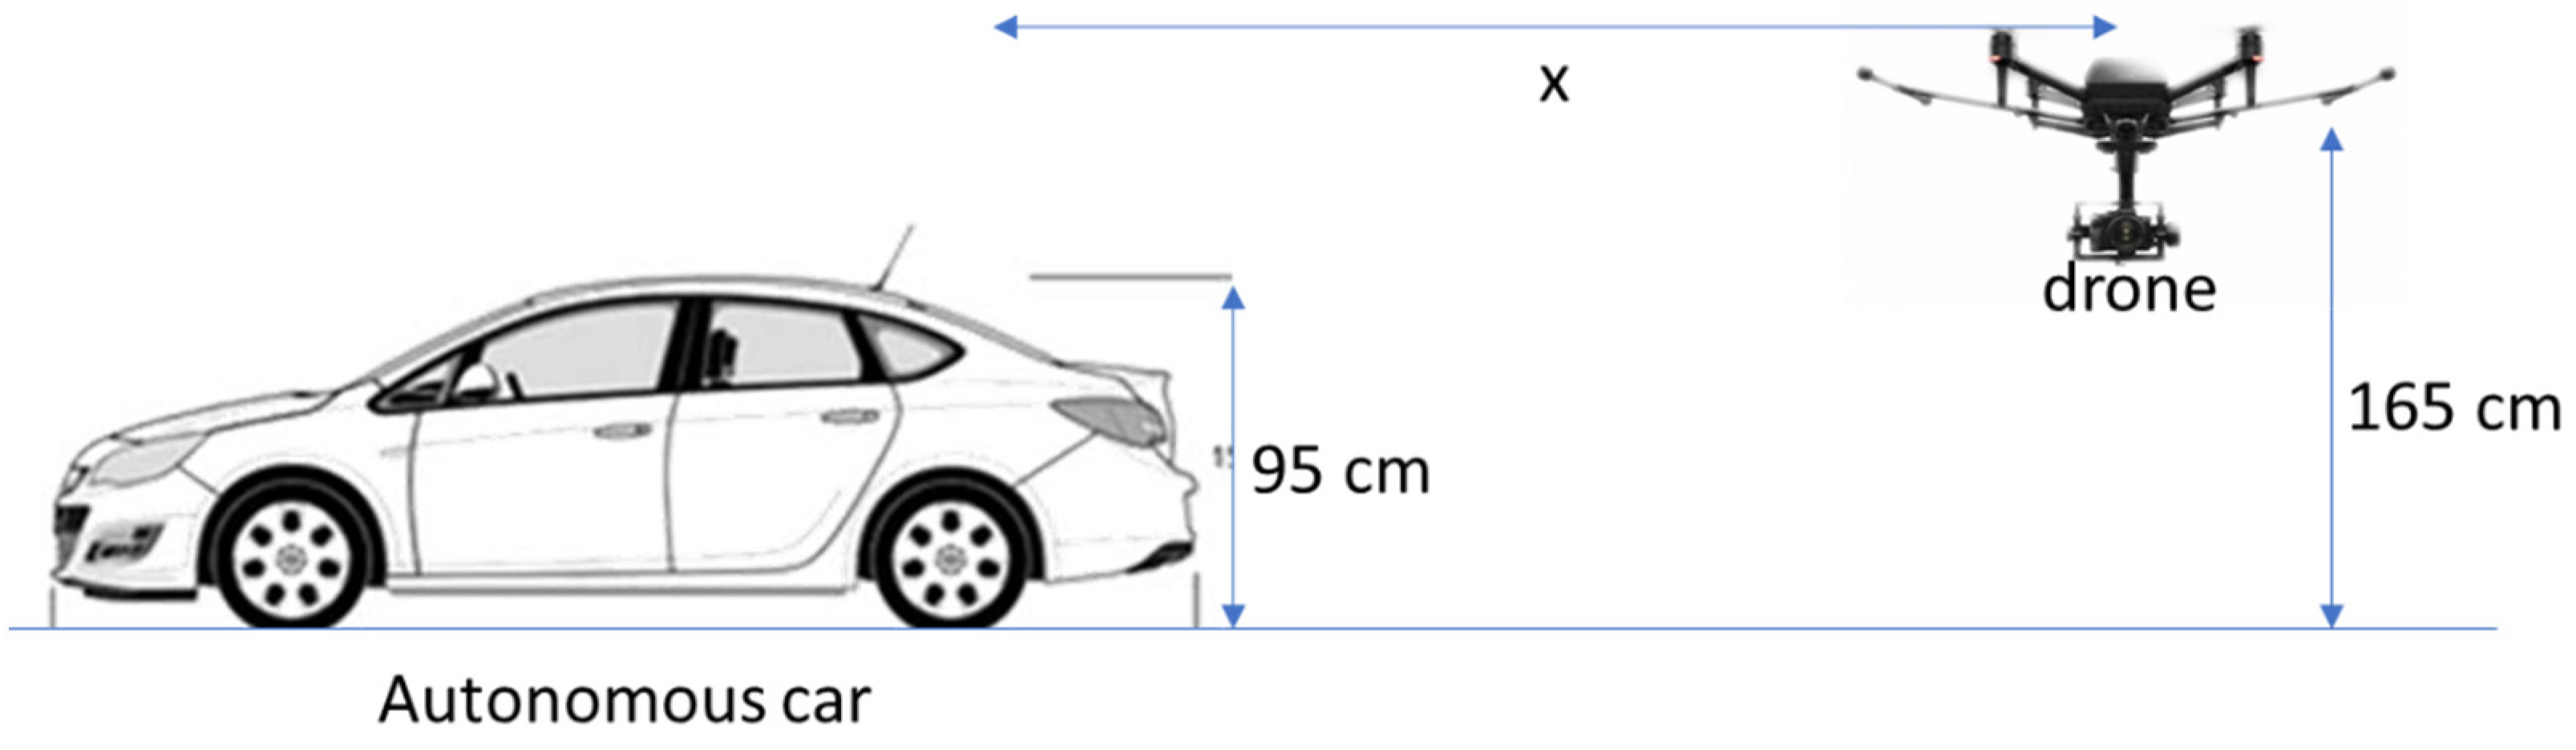
| Antenna Altitude Couples | Altitude Combinations (Tx/Rx) | Color Indicated in Graph |
|---|---|---|
| First Combination | Tx 45 cm/Rx 45 cm | Green |
| Second Combination | Tx 45 cm/Rx 95 cm | Red |
| Third Combination | Tx 45 cm/Rx 165 cm | Blue |
| Fourth Combination | Tx 95 cm/Rx 95 cm | Cyan |
| Fifth Combination | Tx 95 cm/Rx 165 cm | Magenta |
| Sixth Combination | Tx 165 cm/Rx 165 cm | Black |
| Transmitter Antenna Height (Tx cm) | 45 | 45 | 45 | 95 | 95 | 165 | ||
| Receiver Antenna Height (Rx cm) | 45 | 95 | 165 | 95 | 165 | 165 | ||
| Color on the Graphic | Green | Red | Blue | Light Blue | Purple | Black | ||
| Measurement Points | Range (Meter) | Elevation (Meter) | Receiver Signal Strength (RSSI) | |||||
| 1 | 116.25 | 1095.00 | −112 | −87 | −86 | −87 | −92 | −79 |
| 2 | 170.00 | 1097.00 | −115 | −97 | −92 | −89 | −86 | −88 |
| 3 | 236.40 | 1097.00 | −116 | −93 | −91 | −95 | −90 | −95 |
| 4 | 418.09 | 1102.78 | −116 | −106 | −105 | −92 | −100 | −98 |
| 5 | 549.35 | 1106.26 | −116 | −118 | −122 | −112 | −110 | −114 |
| 6 | 624.21 | 1106.41 | −117 | −116 | −113 | −113 | −113 | −115 |
| 7 | 802.52 | 1111.02 | −116 | −127 | −126 | −121 | −118 | −112 |
| 8 | 873.09 | 1112.29 | −114 | −124 | −120 | −127 | −119 | −115 |
| 9 | 1079.70 | 1123.05 | −116 | −119 | −122 | −127 | −113 | −117 |
| 10 | 1272.53 | 1131.19 | −118 | −115 | −123 | −115 | −119 | −126 |
| 11 | 1500.00 | 1147.00 | −120 | −120 | −124 | −120 | −120 | −123 |
| 12 | 1602.08 | 1147.60 | −122 | −122 | −125 | −124 | −122 | −125 |
| 13 | 1708.60 | 1160.56 | −124 | −124 | −126 | −126 | −125 | −126 |
| 14 | 1807.78 | 1169.41 | −126 | −126 | −127 | −127 | −127 | −127 |
| 15 | 1899.68 | 1166.99 | −128 | −128 | −128 | −128 | −128 | −128 |
Publisher’s Note: MDPI stays neutral with regard to jurisdictional claims in published maps and institutional affiliations. |
© 2021 by the authors. Licensee MDPI, Basel, Switzerland. This article is an open access article distributed under the terms and conditions of the Creative Commons Attribution (CC BY) license (https://creativecommons.org/licenses/by/4.0/).
Share and Cite
Yildiz, M.; Bilgiç, B.; Kale, U.; Rohács, D. Experimental Investigation of Communication Performance of Drones Used for Autonomous Car Track Tests. Sustainability 2021, 13, 5602. https://doi.org/10.3390/su13105602
Yildiz M, Bilgiç B, Kale U, Rohács D. Experimental Investigation of Communication Performance of Drones Used for Autonomous Car Track Tests. Sustainability. 2021; 13(10):5602. https://doi.org/10.3390/su13105602
Chicago/Turabian StyleYildiz, Melih, Burcu Bilgiç, Utku Kale, and Dániel Rohács. 2021. "Experimental Investigation of Communication Performance of Drones Used for Autonomous Car Track Tests" Sustainability 13, no. 10: 5602. https://doi.org/10.3390/su13105602
APA StyleYildiz, M., Bilgiç, B., Kale, U., & Rohács, D. (2021). Experimental Investigation of Communication Performance of Drones Used for Autonomous Car Track Tests. Sustainability, 13(10), 5602. https://doi.org/10.3390/su13105602