Article

Modeling and Estimating Host Country Values in International Projects to Facilitate In-Country Value Creation

CentraleSupélec, Laboratoire Genie Industriel, Université Paris-Saclay, 3 Rue Joliot-Curie, 91190 Gif-sur-Yvette, France
*
Author to whom correspondence should be addressed.
Sustainability 2021, 13(10), 5592; https://doi.org/10.3390/su13105592
Submission received: 30 March 2021 / Revised: 4 May 2021 / Accepted: 10 May 2021 / Published: 17 May 2021

Abstract

:
International companies are more and more seeking to act proactively by proposing In-Country Value (ICV) strategies to create sustainable local values in the host countries in which they carry out projects. Still, such sustainable local values are complex to identify because they are often indirectly related to their own value chains, project activities, and outcomes. There are, therefore, both theoretical and industrial needs to model and estimate sustainable values brought by complex projects in host countries, considering direct and indirect effects. In this paper, a systems thinking-based approach combined with a frequency analysis first permitted to build up a model of the sustainable values created by the project in a host country. Then, after underlining the complexity of such a model, a Domain Mapping Matrix (DMM) approach was proposed to help build a process to estimate project impacts in terms of ICV creation. An application to a case study built up with an industrial practitioner (an oil and gas company) permitted to test and validate the overall model and approach. It notably showed how such a model permitted to facilitate discussions among stakeholders and laid the foundations of ICV creation-oriented decision-making processes.

1. Introduction: From the Concept of Local Content to That of In-Country Value

Despite the wealth in natural resources of the countries in which some international companies operate (for instance, mining and extracting companies, oil and gas companies, and so on), these countries tend to have poorer economic performances than others. The phenomenon has been described by several researchers, calling it a resource curse [1,2,3]. Sachs and Warner notably proved a correlation between slow economic growth and natural resource wealth [4]. Other works showed that such countries tend to specialize in natural resources at the expense of other industries. This is a possible explanation for a lower investment into other activities such as education [5], even though it is one of the most important bases for local economic development. It is also true that the activities of such companies are generally isolated from other economic activities [6,7]. Host countries have, therefore, sought to strengthen the positive impact of mining, extracting, and oil and gas projects, fostering linkages with the rest of the economy [8,9], notably, to help foster industrialization and economic diversification [10,11].
Some countries decided to put in place measures to counteract this through the concept of Local Content (LC). At the origin of this concept, it must be noted that the role of firms then changed from the end of the 20th century [12]: the consideration of environmental, ethical, and social criteria in the actions of firms is now visible; the criterion of corporate performance is no longer only financial; and the company is expected to provide values to its stakeholders in a competitive environment. The concept of LC was developed to correspond to the set of local resources that a company uses or develops along its value chain when investing in a project in a host country [13,14,15,16]. Generally, it takes into account five attributes: purchases of goods and services from national suppliers, employment of local staff, support of local companies’ development, social investment, and induced employment effects [17]. To encourage LC, host countries have put in place contractual and legal requirements through local supply targets or penalty systems [18]. Those may relate to local production obligations expressed in tons, the percentage of local labor [19], the proportion of investment to be made in the host country, or other criteria [20]. LC measures aim at fostering linkages with local industries and generally seek to increase local employment and the contracting of goods and services to domestic suppliers in the oil value chain, with or without incentives [21]. In addition to these collaborations and ethical values, companies also have a willingness to invest in LC. Indeed, it can create opportunities for the company’s projects, such as reducing procurement or saving money in terms of salaries of local staff, compared with expatriate workers with the same level of skill [22]. Still, LC is more and more recognized as insufficient to create sustainable local values in host countries for several reasons. First, LC measures often focus on the short term, when workers are trained to meet the high demand for activity, which often leads to a loss of skills of trained people who are no longer active [23]. Second, companies and governments often tend to prioritize visible actions that have an impact on communication instead of focusing on critical but less visible actions such as basic education skills. Finally, LC can be the source of an increase in inequalities between local communities and territories within the same country, with those geographically closer to the main location of the project often having considerably more advantage. This could even generate or accentuate social crises [24], which called for the emergence of a new vision, moving from Local Content to In-Country Value (ICV).
ICV activities are defined as activities, industrial or not, aimed at creating sustainable local value. These activities are within the competencies of companies. However, they are not necessarily located in their conventional value chain, which means that ICV encompasses LC but is not limited to it [25]. It also includes LC development actions (for instance, education and training in the company’s professions sector, capacity building for local firms within the same industrial sector, technology transfer, and so on) [26]. ICV also encompasses the shared use of goods and services with other sectors (for instance, the construction of a new road, which can be of benefit to local companies or communities; the oversizing of a power generation infrastructure to bring electricity not only to the company’s project infrastructures but also to local companies or communities, at a lower cost; and the oversizing of a water filtration plant to facilitate access to water for local companies or communities) [27]. Finally, ICV also includes investment into new value chains which have nothing to do with the industrial sector and usual activities of the companies but benefit local communities (for instance, developing agricultural activities and infrastructures to help local communities meet nutritional needs, investing in educational/healthcare organizations locally) [28].
The ICV concept, therefore, appears to be promising because it encompasses many more aspects than LC. It calls for a systemic redistribution of created values, a structural transformation of the economy, more social protection of local communities, and greater ecological sustainability [29]. It thus aims to catch the most promising local sustainable value creation opportunities, which can be directly or indirectly brought by a company’s project in a host country. However, the ICV concept also appears to be a complex one with multiple induced effects and multiple scales and horizons. Despite this complexity, the objective for an international company is to put in place an ICV process that allows recommending the best win-win strategies, with maximal value creation for both the company and the host country. To achieve this, a company must be able to identify and estimate the different local value creation possibilities in connection with the projects it carries out in the host country and implement them with full transparency [30].
However, the ICV concept is still emerging and has received little attention in the literature. This paper aimed at addressing three research questions to encompass several aspects of the project ICV creation’s process:
  • What are the multiple dimensions of ICV, and how can they be modeled?
  • What are the different steps of the project ICV creation process, and how can it be modeled in a way that integrates multiple dimensions, as identified in Question 1?
  • To what extent can such a model be practically implemented for industrial applications?
To answer these questions, this paper proposed an original approach that permitted the continuation of such an ICV definition process with two significant results. The first one was the proposal of an ICV description model, thus enabling any company to identify and describe potential sustainable value creation indicators in host countries. The second one was an approach based on Domain Mapping Matrices (DMMs), which helped to estimate the extent to which these In-Country Values were created when carrying out a project in a host country, therefore helping managers to identify the most promising opportunities in terms of project ICV creation processes. After a section introducing a literature review addressing different areas that contributed to the aforementioned results, the following two sections presented the research methodology and the results obtained, respectively. These results were presented and discussed using a hybrid case study built up in collaboration with an oil and gas company. Finally, the overall conclusions and limitations were discussed in the Conclusions section.

2. Literature Review

2.1. Understanding Project ICV

2.1.1. Defining Project Sustainable Value

Historically, project value creation has often been reduced to the question of its success [31]. The definition of project success has drawn debate in itself [32], and the project iron triangle standard (time, cost, and scope) was notably used for project success and value creation measurement [33]. Understanding that this was not enough to encompass all the aspects of project value creation, researchers and industrial practitioners then started to point out that taking stakeholders into account was necessary [34]. Project value could therefore be defined as the actual level of a project’s achievement in terms of how much a project satisfies its stakeholders’ expectations and acknowledges their constraints [35].
The involvement of stakeholders through their diversity and possibly divergent interests permits understanding value as a multi-dimensional parameter [36,37], which is difficult to manage. Due to the complexity of any project environment, project value creation can be altered by indirect or induced effects, which can impact multiple stakeholders at different levels and time horizons [38].
As stated in [39], “the concept of sustainable project management is still in its infancy”, making the research field about project sustainable value creation even more recent. Some notable works [40,41,42,43,44] underlined that a project’s sustainable value creation model shall encompass the study of the project’s impacts on its multiple stakeholders in terms of sustainability. Indicators were identified or constructed to measure quantitatively or qualitatively project impacts and effects in terms of sustainability in the short term and the long term [45]. For instance, stakeholder objectives and preferences could be used to characterize sustainable values through the construction of indicators [46]. As a whole, sustainability was finally taken into account by adding sustainable dimensions to the usual performance indicators of a project [47,48].
As attempts to include sustainability indicators in project value definition have become more and more numerous, the list of stakeholders to be considered has become more considerable as well, which complicated the task of project managers [49]. Even though coordination among stakeholders regarding this issue increased [50], there is still a lack of consensus about the aspects and indicators of sustainability that should be incorporated in a project value creation description process [51]. This is all the truer when dealing with the creation of sustainable values in the context of ICV [28].

2.1.2. Characteristics of Project ICV and Implications

Despite this lack of consensus on a commonly used framework, it is possible to bring out determinants of project sustainable value creation through a deeper analysis of the literature. To identify the characteristics of ICV, a literature review was conducted over the 2000–2020 period using the Web of Science databases. Ten keyword sets were associated with the research process: ““project value” and sustainable/bility”, ““sustainable value” and project”, ““local content” and sustainable/bility”, “”in-country value” and sustainable/bility”, “project and local/sustainable and “value creation””. Among identified articles, attention was particularly being paid to those addressing sustainable value creation in the context of international projects with multiple stakeholders, so their conclusions could directly or easily be extended to the concept of ICV. This process permitted to identify four characteristics of sustainable values created by international projects, and thus ICV:
  • They responded to a present and/or met a future need of the project/host country stakeholders [34,46,52,53,54].
  • They generated direct and indirect positive effects for the project/host country stakeholders [45,55,56,57,58]
  • They could be captured and retained by the project/host country stakeholders [48,59,60,61,62]
  • They had measurable impacts on multiple dimensions [36,47,63,64,65].
The identification of these characteristics underlined different aspects of the project ICV creation process. First, there were undoubtedly multiple potential value components for international projects led in host countries through the impacts they had on their multiple and diverse stakeholders. Such impacts were often interconnected through the interdependencies between the different stakeholders within the host country. Moreover, they had implications over different time horizons due to the evolution of the contexts of the project, of the stakeholders, and of the host country. As a whole, because of the multiplicity of its components, the nature of their interactions, and their dynamic behavior, project ICV creation had all the characteristics of a complex phenomenon [66]. Complexity was widely studied in the literature [67,68], and the study of such complex phenomena most often required a holistic vision through the use of systems thinking-based approaches [69,70,71].

2.2. Using a Systems Approach to Model ICV

2.2.1. Complex Systems Modeling

Systems thinking has been developed from the end of the 1950s/early 1960s [72,73,74,75] and researchers kept on refining the theory and related approaches [76,77,78]. Systems thinking permits to apprehend complex phenomena through the establishment of models which are a representation of the real world [69]. Such models are, therefore, limited representations of a complex reality but permit to have a better understanding of complex phenomena and their dynamics [79]. The objective of systems thinking-based approaches is then to translate a complex phenomenon or system into a communicable model which shares the characteristics of the phenomenon/system. In the case of this study, these characteristics were identified in Section 2.1.2. To do so, recent works identified that any model about a complex phenomenon or system should encompass four dimensions [80,81,82,83]:
1.
Teleological dimension: The model should integrate/study the objectives underlying the phenomenon/system, these objectives being driven by the relationships between the phenomenon/system and its environment (including stakeholders).
2.
Functional dimension: The model should integrate/study the activities carried out by the system or attached to the phenomenon and associate them with their impacts on the elements of the teleological dimension.
3.
Ontological dimension: The model should integrate/study the constituting elements of the phenomenon/system that permit to carry out the activities of the elements of the functional dimension.
4.
Genetic dimension: The model (and therefore its elements) should be able to evolve over time because the phenomenon/system is meant to evolve over time.

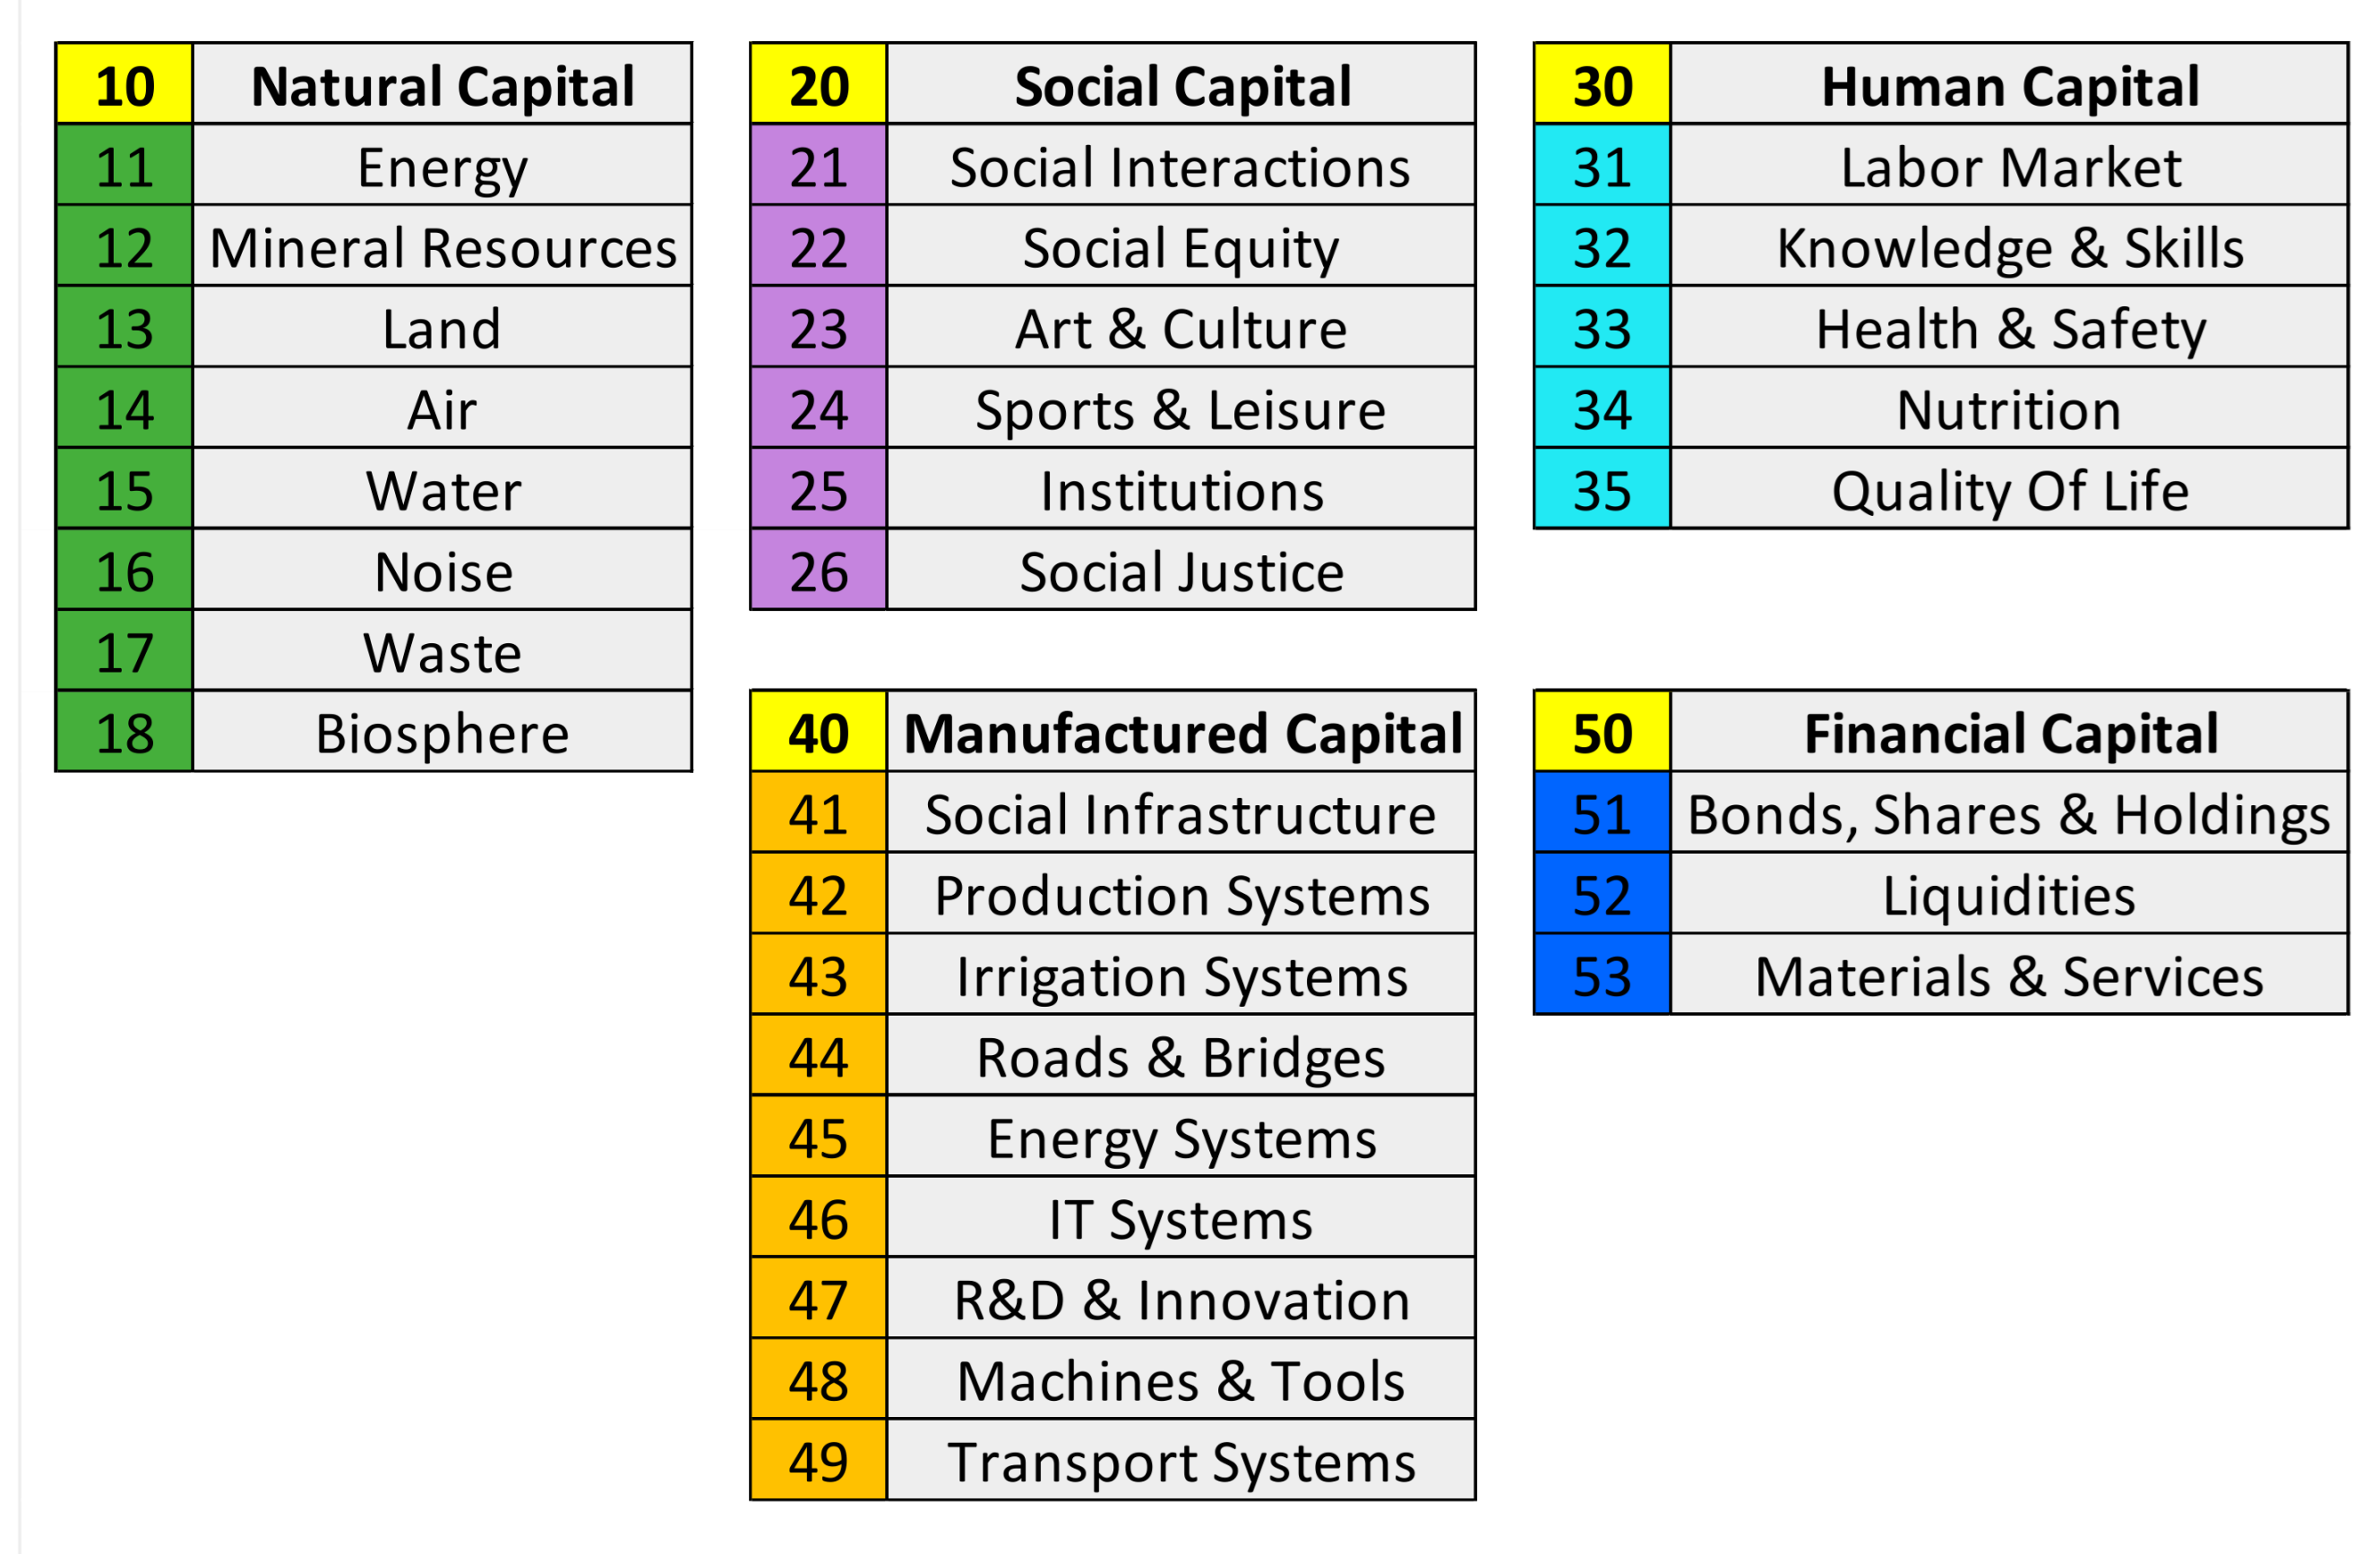
2.2.2. Describing ICV Dimensions with a Capital Stocks and Flows Model

Still, models developed using systems approaches do not stick to these dimensions only and are not structured around them. If these dimensions allow identifying the elements which should be integrated into the model and make sure that all the aspects of a phenomenon/system are encompassed, a second phase in the model development process goes through the identification of the practical dimensions of the addressed problem [84]. These new dimensions then generally become the principal dimensions of the model, under which all the identified elements are finally regrouped [85].
In the case of sustainable value creation, models based on capital stocks and flows approach have proved to be relevant in terms of situation analysis and communication [59,86,87,88]. For all practical purposes, such models consider that a stock, which is the result of an accumulation over time, can be considered as a capital stock if it contributes to well-being through the provision of goods and services. They consider that a capital flow can be defined as an exchange at a given moment from one capital stock to another (incoming flow when captured and retained by a capital stock, outgoing flow when created and exchanged by a capital stock). Five categories of capital stocks were often identified in the literature [59,89,90]:
1.
Natural capital: The stock of natural resources and ecosystems (geology, soils, air, water, living organisms, and so on) that are likely to produce valuable goods or services in the future [91,92].
2.
Social capital: The stock of resources embedded in social structures (cohesion of people, networks of relationships, shared norms, values, and so on) that can be activated and enable societies to work effectively [93,94,95].
3.
Human capital: The stock of knowledge, skills, experience, and intelligence that can be used to raise product quality and improve labor efficiency [96,97].
4.
Manufactured capital: The stock of human-made assets (technological assets, energy stations, delivery systems, and so on) that permit to increase the accessibility to service and goods to people [98,99].
5.
Financial capital: The stock of economic and financial resources which can be mobilized by a country/region/area. [100].
These types of capital stocks have often been cited when dealing with sustainability and sustainable value creation. However, there is a lack of consensus on the elements and sub-capitals which constitute these capital stocks and on the flows which exist between them, which already calls for further study [101,102]. In addition, to the best of our knowledge, the problem of project ICV creation has never been modeled with such an approach, even though it is a specific sustainable-value-creation-type problem. This article here made the hypothesis that project ICV creation could be modeled with a capital stocks and flows approach and using as a basis the five types of capital stocks.

2.3. Using Domain Mapping Matrices to Model the Projet ICV Creation Process

2.3.1. Value Creation Estimation

The value creation process and its evaluation in the context of multiple and diverse stakeholders have been much discussed in the literature [59,103,104]. The number of potential evaluation indicators can be impressive, and the relationships between the involved capitals and sub-capitals are, therefore, likely to be complex.
Operationally, a certain number of local value creation processes may be identified with a potentially significant number of indicators to be assessed [105]. There may also be practical difficulties with the consistency between the different levels of detail required for the different indicators. For all these reasons, difficulties may arise during the implementation of such a complex evaluation process of value creation [106].

2.3.2. Dependency Structure Matrices (DSMs) and Domain Mapping Matrices (DMMs)

To address the complexity of the value creation process, many fields used Dependency Structure Matrices (DSMs) [107,108,109]. DSMs are used during the engineering design process as a compact way to represent and navigate across dependencies between the components of a product [110,111]. Their simplicity and operability permit to give a clear picture of the complexity of a system from an ontological point of view. Their use is not limited to design issues, and DSMs have been extended to multiple kinds of objects, for instance, risks [112,113] or stakeholders [114]. In particular, DSMs were also used in the context of sustainable development, for instance, to study industrial symbiosis deals with exchanges of flows between actors to optimize the sustainability of an industrial system [115].
However, Domain Mapping Matrices (DMMs) appeared to be even more promising in the case of this study. They were derived from the DSMs but permitted to link elements of different natures [116,117,118]. DMMs were, in particular, used in recent works to estimate value creation in different contexts when the value could be described as a set of indicators related to multiple domains [119,120,121]. They, therefore, seemed particularly adapted to modeling the project ICV creation process.

3. Methodology

The overall research process was divided into two main phases.

3.1. First Phase

  • The first phase of the research process was designed to validate the hypothesis that a capital stocks and flows model should be built up to represent the dimensions of ICV. The first phase, therefore, focused on Research Question 1 with the identification of the dimensions of ICV and their integration into a description model of ICV. To construct this model in the end, the following methodology steps were followed:
  • Sustainable value indicators possibly related to ICV were identified in the literature using the state of the art of Section 2.1.2. as well as institutional studies and reports over the same period of 2000–2020. In particular, several studies were issued by the UNIDO (United Nations Industrial Development Organization, [122,123,124,125,126]) and the World Bank [10]. References focusing on sustainability indicators, value modeling, and estimation, even in other contexts than project management, were also included in this step as long as they could permit to identify indicators that could be directly used, transposed, or easily adapted to the context of the project ICV [100,103,104,127,128,129]. With a total of 1763 articles, 8130 indicators were directly identified. They were included in the list of indicators as long as they were directly or indirectly related to one of the three dimensions of the project ICV creation process: teleological, functional, or ontological (to make sure that all the dimensions of the complex phenomenon were addressed).
  • Each of these indicators was then categorized in terms of nature, either as being part of a potential capital stock or being a flow between potential capital stocks, using the five categories of capitals presented in Section 2.2.2. Such a capital stocks and flows model could easily be adjusted with the deletion of some (sub-)capitals and/or integration of new ones, which permitted to validate the genetic dimension of such a model. Some of the indicators, which were close to one another, were gathered under the same common denomination. Other ones (494 indicators, i.e., 6.08%) were rejected at this stage because they could not be considered to be SMART (specific, measurable, assignable, realistic, time-related) [130,131]. These steps allowed to reduce the list to 6940 indicators.
  • The analysis of the resulting list of indicators permitted to create sub-capital stocks for each category of capital stocks by categorizing an indicator as a part of a (sub-)capital stock or as a flow between two (sub-)capitals. Based on the analysis of 1000 randomly chosen indicators, a first version of a capital stocks and flows model of project ICV was built up, using the corresponding breakdown of each of the five capitals into relevant sub-capitals.
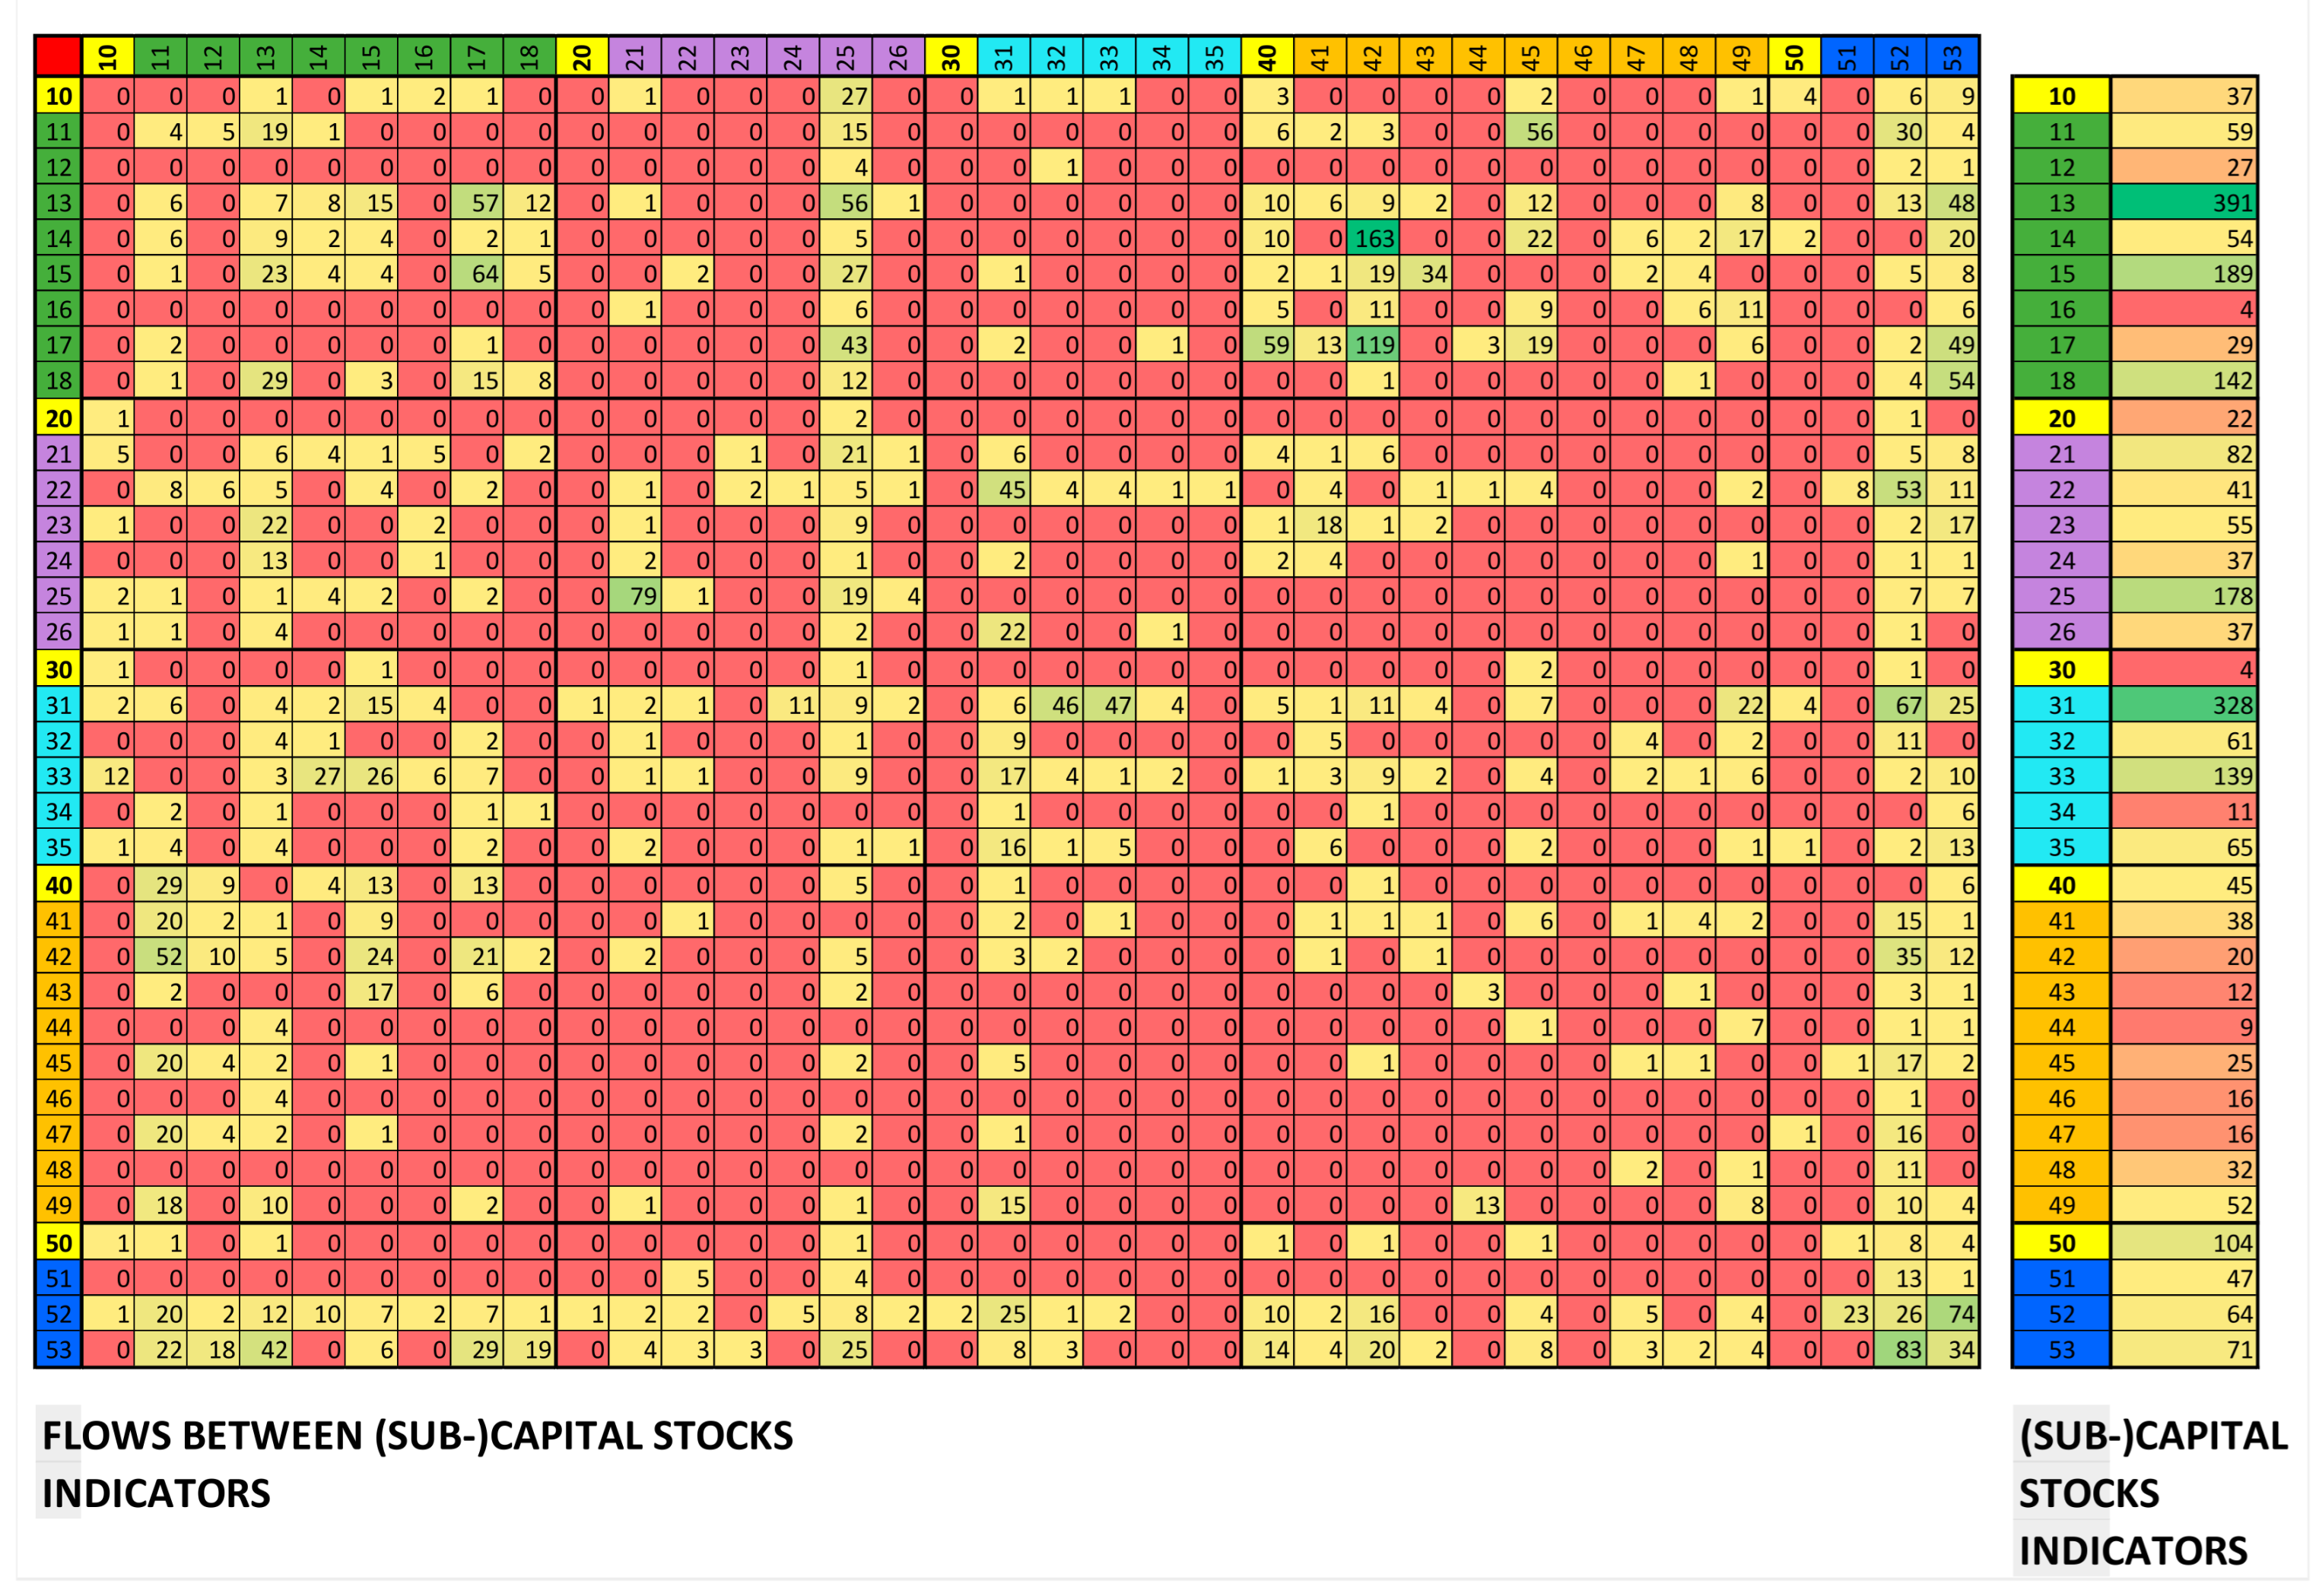
  • To validate this first version of the model and the list of sub-capitals, a frequency analysis was then conducted on the remaining 5940 indicators to study the extent to which the first version of the model permitted to include them. The number of times that each sub-capital and each flow between sub-capitals could be connected to an indicator was calculated to draw conclusions on the possible validation and refinement of the model.

3.2. Second Phase

The second phase of the research process was designed to construct the model that could permit to describe the successive steps of the project ICV creation process. The second phase, therefore, focused on Research Questions 2 and 3 with the description of the project ICV creation process, keeping in mind that such a model should be practically implemented for industrial applications. To do so, the following methodology steps were followed:
  • Using the capital stocks and flows model developed to model the dimensions of ICV, six domains were identified to describe the project ICV creation process with a DMM model.
  • The different matrices of the DMM model were then modeled to describe and assess the successive steps of the project ICV creation process.
  • The model was then tested and validated through its application to an industrial hybrid case study built up using the data of two projects in the oil and gas industry context.

4. Results and Discussion

4.1. Research Question 1: Building up an ICV Model

The 8130 identified indicators were categorized as indicators quantifying capital stocks or flows between capital stocks. A tracking system was set up to link groups of indicators to articles. As described in the Methodology Section, the list was reduced to 6490 indicators when grouping some indicators under the same common denomination. Furthermore, the denomination of some of the 8130 indicators made it ambiguous to categorize them as a capital stock or a flow one. This was notably the case when working on the list of indicators without going back to the specific context of each article. This phase focusing on the naming of indicators under common denominations was also the occasion to remove such ambiguities by comparing them or associating them to other indicators found in the literature.
Among these 6490 indicators, 1000 of them were randomly chosen to define a preliminary list of sub-capitals to be part of the project ICV creation capital stocks and flows model. For each of these selected indicators, new sub-capitals were created one after the other so that the indicators could be described as a measure of a sub-capital stock or as a flow between sub-capital stocks unless they could be categorized as such with pre-created sub-capitals. At this stage, 22 indicators (2.2%) could not be attached to a (sub-)capital stock or a flow between two (sub-)capital stocks, mainly because the actual phenomenon or system they measured was not sufficiently described or detailed in terms of accessibility and relevance of information (13 out of 22) or because they appeared to be only an aggregation of other indicators (9 out of 22). A first structure of the capital stocks description was then proposed (Figure 1) with a total of 5 capital stocks and 31 sub-capital stocks, which gave 362 = 1296 possibilities of flows.
Given the diversity of the fields of study, frameworks, and indicators, some difficulties had to be overcome. First, in terms of description, indicators sometimes had to be subdivided into several (sub-)capital stocks or flows between (sub-)capital stocks because these indicators were related to phenomena, which could be described, for instance, as a combination of several flows between different sub-capitals. A flagrant example concerns all the indicators related to eutrophication. Eutrophication can be described as the process by which minerals and nutrients accumulate in a natural environment (particularly a body of water), and that implies changes in some variables (such as pH) and, thus, impacts animal or plant living species as well as mineral species [132]. Eutrophication-related indicators were then broken down into several elementary flows in the proposed capital stocks and flows model; each of these subdivided flows was attributed a weight to avoid multiple counting of these indicators when performing the frequency analysis.
The 6490 indicators were then classified according to the preliminary structure of the capital stocks and flows model presented in Figure 1, each of the indicators being either a (sub-)capital stock indicator (SCI) or a flow between two (sub-)capital stocks indicator (FSCI), or an indicator which was impossible to categorize using the model. A frequency bibliometric analysis was then performed on this classification, the results of which are shown in Figure 2. Among the 6490 indicators, 2543 of them were SCIs (36.64%), and 3821 of them were FSCIs (55.06%). When having a closer look at SCIs in terms of bibliometrics, the most represented sub-capitals in the literature appeared to be N°13–Land (6.02%) and N°31–Labor Market (5.05%). Regarding FSCIs, the literature seemed to point out that flows originating from or converging towards a financial capital stock were the most numerous, which was undoubtedly due to the use of financial capital stocks as a means to facilitate movements of assets between other capitals [59].
Finally, only 126 indicators were uncategorized (1.94%; for the same reasons as the 22 rejected with 1000 randomly chosen indicators). Given the rates of classification using the model and given the fact that the non-categorization causes were independent of the model used, this frequency analysis validated the hypothesis to use such a capital stocks and flows model to encompass the dimensions of ICV in one model.
This model, therefore, allows to describe and categorize ICV indicators. The objective behind this description was not to study all the possible indicators identified during this study. Instead, it should be used by project managers and teams as a framework to identify and describe the opportunities for a project in terms of ICV creation within a host country. Indeed, given the representativity of this model, the identification of the local possibilities of ICV creation regarding the five capital stocks, thirty-one sub-capital stocks and flows between them, would permit to be quite exhaustive in the identification of possible opportunities. If such a systematic identification was already promising, being able to describe and evaluate the process according to which a given project creates ICV given its scope would be even more promising to facilitate discussions and make better decisions in collaboration with the host country. This was precisely the objective between Research Questions 2 and 3.

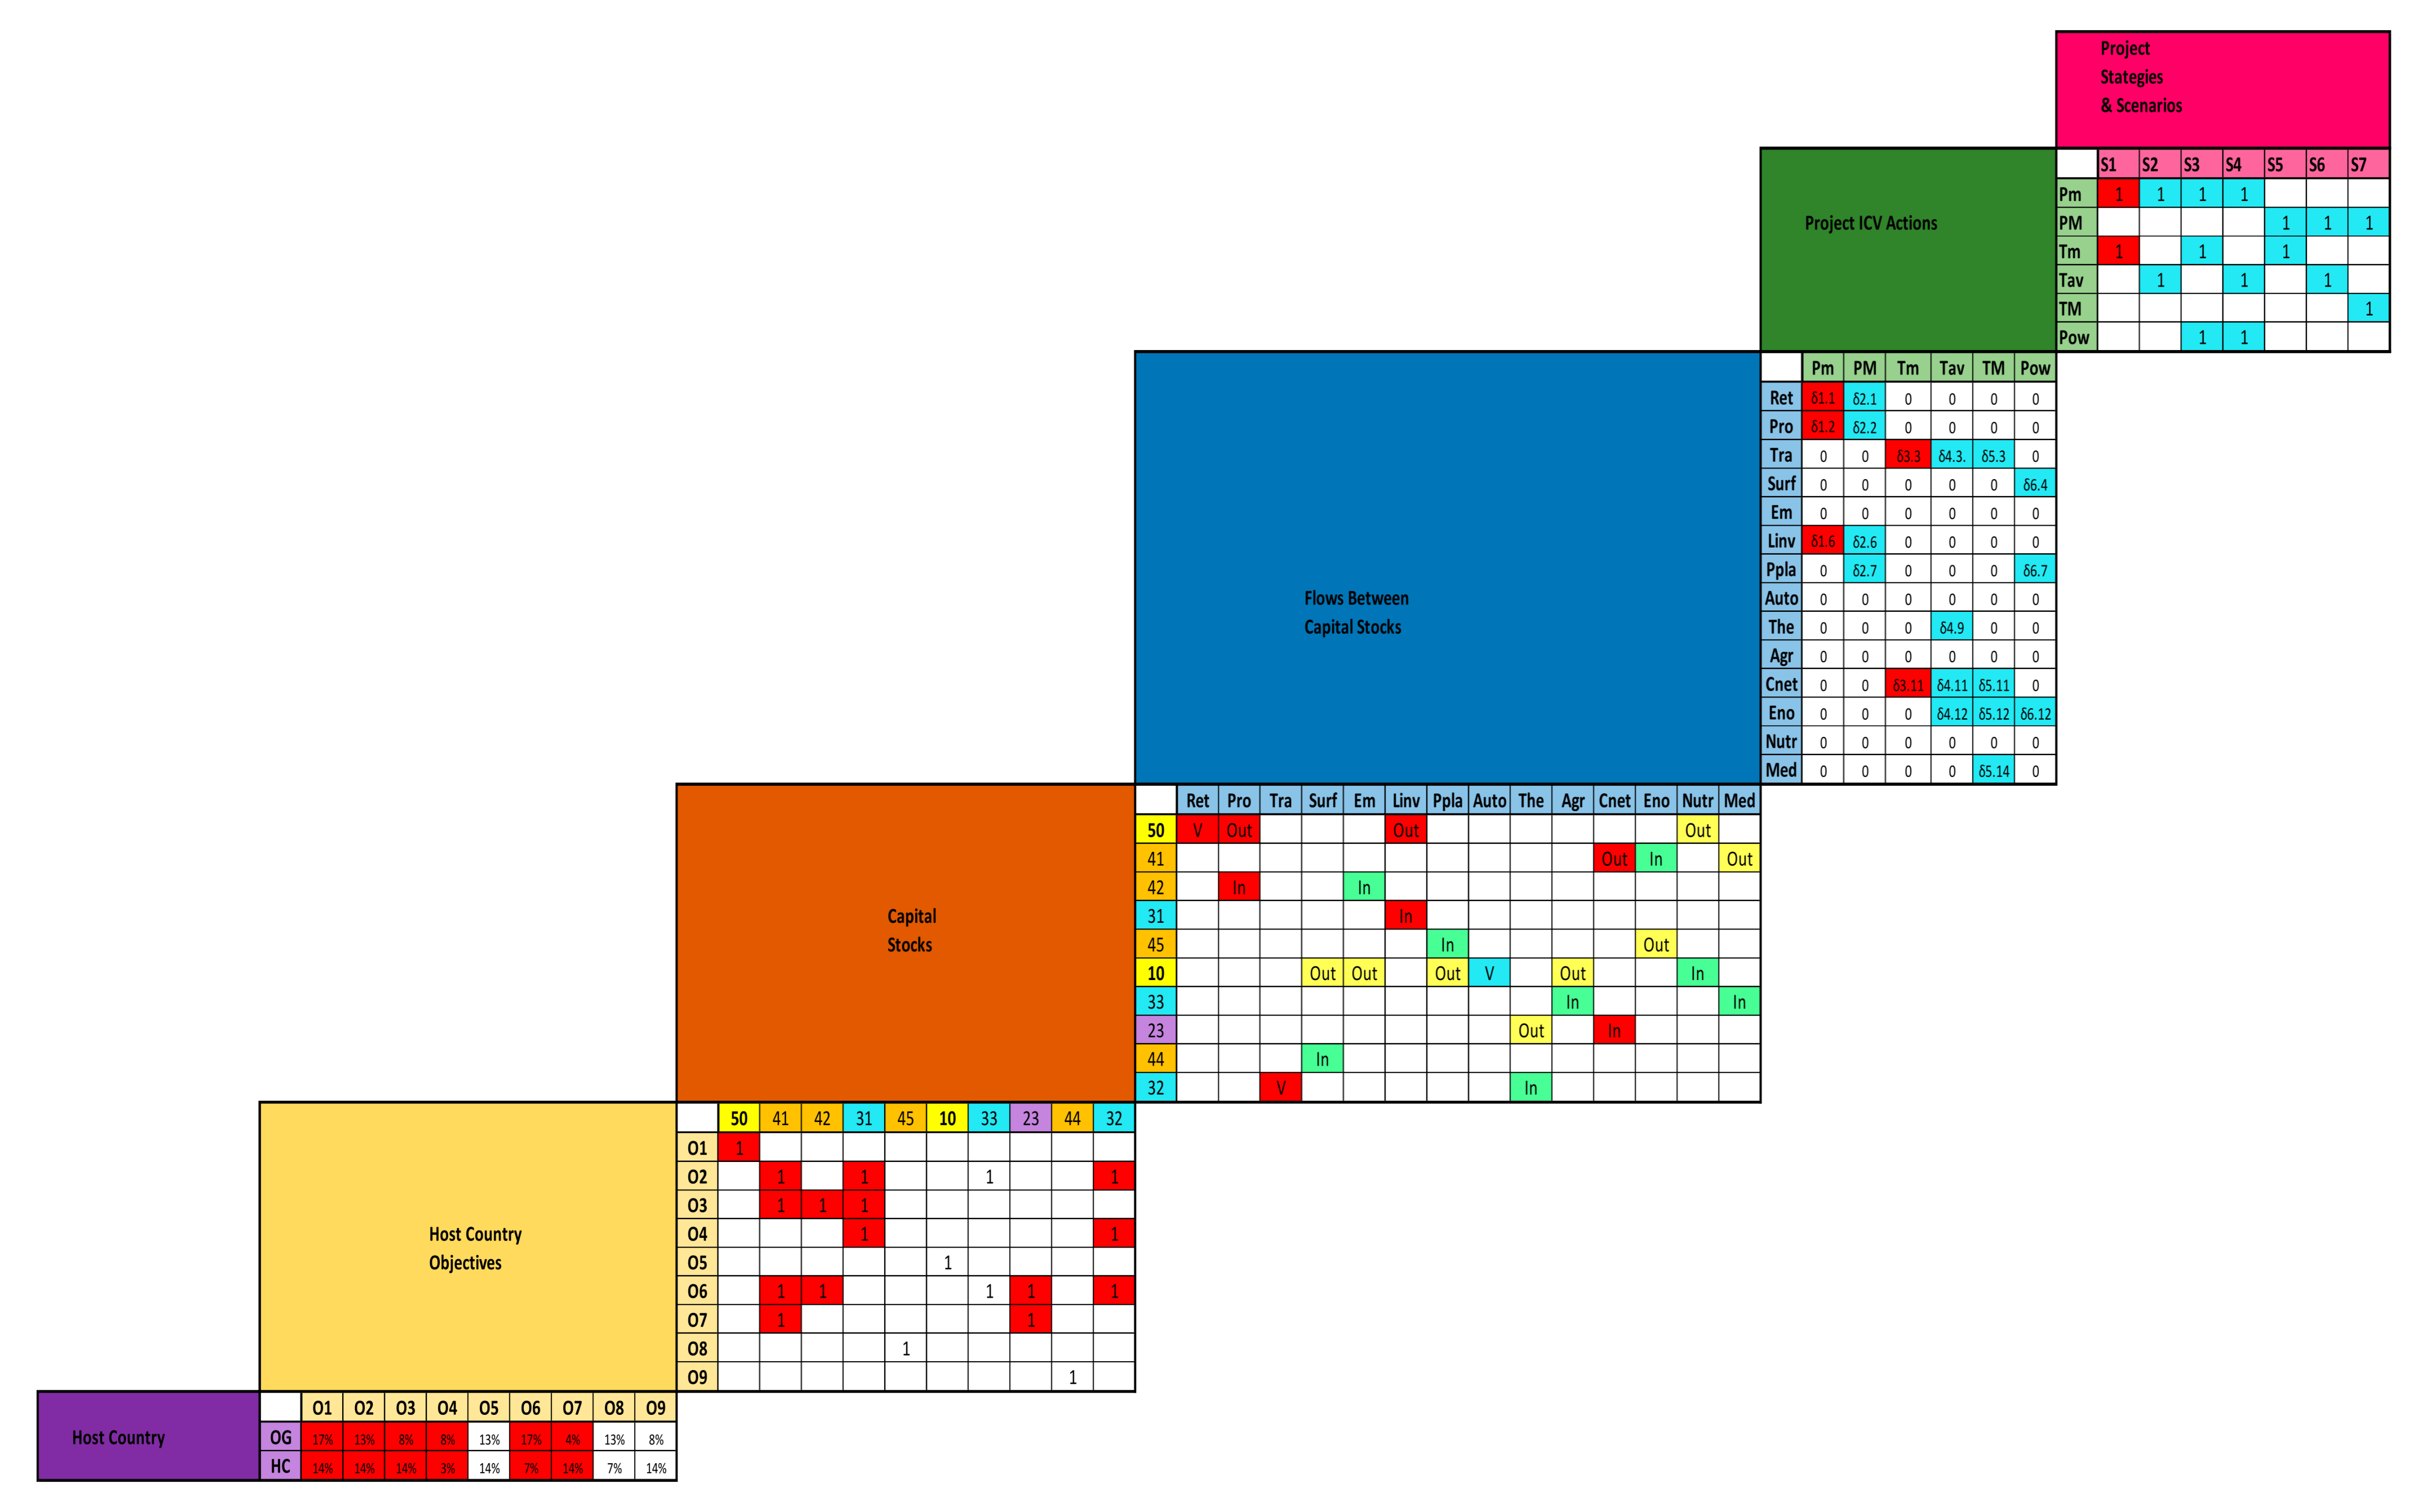
4.2. Research Question 2: Building Up a Project ICV Creation Process Model

The DMM (Domain Mapping Matrix) approach was applied to a set of 6 domains, which permitted to describe the process of project ICV creation and, in the end, assess the extent to which a given project generates In-Country Values in a host country:
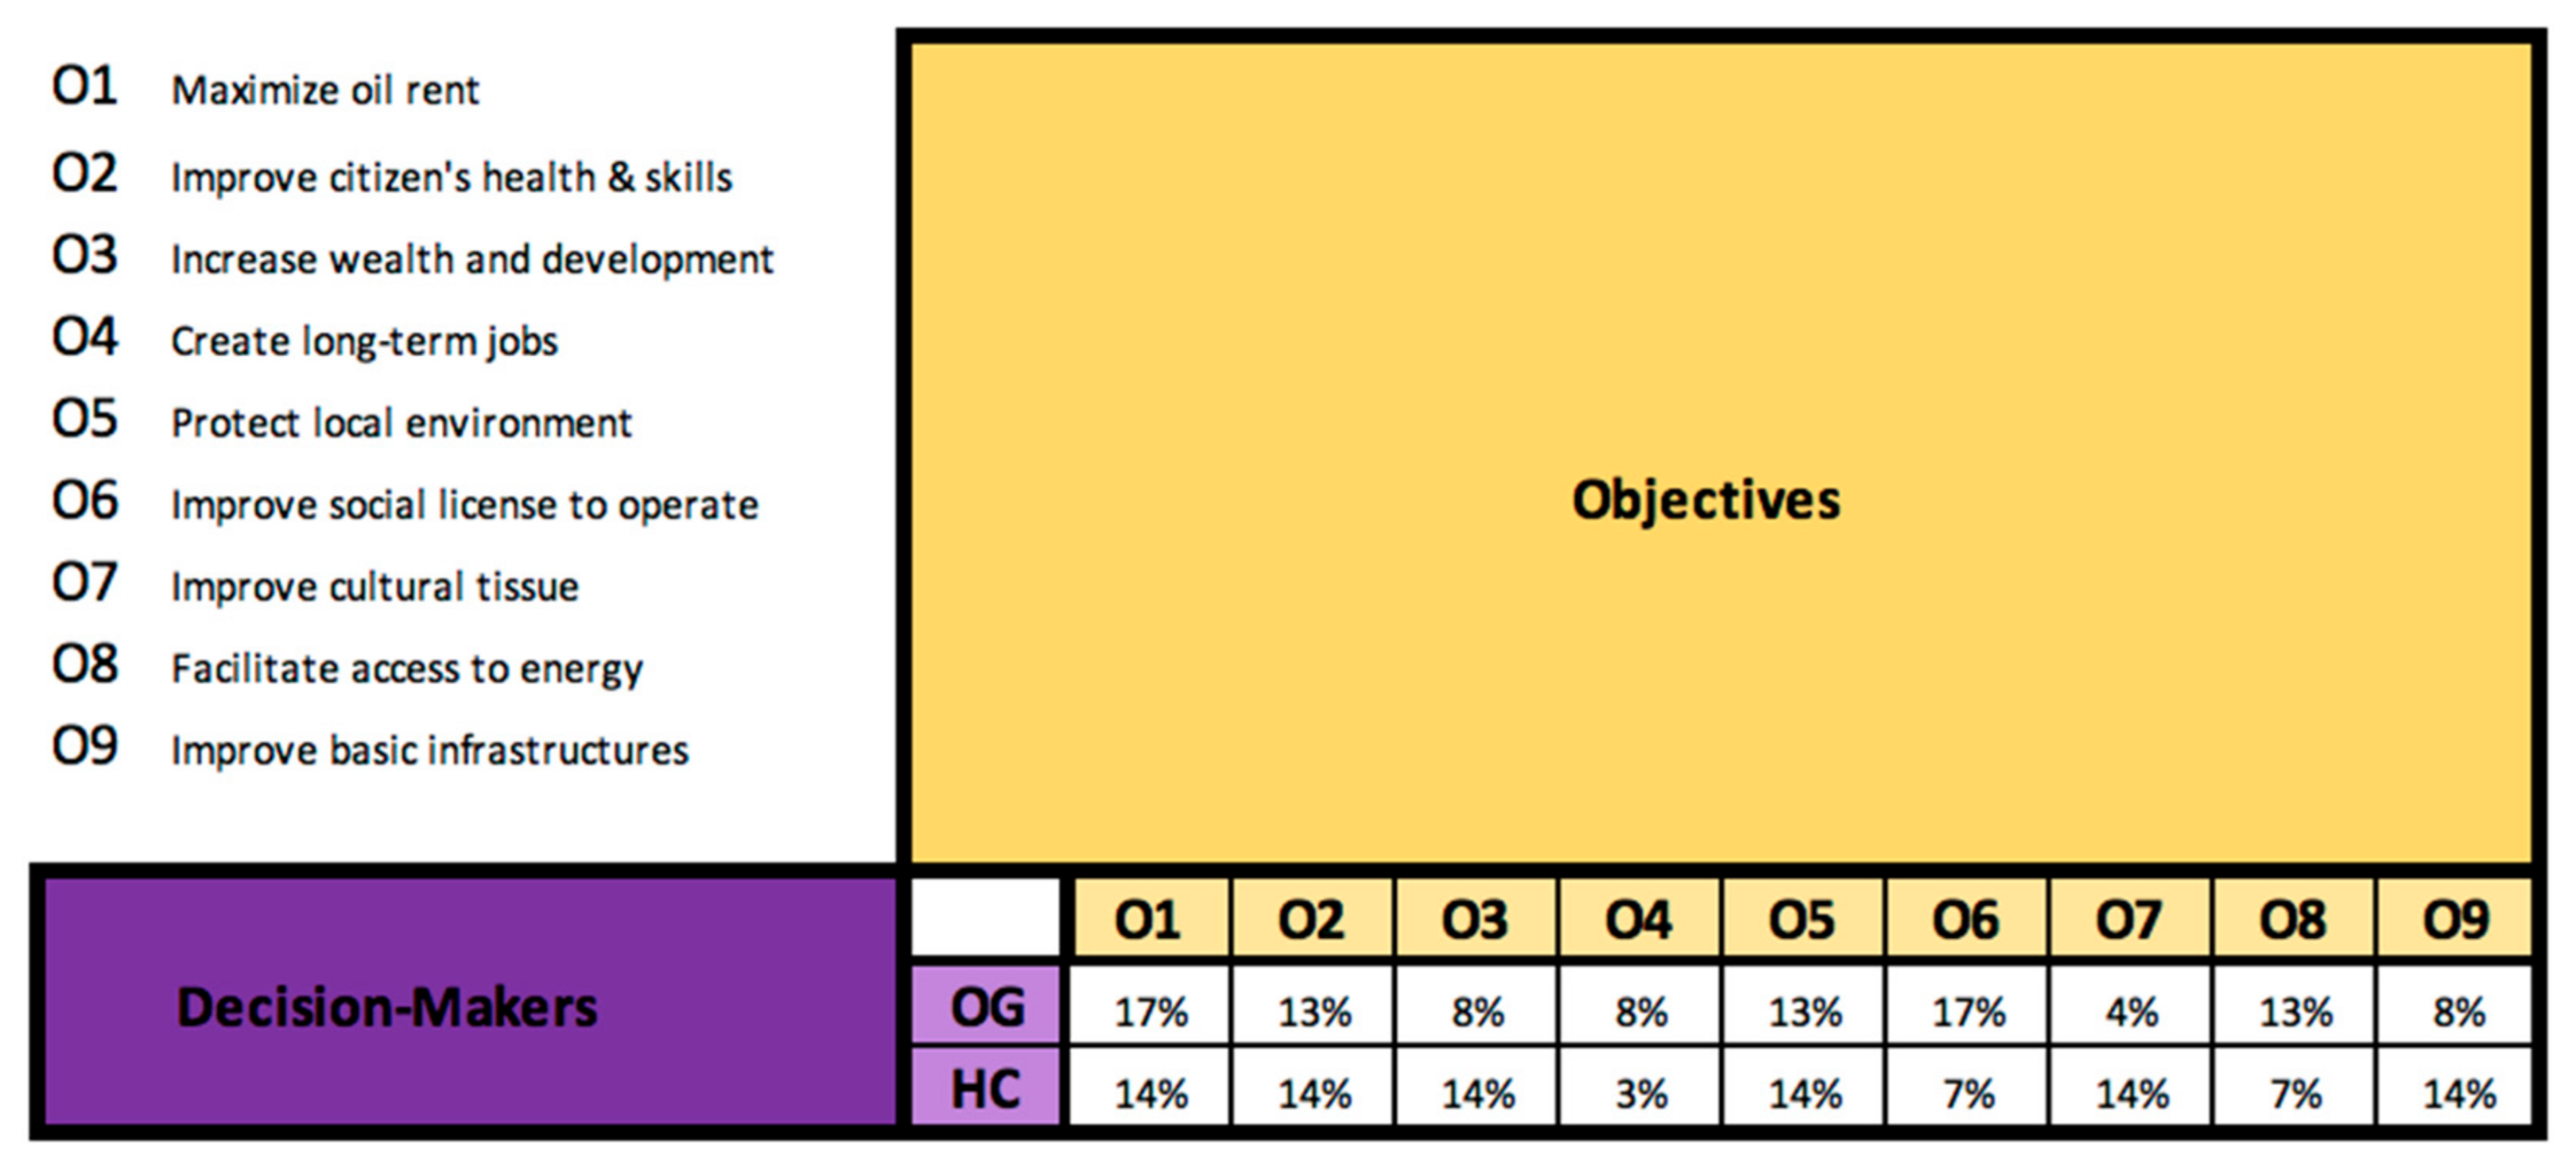
  • The Decision-Makers Domain (DM)—It represented the different decision-makers (at least two) involved in the decision. Even within the company or within the host country, there might be multiple decision-makers, which might, of course, complexify the capacity to converge and, thus, required to be considered.
  • The Objectives Domain (O)– It represented the dimensions on which the decision-makers measured the creation of value provided by ICV actions [133,134].
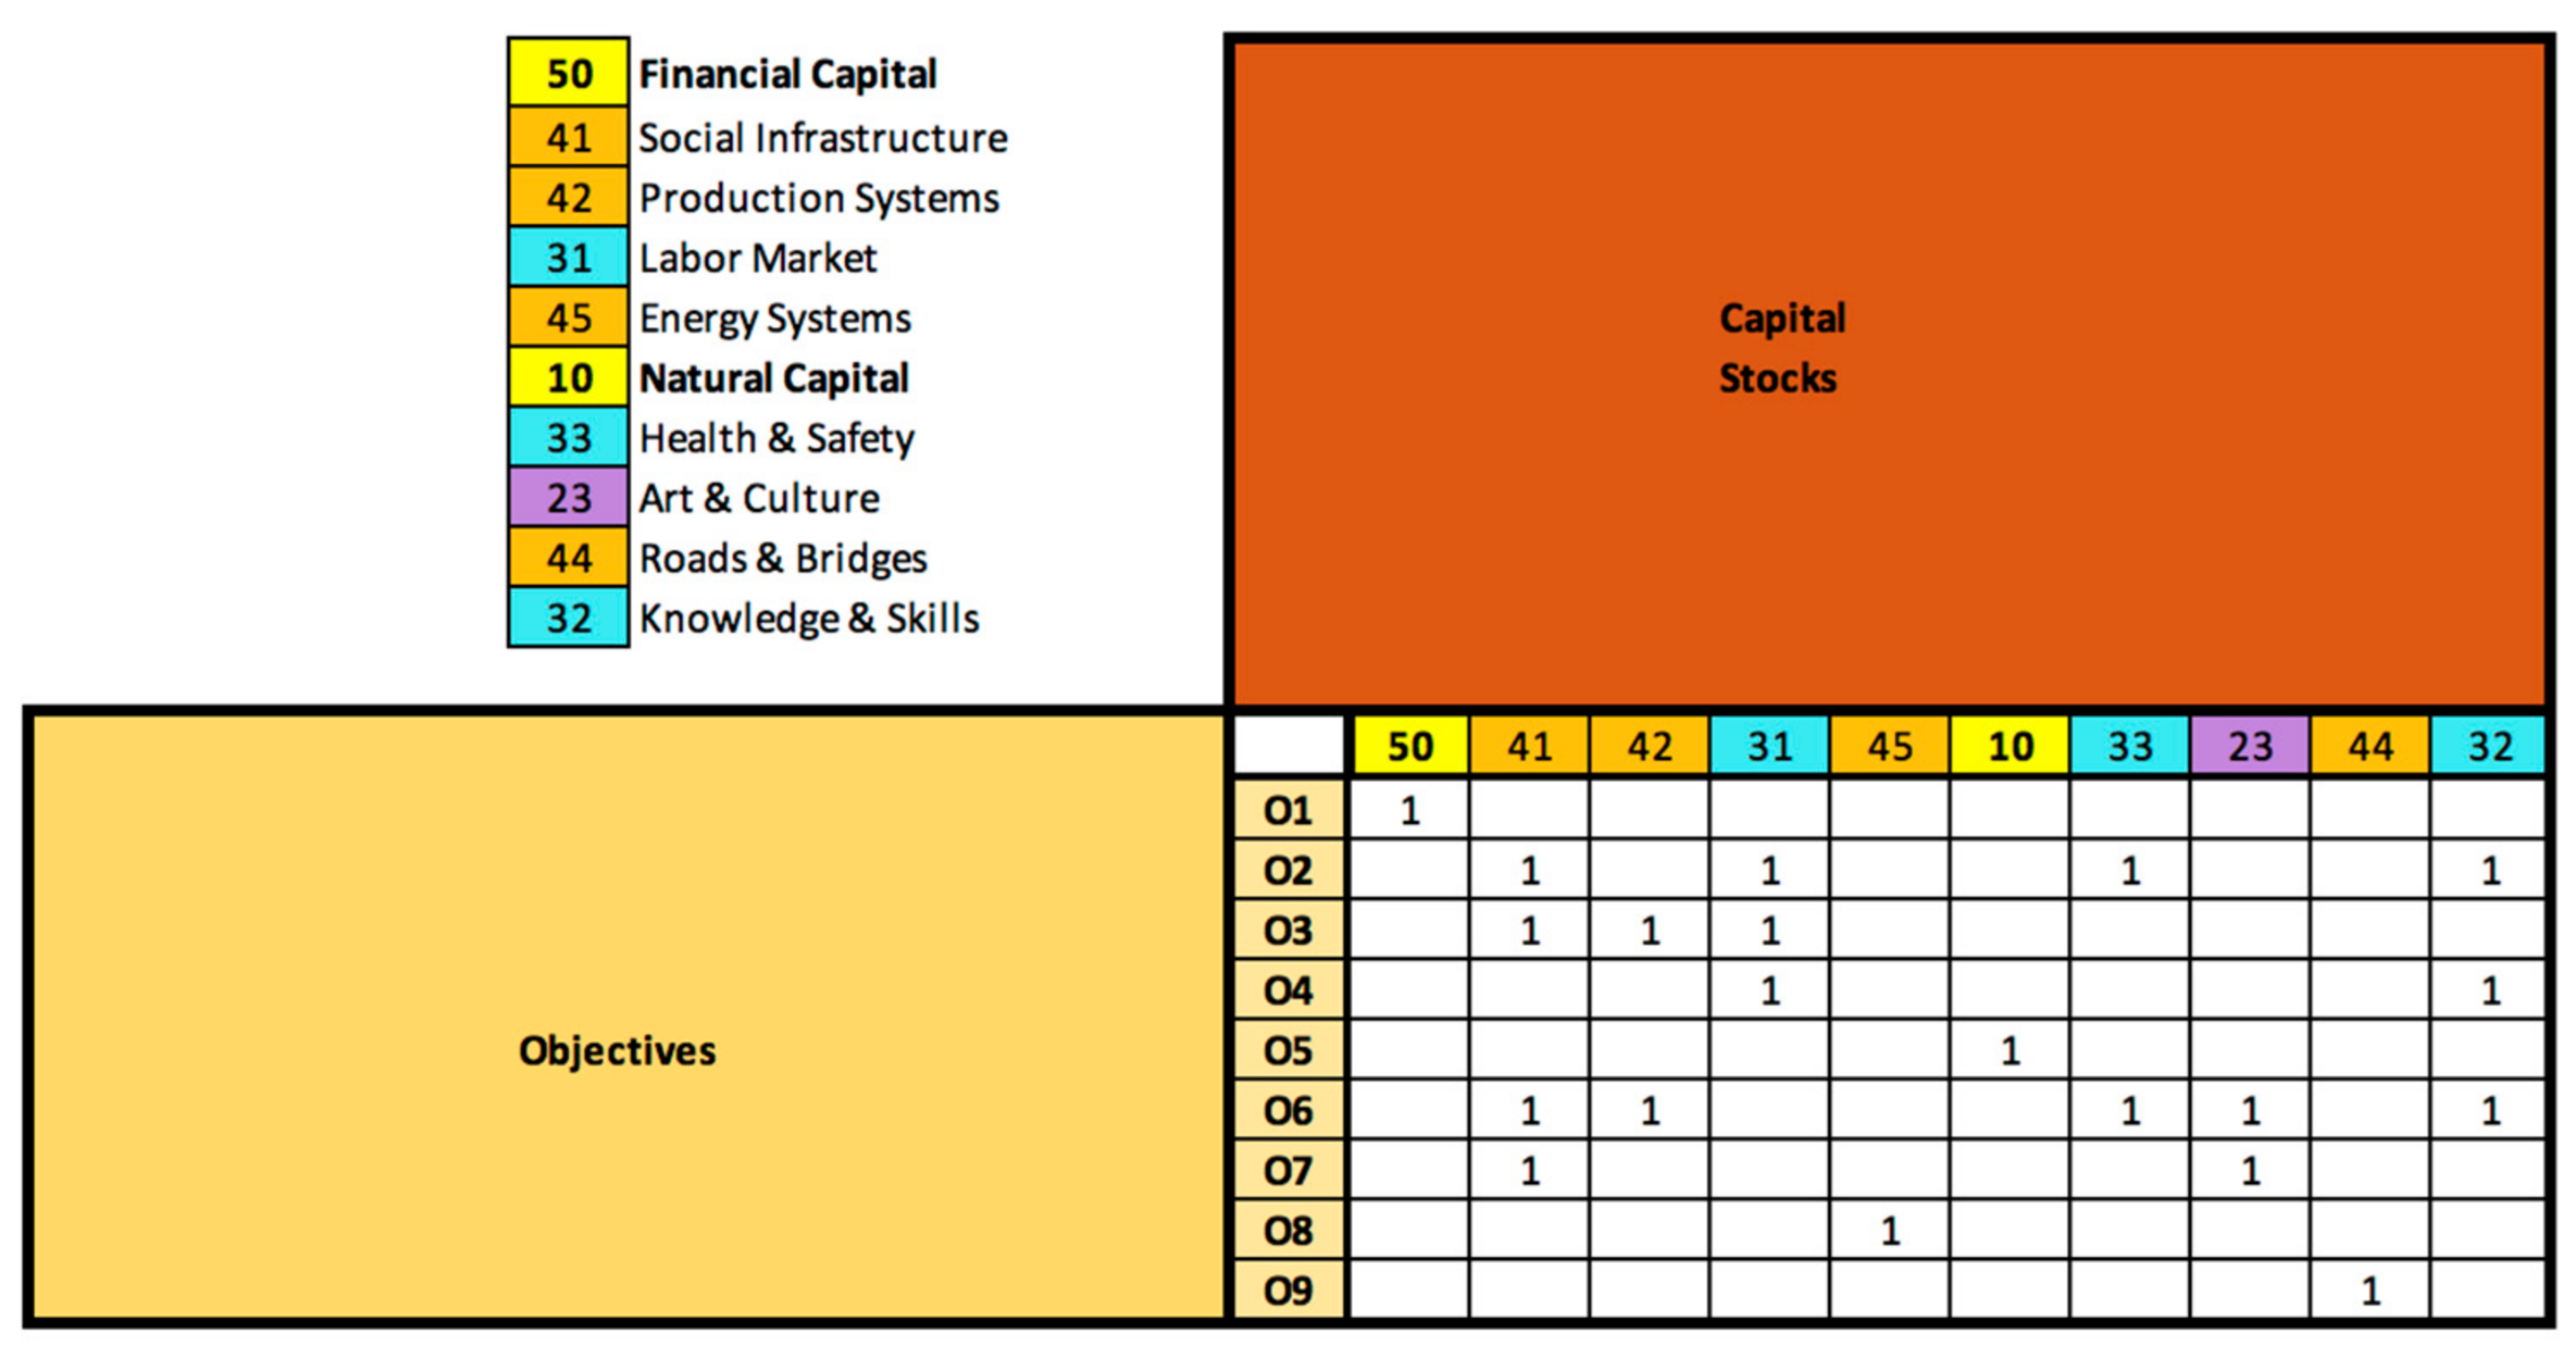
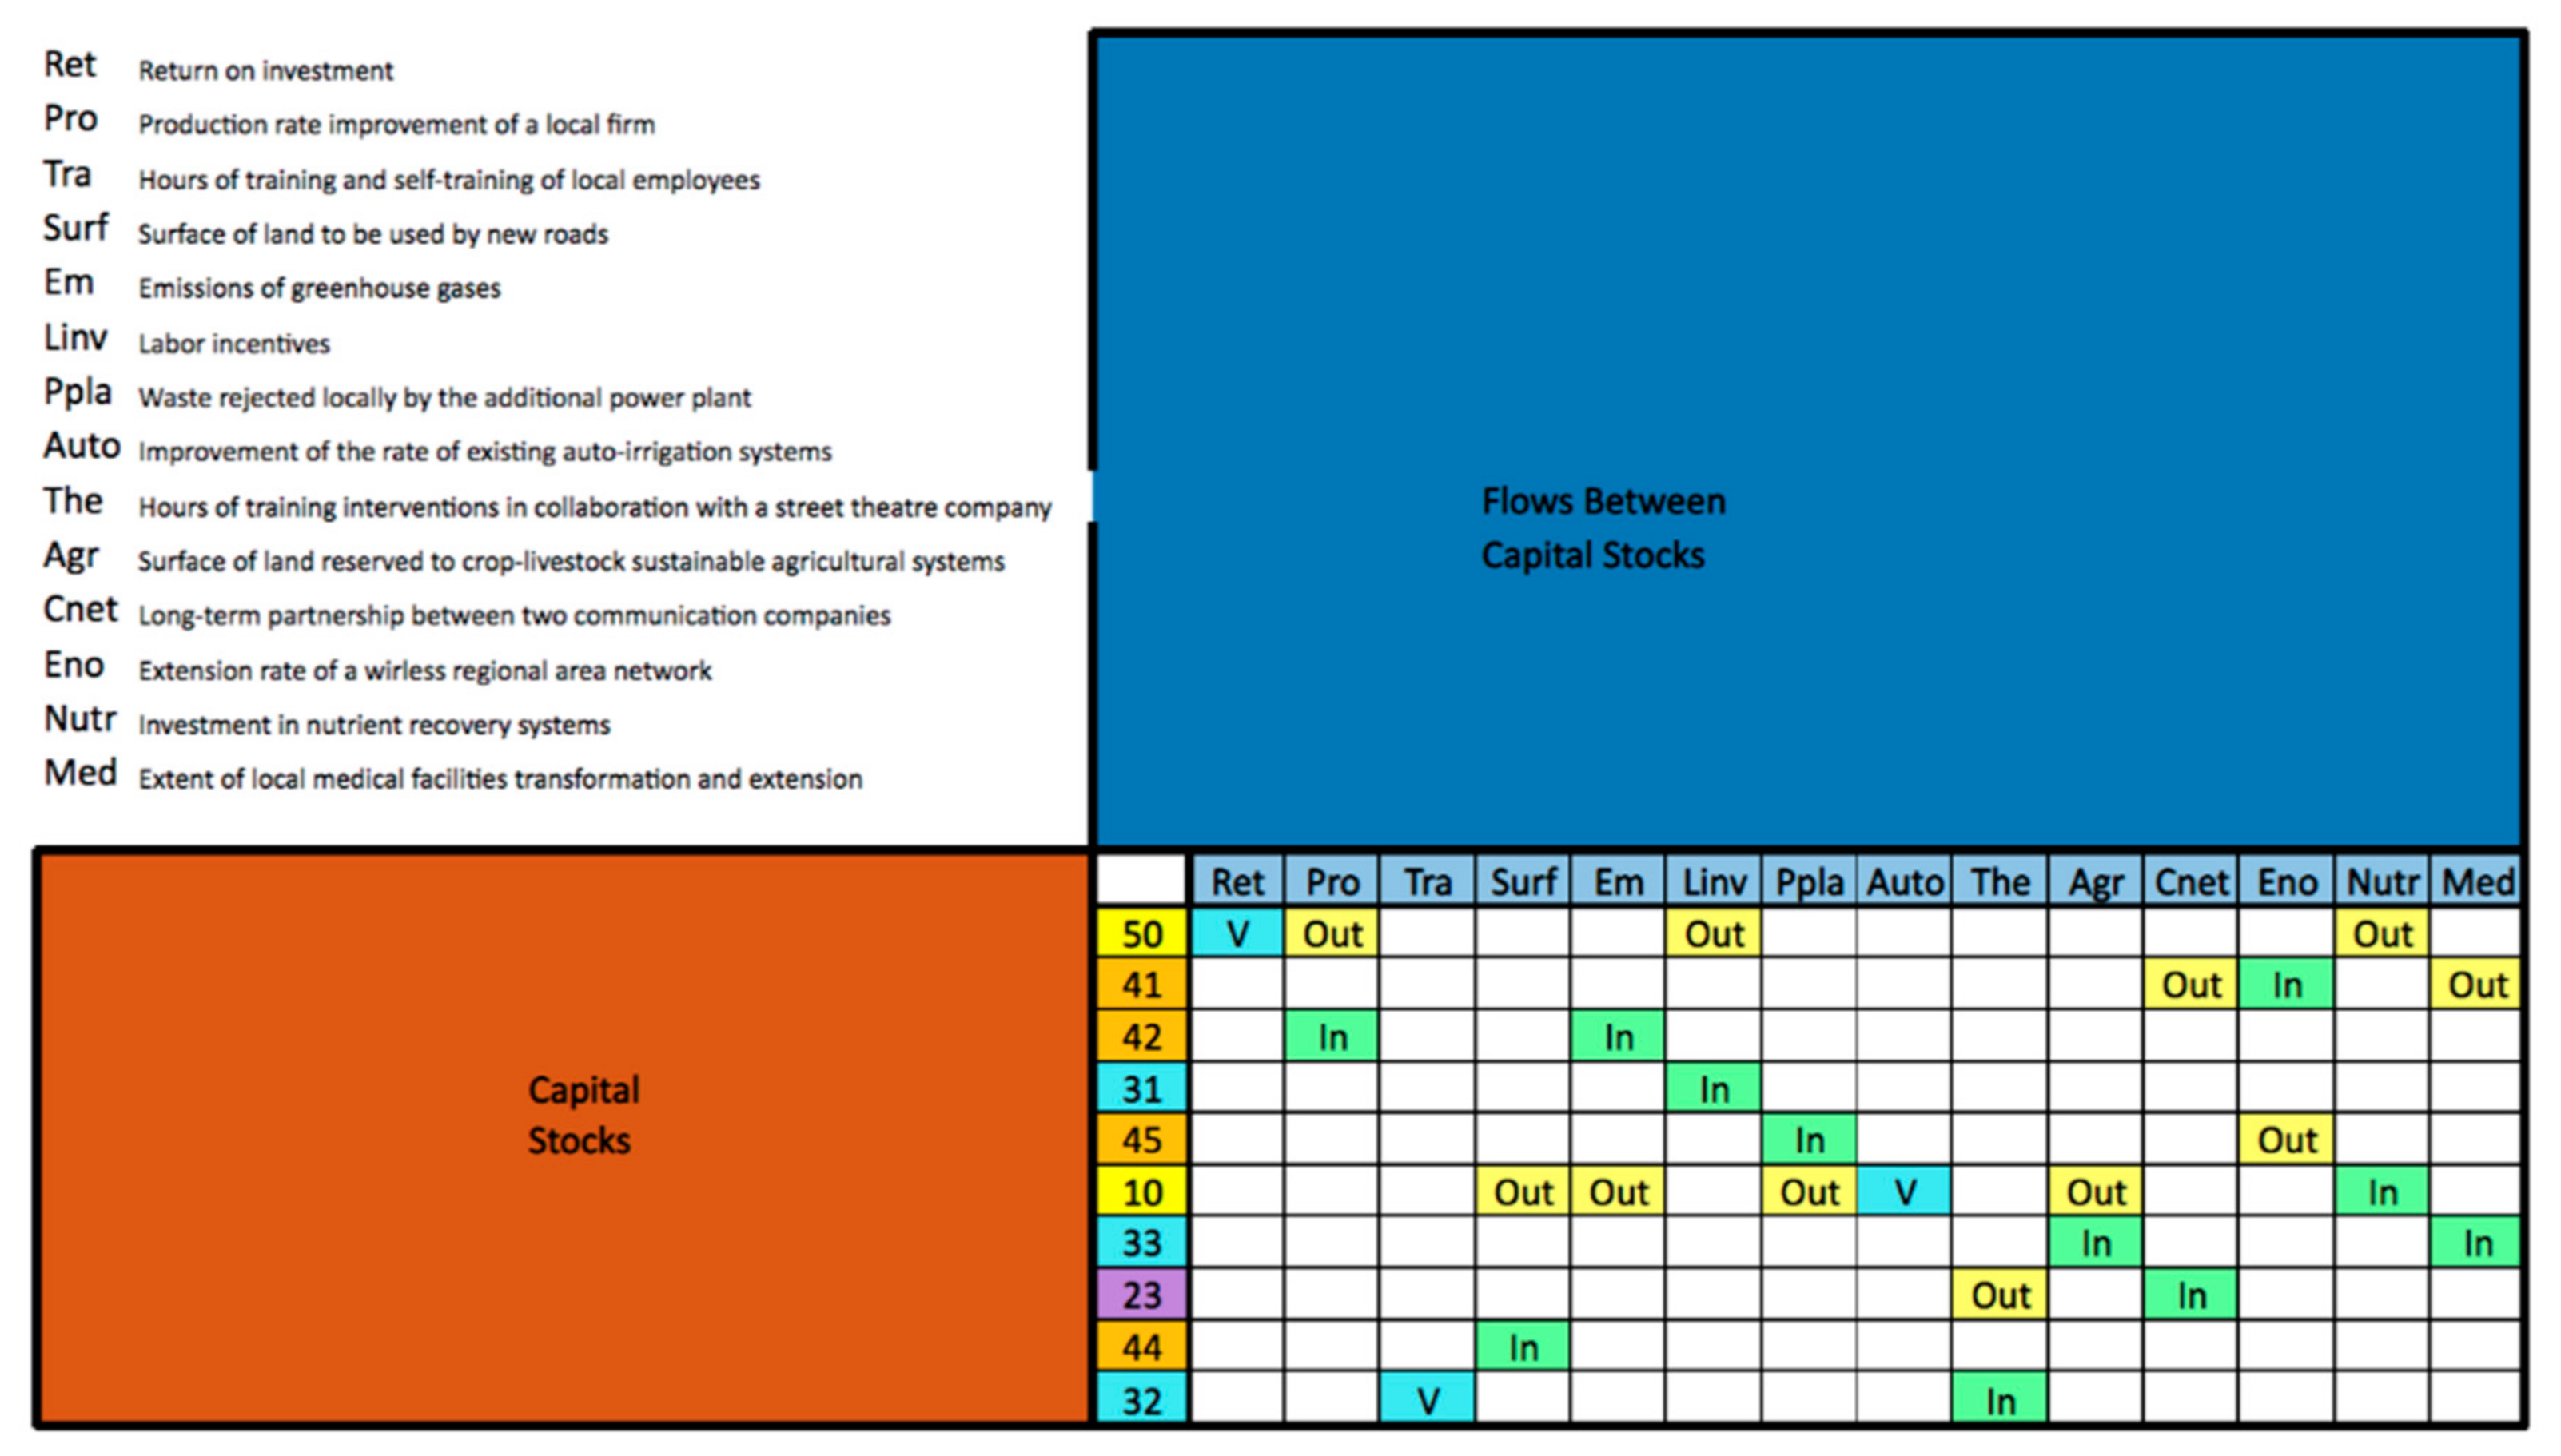
  • The Capital Stocks Domain (CS)–It represented the five capital stocks (or thirty-one sub-capital stocks) of the model developed in Section 2. The detail level was adapted to each context, meaning that this domain could mix several capitals and several sub-capitals.
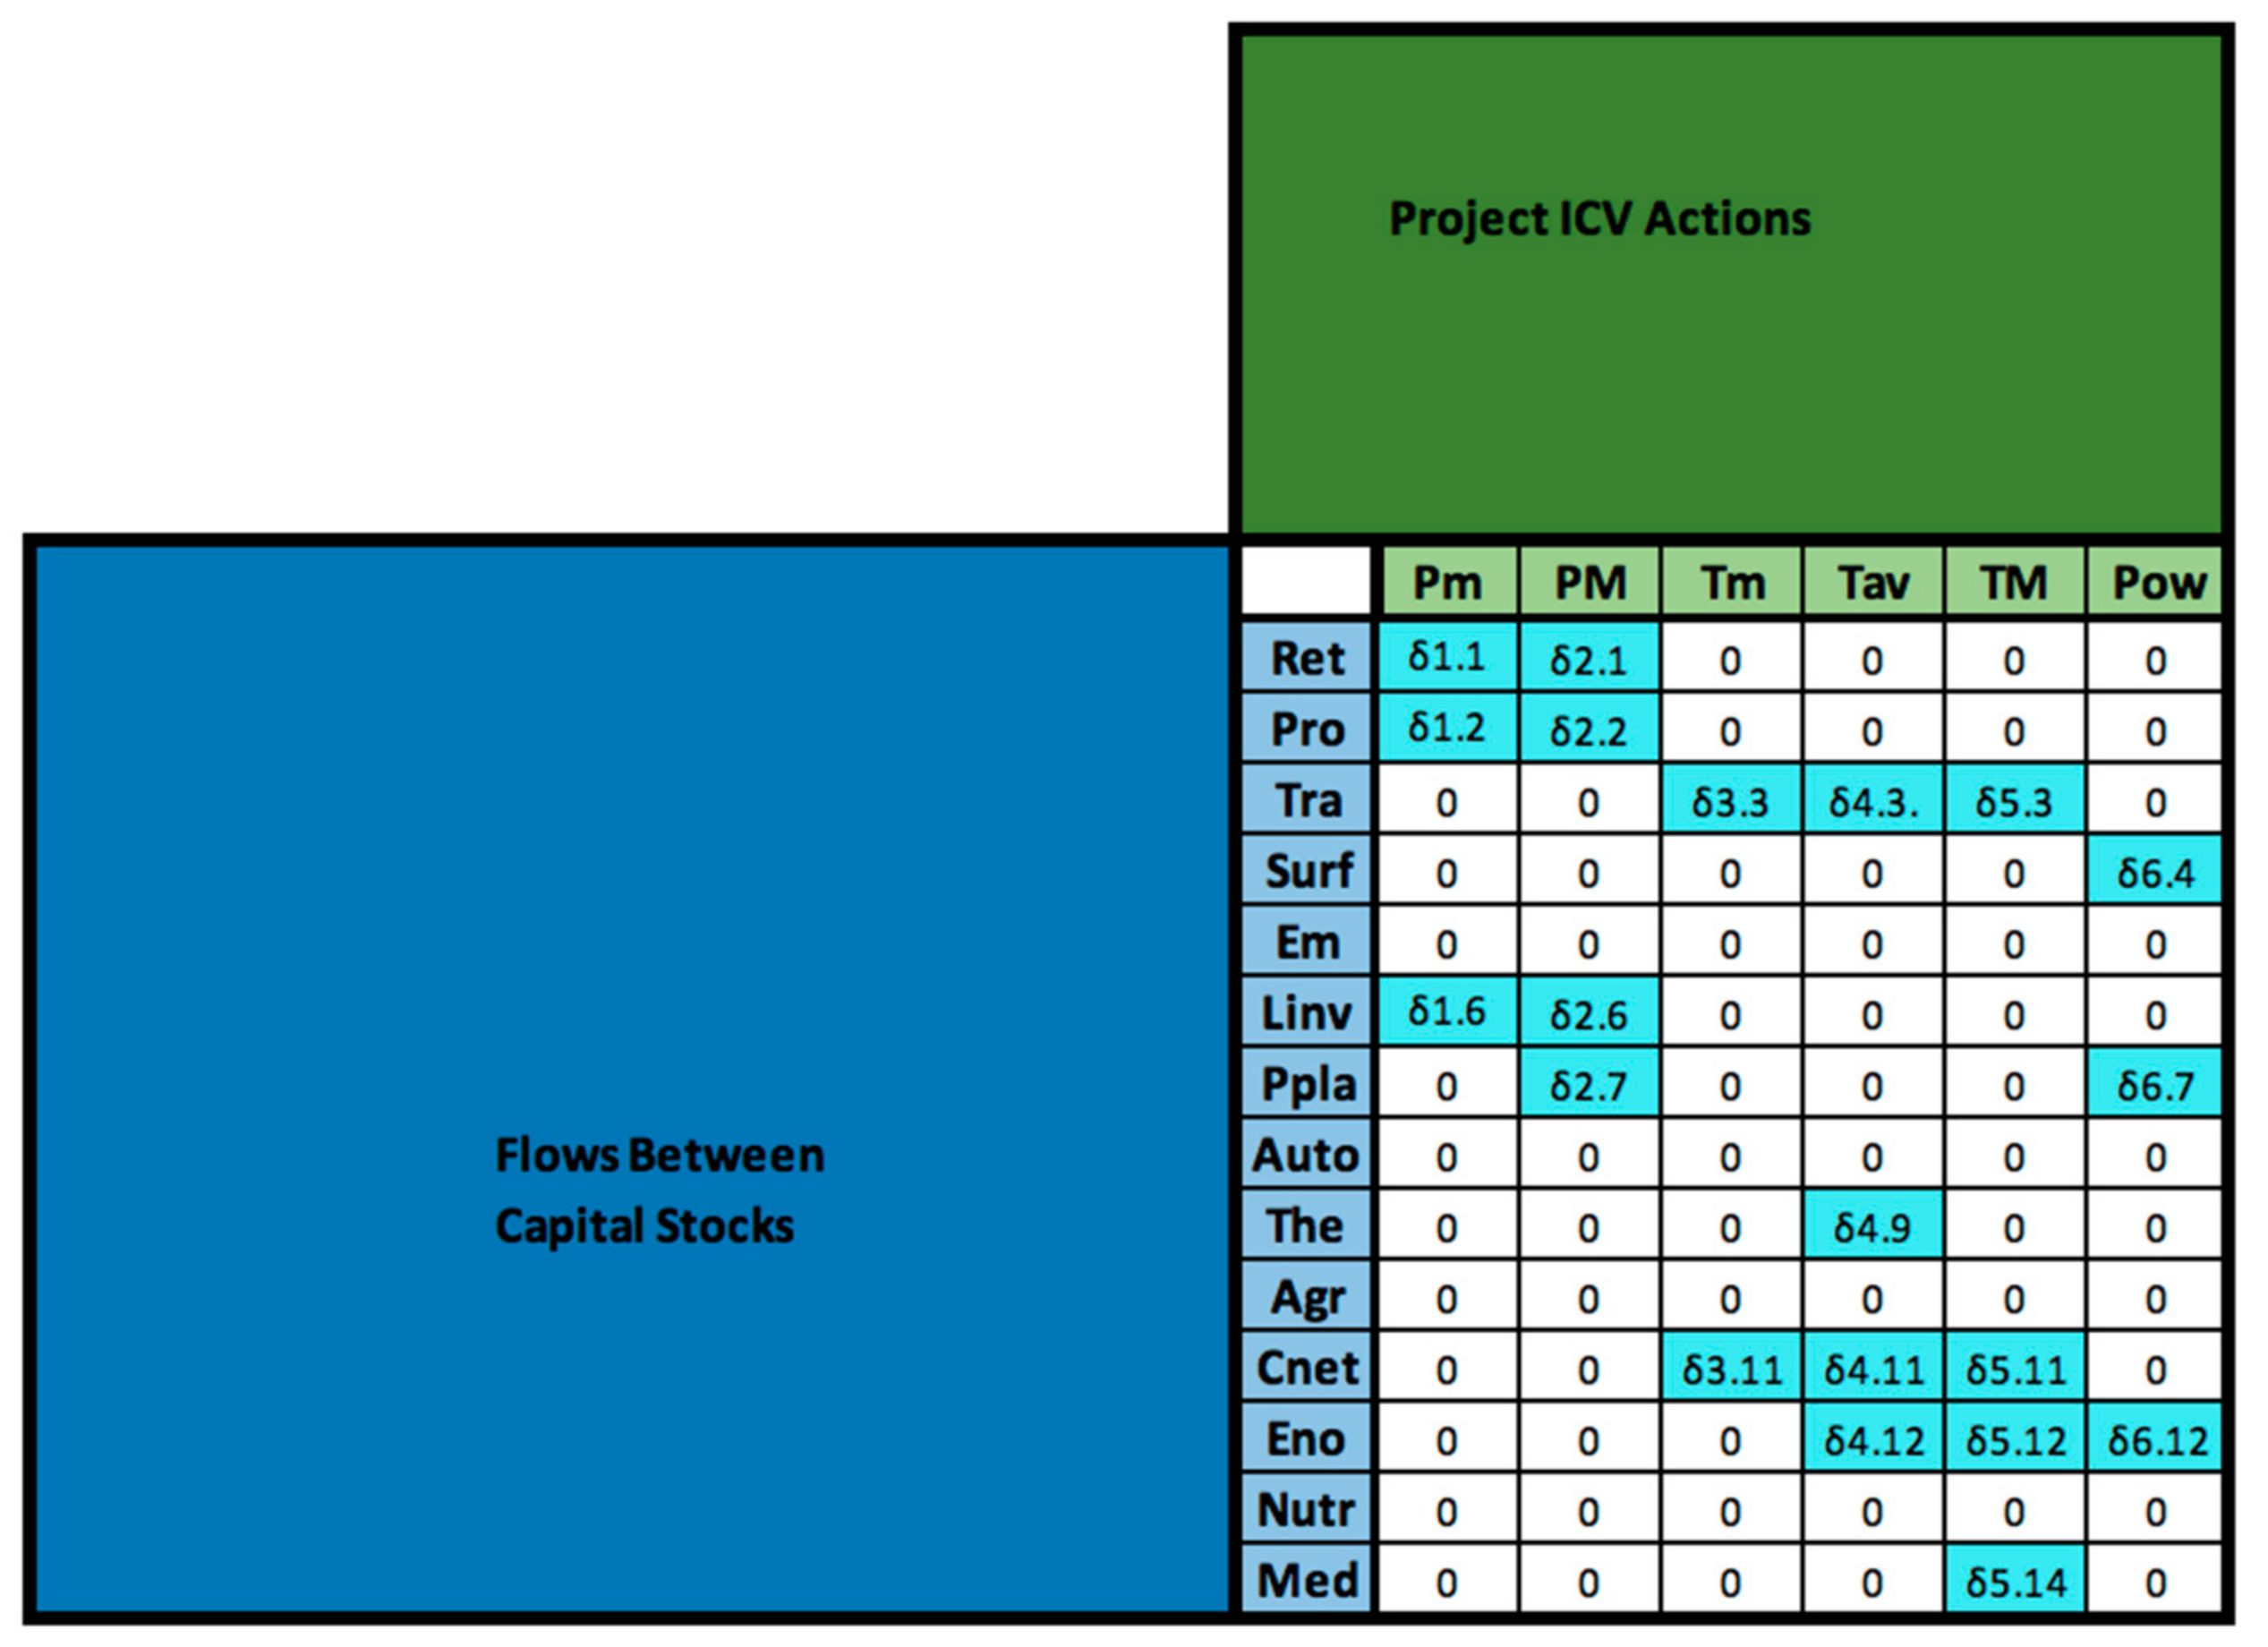
  • The Flows Domain (F)–It represented the potential impacts of an ICV action, extracted from the 1296 inter-capital flows of the model developed in Section 2. These flows could be between two different (sub-)capital stocks (when there was an exchange from a (sub-)capital to another one) or between a (sub-)capital stock and itself (to model the possible variation of this given (sub-)capital).
  • The ICV Actions Domain (ICVA)–It represented the possible project actions that had a potential impact on project ICV.
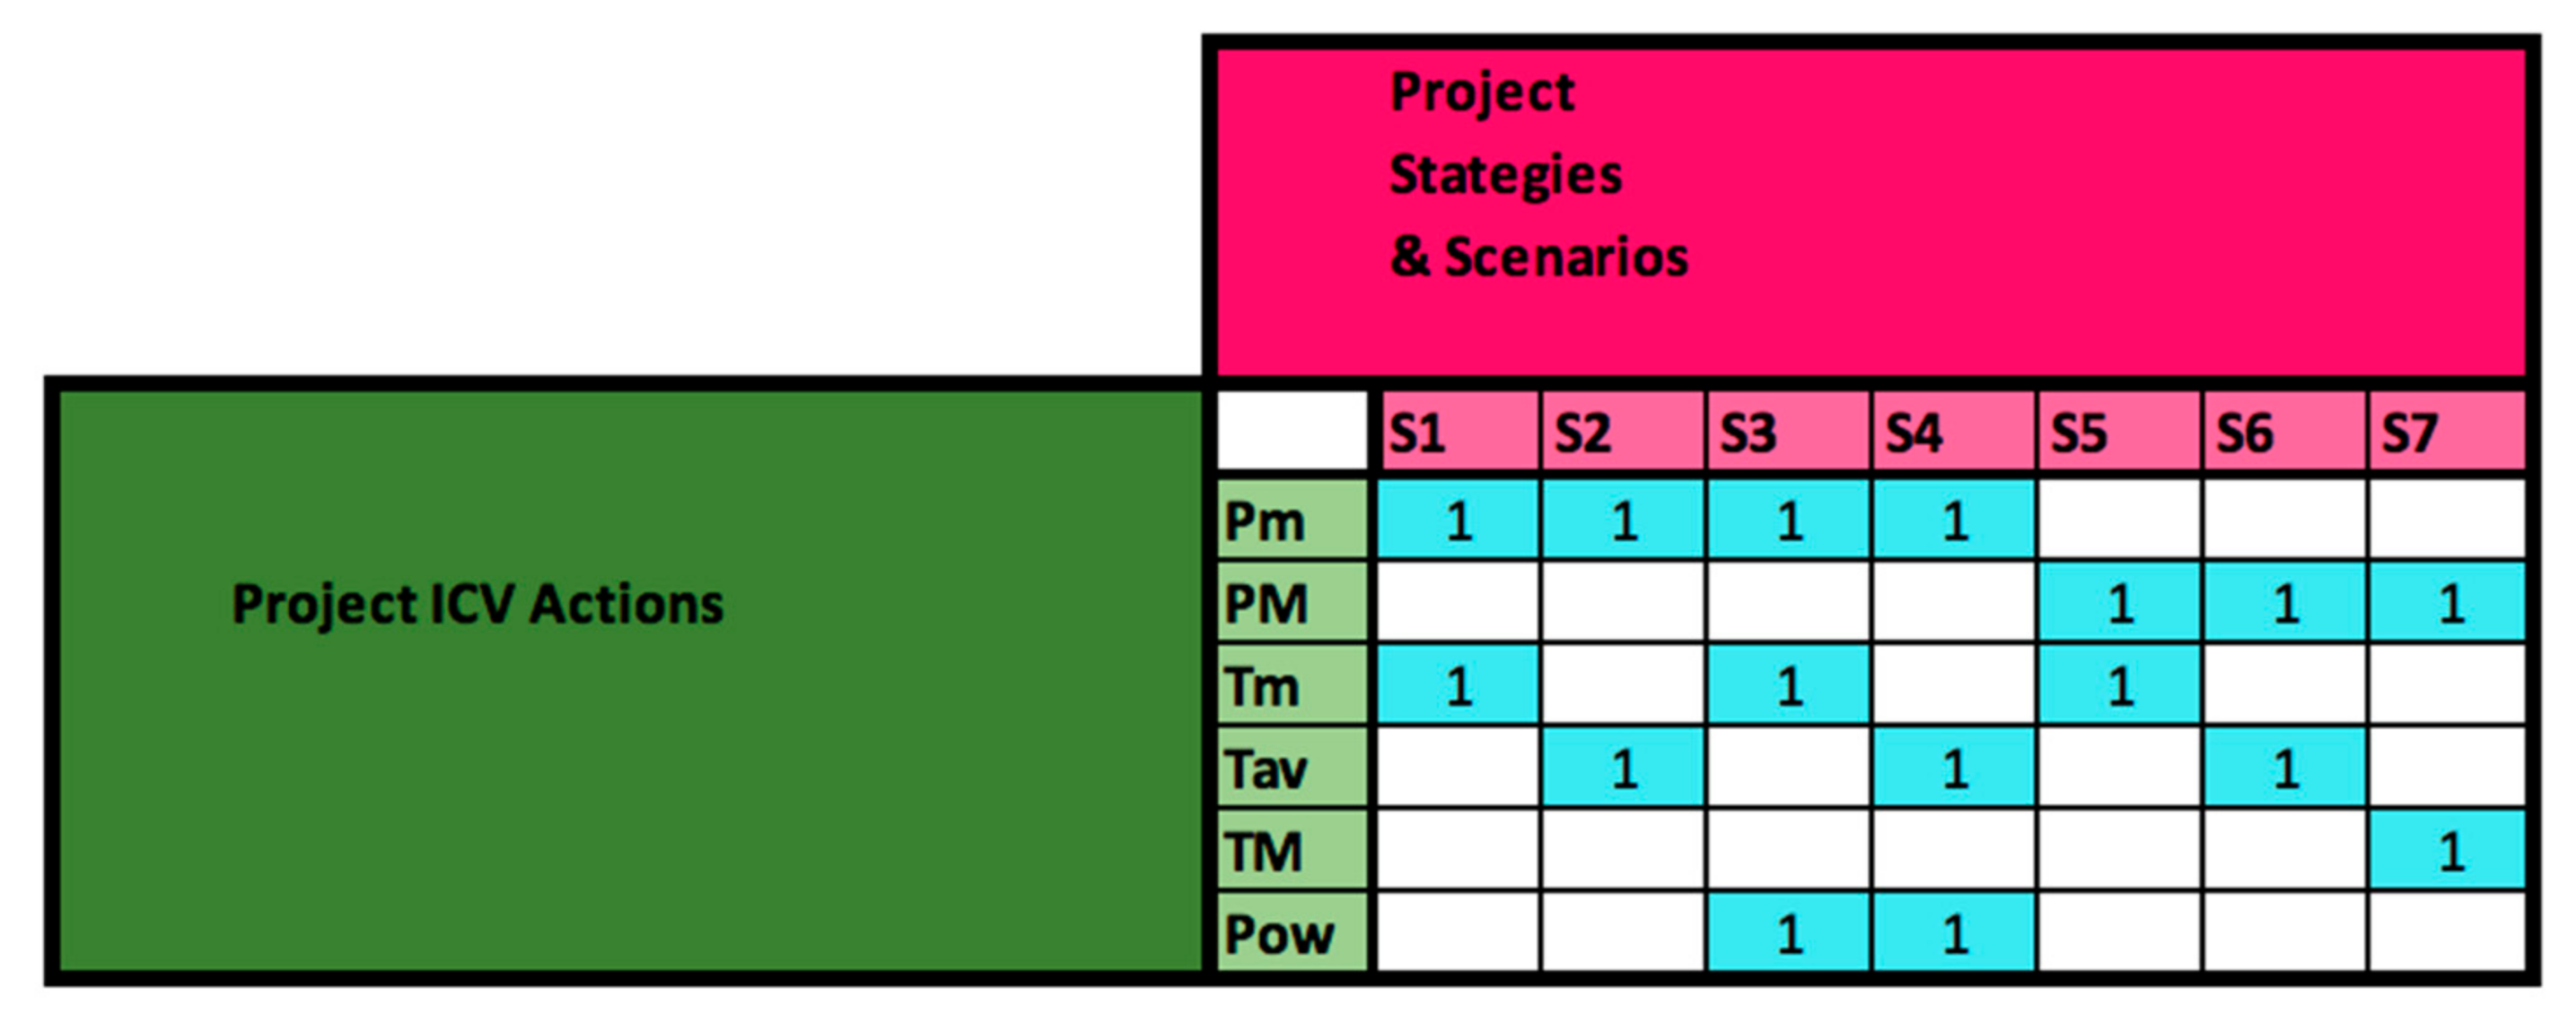
  • The Project Strategy and Scenario Domain (PSS)–It represented the possible project strategies or scenarios. Each scenario was described as a set of ICV actions.
The project ICV creation process DMM model was fully described in Section 4.3. and was directly illustrated with the industrial case study used to study the practical implementation of the model. This choice of presentation in this paper was made to facilitate the comprehension of this model both in terms of theory (detailed description of the matrices) and application (direct illustration on a case study).

4.3. Research Question 3: Implementing the Project ICV Creation Process DMM Model

4.3.1. Building Up a Hybrid Industrial Case Study

Because of the difficulty in obtaining data from an actual unique project, the choice was made to build up a realistic case study based on pieces of several real projects. Several alternatives were available in the context of several countries: past projects (Nigeria, Angola, Brazil), projects under implementation (Congo), and projects under design (Papua New Guinea, Uganda, Azerbaijan). Six main sources of information were identified to select a suitable case study:
  • Description of LC actions: A description of the different LC actions was present. This description should include several possible alternatives for local content actions.
  • Description of ICV actions: A description of the different ICV actions was present.
  • Local capabilities: This information reflected the labor required at a reasonably detailed level of detail as well as the labor available.
  • Host country data: Data helped defining the impacts to be considered and the systems to be modeled as a priority. Potential sources included macroeconomic data, stakeholders’ needs assessments, socio-environmental impact studies.
  • Host country vision: A clear documentation, reflecting the host country’s development strategy objectives, was present. The vision on local content legislation should also be available.
  • Contact within the project: It was crucial to have a well-established local contact within the project to facilitate access to information.
We considered data from several projects to build the structure of actions and objectives. Two projects particularly helped us. First, a new facility development project was designed, then postponed due to the world context. We were able to establish contacts at the project level to obtain information. This information consisted of socio-economic impact study documents, economic impact studies of past projects, (partial) macroeconomic data of the country and the host country’s priority objectives, data related to the host country’s labor needs, and different training options. However, we had a few scenarios or actions. Second, a program of revamping/facility improvement accompanied by an intensive education program. A questionnaire was sent to 80 local companies (40% of responses). The selected companies were among the major players in the country. The purpose of this study was to identify synergies between the oil sector and other local industries. The questionnaires were composed of three parts: a qualitative part to assess the most essential training needs, a quantitative part to assess the short- and long-term labor needs, and open questions about the local actions to be undertaken. As a result of these initiatives, we were able to build up a set of potential strategies and ICV actions extracted from these past projects.
The domains were defined in Section 4.2.; their relationships needed to be described. To connect possible ICV strategies to the decision-makers’ preferences, five matrices were proposed linking the six previously introduced domains.

4.3.2. The Decision-Makers/Objectives Matrix

The decision-makers’ preferences were identified and weighted using interviews and documents. The same objectives were considered for all decision-makers; only weights might vary. These weights were represented by wij coefficients (wij being defined between objective Oi and decision-maker DMj). This matrix was, therefore, a numerical matrix, the elements of which were real numbers between 0 and 1, and the sum of all wij was equal to 1 for each decision-maker DMj.
In this case, the company’s experts were interviewed to capture the company objective weights. For simulating the host country’s preferences, an analysis of the country’s long-term plan [135] was carried out to highlight future development pillars and aspirations of the people. This gives, in Figure 3, a hybrid matrix combining realistic data about the Oil and Gas (OG) company decision-makers, and fictitious data about the host country (HC) decision-makers (they were obtained from real documents but not validated by actual field actors), with nine objectives being considered here.
These objectives were all considered important by both stakeholders (no zero in the weights). However, there were significant differences of perception, like O3, O7, and O9, were of higher importance for the host country, and, reciprocally, O4, O6, and O8 were of higher importance for the Oil and Gas company. The use of such a matrix to highlight the differences in the decision-makers’ preferences regarding the impacts of ICV creation was considered to add value and trust in the relationships between the company and the host country.

4.3.3. The Objectives/Capital Stocks Matrix

This matrix represented the alignment of the host country’s impacted subsystems with the objectives. The OCSik coefficients of this matrix were binary numbers. OCSik = 1 means that the contribution to capital stock CSk had an implication on objective Oi. The construction of this matrix also permitted to define the complete set of NCS selected (sub-)capital stocks CSk; where NCS represents the number of capital stocks that are present in the matrix and is therefore equal to an integer between 1 and 36. Indeed, a potential (sub-)capital of the model developed in Section 2 was only present in the model used by the decision-makers if this (sub-)capital could be linked to at least one of the host country objectives.
Ten capitals were considered in our example (Figure 4). Two were high-level capital stocks (50–financial capital and 10–natural capital), the other ones were low-level sub-capital stocks (for instance, 41, 44, and 45 were sub-capitals of the 40–Manufactured Capital).
When filling this matrix, there was an opportunity to identify if some host country objectives were not reached by any selected (sub-)capital stock (in this case, the objective row was left blank). When this happened, a discussion should be raised to study if other (sub-)capital stocks should be included in the model to make sure that no host country objective row is left blank or that all the decision-makers understand the given objective row left blank. Similarly, if by any chance, a (sub-)capital stock column was left blank because it contributed to no host country objective, which was considered important by the decision-makers, a discussion should be raised to discuss if the corresponding (sub-)capital stock should be left out of the model or if an additional host country objective should be added.

4.3.4. The Capital Stocks/Flows Matrix

This matrix (CSFkp) aimed to model the flows between (sub-)capital stocks. As each capital could be linked to another by several flows of different natures, we modeled these phenomena as a matrix, where CSFkp = Out (or In) meant that impact Fp was an outgoing (or, respectively, incoming) flow of (sub-)capital stock Ci.
It was possible that a flow may be both incoming and outgoing for the same (sub-)capital stock; it was then noted as CSFkp = V because it corresponded to a variation of the CSk (sub-)capital stock. Each of these elementary variations (Out/In/V) was defined so they could be measured on numerical scales, which corresponded to the scales on which the respective (sub-)capital stocks were measured. The construction of this matrix also permitted to define the complete set of the NF flows (NF being the number of flows selected in the model), which the decision-makers consider to be important in the dynamics of the project ICV creation processes in the host country. In the end, the size of this sparse matrix is NF times NCS, with NF being by definition an integer between 1 and NCS2.
In our example, fourteen flows were identified between the ten (sub-)capital stocks (Figure 5). They connected two (sub-)capital stocks, like, for instance, Surf (surface of land to be used by new roads), which was a flow from natural capital to manufactured capital.

4.3.5. The Flows/ICV Actions Matrix

This matrix permitted quantifying the degree of impact of a basic ICV action. This matrix (FApq) was filled with the quantification of the impact Fp (in terms of flow between (sub-) capital stocks) generated by action Aq. The scales were numerical to measure the impact, which was a delta between the old and the new flow value. The scales used might thus vary according to the type of flow. The aggregation of values of actions in the same strategy depended on the nature of the impact and on possible synergies between actions. It could be a sum, a maximum/minimum function, or any other mathematical function.
In our example, three types of project ICV actions were developed. They correspond to the columns of Figure 6 (the abbreviations used in Figure 6 were defined in Figure 5 and below):
  • Local production actions consisted of the realization of project items for the implementation of the infrastructures. Two alternatives were considered: a baseline scenario (production minimum Pm) and a scenario where the local production exceeded local capacity (production maximum PM). These actions were estimated from project data and employment curves for the baseline scenario. Extrapolation from these data was carried out for the second scenario.
  • Human capital improvement actions consisted of training to make the local workforce more productive and bring it up to oil industry standards. Three scenarios were envisaged, seeking to train more or less large numbers of people (training minimum Tm, average Tav, and maximum TM in Figure 6). Data collected on the project allowed us to provide estimates.
  • A final action consisted of building an infrastructure to produce electricity (Pow). Only one scenario was described here. This one was entirely fictitious.
It must be noted that, at this stage, such a model permitted greater collaboration between the company and the host country. Indeed, the set of project ICV actions that were elaborated and proposed by the company could be used as a source of data to identify the flows between (sub-)capital stocks of the matrices in Figure 5 and Figure 6. However, these flows between (sub-)capital stocks could also be identified as promising flows from the host country’s viewpoint; thus, encouraging the company to elaborate project ICV actions that could have an impact on such flows. The greater the collaboration between the company and the host country, the more efficient project ICV actions were likely to be in the end. Thanks to the example of this case study, the proposed model was considered by industrial practitioners as a tool that could enhance greater collaboration with the host country, especially at this step in the process.

4.3.6. The ICV Actions/Strategies Matrix

The purpose of this matrix was to account for the presence of an elementary action in a project strategy. The ASqr coefficients of the matrix were binary numbers. ASqr = 1 meant that action Aq was part of strategy Sr. This matrix, therefore, permitted to describe all the possible project strategies and scenarios (Figure 7 in this case). At this stage, there was no consideration of weighted coefficients for this matrix, representing the fact that we might, for instance, build a certain number of kilometers of roads. For the moment, this was modeled through several alternatives, each one representing a discrete number of kilometers.
As a synthesis, the following Figure 8 gives an overview of the complete process, with five connected matrices allowing to link possible ICV strategies with decision-makers’ preferences. It particularly illustrated the impacts of project strategy S1 over the different matrices. The ability to describe the complete project ICV creation process and thus study different alternatives of project ICV strategies was considered as a promising approach to study the company’s projects. The flexibility of this model and its adaptability to any project and host country context (with the possibility to include (or not) any (sub-)capital stock or flow) in the model appeared to be promising to build transparent, trustworthy, and proactive relationships with host countries.

5. Conclusions

In-Country Value (ICV) was an emergent and promising way to create sustainable and local values in countries in which heavy industrial projects like oil and gas ones were carried out. It differed from classical Local Content because ICV actions could also impact a host country’s system of values through activities developed in synergy with the project but outside its initial scope. A systems thinking-based approach was used to build up an ICV description model (Research Question 1). A Domain Mapping Matrix (DMM) approach was then proposed to help build a 5-matrix chain to describe the complete project ICV creation process and estimate possible ICV strategies in terms of sustainable and local value creation (Research Question 2). An application to a hybrid case study built up with an industrial practitioner and specific country documents permitted to test the practical implementation of the model and validate the overall approach (Research Question 3).
This study notably proved, according to the company’s experts, how such a model could permit to facilitate discussions among stakeholders and lay the foundations of ICV creation-oriented decision-making processes. Indeed, contrary to the processes which existed within the company before this study, this new approach permitted to describe more precisely the different steps of the process of ICV creation. The model indeed permitted to address the diversity of the elements which were involved in the ICV creation process, whatever their nature (project actions, values, preferences of decision-makers…). The impacts of a given project strategy could, therefore, be fully described on multiple scales. Therefore, it permitted to describe precisely and compare the potential levers the company could use to create local value on multiple capital stocks and flows between capital stocks within the country, even if these levers and consequences were of different natures. This approach was even more original because it permitted to connect these possibilities of value creation to the host countries’ global objectives (and the multiple decision-makers), which opened a perspective on the assistance of a multicriteria selection process of relevant ICV strategies considering multiple decision-makers.
Other perspectives of this work could be identified both in terms of industrial applications and generic modeling of project ICV creation processes. First, if all the necessary elements (of different natures) were included in the DMM model, the case study showed that the availability or imprecision of some data could be a brake on their consideration. Consequently, a research perspective could be to deal with this difficulty to have all information available at the same time when carrying out such a study. A first possibility could be to build up a data availability/precision indicator and link it to every (sub-)capital stock and/or flow so the decision-makers could choose whether to integrate or not a given (sub-)capital stock and/or flow in the model using a multicriteria approach (combining this criterion of data availability/precision and criteria regarding the impact on local value creation). Another possibility would be to use fuzzy numbers in the capital stocks/flows matrix and in the flows/ICV actions matrix to deal with unavailable or imprecise information. Second, if the DMM-based approach permitted to model the interests of multiple stakeholders and decision-makers, a perspective could be to integrate specific collaborative decision-making strategies within and between the organizations. Indeed, presently, the model permitted to assess the impacts of a project ICV strategy on multiple scales using the weights of different decision-makers and their preferences. However, future work could permit to go further and define a collaborative decision-making process that would be based not only on such a quantitative assessment but also on more qualitative factors that cannot be modeled easily (for instance, dealing with the different time scales of the potential impacts of a project ICV strategy which were likely not to be simultaneous). Such collaborative decision-making process might also be the occasion to include a refined and more precise evaluation in some matrices (for instance, in the ICV actions/strategies matrix, including a weighted or fuzzy evaluation of the presence of an ICV action in a strategy instead of a binary number). Finally, if our approach allowed a matrix-based representation of a project ICV strategy, with the path of its impacts on capital stocks and flows, and on the decision-makers’ satisfaction, a future perspective of this work will be to adapt this matrix form to a graphical representation which could be more easily communicable. A visual representation of project ICV creation using graphs is meant to be developed, knowing that reflection must be carried out in the most appropriate way to represent coexisting flows of different natures.

Author Contributions

Conceptualization, L.-A.V., F.M. and M.D.; methodology, L.-A.V., F.M. and M.D.; validation, L.-A.V., F.M. and M.D.; writing—original draft preparation, L.-A.V. and F.M.; writing—review and editing, L.-A.V. and F.M. All authors have read and agreed to the published version of the manuscript.

Funding

The research is notably based on a Ph.D. which was carried out within the context of a research chair funded by TOTAL, the French oil and gas group.

Institutional Review Board Statement

Not applicable.

Informed Consent Statement

Not applicable.

Data Availability Statement

Data which are not included in the paper are not available, due to confidentiality reasons.

Conflicts of Interest

The authors declare no conflict of interest. The funders collaborated to the construction of the case study. The funders had no role in the design of the study, in the writing of the manuscript, and in the decision to publish the results.

References

  1. Gelb, A.H. Windfall Gains: Blessing or Curse? Oxford University Press: New York, NY, USA, 1988. [Google Scholar]
  2. Auty, R.M. Resource-Based Industrialization: Sowing the Oil in Eight Developing Countries; Oxford University Press: New York, NY, USA, 1990. [Google Scholar]
  3. Sachs, J.; Warner, A. Natural Resource Abundance and Economic Growth; National Bureau of Economic Research: Cambridge, MA, USA, 1995. [Google Scholar] [CrossRef]
  4. Sachs, J.D.; Warner, A.M. The curse of natural resources. Eur. Econ. Rev. 2001, 45, 827–838. [Google Scholar] [CrossRef]
  5. Gylfason, T. Natural resources, education, and economic development. Eur. Econ. Rev. 2001, 45, 847–859. [Google Scholar] [CrossRef]
  6. Haddow, K.H. How best can mining be a catalyst for diversifying economies? Miner. Econ. 2014, 27, 149–151. [Google Scholar] [CrossRef]
  7. Bastida, A.E. From extractive to transformative industries: Paths for linkages and diversification for resource-driven development. Miner. Econ. 2014, 27, 73–87. [Google Scholar] [CrossRef] [Green Version]
  8. Dietsche, E. Diversifying mineral economies: Conceptualizing the debate on building linkages. Miner. Econ. 2014, 27, 89–102. [Google Scholar] [CrossRef]
  9. Farooki, M.; Kaplinsky, R. Promoting diversification in resource-rich economies. Miner. Econ. 2014, 27, 103–113. [Google Scholar] [CrossRef]
  10. Tordo, S.; Warner, M.; Manzano, O.; Anouti, Y. Local Content Policies in the Oil and Gas Sector; The World Bank: Washington, DC, USA, 2013. [Google Scholar]
  11. Nwapi, C. A survey of the literature on local content policies in the oil and gas industry in East Africa. Sch. Public Policy Univ. Calgary 2016, 9, 16. [Google Scholar]
  12. De Hemmer Gudme, O.; Poissonnier, H. Valeur(s) et Management: Des Méthodes pour Plus de Valeur(s) Dans le Management; EMS GEODIF: Caen, France, 2013. [Google Scholar]
  13. IPIECA. Local Content Strategy: A Guidance Document for the Oil and Gas Industry; IPIECA: London, UK, 2011. [Google Scholar]
  14. Ado, R. Local content policy and the WTO rules of trade-related investment measures (TRIMS): The pros and cons. Int. J. Bus. Manag. Stud. 2013, 2, 137–146. [Google Scholar]
  15. Hufbauer, G.C.; Schott, J.J.; Cimino, C.; Vieiro, M.; Wada, E. Local Content Requirements: A Global Problem; Peterson Institute Press: Washington, DC, USA, 2013. [Google Scholar]
  16. Kalyuzhnova, Y.; Nygaard, C.A.; Omarov, Y.; Saparbayev, A. Local Content Policies in Resource-Rich Countries; Palgrave Macmillan: London, UK, 2016. [Google Scholar]
  17. African Development Bank. Creating Local Content for Human Development in Africa’s New Natural Resource-Rich Countries (Flagship Report Paper Series Paper 6); African Development Bank: Abidjan, Côte d’Ivoire, 2015. [Google Scholar]
  18. Olawuyi, D.S. Local content requirements in oil and gas contracts: Regional trends in the middle east and north Africa. J. Energy Nat. Resour. Law 2019, 37, 93–117. [Google Scholar] [CrossRef]
  19. Ablo, A.D. Scale, local content and the challenges of Ghanaians employment in the oil and gas industry. Geoforum 2018, 96, 181–189. [Google Scholar] [CrossRef]
  20. Ngoasong, M.Z. How international oil and gas companies respond to local content policies in petroleum-producing developing countries: A narrative enquiry. Energy Policy 2014, 73, 471–479. [Google Scholar] [CrossRef]
  21. Adewuyi, A.O.; Ademola Oyejide, T. Determinants of backward linkages of oil and gas industry in the Nigerian economy. Resour. Policy 2012, 37, 452–460. [Google Scholar] [CrossRef]
  22. Warner, M. Local Content In Procurement: Creating Local Jobs and Competitive Domestic Industries in Supply Chains; Greenleaf Publishing: Sheffield, UK, 2011. [Google Scholar]
  23. Hammann, E. Three Years Experience in Engaging Local Content at Project Planning Phase. In Proceedings of the SPE International Conference and Exhibition on Health, Safety, Security, Environment, and Social Responsibility, Stavanger, Norway, 11–13 April 2016. [Google Scholar]
  24. Ovadia, J.S. The Making of Oil-backed Indigenous Capitalism in Nigeria. New Polit. Econ. 2013, 18, 258–283. [Google Scholar] [CrossRef]
  25. Dernis, M.; Ouerdane, W.; Vidal, L.-A.; Da Costa, P.; Marle, F. Assessment of Sustainable strategies based on DMM approach and value creation. In Proceedings of the 19th Dependency and Structure Modelling Conference (DSM), Helsinki, Finland, 11–13 September 2017. [Google Scholar]
  26. Nadorff, N.J.; Van-Dunem, J.O.S. If you build it they will come: Angola’s homegrown approach to post-graduate oil and gas instruction. J. World Energy Law Bus. 2018, 11, 164–181. [Google Scholar] [CrossRef]
  27. Toledano, P.; Thomashausen, S.; Maennling, N.; Shah, A. A Framework to Approach Shared Use of Mining-Related Infrastructure; Vale Columbia Center on Sustainable International Investment: New York, NY, USA, 2014. [Google Scholar] [CrossRef]
  28. Dernis, M. Modélisation et Estimation Des Valeurs ApportéES au Pays Hôte Pour Aider à la Décision Dans L’éLaboration Des Stratégies in-Country-Value. Ph.D. Thesis, Université Paris-Saclay (ComUE), Paris, France, 2019. [Google Scholar]
  29. Obeng-Odoom, F. Oil, Local Content Laws and Paternalism: Is Economic Paternalism Better Old, New or Democratic? Forum Soc. Econ. 2019, 48, 281–306. [Google Scholar] [CrossRef]
  30. Arvanitis, Y.; Weigert, M. Turning resource curse into development dividends in Guinea-Bissau. Resour. Policy 2017, 53, 226–237. [Google Scholar] [CrossRef]
  31. PMI—Project Management Institute. A Guide to the Project Management Body Of Knowledge; Project Management Institute: Newtown Square, PA, USA, 2000. [Google Scholar]
  32. Belassi, W.; Tukel, O.I. A new framework for determining critical success/failure factors in projects. Int. J. Proj. Manag. 1996, 14, 141–151. [Google Scholar] [CrossRef]
  33. Fleming, Q.W.; Koppelman, J.M. Using earned value management. Cost Eng. 2002, 44, 32–36. [Google Scholar]
  34. Laursen, M.; Svejvig, P. Taking stock of project value creation: A structured literature review with future directions for research and practice. Int. J. Proj. Manag. 2016, 34, 736–747. [Google Scholar] [CrossRef]
  35. Vidal, L.-A. Thinking Project Management in the Age of Complexity. Particular Implications on Project Risk Management. Ph.D. Thesis, Ecole Centrale Paris, Paris, France, 2009. [Google Scholar]
  36. Lauras, M.; Marques, G.; Gourc, D. Towards a multi-dimensional project Performance Measurement System. Decis. Support Syst. 2010, 48, 342–353. [Google Scholar] [CrossRef] [Green Version]
  37. Marques, G.; Gourc, D.; Lauras, M. Multi-criteria performance analysis for decision making in project management. Int. J. Proj. Manag. 2011, 29, 1057–1069. [Google Scholar] [CrossRef]
  38. Thomas, J.; Mullaly, M. Understanding the Value of Project Management: First Steps on an International Investigation in Search of Value. Proj. Manag. J. 2007, 38, 74–89. [Google Scholar] [CrossRef]
  39. Armenia, S.; Dangelico, R.M.; Nonino, F.; Pompei, A. Sustainable Project Management: A Conceptualization-Oriented Review and a Framework Proposal for Future Studies. Sustainability 2019, 11, 2664. [Google Scholar] [CrossRef] [Green Version]
  40. Hope, A.J.; Moehler, R. Balancing Projects with Society and the Environment: A Project, Programme and Portfolio Approach. Procedia Soc. Behav. Sci. 2014, 119, 358–367. [Google Scholar] [CrossRef] [Green Version]
  41. Silvius, A.J.G.; Schipper, R.P.J. Sustainability in project management: A literature review and impact analysis. Soc. Bus. 2014, 4, 63–96. [Google Scholar] [CrossRef]
  42. Marcelino-Sádaba, S.; González-Jaen, L.F.; Pérez-Ezcurdia, A. Using project management as a way to sustainability. from a comprehensive review to a framework definition. J. Clean. Prod. 2015, 99, 1–16. [Google Scholar] [CrossRef]
  43. Gilbert Silvius, A.J.; Kampinga, M.; Paniagua, S.; Mooi, H. Considering sustainability in project management decision making; An investigation using Q-methodology. Int. J. Proj. Manag. 2017, 35, 1133–1150. [Google Scholar] [CrossRef]
  44. Borg, R.; Gonzi, R.D.; Borg, S.P. Building sustainably: A pilot study on the project manager’s contribution in delivering sustainable construction projects—a maltese and international perspective. Sustainability 2020, 12, 10162. [Google Scholar] [CrossRef]
  45. Labuschagne, C.; Brent, A.C. Sustainability assessment criteria for projects and technologies: Judgements of industry managers. South Afr. J. Ind. Eng. 2007, 18. [Google Scholar] [CrossRef]
  46. Sánchez, M.A. Integrating sustainability issues into project management. J. Clean. Prod. 2015, 96, 319–330. [Google Scholar] [CrossRef]
  47. Labuschagne, C.; Brent, A.C. Social indicators for sustainable project and technology life cycle management in the process industry. Int. J. Life Cycle Assess. 2006, 11, 3–15. [Google Scholar]
  48. Oehlmann, I. The Sustainable Footprint Methodology - Including Sustainability in the Project Management of the Bergermeer Gas Storage Project. Master’s Thesis, Delft University of Technology, Delft, The Netherlands, 2010. [Google Scholar]
  49. Toljaga-Nikolić, D.; Todorović, M.; Dobrota, M.; Obradović, T.; Obradović, V. Project Management and Sustainability: Playing Trick or Treat with the Planet. Sustainability 2020, 12, 8619. [Google Scholar] [CrossRef]
  50. Doskočil, R.; Lacko, B. Risk Management and Knowledge Management as Critical Success Factors of Sustainability Projects. Sustainability 2018, 10, 1438. [Google Scholar] [CrossRef] [Green Version]
  51. Talbot, J.; Venkataraman, R. Evaluating sustainability on projects using indicators. In Sustainability Integration for Effective Project Management; IGI Global: Hershey, PA, USA, 2013; pp. 194–211. [Google Scholar]
  52. Maniak, R.; Midler, C.; Lenfle, S.; Pellec-Dairon, M. Le Value management for exploration projects. Proj. Manag. J. 2014, 45, 55–66. [Google Scholar] [CrossRef]
  53. Daniel, E.I.; Pasquire, C. Creating social value within the delivery of construction projects: The role of lean approach. Eng. Constr. Arch. Manag. 2019, 26, 1105–1128. [Google Scholar] [CrossRef] [Green Version]
  54. Sjåfjell, B. Sustainable value creation within planetary boundaries-Reforming corporate purpose and duties of the corporate board. Sustainability 2020, 12, 6245. [Google Scholar] [CrossRef]
  55. Bae, J.W.; Kim, Y.W. Sustainable value on construction projects and lean construction. J. Green Build. 2008, 3, 155–167. [Google Scholar] [CrossRef]
  56. Ayentimi, D.T.; Burgess, J.; Brown, K. Developing effective local content regulations in sub-Sahara Africa: The need for more effective policy alignment. Multinatl. Bus. Rev. 2016, 24, 354–374. [Google Scholar] [CrossRef]
  57. Ettmayr, C.; Lloyd, H. Local content requirements and the impact on the South African renewable energy sector: A survey-based analysis. South Afr. J. Econ. Manag. Sci. 2017, 20. [Google Scholar] [CrossRef] [Green Version]
  58. Lebdioui, A. Local content in extractive industries: Evidence and lessons from Chile’s copper sector and Malaysia’s petroleum sector. Extr. Ind. Soc. 2020, 7, 341–352. [Google Scholar] [CrossRef]
  59. Maack, M.; Davidsdottir, B. Five capital impact assessment: Appraisal framework based on theory of sustainable well-being. Renew. Sustain. Energy Rev. 2015, 50, 1338–1351. [Google Scholar] [CrossRef]
  60. Asiago, B.C. Fact or fiction: Harmonising and unifying legal principles of local content requirements. J. Energy Nat. Resour. Law 2016, 34, 337–360. [Google Scholar] [CrossRef]
  61. Baldassarre, B.; Calabretta, G.; Bocken, N.M.P.; Jaskiewicz, T. Bridging sustainable business model innovation and user-driven innovation: A process for sustainable value proposition design. J. Clean. Prod. 2017, 147, 175–186. [Google Scholar] [CrossRef] [Green Version]
  62. Choumert Nkolo, J. Developing a socially inclusive and sustainable natural gas sector in Tanzania. Energy Policy 2018, 118, 356–371. [Google Scholar] [CrossRef]
  63. Henriques, J.; Catarino, J. Sustainable value and cleaner production—Research and application in 19 Portuguese SME. J. Clean. Prod. 2015, 96, 379–386. [Google Scholar] [CrossRef] [Green Version]
  64. Koke, B.; Moehler, R.C. Earned Green Value management for project management: A systematic review. J. Clean. Prod. 2019, 230, 180–197. [Google Scholar] [CrossRef]
  65. Grzeszczyk, T.A.; Waszkiewicz, M. Sustainable investment project evaluation. Entrep. Sustain. Issues 2020, 7. [Google Scholar] [CrossRef]
  66. Sterman, J. Business Dynamics: Systems Thinking and Modeling for a Complex World; McGraw-Hill Higher Education: Boston, MA, USA, 2000. [Google Scholar]
  67. Baccarini, D. The concept of project complexity—A review. Int. J. Proj. Manag. 1996, 14, 201–204. [Google Scholar] [CrossRef] [Green Version]
  68. Bérard, C. Le Processus de Décision Dans Les Systèmes Complexes: Une Analyse D’Une Intervention Systémique. Ph.D. Thesis, Université Paris Dauphine, Paris, France, Université du Québec à Montréal, Montreal, QC, Canada, 2009. [Google Scholar]
  69. Le Moigne, J.-L. La Théorie du Système Général. Théorie de la Modélisation; Presses Universitaires de France: Paris, France, 1990. [Google Scholar]
  70. Jackson, M.C. Creative Holism: A Critical Systems Approach to Complex Problem Situations. Syst. Res. Behav. Sci. 2006, 23, 647–657. [Google Scholar] [CrossRef]
  71. Battistoni, C.; Nohra, C.G.; Barbero, S. A systemic design method to approach future complex scenarios and research towards sustainability: A holistic diagnosis tool. Sustainability 2019, 11, 4458. [Google Scholar] [CrossRef] [Green Version]
  72. Simon, H.A. The Architecture of Complexity. In Facets of Systems Science; Springer: Berlin/Heidelberg, Germany, 1962; Volume 106. [Google Scholar]
  73. Boulding, K. General Systems Theory, the Skeleton of Science. Manag. Sci. 1956, 2, 197–208. [Google Scholar] [CrossRef] [Green Version]
  74. Von Bertalanffy, L. General System Theory Foundations, Development, Applications; George Braziller: New York, NY, USA, 1968. [Google Scholar]
  75. Churchman, C.W. The Design of Inquiring Systems: Basic Concepts of Systems and Organization; Basic Books: New York, NY, USA, 1971. [Google Scholar]
  76. Checkland, P. Systems Thinking, Systems Practice: Includes a 30-Year Retrospective; Wiley: Hoboken, NJ, USA, 1999. [Google Scholar]
  77. Morin, E. La Complexité Humaine; Flammarion: Paris, France, 2008. [Google Scholar]
  78. Luhmann, N. Introduction to Systems Theory; Wiley: Hoboken, NJ, USA, 2012. [Google Scholar]
  79. Lyons, M.H.; Adjali, I.; Collings, D.; Jensen, K.O. Complex systems models for strategic decision making. BT Technol. J. 2003, 21, 11–27. [Google Scholar] [CrossRef]
  80. Vidal, L.-A.; Marle, F. Understanding project complexity: Implications on project management. Kybernetes 2008, 37, 1094–1110. [Google Scholar] [CrossRef]
  81. Schindler, A. Vers la Multi-Performance Des Organisations: Conception et Pilotage Par Les Valeurs du Centre de Recherche Intégré MIRCen du CEA. Ph.D. Thesis, Ecole centrale de Paris, Paris, France, 2010. [Google Scholar]
  82. Safi, H. Le Management Socio-éConomique et la Mise en œUvre D’Une Démarche de Qualité Intégrale Dans Un éTablissement D’Enseignement Supérieur en Tunisie. Ph.D. Thesis, Conservatoirenational des Arts et Metiers—CNAM, Paris, France, 2012. [Google Scholar]
  83. Hansen, J.-C. Cindynics Contribution to Crisis/Disasters Strategic Steering. In Proceedings of the WADEM Congress on Disaster and Emergency Medicine, Toronto, ON, Canada, 25–28 April 2017. [Google Scholar]
  84. Vajna, S. Integrated Design Engineering—Interdisciplinary and Holistic Product Development; Vajna, S., Ed.; Springer: Berlin/Heidelberg, Germany, 2020. [Google Scholar]
  85. Vidal, L.-A.; Marle, F.; Bocquet, J.-C. Using a Delphi process and the Analytic Hierarchy Process (AHP) to evaluate the complexity of projects. Expert Syst. Appl. 2011, 38, 5388–5405. [Google Scholar] [CrossRef]
  86. Jones, L.; Norton, L.; Austin, Z.; Browne, A.L.; Donovan, D.; Emmett, B.A.; Grabowski, Z.J.; Howard, D.C.; Jones, J.P.G.; Kenter, J.O.; et al. Stocks and flows of natural and human-derived capital in ecosystem services. Land Use Policy 2016, 52, 151–162. [Google Scholar] [CrossRef]
  87. Mancini, M.S.; Galli, A.; Niccolucci, V.; Lin, D.; Hanscom, L.; Wackernagel, M.; Bastianoni, S.; Marchettini, N. Stocks and flows of natural capital: Implications for Ecological Footprint. Ecol. Indic. 2017, 77, 123–128. [Google Scholar] [CrossRef]
  88. Dahiyat, S.E.; Khasawneh, S.M.; Bontis, N.; Al-Dahiyat, M. Intellectual capital stocks and flows: Examining the mediating roles of social capital and knowledge transfer. VINE J. Inf. Knowl. Manag. Syst. 2021. [Google Scholar] [CrossRef]
  89. Porritt, J. Capitalism as if the World Matters, 1st ed.; Routledge: Milton Park, UK, 2007. [Google Scholar]
  90. Stahel, W.R.; Clift, R. Stocks and flows in the performance economy. In Taking Stock of Industrial Ecology; Springer: Berlin/Heidelberg, Germany, 2015; pp. 137–158. [Google Scholar]
  91. Terama, E.; Milligan, B.; Jiménez-Aybar, R.; Mace, G.M.; Ekins, P. Accounting for the environment as an economic asset: Global progress and realizing the 2030 Agenda for Sustainable Development. Sustain. Sci. 2016, 11, 945–950. [Google Scholar] [CrossRef] [Green Version]
  92. Maseyk, F.J.F.; Mackay, A.D.; Possingham, H.P.; Dominati, E.J.; Buckley, Y.M. Managing Natural Capital Stocks for the Provision of Ecosystem Services. Conserv. Lett. 2017, 10, 211–220. [Google Scholar] [CrossRef]
  93. Geepu, M.; Tiepoh, N.; Reimer, B. Social Capital, Information Flows, and Income Creation in Rural Canada: A Cross-Community Analysis 1 Social Capital, Information Flows, and Income Creation in Rural Canada: A Cross-Community Analysis. J. Sociol. Econ. 2004, 33, 427–448. [Google Scholar]
  94. Krishna, A. Moving from the stock of social capital to the flow of benefits: The role of agency. World Dev. 2001, 29, 925–943. [Google Scholar] [CrossRef]
  95. Hasan, M.M.; Habib, A. Social capital and idiosyncratic return volatility. Aust. J. Manag. 2019, 44, 3–31. [Google Scholar] [CrossRef]
  96. Ployhart, R.E.; Weekley, J.A.; Ramsey, J. The Consequences of Human Resource Stocks and Flows: A Longitudinal Examination of Unit Service Orientation and Unit Effectiveness. Acad. Manag. J. 2009, 52, 996–1015. [Google Scholar] [CrossRef]
  97. Park, T.Y.; Park, J. Managing stocks and flows of human capital: Inflow, outflow, and instability. In Proceedings of the 74th Annual Meeting of the Academy of Management, AOM 2014, Philadelphia, PA, USA, 1–5 August 2014; pp. 1100–1105. [Google Scholar]
  98. Weisz, H.; Suh, S.; Graedel, T.E. Industrial ecology: The role of manufactured capital in sustainability. Proc. Natl. Acad. Sci. USA 2015, 112, 6260–6264. [Google Scholar] [CrossRef] [PubMed] [Green Version]
  99. Lennox, J.A.; Turner, G.M. Modelling Manufactured Capital Stocks and Material Flows in the Australian Stocks and Flows Framework. In Handbook of Input-Output Economics in Industrial Ecology; Springer: Dordrecht, Germany, 2009; pp. 77–97. [Google Scholar]
  100. Ekins, P.; Medhurst, J. The European Structural Funds and Sustainable Development: A Methodology and Indicator Framework for Evaluation. Evaluation 2006, 12, 474–495. [Google Scholar] [CrossRef]
  101. Lowery, B. “Knowing Beyond Measurement”: Integrating Sustainability Indicators and Storytelling in an Alternative Approach to Sustainable Development in Rural Newfoundland and Labrador. Ph.D. Thesis, Memorial University of Newfoundland, St. John’s, NL, Canada, 2020. [Google Scholar]
  102. Dernis, M.; Vidal, L.-A.; Marle, F.; Ouerdane, W.; da Costa, P. Aide à la sélection de stratégies pour apporter des valeurs durables à des pays hôtes en contexte pétrolier. In Proceedings of the Congrès International de Génie Industriel CIGI, Compiègne, France, 3–5 May 2017. [Google Scholar]
  103. Kulig, A.; Kolfoort, H.; Hoekstra, R. The case for the hybrid capital approach for the measurement of the welfare and sustainability. Ecol. Indic. 2010, 10, 118–128. [Google Scholar] [CrossRef]
  104. Roca, L.C.; Searcy, C. An analysis of indicators disclosed in corporate sustainability reports. J. Clean. Prod. 2012, 20, 103–118. [Google Scholar] [CrossRef]
  105. Sustainable Development Solutions Network (SDSN). Indicators and a Monitoring Framework for the Sustainable Development Goals—Launching a Data Revolution for the SDGs; Sustainable Development Solutions Network (SDSN): Paris, France, 2015. [Google Scholar]
  106. Keeney, R.L. Applying value-focused thinking. Mil. Oper. Res. 2008, 13, 6–17. [Google Scholar] [CrossRef]
  107. Steward, D.V. Design Structure System: A method for managing the desing of complex systems. IEEE Trans. Eng. Manag. 1981, EM-28, 71–74. [Google Scholar] [CrossRef]
  108. Carrascosa, M.; Eppinger, S.D.; Whitney, D.E. Using the design structure matrix to estimate product development time. In Proceedings of the ASME 1998 Design Engineering Technical Conferences, Atlanta, GA, USA, 13–16 September 1998; pp. 1–10. [Google Scholar]
  109. Browning, T.R.; Deyst, J.J.; Eppinger, S.D.; Whitney, D.E. Complex System Product Development: Adding Value by Creating Information and Reducing Risk. In Proceedings of the Tenth Annual International Symposium INCOSE 2000, Minneapolis, MN, USA, 16–20 July 2000; Volume 9. [Google Scholar]
  110. Danilovic, M.; Browning, T.R. Managing complex product development projects with design structure matrices and domain mapping matrices. Int. J. Proj. Manag. 2007, 25, 300–314. [Google Scholar] [CrossRef] [Green Version]
  111. Sosa, M.E.; Eppinger, S.D.; Rowles, C.M. A Network Approach to Define Modularity of Components in Complex Products. J. Mech. Des. 2007, 129, 1118. [Google Scholar] [CrossRef]
  112. Marle, F.; Vidal, L.-A.; Bocquet, J.-C. Interactions-based risk clustering methodologies and algorithms for complex project management. Int. J. Prod. Econ. 2013, 142, 225–234. [Google Scholar] [CrossRef]
  113. Fu, Y.; Li, M.; Chen, F. Impact propagation and risk assessment of requirement changes for software development projects based on design structure matrix. Int. J. Proj. Manag. 2012, 30, 363–373. [Google Scholar] [CrossRef]
  114. Feng, W.; Crawley, E.F.; De Weck, O.; Keller, R.; Robinson, B. Dependency structure matrix modelling for stakeholder value networks. In Proceedings of the 12th International DSM Conference, Cambridge, UK, 22–23 July 2010. [Google Scholar]
  115. Hein, A.M.; Jankovic, M.; Farel, R.; Yannou, B. A Data- and Knowledge-Driven Methodology for Generating Eco-Industrial Park Architectures. In Proceedings of the ASME International Design Engineering Technical Conferences and Computers and Information in Engineering Conference IDETC, Charlotte, NC, USA, 21–24 August 2016. [Google Scholar]
  116. Danilovic, M.; Sandkull, B. The use of dependence structure matrix and domain mapping matrix in managing uncertainty in multiple project situations. Int. J. Proj. Manag. 2005, 23, 193–203. [Google Scholar] [CrossRef] [Green Version]
  117. Eichinger, M.; Maurer, M.; Lindemann, U. Using Multiple Design Stucture Matrices. In Proceedings of the International Design Conference, Dubrovnik, Croatia, 15–18 May 2006. [Google Scholar]
  118. Bartolomei, J.E.; Hastings, D.E.; de Neufville, R.; Rhodes, D.H. Engineering Systems Multiple-Domain Matrix: An organizing framework for modeling large-scale complex systems. Syst. Eng. 2012, 15, 41–61. [Google Scholar] [CrossRef]
  119. Siyam, G.I.; Kirner, K.G.M.; Wynn, D.C.; Lindemann, U.; Clarkson, P.J. Value and waste dependencies and guidelines. In Proceedings of the 14th International Dependency and Structure Modelling Conference, Kyoto, Japan, 13–14 September 2012; pp. 65–78. [Google Scholar]
  120. Jean, C. Comment Réussir L’Intégration de Systèmes Technologiques Innovants au Sein de Systèmes Complexes Organisationnels? Application à la TéLémedecine en France. Ph.D. Thesis, Ecole Centrale Paris, Paris, France, 2013. [Google Scholar]
  121. Kamari, A. A Multi-Methodology and Sustainability-Supporting Framework for Implementation and Assessment of a Holistic Building Renovation: Implementation and Assessment of a Holistic Sustainable Building Renovation. Ph.D. Thesis, Aarhus University, Aarhus, Denmark, 2017. [Google Scholar]
  122. UNIDO. Global Value Chains and Development: Unido’s Support towards Inclusive and Sustainable Industrial Development; UNIDO: Vienna, Austria, 2015. [Google Scholar]
  123. Weiss, M. The Role of Local Content Policies in Manufacturing and Mining in Low-and Middle-Income Countries; UNIDO: Vienna, Austria, 2016. [Google Scholar]
  124. Tong, Y.-S.; Kokko, A. Linking Fdi and Local Firms for Global Value Chain Upgrading: Policy Lessons From Samsung Mobile Phone Production in Viet Nam; UNIDO: Vienna, Austria, 2019. [Google Scholar]
  125. UNIDO. The Unido Approach to Cluster Development—Key Principles and Project Experiences; UNIDO: Vienna, Austria, 2020. [Google Scholar]
  126. UNIDO. Short Food Supply Chains for Promoting Local Food on Local Markets; UNIDO: Vienna, Austria, 2020. [Google Scholar]
  127. Stamford, L.; Azapagic, A. Sustainability indicators for the assessment of nuclear power. Energy 2011, 36, 6037–6057. [Google Scholar] [CrossRef]
  128. Horsley, J.; Prout, S.; Tonts, M.; Ali, S.H. Sustainable livelihoods and indicators for regional development in mining economies. Extr. Ind. Soc. 2015, 2, 368–380. [Google Scholar] [CrossRef]
  129. Liu, Y.; Huang, C.; Wang, Q.; Luan, J.; Ding, M. Assessment of Sustainable Livelihood and Geographic Detection of Settlement Sites in Ethnically Contiguous Poverty-Stricken Areas in the Aba Prefecture, China. ISPRS Int. J. Geo-Inf. 2018, 7, 16. [Google Scholar] [CrossRef] [Green Version]
  130. Doran, G.T. There’s a S.M.A.R.T. Way to Write Management’s Goals and Objectives. Manag. Rev. 1981, 70, 35–36. [Google Scholar]
  131. Steffens, G.; Cadiat, A.-C. Les Objectifs SMART 5 Critères pour des Objectifs Efficaces; 50Minutes.fr Lemaître Publishing: Bruxelles, Belgium, 2015. [Google Scholar]
  132. Wu, Y.; Dai, R.; Xu, Y.; Han, J.; Li, P. Statistical Assessment of Water Quality Issues in Hongze Lake, China, Related to the Operation of a Water Diversion Project. Sustainability 2018, 10, 1885. [Google Scholar] [CrossRef] [Green Version]
  133. Raveed, S.R.; Renforth, W. State Enterprise-Multinational Corporation Joint Ventures: How Well Do They Meet Both Partners’ Needs? Manag. Int. Rev. 1983, 1, 47–57. [Google Scholar]
  134. Oetzel, J.; Doh, J.P. MNEs and development: A review and reconceptualization. J. World Bus. 2009, 44, 108–120. [Google Scholar] [CrossRef]
  135. The Independent State of Papua New Guinea. Papua New Guinea Vision 2050; National Strategic Plan Taskforce; The Independent State of Papua New Guinea: Port Moresby, Papua New Guinea, 2011. [Google Scholar]
Figure 1. Subdivision of capital stocks into sub-capitals as a basis for the project ICV creation stocks and flows model.
Sustainability 13 05592 g001
Figure 2. Frequency analysis of project ICV creation indicators in the proposed capital stocks and flows model.
Sustainability 13 05592 g002
Figure 3. Decision-makers/host country objectives matrix in this case.
Sustainability 13 05592 g003
Figure 4. Host country objectives/capital stocks matrix in this case.
Sustainability 13 05592 g004
Figure 5. Capital stocks/flows matrix in this case.
Sustainability 13 05592 g005
Figure 6. Flows/ICV actions matrix in this case.
Sustainability 13 05592 g006
Figure 7. ICV actions/strategies matrix in this case.
Sustainability 13 05592 g007
Figure 8. The complete process with a navigation process through a 5-matrix chain.
Sustainability 13 05592 g008
Publisher’s Note: MDPI stays neutral with regard to jurisdictional claims in published maps and institutional affiliations.

