1. Introduction
The rate of the youth Not Employed, in Education, or Training (NEET) rose in the European Union (EU) as a consequence of the financial crisis of 2008 [
1]. The increase in unemployment hit the youth hard, especially in Southern Europe. Thus, it became much more difficult to find a job and many lost all hope to have a decent future. EU member states’ reaction to the problem was the creation of the Youth Guarantee [
2], which nowadays is the main European policy addressing the issue. Its development started in 2013 and it was implemented for the first time in 2014. Since then, it has faced very different situations: the aftermath of the 2008 financial crisis and the impact of the COVID-19 crisis, both moments that had a great impact on the expectations of the youth. Within this framework, we try to answer the question of whether one should consider the Youth Guarantee a success or a failure.
By answering that question, we aim to contribute to the policy evaluation and future improvements that may lead to a sustainable NEET situation. With this article, we present a scientific analysis of the Youth Guarantee that shows hidden problems, highlights good practices, and provides policy recommendations and analytical tools for the benefit of the policy. Consequently, to answer this question of the policy’s success, we firstly review what research revealed, directly and indirectly, about the Youth Guarantee. We built on the findings of other authors to better understand the context of the policy and its repercussions. We take a second step in that direction by creating some statistical tools that helped us show the achievements of the Youth Guarantee during its implementation. It clarifies how far away the policy is from solving the NEET problem. Based on all the collected knowledge and analyses, we include conclusions on what one can learn from the data, which elements are most relevant, and which aspects should be reconsidered in order to contribute to the improvement of the Youth Guarantee.
This article’s original contribution relies on its analytical approach. It is not the first analysis of the Youth Guarantee, but most of the research about the policy depends on macroeconomic data and not policy data [
3,
4]. Although many studies tried to judge the policy based on the general context and macroeconomic indicators, we limit our approach to direct policy results. We also add extra layers of modelization to the previous superficial use of the policy stats [
5], without forgetting the general context in which the Youth Guarantee is implemented.
We also signal the relevance of including procedures to collect standardized data within this kind of policy. We confirm the thesis of previous authors and show how this can help the policy evaluation in a way that can directly lead to policy improvement [
6]. However, regarding the Youth Guarantee, we reveal flaws, errors, and biases within the published datasets. This finding is crucial, because without its acknowledgement, one would assert incorrect conclusions guided by those biases and/or one could not realize that in the databases there are some cases of a relevant lack of information.
Due to the novelty of the policy, there are many gaps that new research can fill. Therefore, we decided to highlight mistakes in previous research that led to wrong conclusions. In this article we show that, in many cases, those wrong results were caused by a need to rush into conclusions. We show that part of them are a consequence of not considering the time the policy needed to be completely implemented, which translates to correctly evaluating the fitness of the Youth Guarantee.
Following this introductory section, we present the theoretical framework, where we discuss the major contributions to the analysis of the Youth Guarantee. We include the main contributions to the debate of the policy, as well as the aspects that we considered most relevant to help us evaluate its success. Right after that section, we explain the methodology we used in our research: a statistical approach based on the Youth Guarantee datasets. We show the results of its implementation in the fourth section, where we present the statistics and contrast different variables to check the policy’s performance. To conclude the article, we present our findings in context with previous research results. We also highlight the added value of this text, possible ways to modify the policy based on our findings, and different options to improve the analysis to further contribute to the topic.
2. Theoretical Framework
The objective of the Youth Guarantee is to tackle the NEET problem by aiming “to ensure that all young people receive a good-quality offer of a job, apprenticeship, traineeship, or continued education within 4 months of leaving formal education or becoming unemployed” [
7] (p. 6). To achieve that goal, the policy assists those who join the Youth Guarantee scheme options that allow them to choose between the four options that we previously mentioned (job, apprenticeship, traineeship, and education). The mechanisms that the EU member states implemented are diverse, but many authors have already tried to assess whether one should consider the Youth Guarantee a successful policy [
4,
8,
9]. Nonetheless, in order to be able to achieve such a goal, one should first state what is defined as success and what is considered a failure. The limits of that dichotomy depend on where the level of the goals are established. One could conclude that the policy was a success or a failure with the same results, just because one considers that they were, or were not, enough. In the case of the Youth Guarantee, the policymakers fixed its goals at the level of the total disappearance of the NEET problem. However, anybody who understands the situation knows that it is an impossible objective. Thus, those who were responsible for the policy evaluation understood that those levels were an ideal, not a reachable goal [
7] (p. 16).
The most simple approach to evaluating the policy results would be a comparison between the NEET rate before and after the implementation of the Youth Guarantee. In this case, the straightforward answer is that the situation improved, but the current NEET rates are still higher than before the 2008 financial crisis started [
10]. However, this approach lacks relevant information, as it does not take into consideration other factors that may help explain the policy results.
Following a holistic approach, there are those who considered the general context. For example, Papadakis et al. [
11] signaled the relevance of macroeconomic and structural factors in the employability of the youth. The authors linked the changes in the situation not so much with active labor market policies like the Youth Guarantee, but with the general economic improvement and other social factors. In the case of the Youth Guarantee, the data regarding the policy impact and the dimension of its budget [
6], in comparison with the size of the labor market, support this argument. That was the case of Pesquera and Strand [
12], who considered that despite the positive and/or negative aspects of the Youth Guarantee, in many cases this type of measure could not compete with the size of the labor market and the relevance of other factors. Both the available financial resources and policy measures are considerably smaller in comparison with the mechanisms that have an impact on the overall economy.
In line with that unequal situation, we find that these types of policies are usually highly limited, even before their implementation, because of the amount of resources allocated: “the potential impact of some of the national measures has been hampered by insufficient funding and the economic crisis, which has had a particularly detrimental impact on demand for youth employment” [
13] (p. 65). Despite the ideal plans for the Youth Guarantee to achieve its goals, the budgets were insufficient considering the policy goals. This criticism appeared again when Cabasés i Piqué et al. [
14] researched the first policy results. According to their conclusions, the lack of policy success could be explained by the fact that despite including acceptable measures to improve the NEET situation, the institutions providing the funds did not provide enough resources for those measures [
2]. As a consequence, the implementation of the Youth Guarantee lacked the human resources needed to achieve the results as it was originally planned.
To achieve its goals, the policy measures should address the issues the policy aims to tackle. Nonetheless, authors such as Caliendo and Schmidl concluded that some of the measures included in the Youth Guarantee in some cases are not adequate to solve the NEET situation [
15]. The authors who defended this position argued that despite its intentions, some mechanisms included in this policy are not suitable to reduce the NEET rate or to create long-term opportunities for NEETs. For example, as Marques and Hoerisch [
16] remarked, the success of the measures also depends on the national skill formation systems. Meanwhile, Bratti et al. found no significant correlation between vocational training programs in the Youth guarantee and the probability of being employed [
17], or signaled that basic steps, such as registration via public employment services, can hinder the policy results because of the lack of institutional trust [
18].
Another aspect that researchers have stressed is the importance of the broad framework of the Youth Guarantee. The Youth Guarantee presents a guideline for countries [
19], which implies that its implementation varies depending on the structure of each welfare regime [
20]. This characteristic can be seen as a problem of a lack of definition or as a positive element that implies flexibility. On the one hand, it tries to provide general solutions for all of Europe despite the fact that the NEET situation is different in each country, as are the ideas of youth, work, and even the label of being a NEET. This may imply that the policy implementation depends on the national legislation and the usual way to proceed regarding the implementation of this kind of policy [
21]. Nonetheless, research such as that done by Bacher et al. showed that the differences between regions regarding their situation and their economic market are considerably relevant [
22]. On the other hand, that flexibility allows some countries, regions, and even localities to adapt the policy when their national policy framework allows them to do so. Cefalo et al. [
23] revealed that this feature benefits youth labor market integration by implementing better adapted measures to each place. In addition, having the focus on just the countries may influence the judgment on the success of the policy, as it is usual to only consider the countries as a whole entity without discussing the differences that may explain the disparities in the results within each country.
When considering the Youth Guarantee, another factor that has an impact on the number of NEETs is the migration within Europe. In the countries with higher NEET rates, these migration trends have surged [
24]. Many NEETs emigrated in search for opportunities in European countries with lower unemployment rates, as we can see in examples such as the work done by Salamońska and Czeranowska [
25]. Due to the size and barriers linked to this phenomenon, it is only a part of the whole equation, but we cannot omit the existence and effect of this process in the policy results.
However, migrants belong to the most vulnerable groups, and other researchers put their focus on analyzing how the Youth Guarantee considers and includes the most vulnerable groups in general. This was the case of Selenko and Pils [
26], who showed that, despite being hit the most, in many cases the policy does not reach the most vulnerable ones or does not offer them suitable solutions. The authors asserted that the policy fails those groups in comparison to others. Thus, it does not contribute to reducing the NEET problem as much as it should. According to Selenko and Pils [
26], the improvements in the NEET rate caused by the policy do not compensate for the inherent inequalities at the root of the NEET problem. Meanwhile, studies such as the one done by Hora and Sirovátka [
27] identified the failures in targeting those groups and the issues of adapting the policy to the needs the most vulnerable youth have.
In order to be able to correctly adapt any policy, data from the policy is essential. No policy evaluation is adequately done without input. In this case, the internal framework of the Youth Guarantee is a factor that helps its evaluation. The policy includes a set of indicators to be collected by the agencies that implement it. Those indicators are included in public databases to facilitate the policy evaluation [
28]. This framework creates the opportunity to compare how the agents are implementing the policy, which makes it easier to highlight policy failures and helps with the detection of other possible issues. Such a tool was included to guide policymakers into modifications that can lead to the improvement of the Youth Guarantee, as it already happened [
29]. Nevertheless, the usefulness of that information depends on the quality and quantity of the collected data, which is a challenge mentioned in the policy reports regarding the lack of data concerning some countries [
6].
3. Materials and Methods
The approach we implemented in this article was quantitative. The policy itself includes the Indicator Framework for Monitoring the Youth Guarantee, which establishes the main policy tools for data collection for evaluation [
28]. These databases are provided by the national agencies, who send the collected data to the European institutions and the EU makes them public. The European Commission published official reports [
6] with the data, including policy analysis of its first years based on internal data from the Youth Guarantee and external data, collected by Eurostat, related to the economic situation.
The dataset compiles two kinds of databases. The first refers to data obtained from secondary sources and it does not refer to the data derived from the policy (i.e., macroeconomic indicators). Those data were obtained through the services of Eurostat and included in the policy reports. It mainly refers to the key variables of NEET rate, which is collected via the Labour Force Survey. The second refers to the data derived directly from the policy, whose universe coincides with the sample size. However, there are a relatively high number of missing cases, highly depending on the countries and mainly affecting the information collected after the users left the Youth Guarantee. These data consist of the responses from all who joined the program, young people between 15 and 29 years, and their situation within the Youth Guarantee, whose sociodemographic composition is included in the reports [
6] but did not change substantially over time.
In this article we focus on the countries of the Mediterranean European Economic Area. We limited the scope to them because of their high NEET rates and common characteristics. Despite their shared geographic situation around the Mediterranean Sea and in the south of Europe, we acknowledge that there are substantial differences between them. They have the same common cultural ground shared through their history but also present considerable differences. From the socio-cultural perspective, there are relevant social concepts, such as the ideas of family, work, and education, that unite the group. However, there are other aspects that separate them, such as their size or governmental structures. Their labor markets may differ, but they experienced similar economic issues in recent years (such as high unemployment rates, construction bubbles, and high debt problems) and mainly because the percentage of NEETs is constantly higher in that region than in the European Union [
30].
Within our scope were also the data for the European Union as a whole, which we included in the analysis. Thus, we provide a reference for the general context regarding the NEET situation in Europe. In this case, it is represented by the EU28 and the EU average. We acknowledge that the most adequate indicator is the EU28 framework, which refers to the real level of the indicator according to the weight of the total EU28 population. However, it is not always available. Thus, we had to use the EU average in one case, an indicator that refers to the average of the EU countries that provided data.
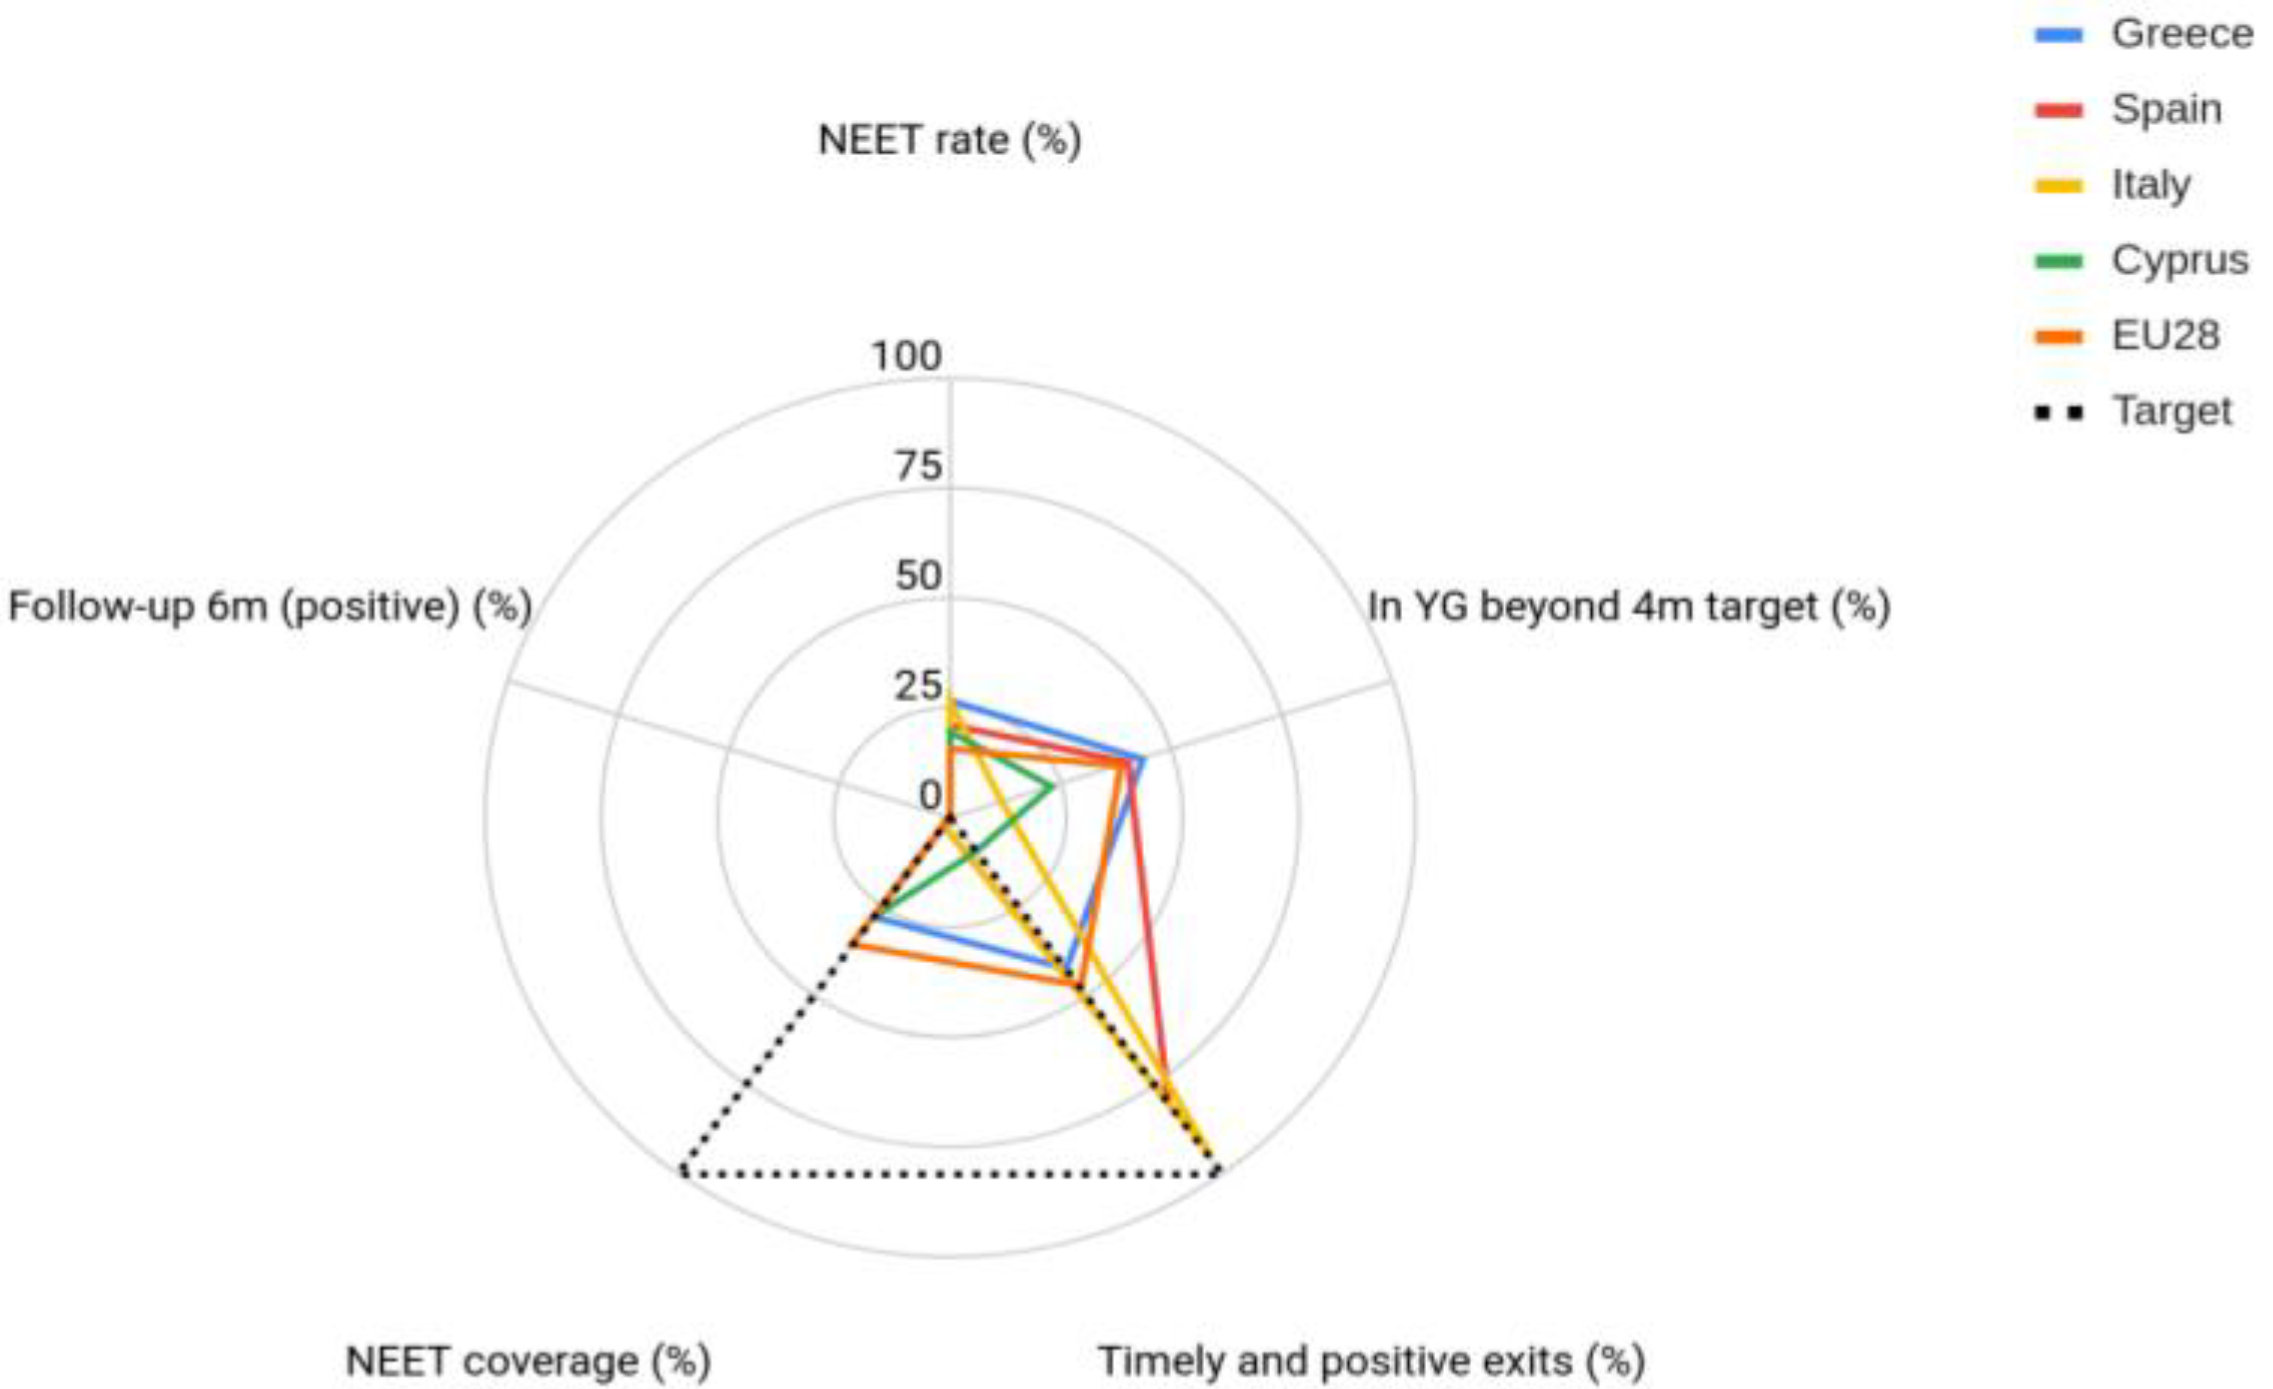
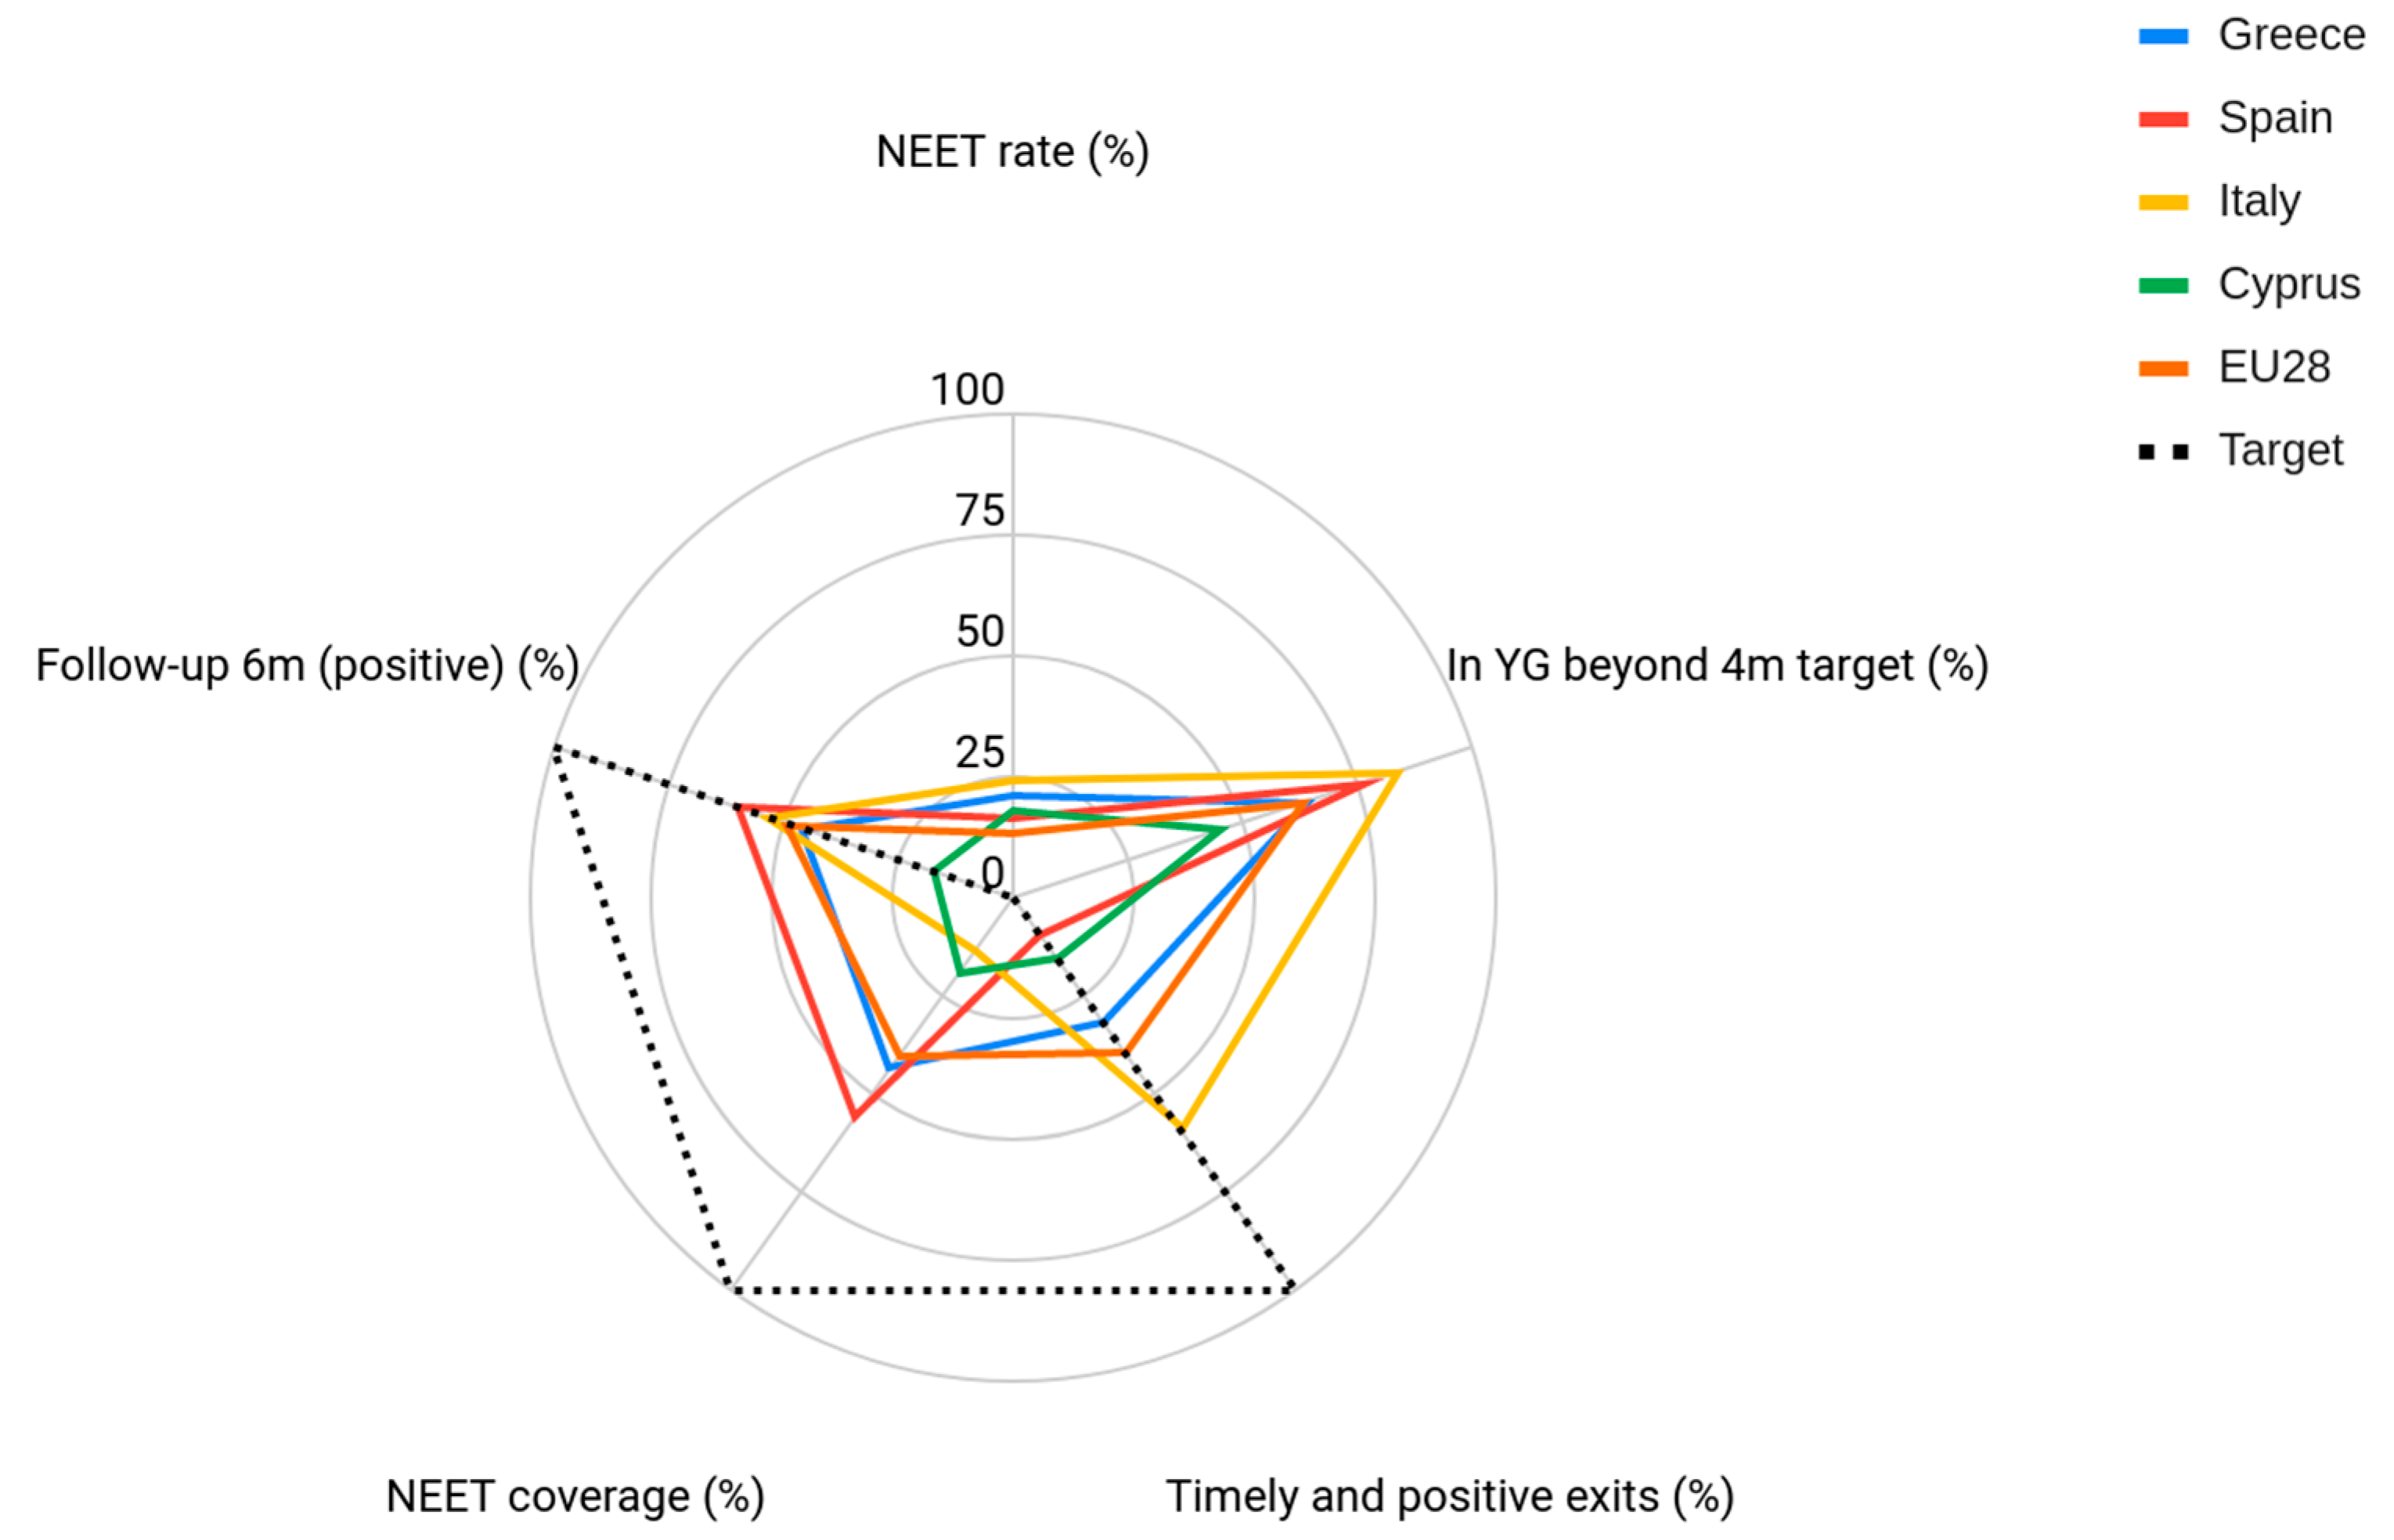
For our analysis, firstly we presented descriptive statistics from the Youth Guarantee. They illustrate the initial goals set by the policymakers and the real level of success of the policy. We displayed the numbers from the published reports of the Youth Guarantee [
6] to compare the goals and the achievements. These were measured by the main policy indicators, which were (i) NEET rate, (ii) in Youth Guarantee beyond the 4-month target, (iii) timely and positive exits, (iv) NEET coverage, and (v) positive follow-up after 6 months. NEET rate refers to the percentage of young people who are NEETs of the total youth. In Youth Guarantee beyond the 4-month target indicates the percentages of users of the Youth Guarantee who were still waiting for an offer after the deadline of 4 months. Timely and positive exits includes the percentage of exits from the program that were achieved before the deadline of 4 months and that ended positively (the users took an offer) out of the total number of exits. NEET coverage contains the information of the percentage of the NEET population that was covered by the Youth Guarantee. Finally, positive follow-up after 6 months refers to the percentage of former users of the Youth Guarantee who, 6 months after their exit from the program, were in a positive situation (i.e., they were working, training, and/or studying). We remark that for each indicator, the policy established a target, with 0% for the NEET rate and the people in the scheme beyond 4 months and 100% for the other three indicators. These targets helped the policy evaluation and are used as goals of the Youth Guarantee. However, they are only ideal, considering that the policy reports mentioned that:
“Even if these targets are theoretical and are unlikely to ever be fully achievable in practice, it is clear that the shape of the EU average results is quite different from the ideal” [
7] (p. 16).
In this text we focused on explanations for the levels of those main indicators. Thus, we gave special attention to the relations between the data. We acknowledge that in the previous section we illustrated that the NEET problem is multidimensional. However, in the analysis we only considered one dimension, the policy itself. We did not deny other relations, but we aimed to focus our attention on the effects generated only through the Youth Guarantee. In order to achieve this, our main tool was the linear regression model. Particularly, we contrasted the indicators in simple models. In our models we included just one variable against another, aiming to check how they varied by country and time.
In the graphs we present each data point, i, for the dependent variable,
yi, on the vertical axis and its corresponding value for the independent variable,
xi, on the horizontal axis. For the tendency lines, we looked for estimates according to the formula of the exponential regression model:
The array of variables we used includes:
NEET rate;
Timely and positive exits from the Youth Guarantee;
Policy NEET coverage;
Positive exits (the percentage of exits from the Youth Guarantee that ended in the user accepting an offer from the program);
Percentage of subsidized offers of the total number of Youth Guarantee offers;
Percentage of people who, 6 months after leaving the scheme, were NEETs (out of the total number of users who provided an answer);
Percentage of people whose situation after 6 months of leaving the program was unknown to the Youth Guarantee; and
Percentage of former policy users who were in a positive situation 12 months after leaving the Youth Guarantee.
The selection of these variables enabled us to track the policy performance, the relation between policy expansion, and its success, potential biases in the datasets, and the effect time had on the policy.
4. Results
In
Figure 1 and
Figure 2 we compare the situation between the key indicators collected in 2014 and those presented in the last report (for all of 2017). The only exception is the 2014 follow-up indicator, which was not available because it would refer to a previous period when the policy did not exist yet. In the figures we saw that the NEET rate for people aged 15–29 preceding the implementation of the Youth Guarantee in the EU was 15.3% in 2014, whereas its value in 2017 was 13.4%. That type of improvement was experienced in every studied country during that period (5.4% in Greece, 4.3% in Spain, 2.1% in Italy, and 1.9% in Cyprus). However, and following the multifactor analysis, this amelioration should not be directly interpreted as a direct consequence of the Youth Guarantee. As previously mentioned, there are many elements that influence the actual NEET rate. The NEET coverage increased in all the study cases from 2014 to 2017 (53.8% in Spain, 15.5% in Greece, 11.2% in Italy, and 5% for the EU28) with the exception of Cyprus, where it decreased to 9.2%. The opposite happened to timely and positive exits, which only increased in Cyprus (6.1%) while decreasing in Spain (71%), Italy (36%), Greece (10.5%), and the EU28 (7.8%). Lastly, regarding the objective of not having users in the YG waiting longer than four months worsened in all study countries, from 20.5% in Greece to 72% in Italy. In summary, in general, the policy results were considerably far from its goals.
Nevertheless, we consider that presenting the indicators in the previous descriptive way did not add much extra value to the statistics. The value of the numbers was relevant, but it did not contribute to understanding the reasons behind that situation.
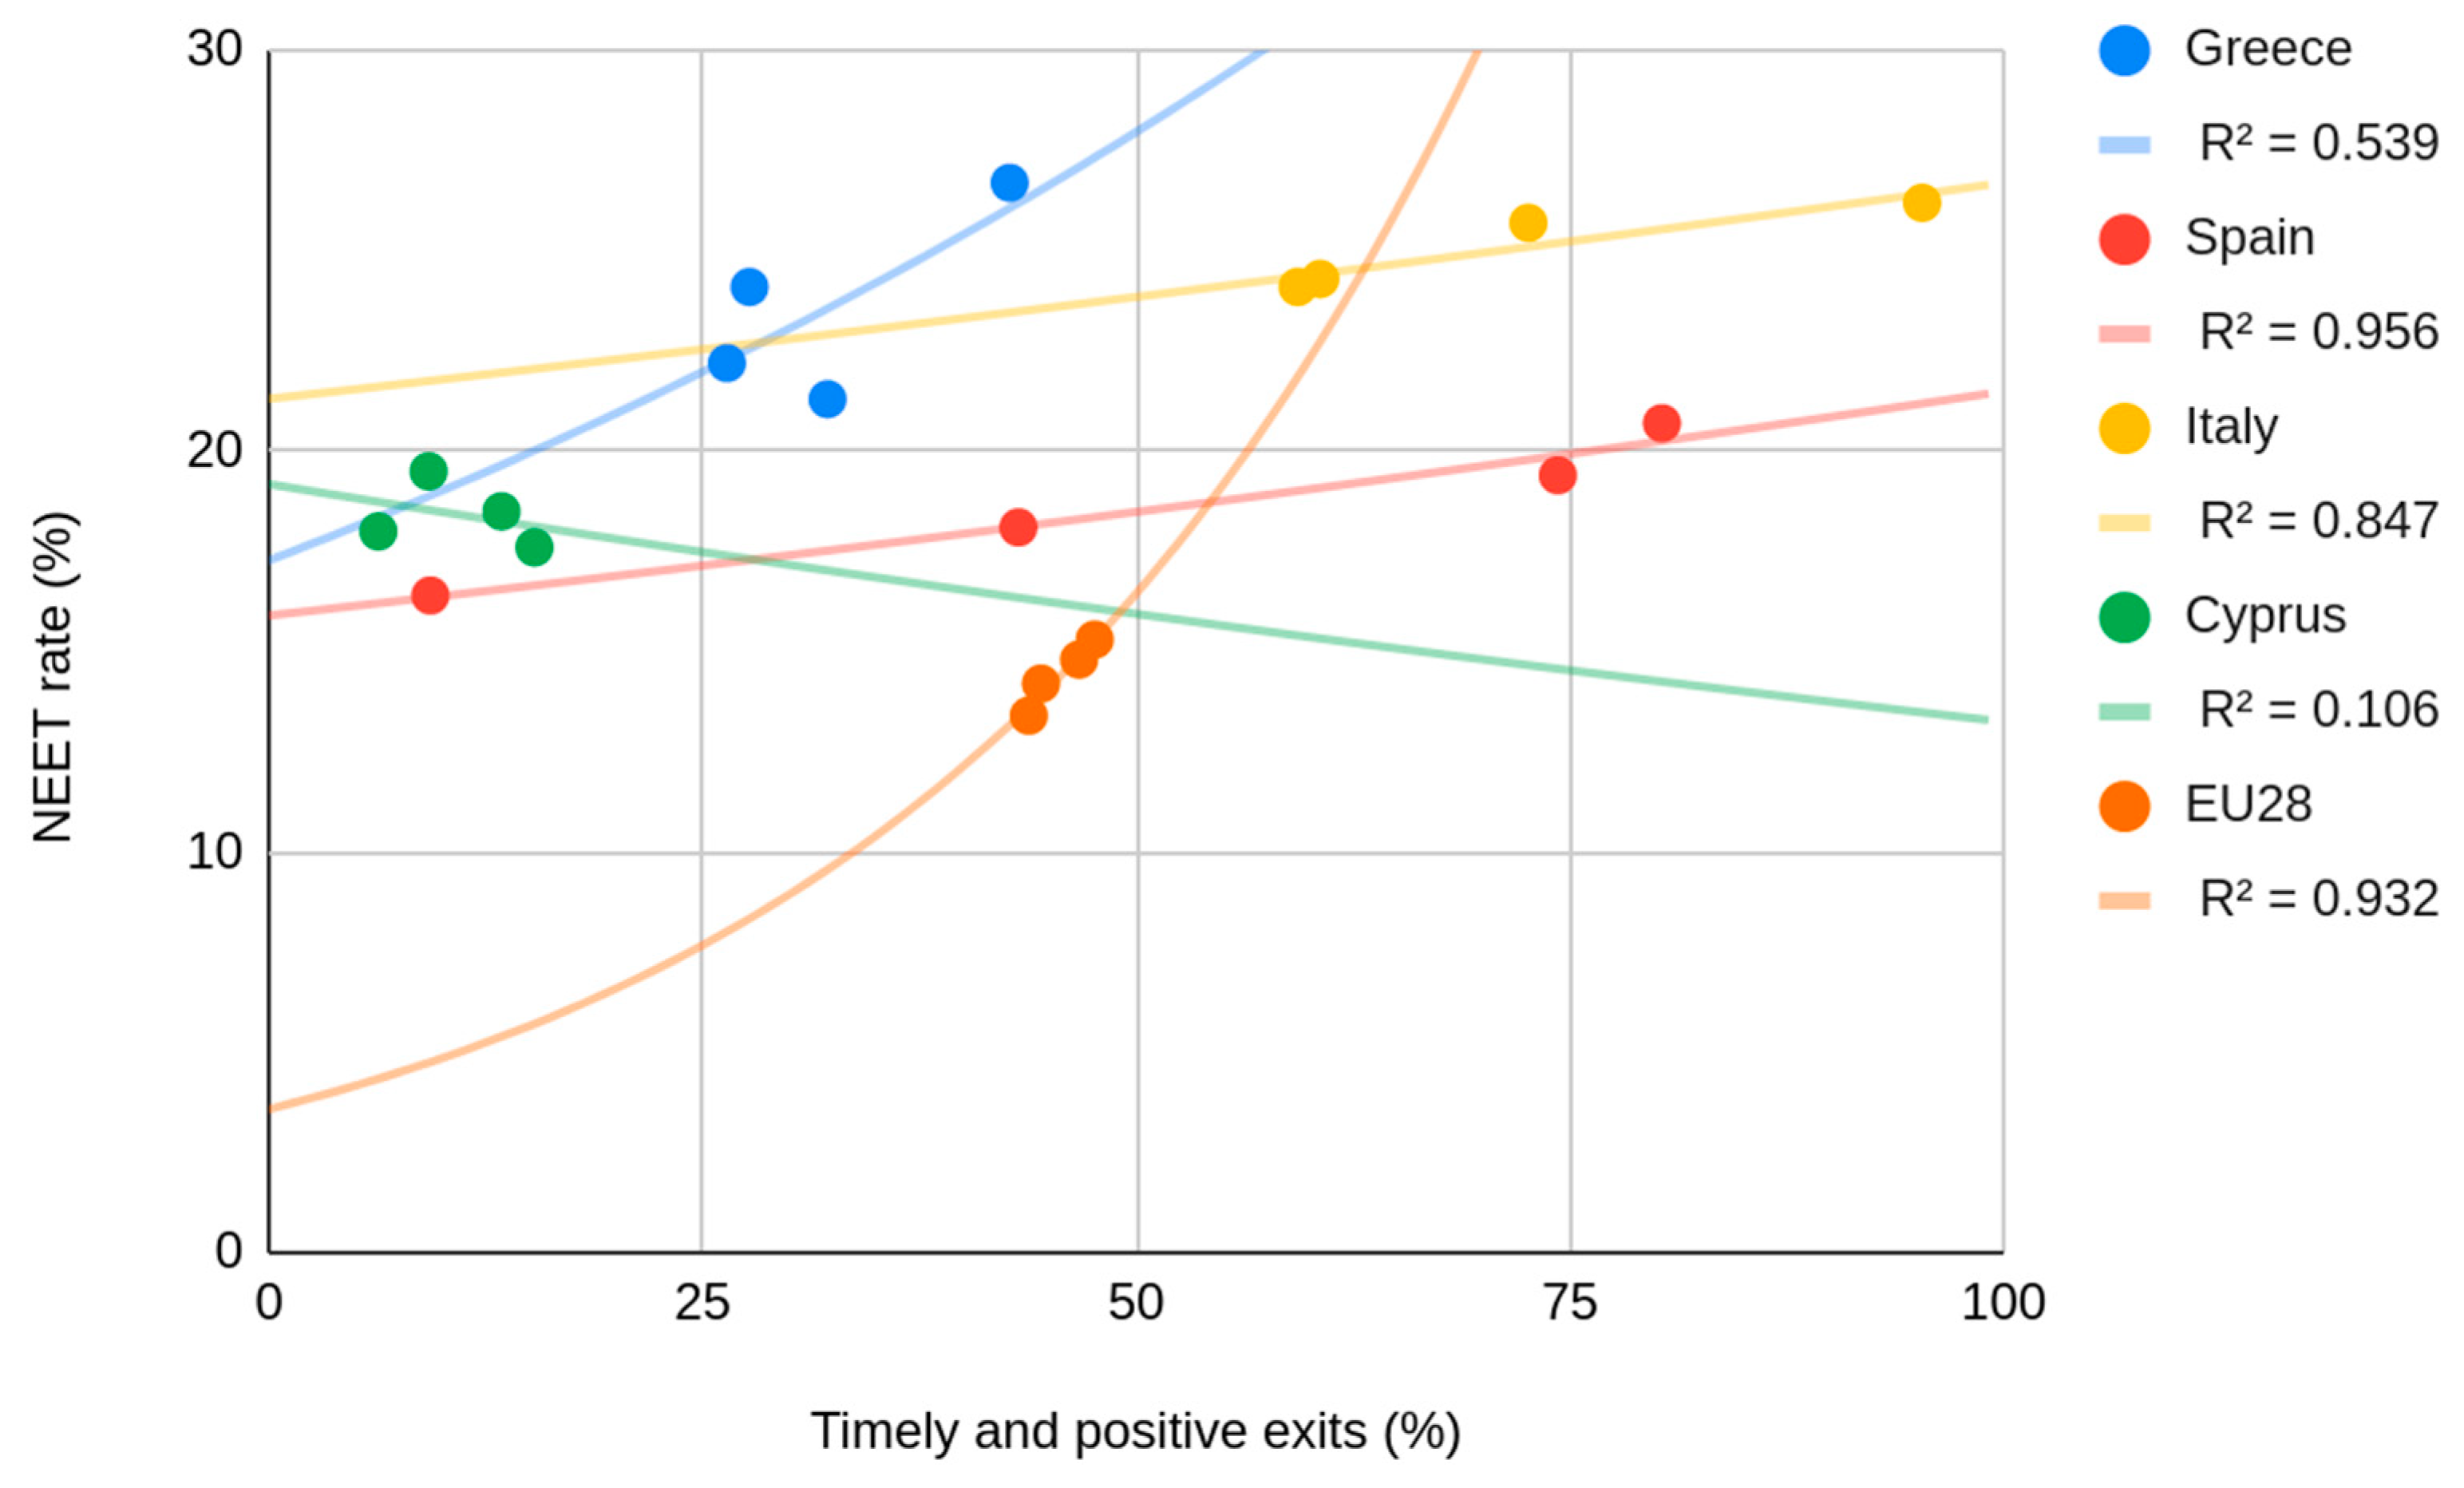
Therefore, in
Figure 3 we present the correlation between two of the main indicators: the NEET rate and the YG indicator of timely and positive exits. The NEET rate indicator contained the information of the main objective of the policy and the indicator of timely and positive exits provided information on the policy performance. As such, we modelled how the policy performance might influence the NEET rate in
Figure 3, where we show that the indicators were positively related for Greece, Spain, Italy, and EU28. This means that when the number of timely and positive exits increased, the NEET rate increased. Only in the case of Cyprus did we see the opposite trend, that the NEET rate decreased when the number of timely and positive exits increased. However, the R² value for Cyprus was very small (0.106), which means that the changes in timely and positive exits could only explain a small part of the changes in the NEET rate. Meanwhile, the R² value was considerably strong in the cases of Italy (0.845), EU28 (0.932), and Spain (0.956), and moderate in the case of Greece (0.539).
In the previous figure we show an apparent contradiction, which emerged from the simplification of the model. In
Figure 3 we explain a complex problem (the NEET rate changed) by just one indicator of performance. In other words, we did not include its context. Implementing a policy is a process influenced by internal factors (its range, dissemination, resources, etc.) and many external factors (social structure, political culture, etc.) [
31]. In this case, in the previous figure we did not consider the dissemination of the policy itself. Despite the fact that the Youth Guarantee is the biggest strategy tackling the NEET problem in Europe, it did not reach every NEET in the studied countries, as the descriptive statistics revealed.
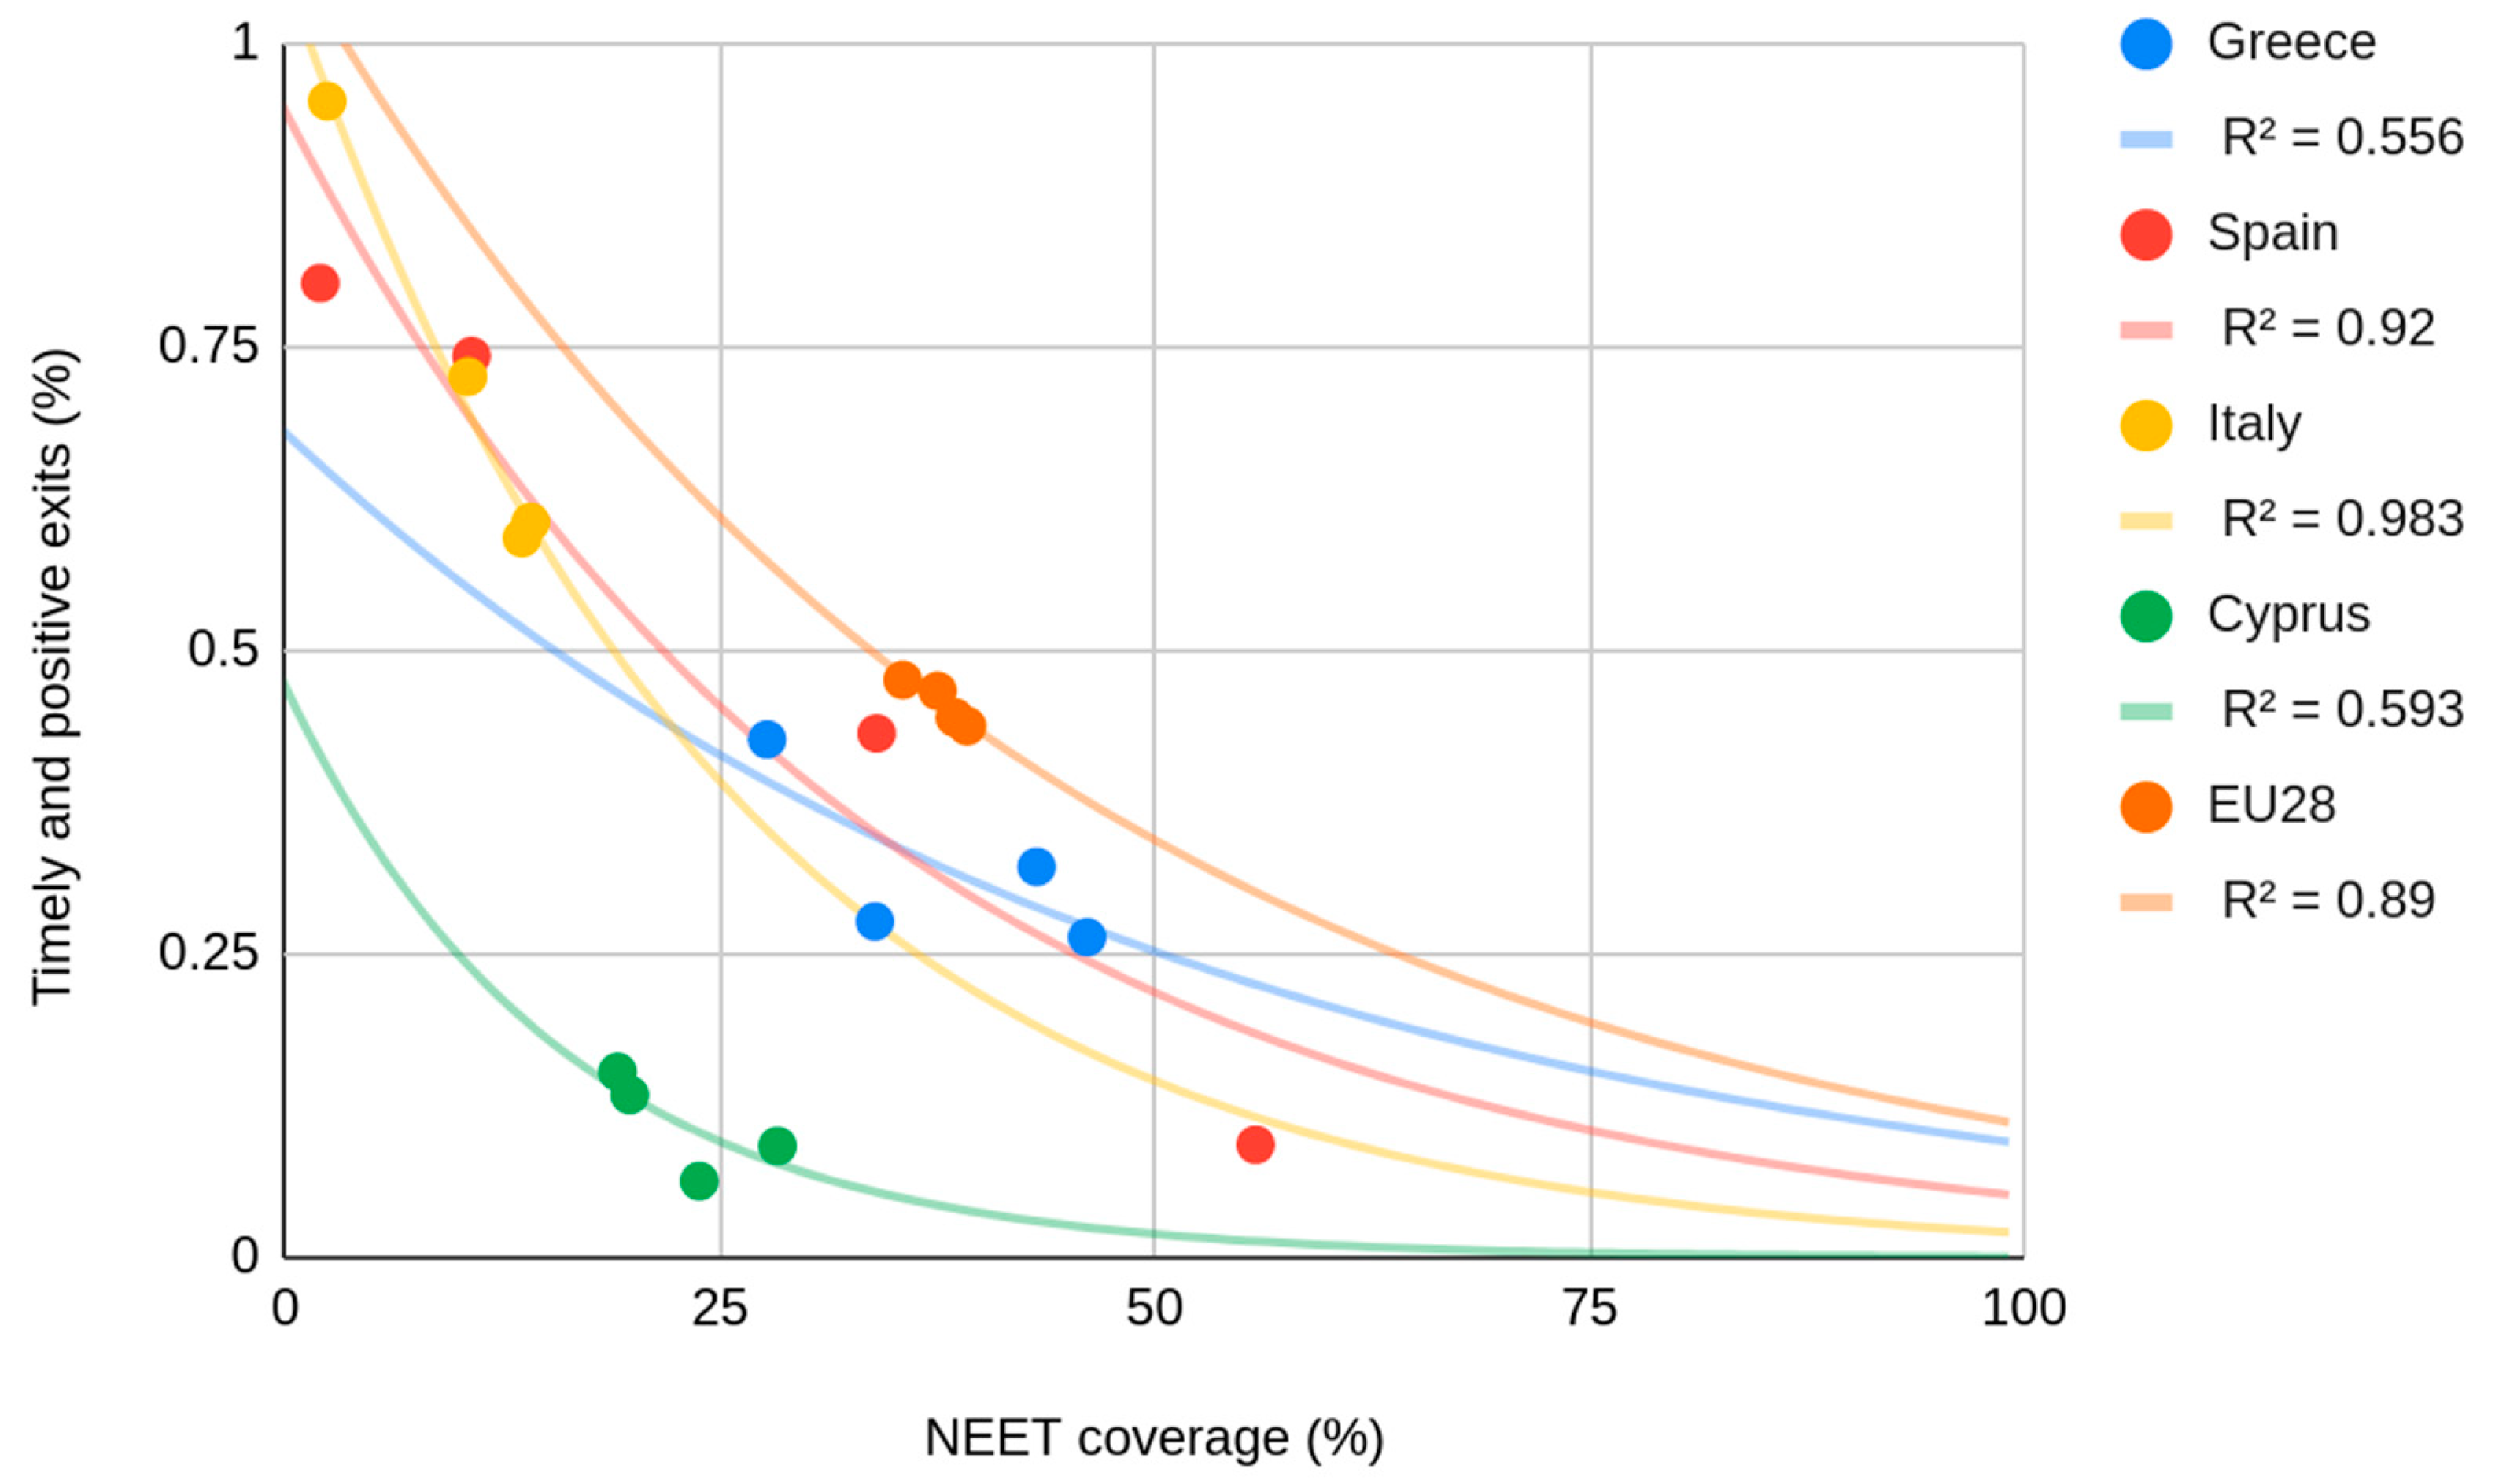
However, we decided to check the relation between the spread of the Youth Guarantee and its performance in
Figure 4, because we hypothesized that the shown effect of timely and positive exits on the NEET rate derived from the spread of the policy and its efficiency. In the chart we show the relation between the NEET coverage and the YG’s timely and positive exits. In this case, there was a negative tendency in every case. This means that when the NEET coverage increased, the percentage of timely and positive exits decreased. Regarding the explanatory value shown by the R², it revealed an impressive correlation for Italy (0.983), Spain (0.92), and EU28 (0.89). In the case of Cyprus (0.593) and Greece (0.556), the R² value was more moderate. This highlights that one of the policy issues is linked to its size. In other words, the policy performance worsened when more NEETs were reached.
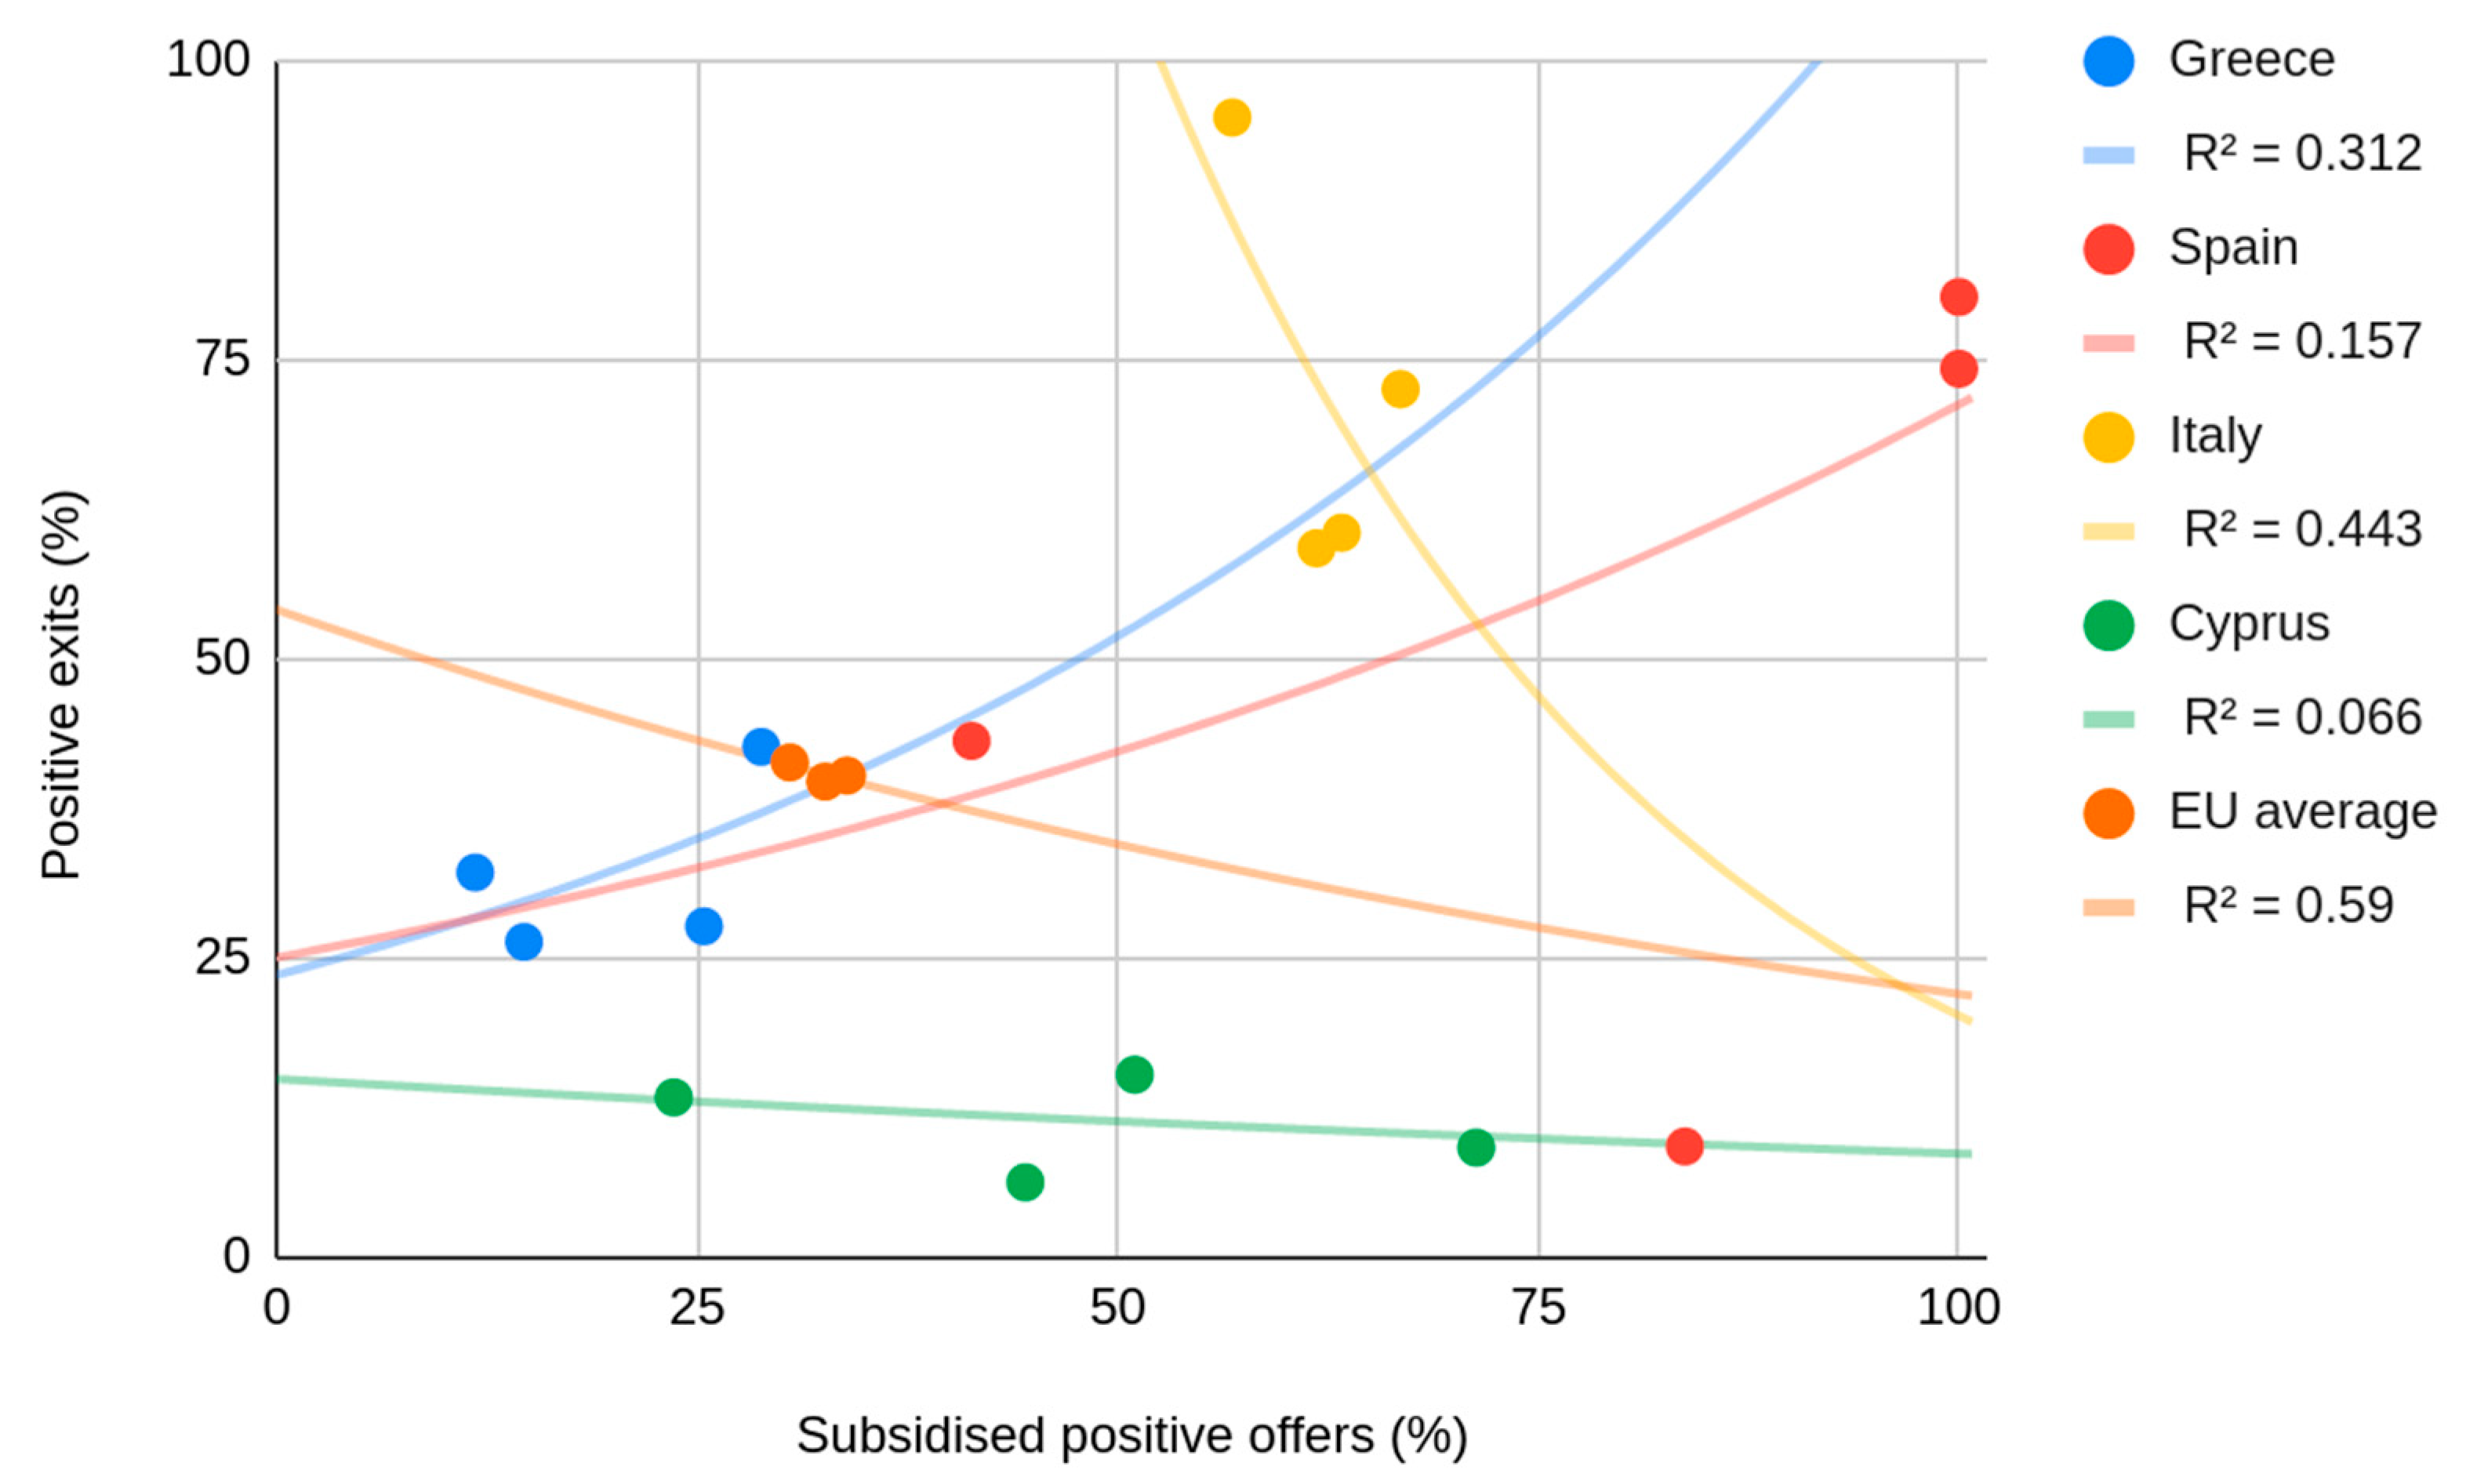
An option within the Youth Guarantee is the possibility to subsidize some or all of the offers included in the policy. As well as with other options of the policy, checking the data revealed that there were substantial differences between countries regarding the use of those subsidies. In
Figure 5, we checked the contribution of this mechanism by contrasting the percentage of positive exits and the percentage of subsidized positive offers in each study country and for the EU average. In
Figure 5 we show that there was a positive trend between the variables for Greece and Spain and a negative trend for Cyprus, Italy, and the EU average. We also reveal that the value of the R², the coefficient of determination, was almost non-existent for Cyprus (0.066) and very small for Spain (0.157) and Greece (0.312). Meanwhile, the Italy (0.443) and EU (0.59) averages presented higher R² values. Therefore, we can conclude that the option of subsidizing offers had almost no effect on the performance of the Youth Guarantee, and if it had some, it was mainly negative.
Regarding the Youth Guarantee, there are some issues concerning the quality of its evaluation. The missing cases made evident the possibility of biases in the provided data. As signaled in the policy reports [
6], there are big differences between the countries and the percentage of people reached, and who gave feedback after leaving the Youth Guarantee. This data consisted of the responses of former users of the Youth Guarantee 6, 12, and 18 months after leaving the program. They reported whether they were in a positive (employment, apprenticeship, traineeship, or education) or in a negative (unemployed or inactive) situation. In the database, we can see that some countries did not collect this information and some only collected these data for the “after six months” period. In addition, in many cases the former users were counted as “unknown,” due to the lack of information regarding their situation. This lack of information may have produced a selection bias.
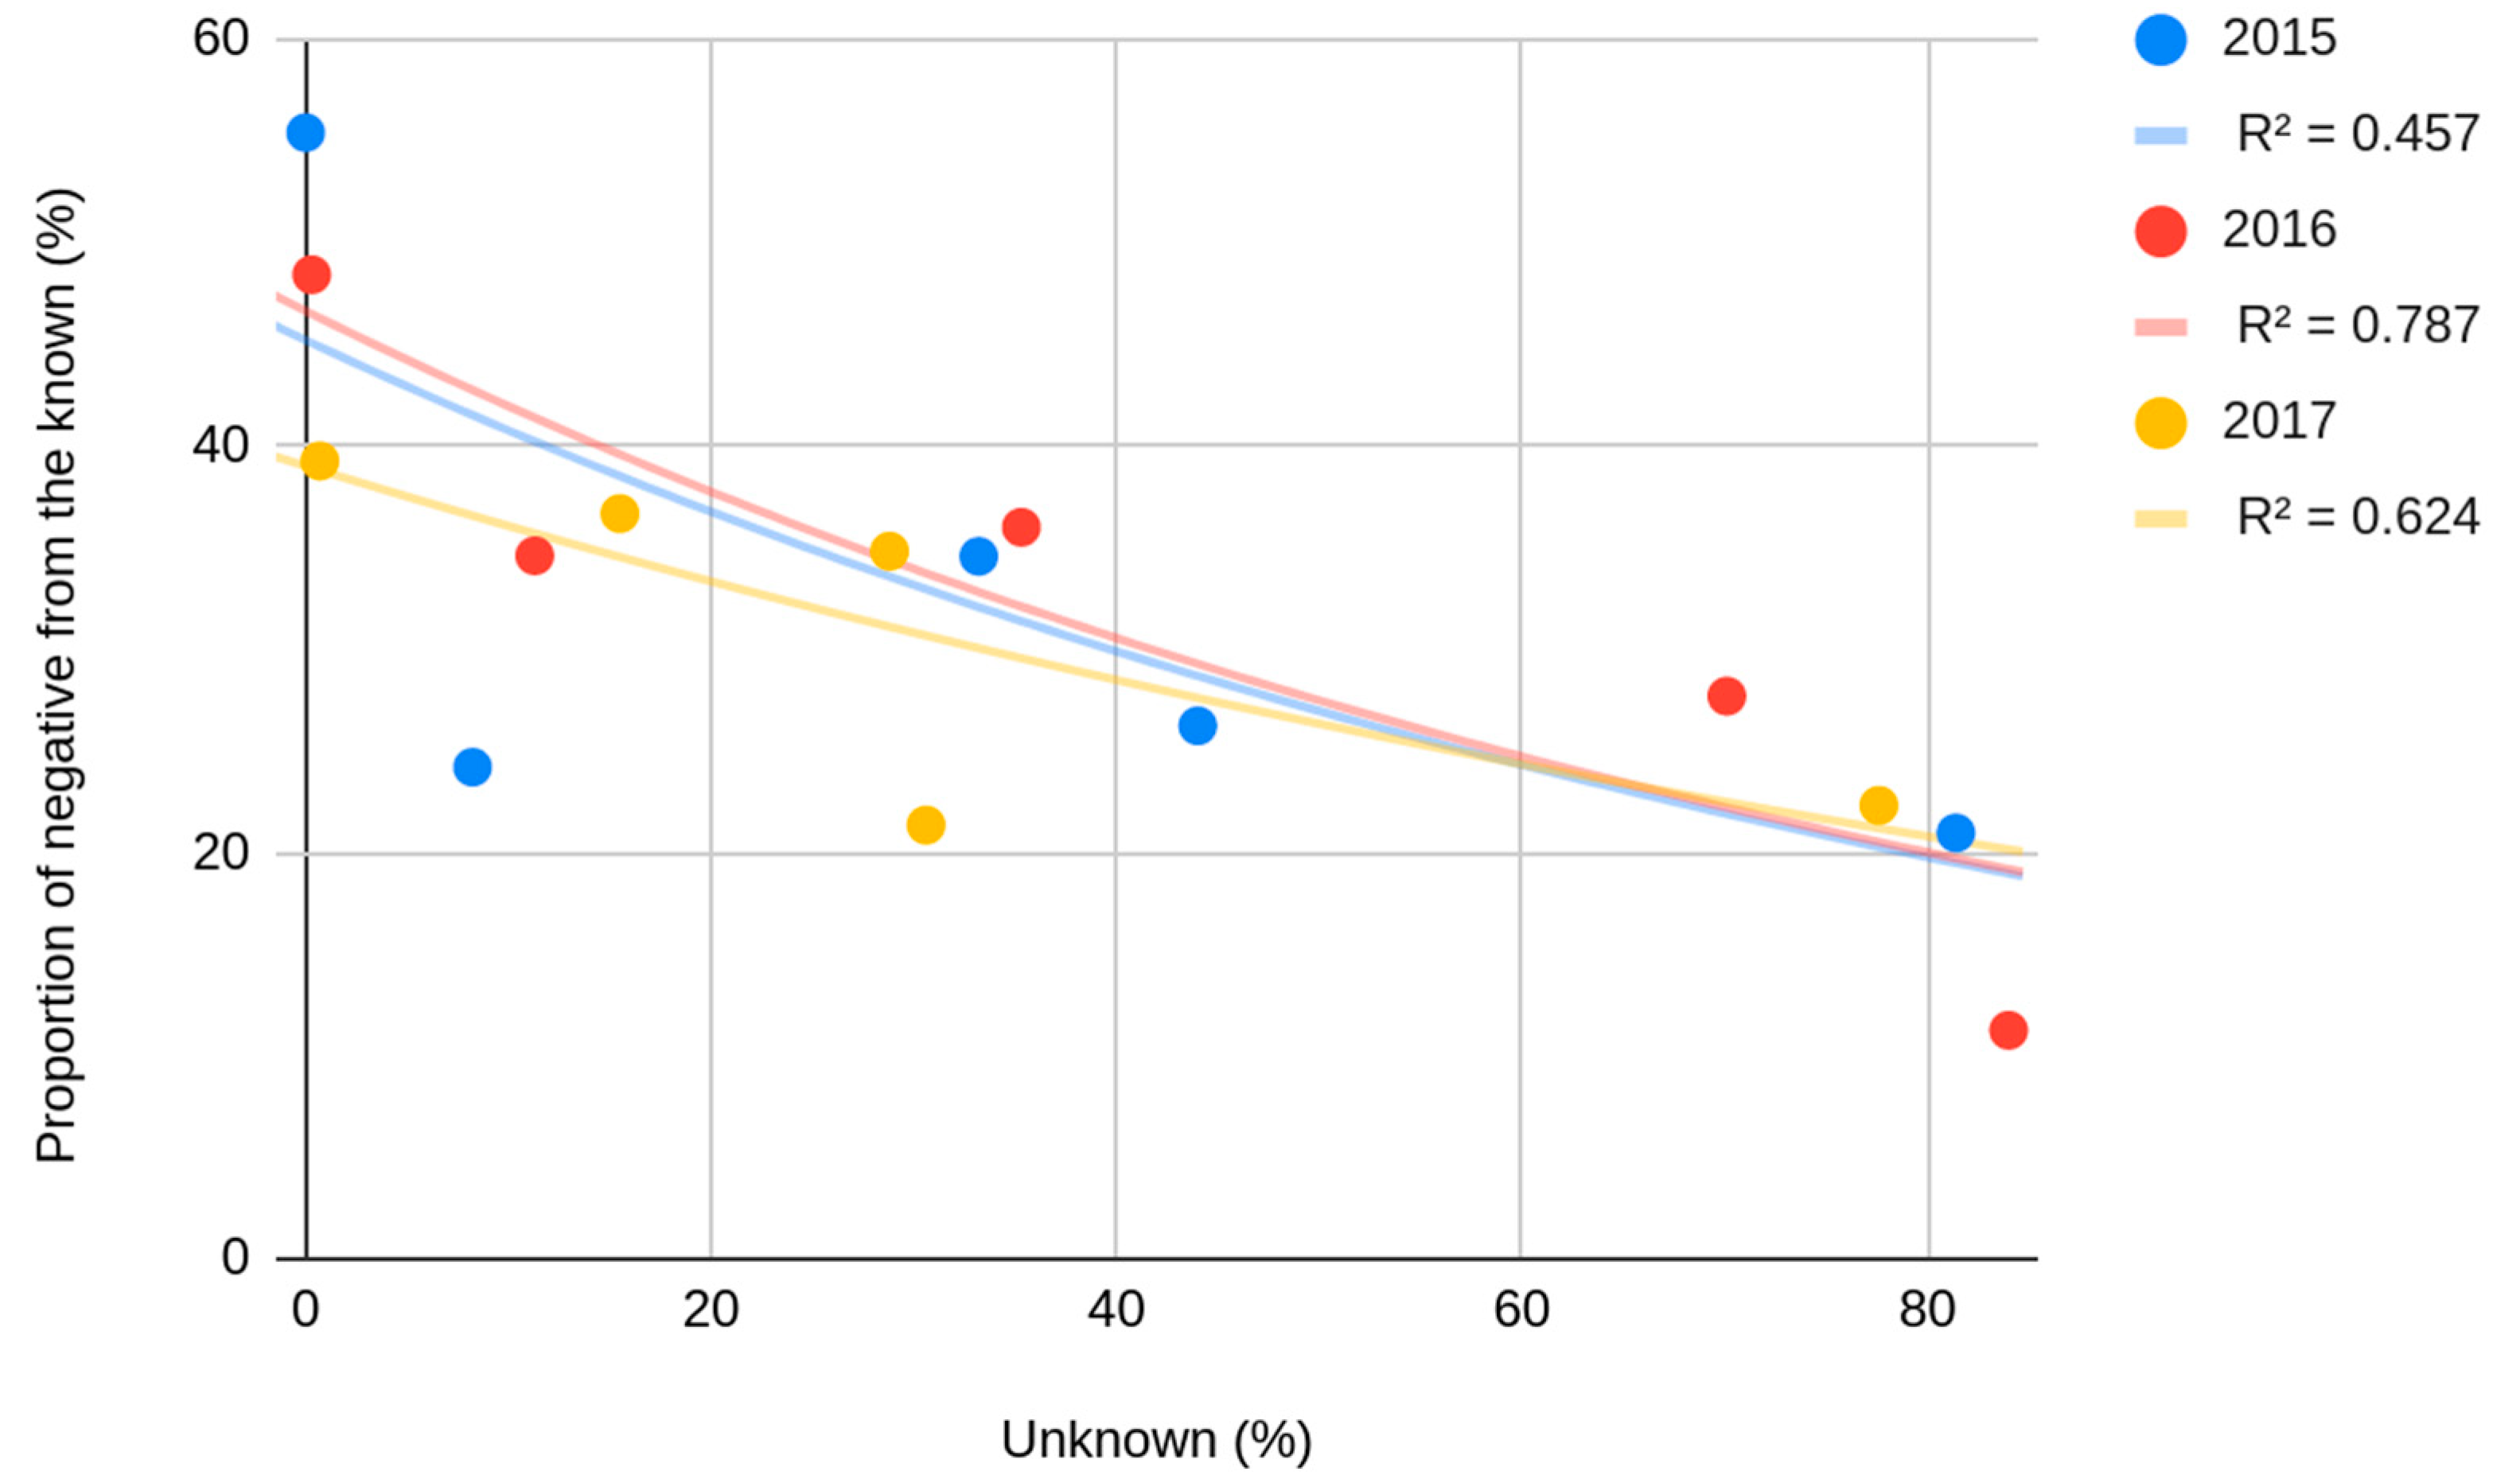
In order to check this issue, in
Figure 6 we contrasted the relation between the proportion of people in a negative situation after six months from the known answers and the percentage of unknown cases. In
Figure 6 we show a negative correlation for every year. This means that the proportion of people in a negative situation was lower where the percentage of unknown cases was higher. Although the curves follow similar patterns, the R²-values ranged from 0.457 in 2015, to 0.787 in 2016 and 0.624 in 2017. This confirms our fear that there was a selection bias regarding the collection of the follow-up data. This means that the chance of a positive outcome from the reported cases was higher if there were more missing cases in the database.
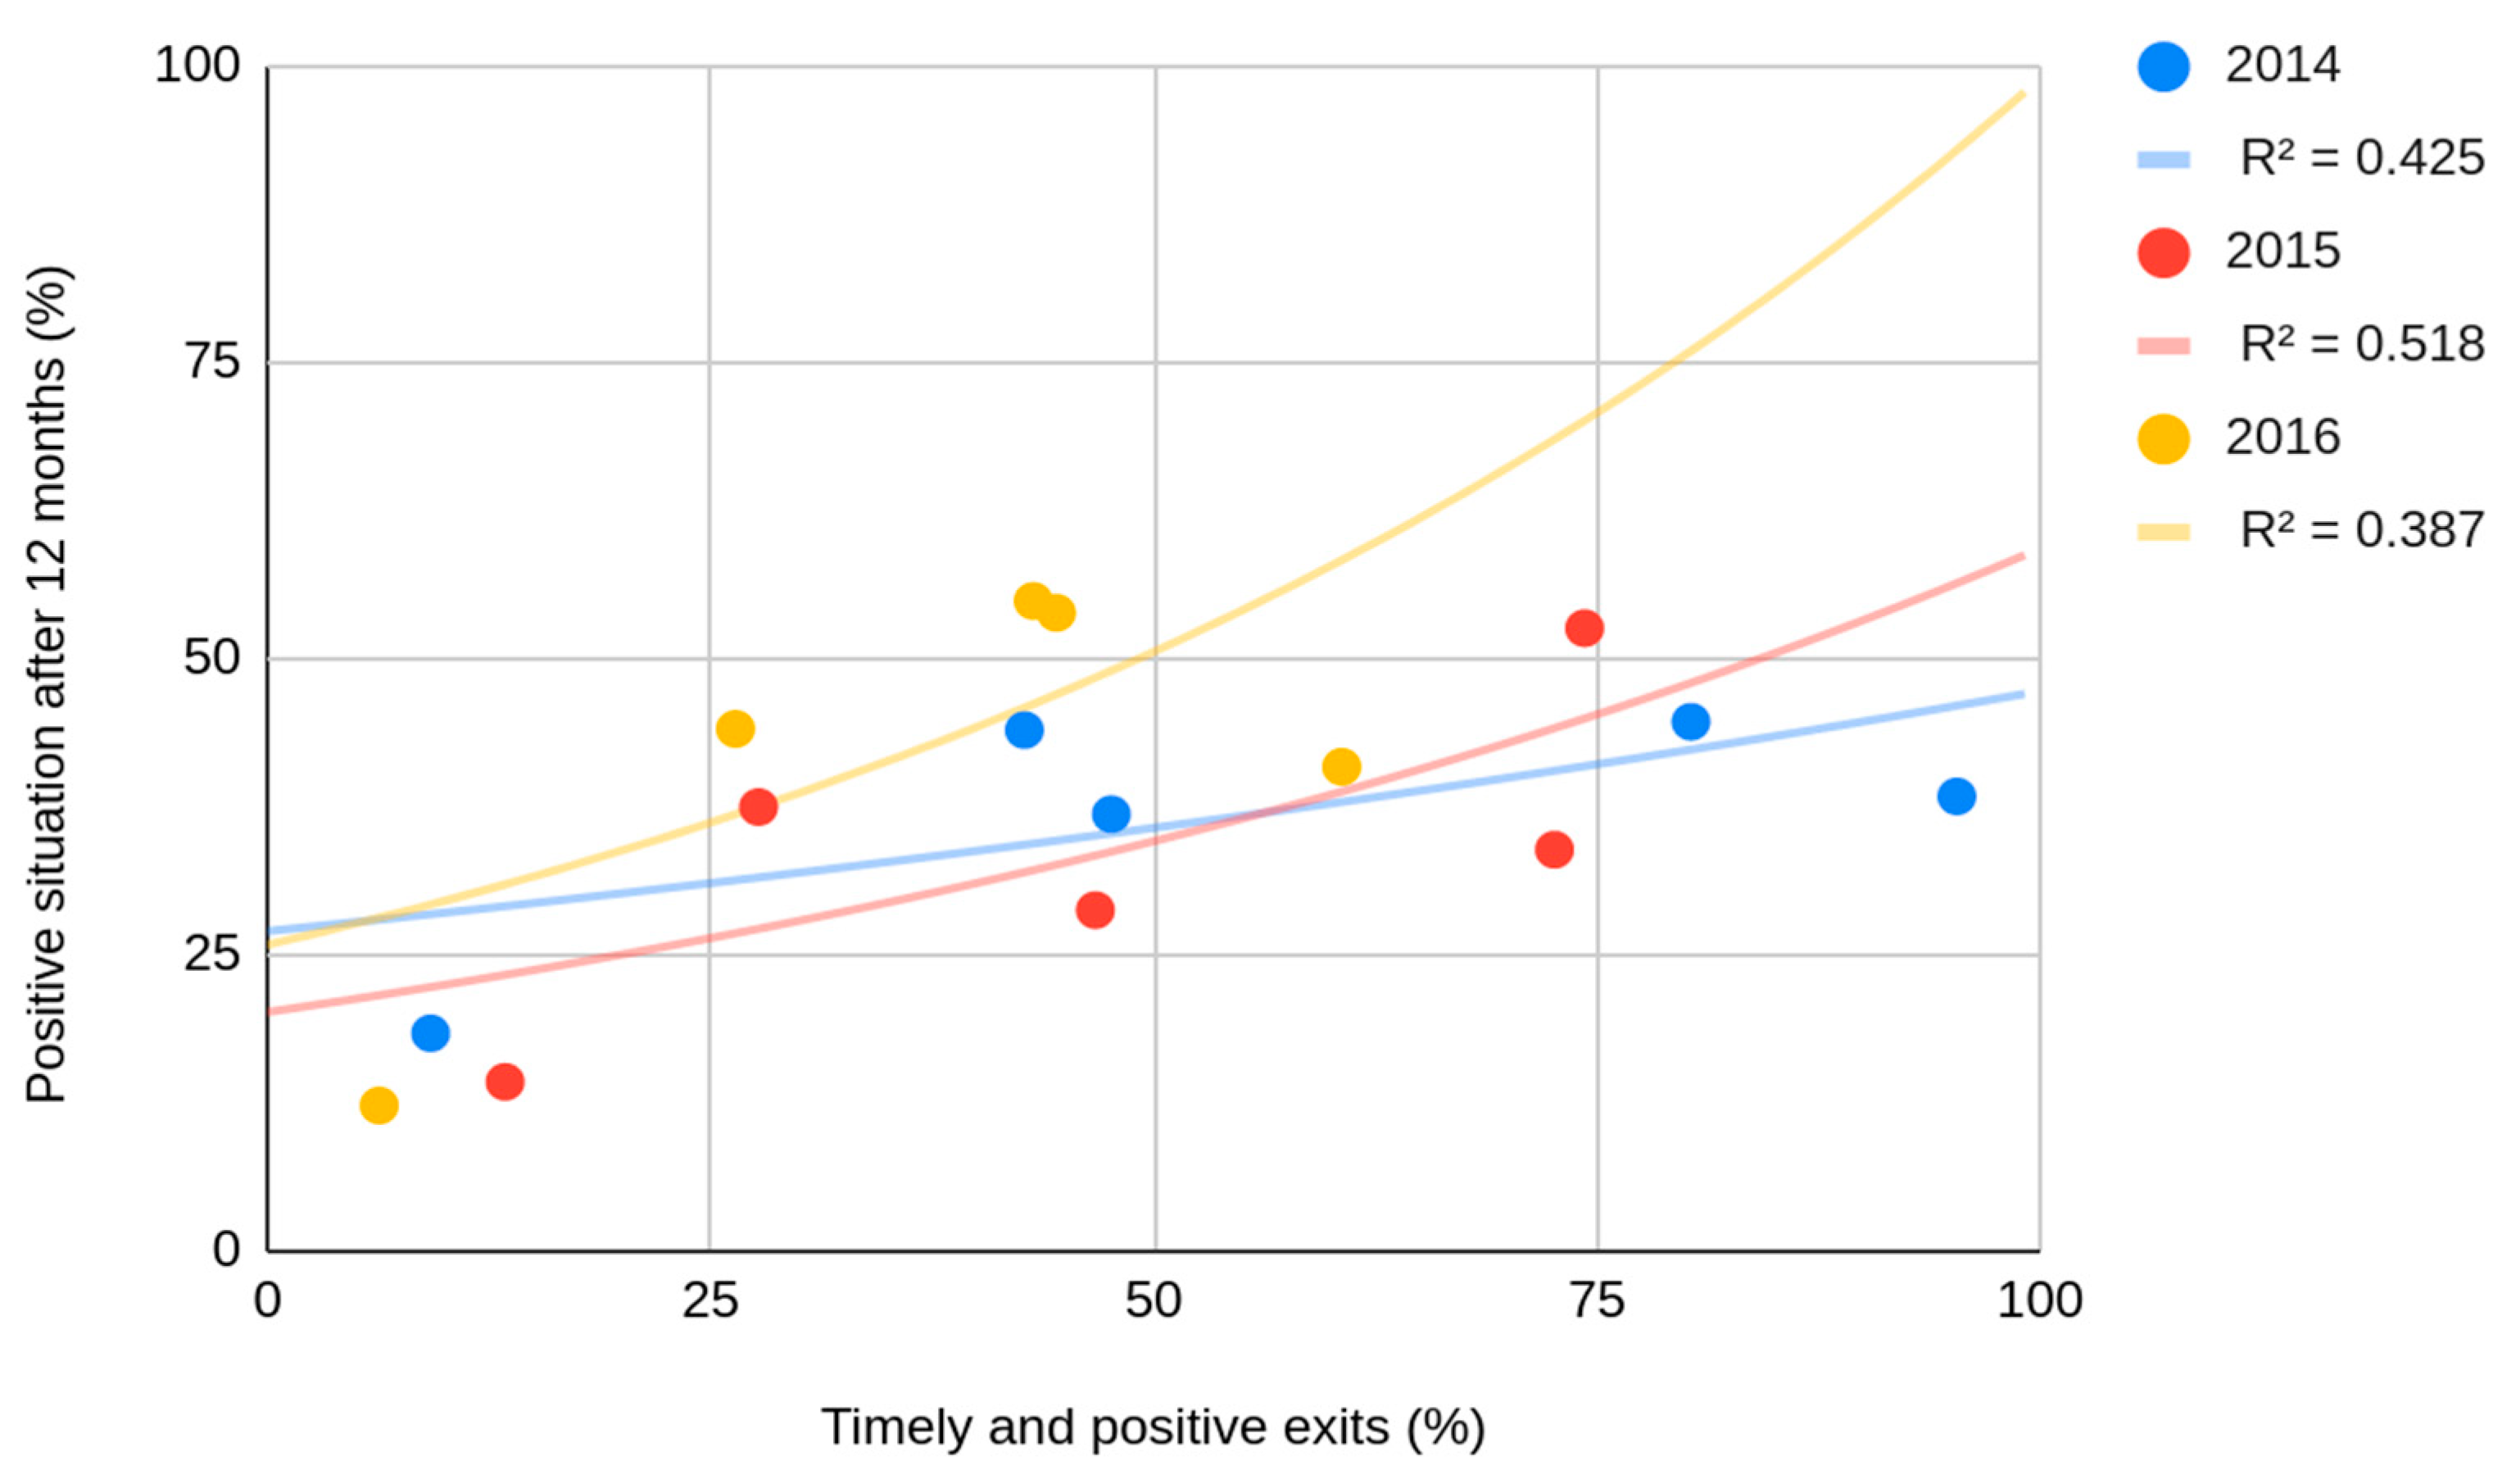
One can leave the Youth Guarantee in a timely and positive manner, but after some time that young person can go back to the starting position of being a NEET. In other words, a user of the Youth Guarantee may not achieve the objective of not being a NEET even after a success within the framework of the program. The follow-up indicators aimed to provide a picture of the long-term success of the policy.
Thus, in
Figure 7, we contrasted the timely and positive exits of a given year with the percentage of former users in a positive situation 12 months after. In the chart we show a positive correlation between the variables for every year. In fact, these trends became more and more positive year after year. In other words, the more timely and positive exits there were, the higher the probability was for the former users of the Youth Guarantee to be in a positive situation 12 months after leaving the program. However, the explanatory strengths of the determination coefficients (0.425 for 2014, 0.518 for 2015, and 0.387 in 2016) varied considerably and were not particularly strong. Although they showed that part of the success may be explained by the policy’s good performance, it implies that there were other factors that influenced the policy results.
5. Conclusions
We started this paper trying to answer the question of whether the Youth Guarantee should be considered a success or a failure, from the perspective of a sustainable policy framework, and asserting the importance of policy evaluation and data analysis to respond to that question. Our goal was to provide that knowledge to researchers and policymakers to contribute to the policy.
From the analysis of the literature, firstly we remarked on the research gap and later we highlighted the lack of confidence in the policy tools and effects [
12,
14,
32]. We also showed that the NEET problem is still an important issue in the EU, especially in the studied countries (Cyprus, Greece, Italy, and Spain). Despite the improvements, in comparison with the initial implementation period of the Youth Guarantee, the NEET rate in countries of the Mediterranean European Economic Area is still high. Therefore, one could simply have considered the policy, not having achieved its goal, as a failure.
However, we showed that the NEET situation is improving. In our findings we also included data revealing the importance of time regarding the policy achievements. We showed that if the importance of time is not taken into account to obtain a more robust overview, the policy evaluation leads to wrong conclusions. In the findings we also revealed that measures such as subsidizing offers did not contribute to a better policy performance. Finally, regarding the policy data, we highlighted that databases are biased and that in some cases the amount of missing cases/unknown responses is considerably high, which limits the quality of any analysis. We revealed that there is a tendency to collect the most positive feedback, which implies that some failures may be undetectable using the collected information.
Highlighting the importance of time is essential, because in the case of the Youth Guarantee, it is a big new strategy for the European Union with a modest framework, in comparison with the power and actions of the national governments and the general economy. This means that the institutions that implement the policy needed time to adapt to the new situation and learn how to work with the Youth Guarantee. Therefore, we know that it would be a mistake trying to answer the original research question considering only the first period of the policy implementation.
The finding of the subsidized offers clarifies that some measures included in the policy are not fulfilling their goals. That type of analysis and results is useful for policymakers and the subsequent knowledge can be used to improve the policy and make it more sustainable.
Finding biases in the databases and highlighting the issues of the high percentage of missing cases can benefit policymakers and researchers alike. Policymakers can use this information to solve the actual problems regarding the data collection and be aware of considering the data as completely reliable while using them to improve the Youth Guarantee. Researchers may learn from those remarks and reach better policy evaluations thanks to them.
Based on the literature review, we advise for a more tailored approach to the Youth Guarantee. As Rodríguez Soler and Verd [
22] argued, this approach is lacking in the Youth Guarantee and it has proven useful in similar policies. It aligns with the findings regarding the measure of subsidizing offers, as it proves that some aspects that could work in theory do not necessarily apply in the field. Therefore, a more tailored approach for the Youth Guarantee can provide the flexibility that compensates for those limitations.
As a response to the identified data issues, we argue in favor of policy evaluation. We consider that this article is an example of the positive effects of having a framework for policy data collection but also revealed that the data collection is not perfectly implemented. Thus, we demand an improvement in the methodology applied in the data collection, especially in those countries where the percentage of missing cases/unknown answers is higher.
Finally, we want to go back to what we consider the main lesson from our analysis: Time is essential. We understand that the policy should not be judged without comprehending the influence of its context. The Youth Guarantee, as with many policies, is limited by external and internal factors (such as the moment of time when the policy is implemented, the size of its budget, the status of the general economy, etc.). Those elements may narrow the possibility of achieving a sustainable policy. Thus, authors such as Tosun et al. [
32] argued that the Youth Guarantee aims to solve the NEET problem but may not have the tools to succeed. They commented that further research may provide an answer to that issue and we conclude that part of that is due to the time needed to be successful. A new strategy aiming at all NEETs, such as the Youth Guarantee, needs time for those it wants to reach to become aware of it. It needs time to face the fact that people may know of it but think that it would not necessarily help them achieve the goal of leaving the NEET label behind, it needs time to surpass the lack of trust in the institutions implementing the policy, and it needs time to explain how it works. Therefore, we recommend that researchers and policymakers provide the needed time before rushing into conclusions about the success or failure of the policy and that that time be efficiently used to improve and implement the policy.
Finally, this text is also an example of the lack of analysis included in the policy evaluation. Considering that the reports that evaluated the Youth Guarantee [
6] only included descriptive analysis, we showed that the models we developed for this article, although not very complex, as they only contrasted two variables at the same time, is a considerable step forward. As a consequence, we support the inclusion of this kind of analysis in future evaluations of the policy. For further research we encourage the use of even more complex models than ours, because those models could help researchers and policymakers to understand the multifaceted relationship between economy, education, and NEET policy. In other words, the models presented in this article contribute to a new, interesting, and better evaluation of the Youth Guarantee, but there is space for improvement. Therefore, we advocate for the amelioration of them to enhance the policy analysis and its scope.
For those aspects, we started the article showing that we did not rush to judge the policy. We do not deny that the Youth Guarantee is far from its goals, but they are utopian and the problem is not an easy task to solve in just a couple of years. We have shown that there are reasons to believe that there is a lot of space for improvement and, in line with what we already wrote, time will tell if we should consider the Youth Guarantee a success or a failure.


