Article

A 10-year Analysis on the Reduction of Particulate Matter at the Green Buffer of the Sihwa Industrial Complex

1
Urban Forests Division, National Institute of Forest Science, 57, Hoegiro, Seoul 02455, Korea
2
Forest Ecology Division, National Institute of Forest Science, 57, Hoegiro, Seoul 02455, Korea
*
Author to whom correspondence should be addressed.
Sustainability 2021, 13(10), 5538; https://doi.org/10.3390/su13105538
Submission received: 27 April 2021 / Revised: 9 May 2021 / Accepted: 11 May 2021 / Published: 15 May 2021

Abstract

:
Green buffer (GB) zones are designed to prevent the spread of air pollutants and odors from industrial complexes (ICs) to residential areas (RAs). We analyzed changes in the concentration of particulate matter (PM) and the number of high PM pollution days for 10 years after the GB was implemented, using the National Atmospheric Environmental Research Stations 2001–2018 dataset. We also performed field measurements of PM10 and PM2.5 from February 2018 to January 2019 to analyze the PM concentrations at human breathing height throughout the GB. Before GB implementation (2001–2006), PM10 in the RA was 9% higher than that in the IC. After GB zone implementation (2013–2018), PM10 in the RA was 11% lower than that of the IC. Furthermore, the PM concentration in the RA (slope = ∆Concentration/∆Time, −2.09) rapidly decreased compared to that in the IC (slope = −1.02) and the western coastal area (WCA) (slope = −1.55) over the 10-year period. At PM concentrations at human breathing height, PM10 and PM2.5 in the RA were lower than those in the IC by 27% and 26%, respectively. After GB implementation, the wind speed was positively correlated but SOx was negatively correlated with the PM reduction rate at a local scale. These results show that there was a reduction of PM during and after GB implementation, implying the need for proper management of GBs and continuous measure of pollutant sources at the green buffers of industrial complexes.

1. Introduction

Large quantities of nitrogen oxides (NO2) and sulfur oxides (SO2) in industrial complexes (ICs) act as particulate matter (PM) precursors and spread to the residential areas (RAs), affecting the health of urban residents [1,2,3]. Therefore, there is a legal obligation to design a green buffer (GB) zone to reduce the effects of PM emitted from ICs. The GB is a green area implemented to prevent air pollution, noise and odor from the IC. The GB can be used for managing urban air quality and as a leisure area due its high accessibility to urban residents and PM-reducing effects [4,5,6,7].
The GB zone can reduce PM through the following mechanisms; PM absorption through stomata in leaves [8,9], PM adsorption by the forest structure [10,11], and PM blocking and deposition due to changes in weather conditions inside the forest [12,13,14]. In addition, the PM reduction effect of the GB can be affected by the season and the forest structure. In summer, the leafy season, the absorption and adsorption of PM through the leaves has been found to actively occur [3], and the PM reduction in the leaf maturity phase has been found to be affected by wind speed [15,16] and high rainfall quantity and duration [17].
The forest structure is related to airflow and PM movement. Excessively dense forests could interfere with smooth airflow, leading to stagnant PM and high PM levels, as has been observed in previous studies [18,19,20]. In order to increase the PM reduction through the forest, a forest structure with dense vegetation as well as adequate ventilation can be constructed [9,21]. It is important to consider the season and forest structure together to identify the characteristics of PM reduction in a GB zone.
Few studies have been conducted in such forests, with field data at a human-breathing-height level as well as on a regional scale to confirm the PM reduction effect of GB zones. Therefore, this study was conducted on a GB zone created near the Sihwa IC, a major domestic IC, to identify the PM reduction effects at a human detection level and at a regional scale.
The research objectives were (1) to determine the 10-year change in PM concentration after the GB zone was installed in the landscape and (2) to analyze the PM reduction in the GB zone by measuring the PM concentration at a human detection level and on a regional scale. These results can provide information on the ecosystem services and the benefits for environmental taxation of GB zones in industrial complexes.

2. Materials and Methods

2.1. Study Site

The study site, the Sihwa industrial complex (37°20′ N, 126°46′ E), is a medium-sized IC that includes various industries, such as steel and machinery. This is one of the top three ICs in Korea, along with Banwol and Namdong ICs. The major air pollutants in the Sihwa IC are NO2 and SO2, which are emitted from the operation of trucks and ships and fossil-fuel combustion from manufacturing industries [22]. As the Sihwa IC is close to the west coast, a strong northwest wind blows inland from the coast.
The GB zone in Sihwa (37°20′ N, 126°43′ E) was installed to prevent air pollutants from the IC spreading to the RA. This green area was created by reclaiming the mudflat area in 2000. However, the trees were small and planted at low densities, which did not reduce air pollution. Thus, the GB zone was supplemented with additional trees from 2006 to 2012 (Figure 1). At the end of GB implementation, tree height changed from 5~6 m to 8~12 m. Green land capacity (2.02 m3/m2) also increased by 108 % compared to 2006 (0.97 m3/m2). The GB zone is 64.0 ha (length: 3.46 km, width: 0.15–0.25 km, height: 10 m) and consists of diverse trees (Pinus thunbergii and Pinus densiflora) and shrubs [23].

2.2. PM Analysis of Long-Term Monitored Data at a Local Scale

To analyze the long-term changes in PM10 concentration before and after the implementation of the GB near the Sihwa IC at a local scale, we used PM data from the national atmospheric environmental research station (NAERS) (Figure 2). We investigated the monthly PM10 at NAERS located in the IC and RA (NAERS-IC: 37°20′ N, 126°43′ E; NAERS-RA: 37°20′ N, 126°44′ E, respectively) (n = 30 or 31 per month). Since the NAERS began measuring PM2.5 in only 2015, this study used the PM10 data. To identify PM reduction from the GB, we compared the NAERS data to the monthly PM10 of the west coast area (Gwangmyeong, Ansan, Pyeongtaek, Bucheon, Osan, Hwaseong, Siheung; WCA) where the government’s regulations on large PM emission sources are strongly enforced (n = 30 or 31 per month). Based on monthly PM data by year (n = 12 per year), we analyzed the annual PM10 concentration and the trends of PM concentration line slope (∆Concentration/∆Time) over time for yearly data. Also, we calculated the reduction rates of PM (Equation (1)) and the number of high PM pollution days (a daily average PM10 concentration ≥ 81 μg/m3) in the NAERS-IC and NAERS-RA.
PM   reduction   rate   ( % ) = ( C I C C R A ) C I C × 100
where CIC is the PM concentration near the IC and CRA is the PM concentration near the RA.

2.3. Correlation Analysis between PM Reduction Rates and Factors at a Reginal Scale

The PM reduction rates are affected by the amount of emitted air pollutants, meteorological factors and vegetation vitality. In order to identify the factors in PM reduction rate from the start of GB implementation (After 2006), the correlation between annual PM reduction rate, air pollutant emissions, weather factors and normalized difference vegetation index (NDVI) was analyzed. We used the amount of annual air pollutant emissions in Siheung from the National Air Pollutants Emission Service, based on NAERS measuring data. Nitrogen oxides (NOx) and sulfur oxides (SOx) are mainly produced by Sihwa IC as a result of automotive, metal and plastic manufacturing industries, which burn fossil-fuel. We selected NOx and SOx emissions, as they can represent the characteristics of air pollutant emissions in the Sihwa IC. The amount of emitted NOx and SOx are not only precursors of PM but also can produce secondary PM through chemical reactions in the atmosphere [2,3]. Thus, PM emissions were not considered separately in this study. Since these data are announced every 2 years, we used data up to 2017 for analysis in this study. Annual weather factors (temperature, wind speed, annual precipitation) were measured by the National Weather Service (37°23′ N, 126°46′ E). The weather station is representative of weather factors in Siheung City and nearby the study site. We thought this station could represent the weather factors for the measuring points. To verify the annual degree of vegetation density of the GB, we utilized NDVI by using USGS Landsat 7 Reflectance Tier 1 among the dataset provided by Google Earth engine (https://developers.google.com/earth-engine/datasets/catalog/LANDSAT_LE07_C01_T1_SR; accessed 3 March 2021). NDVI calculated the median value of satellite images every 2 months from 2006 to 2017 at 13 locations in the GB zone (e.g., NDVI2017.01 = the median NDVI value between December 2016 and February 2017). The median value minimizes the effect of ideal value.
As we sought to identify the PM reduction rate as a result of GB implementation, we focused on the period during and after GB implementation. We grouped the annual PM reduction rate, air pollutant emissions, weather factors and NDVI during and after the implementation of GB. We performed Pearson correlation analysis among these grouped data using R version 3.0.2 (R Core Development Team 2019, Vienna, Austria), and statistical significance was set at p-value < 0.05.

2.4. PM Measurement at Human Breathing Height

To confirm the actual PM reduction effect from the GB, we measured PM using mobile PM measurement equipment. The PM observation points were selected to be two points (OP-IC: 37°20′ N, 126°43′ E; OP-RA: 37°20′ N, 126°44′ E) adjacent to the NAERS (within 500 m) (Figure 2). As the Sihwa IC has the wind blowing in the northwest direction from the coast to land, the OP-RA located at northern part of the GB zone was the optimum observation point to represent the PM changes through the GB. The distance between the OP-IC and the GB zone is 1 km, and the distance between the OP-RA and the GB zone is 0.76 km. The OP-IC consists of Pinus strobus (4.5 trees/100 m2) and Pseudocydonia sinensis (0.5 trees/100 m2). The OP-RA is dominated by Pinus rigida (8.75 trees/100 m2) and Pinus densiflora (0.5 trees/100 m2) [24].
The PM measuring device, Dustmate (Turnkey, UK, ±0.5% accuracy), was installed 1.5 m above the ground, reflecting the height at which humans breathe. The use of Dustmate for analyzing PM concentrations was successfully demonstrated by previous studies [25,26]. Dustmate can measure the real time PM concentration using the light scattering method. However, humidity interferes with the light scattering method, resulting in the overestimation of the PM concentration [27,28]. Thus, we excluded the PM data when humidity values were over 80% to prevent overestimation of PM concentration. From February 2018 to January 2019, we measured PM10 and PM2.5 concentration for 24 h, once a month. The PM data was measured at intervals of 1 s, and we used the average over a 5 min period for our dataset. We calculated the monthly concentration and PM reduction rate (Equation (1)) for the measured data. It is difficult to represent the monthly PM concentration because PM measurement was carried out during just 1 day. However, we identified days with monthly weather characteristics in advance, and previous studies also showed monthly PM concentrations as a result of measuring PM for a short time [24,29]. So, we can speculate that our measuring data can show the feature of monthly PM.

3. Results

3.1. PM Reduction at a Local Scale

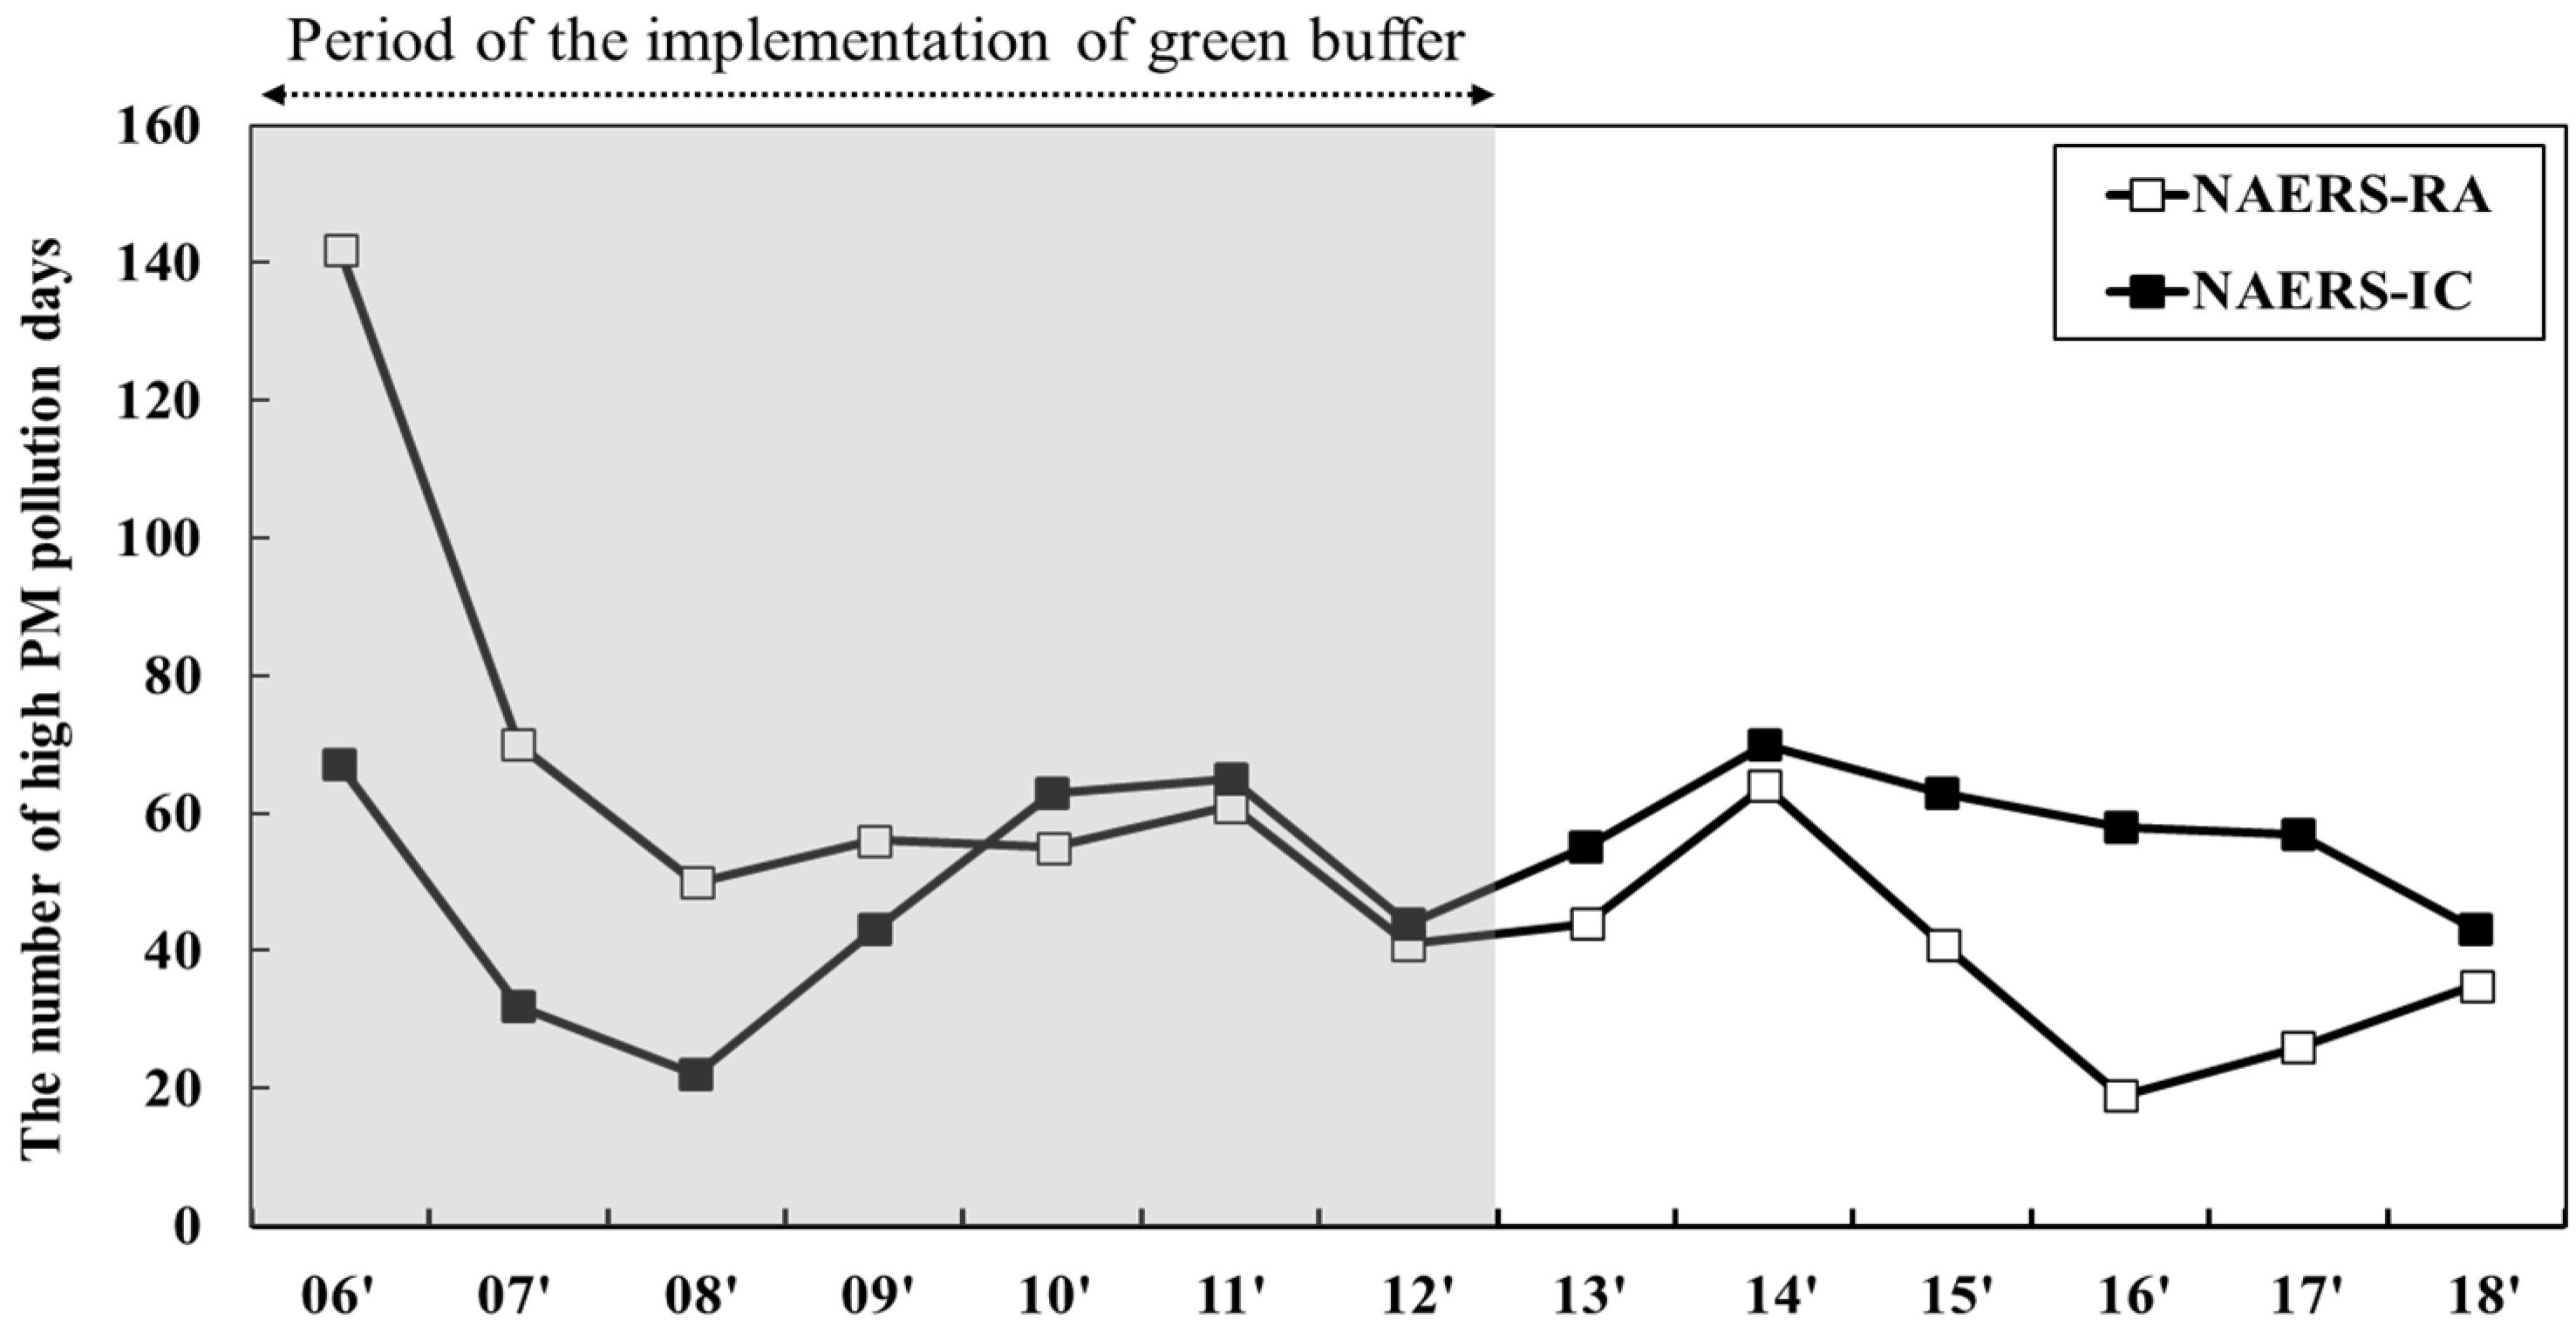
3.1.1. PM Reduction Effect of the GB

From 2001 to 2006, the average PM10 concentration in NAERS-RA was 9.4% higher than that in NAERS-IC (Figure 3a). With the start of the implementation of the GB zone in 2006, the difference in PM10 concentration between NAERS-IC and NAERS-RA gradually decreased, and the PM in NAERS-IC was higher than that in the NAERS-RA in 2010. After installing the GB (2013–2018), the PM in the NAERS-RA has remained 10.5% lower on average than in the NAERS-IC. The trend line slope (∆Concentration/∆Time), which showed PM10 concentration gradient over time, was the highest as a value (−2.09) of slope in NAERS-RA and the lowest as a value (−1.02) of slope in the NAERS-IC (Figure 3a). The concentration changes over time showed a value of slope of −1.55 in the western coastal area (WCA) over the 10-year period.
The PM10 reduction rate in the GB zone also showed a similar tendency to the changes in PM10 concentration (Figure 3b). The PM reduction rate was the lowest, at −21.3%, in 2005, just before the start of the GB installation. After 2006, the reduction rate began to increase slowly, and a positive reduction rate was first observed in 2010, at 14.1%. PM10 reduction in the GB zone has continued to show positive values, with the highest PM10 reduction effect observed in 2016. The reduction rate in 2018 was 6.2%, although it was lower than before. The average annual deviation of PM reduction rate was ±17.6 before the implementation of GB. The variability of PM reduction rate decreased since 2010 (±2.8) and showed stable value after the implementation of GB (±5.7).
The number of high PM pollution days was calculated by focusing on the period during (2006–2012) and after (2013–2018) implementation of the GB. In this period, changes in the PM10 concentration and reduction rates began to appear (Figure 4). During the implementation of the GB, the number of high PM pollution days in the NAERS-RA (68 days) was observed to be, on average, 20 days more than that for the NAERS-IC (48 days). The average number of high PM pollution days in the IC was five days higher than in the RA after 2010. After the GB was installed, the NAERS-IC and NAERS-RA had 58 days and 38 days, respectively, showing an inverted form. In particular, the difference in the number of high PM pollution days between the NAERSs was the largest, with an average of 31 days, two years after GB implementation. After this time, the NAERS-IC had many high PM pollution days, but the difference between the NAERSs decreased more than before.

3.1.2. The Characteristics of PM Reduction Rate during and after GB Implementation

Table 1 shows the correlation coefficients between the PM reduction rate, air pollutant emission, meteorological factors and NDVI. During the implementation of GB, the PM reduction rate showed correlation with SOx, meteorological factors and NDVI, except for NOx. The PM reduction rate was positively correlated with wind speed and annual precipitation. Although NDVI showed low correlation with the PM reduction rate, there was also a positive correlation. SOx and temperature were negatively correlated with PM reduction rate. After the implementation of GB, only SOx and wind speed had negative and positive correlation with the PM reduction rate, respectively.

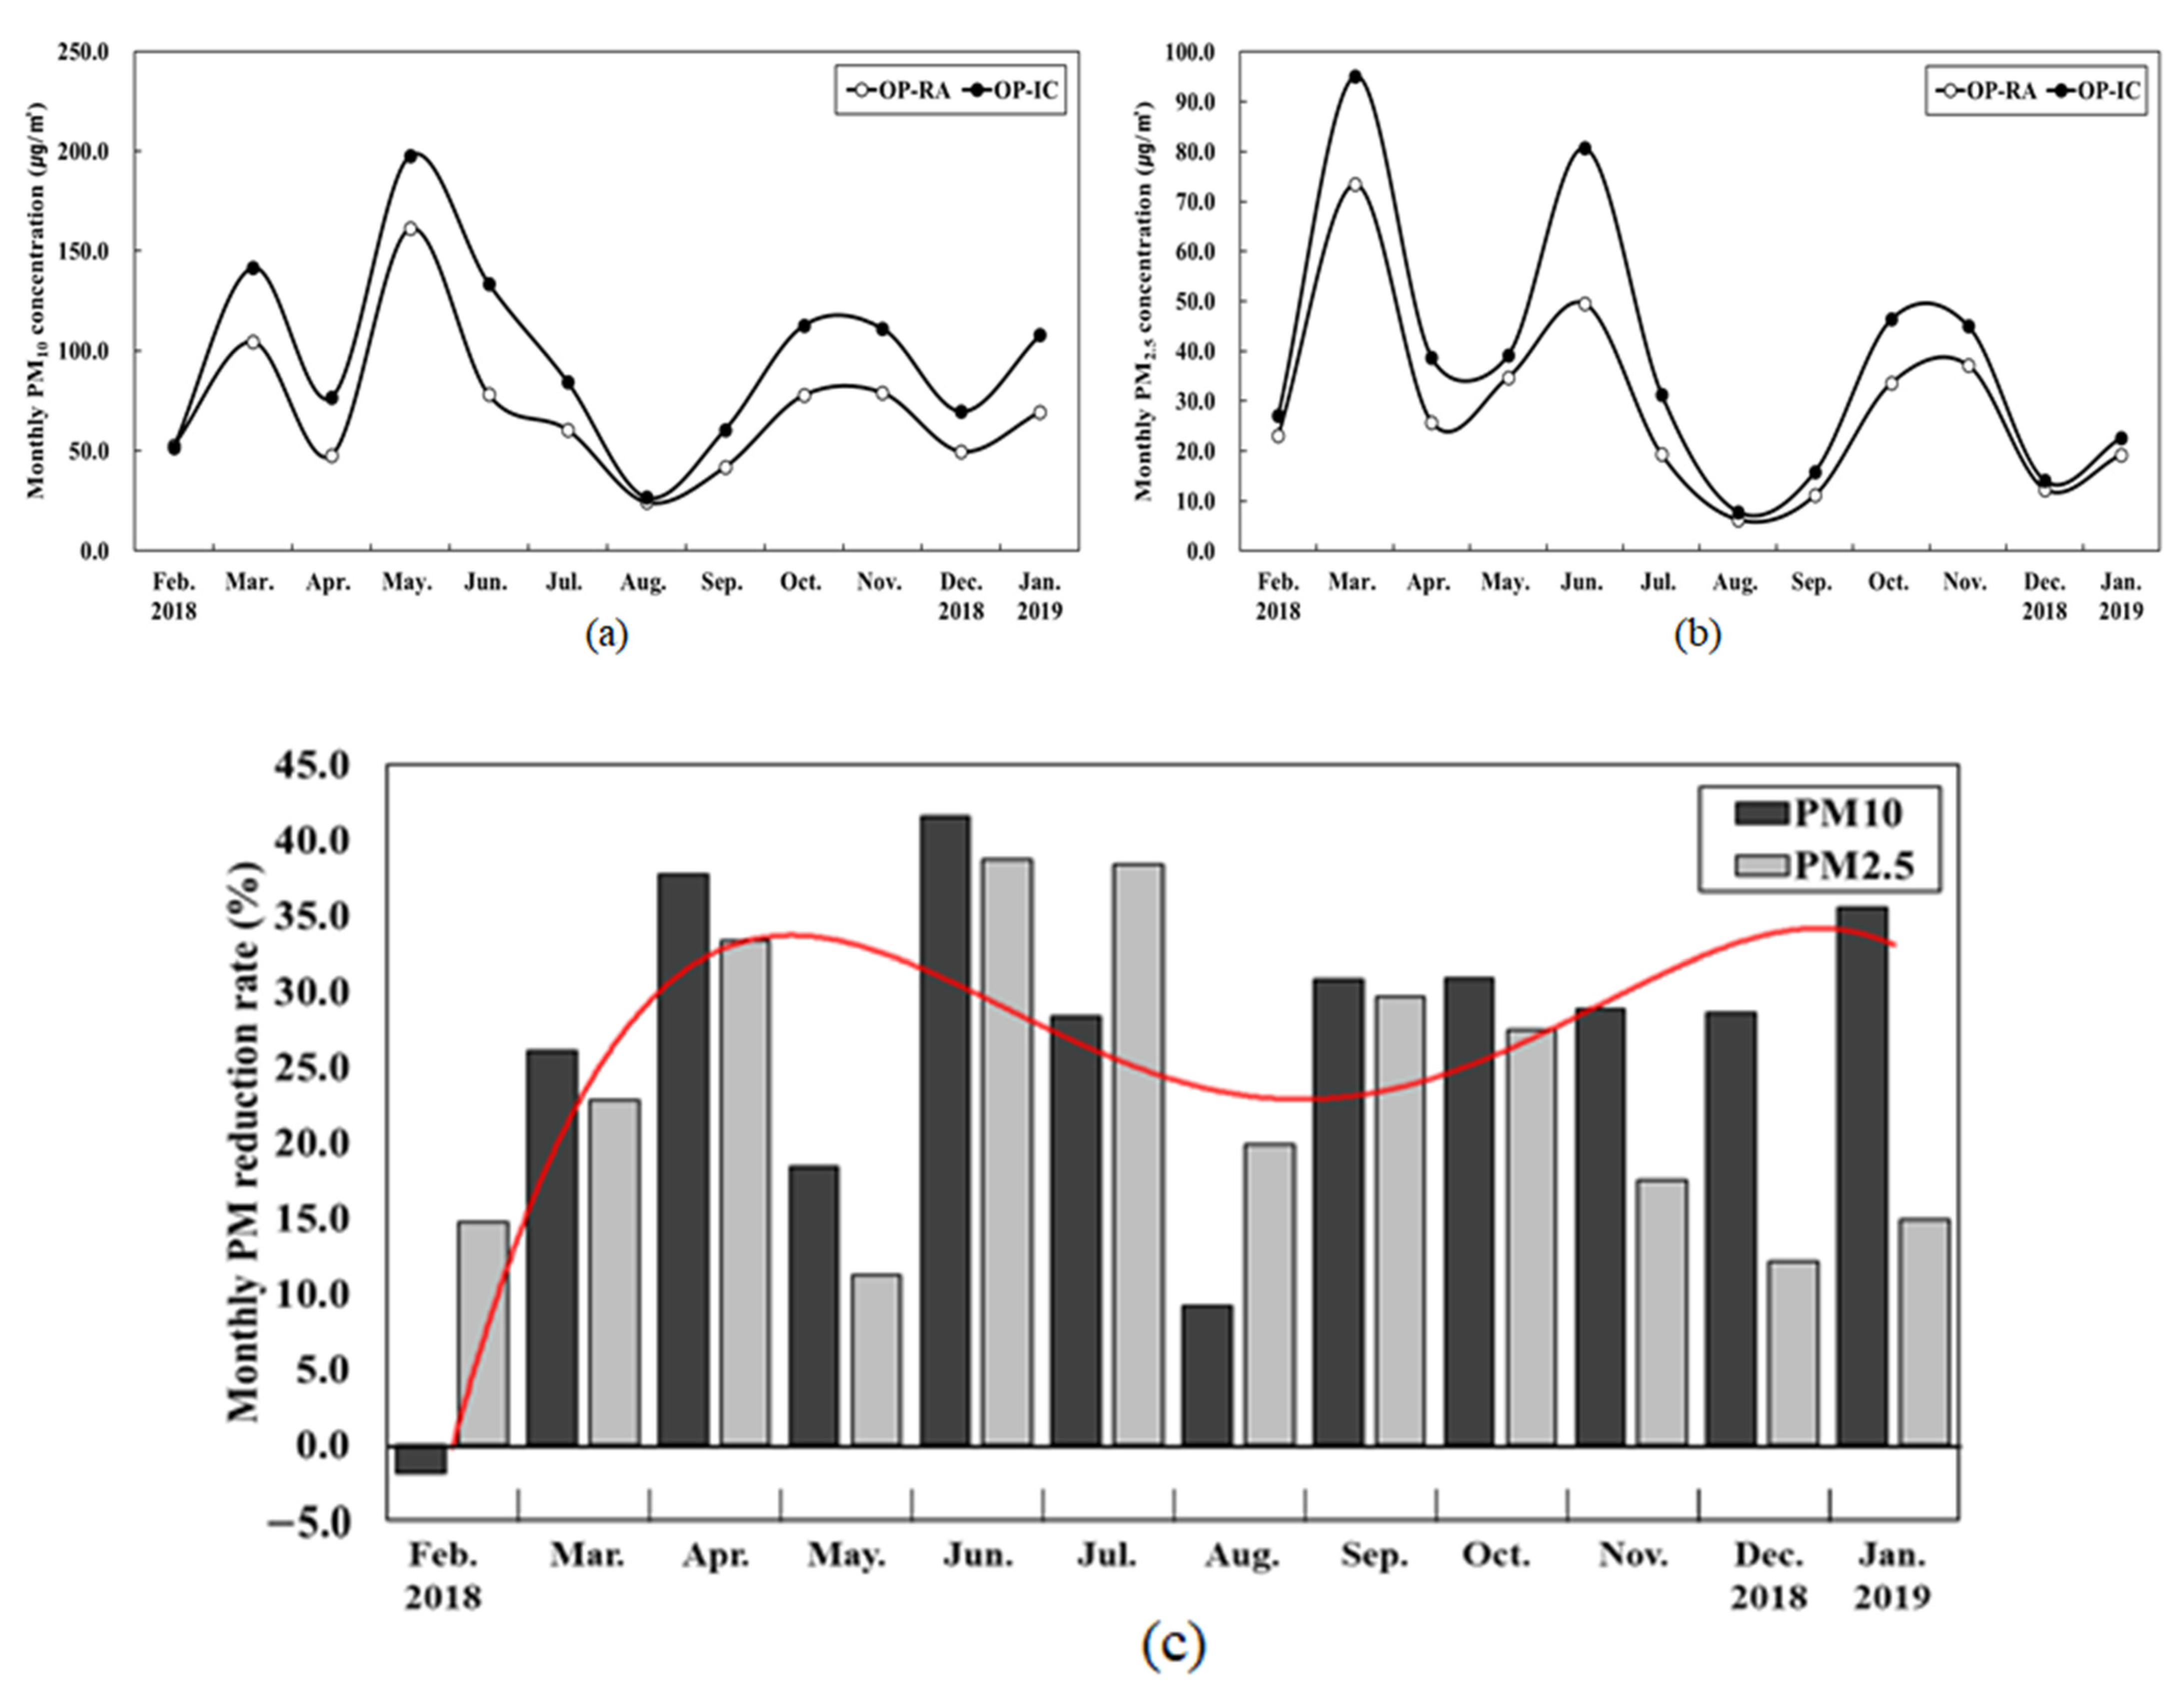
3.2. The Effect of PM Reduction of the GB Zone at Human Breathing Height

From February 2018 to January 2019, PM10 and PM2.5 concentrations were high in March (average 123.1 μg/m3) and May (average 179.4 μg/m3), and March (average 84.3 μg/m3) and June (average 65.1 μg/m3), respectively (Figure 5a,b). Except for PM10 in February, the average PM10 and PM2.5 in the OP-IC was 41.2% and 35.4% higher than in the OP-RA, respectively.
The PM reduction rate in the GB zone was also similar the PM concentration (Figure 5c). Except for February and August, a PM reduction effect was observed in the GB. The average reduction rate of PM10 and PM2.5 was 26.2% and 23.4%, respectively, which showed PM10 reduction rate had a 12.0% higher value than that of PM2.5.

4. Discussion

4.1. The Effect of PM Reduction of the GB Zone at a Local Scale

4.1.1. PM Reduction Effect of the GB

Before the GB implementation, the RA had higher PM10 concentration than the IC, which was affected by PM generated from the IC (Figure 3a). However, during and after the implementation of GB, the PM values in the RA were lower than those in the IC. This result showed that the GB zone had a PM reduction effect [30,31]. As the PM from the IC passed through the GB, trees could absorb PM via leaf stomata [32,33,34] and remove PM by blocking and deposition onto the leaves and branches [35,36].
In addition, the trend line slope of PM concentration over time in NAERS-RA had the highest value, showing a rapid decrease of PM concentration (Figure 3a). NAERS-IC showed a relative flat decrease, and the WCA showed an intermediate slope. This indicates that the WCA has been well managed under the regulations for air quality in Seoul metropolitan areas, but the IC seems to be little affected by such environmental policy. The steep decrease in the RA can be attributed to the indirect effects of GB blocking the pollutants from the IC. Therefore, the PM reduction in the GB was as effective as the regulations for large PM emission sources [37,38]. However, low levels of PM were still observed in the Sihwa IC where the PM was generated. Thus, steady management is required for emission sources as well as areas affected by the PM.
The effect of PM reduction in the GB zone was not observed immediately after implementation of the GB, but it has increased over time (Figure 3 and Figure 4). This means that trees need a period of stability after planting. As the growth and stabilization of the trees progressed, active PM absorption, adsorption, blocking and deposition through trees slowly emerged [11,39,40]. The physiological stabilization of trees ensures that the PM reduction in the GB zone can be maintained continuously. But at some point, PM reduction is less than before. This indicates that proper management of tree shape and density is needed to maintain PM reduction through trees. Thus, the GB zone should not only be dense for offering large absorption, adsorption and deposition area, but also be porous to allow active atmospheric diffusion [9,41]. It is important to manage the GB zone depending on the purpose of its establishment and PM levels.

4.1.2. The Characteristics of PM Reduction Rate during and after GB Implementation

The factors affecting PM reduction rate were different for the periods during and after the implementation of GB (Table 1). During the GB implementation, PM reduction rate was positively correlated with wind speed and annual precipitation. Wind speed is related to atmospheric diffusion. High wind speed influences active air currents and rapid dispersion of PM in the atmosphere, resulting in low PM concentration [24,42,43]. Annual precipitation can be related with the wet deposition of PM. This could also inhibit surface dust transport [43,44]. NDVI showed a low value but a positive correlation with PM reduction rate. This indicates that high vegetation vitality could affect the active PM reduction effect through GB [3,9]. SOx and temperature showed a negative correlation with PM reduction rate, which might be related to the process of the secondary PM formation. SOx is precursor of PM [45,46], and high temperature causes a photochemical reaction between SOx and other gaseous contaminants, producing secondary PM [47,48]. However, trees can accumulate PM on leaves up to their PM-retaining capacity. Precipitation and strong winds are needed to begin a new cycle of PM accumulation [49]. Thus, when PM accumulation by a tree reaches a saturation point, PM accumulation can be limited, which results in low PM reduction rate. In addition, low temperature can increase the deposition of PM and reduce PM through trees [13,14].
After the GB implementation, only wind speed and SOx had positive and negative correlation with PM reduction rate, respectively (Table 1). These results imply that the vegetation vitality as well as atmospheric diffusion through structural tree management are important after tree stabilization. A large quantity of trees can reduce wind velocity and suppress air currents and the PM deposition on trees, resulting in reducing the PM reduction effect of the GB zone [16,50]. A large-sized plantation forest and a GB zone of high porosity can affect the wind field at the local scale [9,51,52]. Therefore, it is crucial to maintain the PM reduction effect of the GB through proper management of tree density, forest structure and PM emission sources.

4.2. The Effect of PM Reduction of the GB Zone at Human Breathing Height

Overall, PM10 concentration was high in March and May, and PM2.5 concentration was high in March and June (Figure 5a,b). The high PM concentration in March can be attributed to the increase in fuel use and the influence of external PM. In May, Asian dust was present at the measurement times, resulting in a high PM10 [53,54,55]. Unlike previous studies [47,56], high levels of PM2.5 concentration were observed in June. This was related to the high value of relative humidity at the monitoring points. Although we excluded PM data when the relative humidity exceeded 80%, the high humidity in June seems to have led to an overestimation of PM from the measuring device [57,58,59]. Except for PM10 concentration in February, the average PM values were higher at OP-IC than at OP-RA. In February, PM10 and PM2.5 concentrations at the measuring time (21–22 February 2018) were 39 μg/m3 and 19 μg/m3, respectively, slightly exceeding the standard for fine PM quality (a daily average PM10 concentration ≤ 30 μg/m3 and PM2.5 concentration ≤ 15 μg/m3). At low PM concentrations, PM reduction through the GB zone was not significantly affected. However, we considered not only the effect of GB but also the distance effect on PM reduction according to the distance from air pollutant emitters. PM10 and PM2.5, which have a long atmospheric lifetime, decreased [60]; thus, we can speculate that the influence of the GB on PM reduction was greater than that of distance [24].
The PM reduction rate of the GB was also shown as common in PM concentration (Figure 5c). A PM reduction effect in the GB was observed, except for February and August, when PM concentrations were low. In particular, the average PM10 reduction rate was higher than that for PM2.5. This related to the characteristics of PM10. PM10 contains larger sized classes of particles than PM2.5 and has a short atmospheric lifetime. This could influence the active absorption, adsorption and deposition through trees [60].

5. Conclusions

This study showed that the GB zone was effective in reducing PM generated in the IC. On a local scale, PM concentration and the number of high pollution days of PM were higher in the IC than the RA after the implementation of the GB zone. The trend slope line of PM concentration in the RA rapidly decreased over time, which can be attributed to the indirect blocking effects of the GB by PM absorption, adsorption and deposition through trees. The effect of the PM reduction gradually increased over time, as the physiological stabilization of the trees took place. In addition, the PM reduction rate was positively and negatively related to wind speed and SOx, respectively. This means that both proper management of tree density and high PM emissions are needed to improve PM reduction. At human breathing height, except for the months where the PM was low, the PM concentration in the IC was also higher than the RA. Our results showed that proper management of tree density and PM emission sources are required to maintain the PM reduction effect of GB zone. In addition, the ecosystem services and benefits for environmental taxation of the GB zone could be evaluated through this customized method for local and human breathing height levels.
However, this study was conducted only in the one region (Sihwa) in Korea. In addition, the study on the exposure state of humans was measured on a 24 h basis, which is not comparable to monthly PM characteristics. Thus, the generalization on the PM reduction caused by the GB zone could be limited and might not apply all over the country. In future studies, it is necessary to measure the monthly PM by continuous PM measurement for human breathing height. The overall PM reduction characteristics of the GB zone will need to be determined by comparing the local and human levels.

Author Contributions

Analyzing data and writing the paper, S.-Y.Y.; searching and analyzing preceding research data, S.C.; managing the research project and measuring the field data, N.K.; analyzing the PM data, T.K.; designing the study site and contributing to the discussion of the PM results, C.-R.P.; calculating and analyzing NDVI changes, W.-H.P. All authors have read and agreed to the published version of the manuscript.

Funding

This research received no external funding.

Institutional Review Board Statement

Not applicable.

Informed Consent Statement

Not applicable.

Data Availability Statement

Publicly available datasets were analyzed in this study. This data can be found here (The national atmospheric environmental research station: St. 131232 Sihwa Industrial Complex, St. 131231 Jeongwang-dong, www.airkorea.or.kr, accessed on 4 November 2020; The national weather service: St. 565 Siheung, data.kma.go.kr, accessed on 4 November 2020).

Acknowledgments

This research was funded by the National Institute of Forest Science of Korea, Grant number NIFOS FE0000201801. We acknowledge the critical comments from anonymous reviewers and the editor.

Conflicts of Interest

The authors declare no conflict of interest.

References

  1. Du, Z.; Mo, J.; Zhang, Y. Risk assessment of population inhalation exposure to volatile organic compounds and carbonyls in urban China. Environ. Int. 2014, 73, 33–45. [Google Scholar] [CrossRef] [PubMed]
  2. Cheng, Z.; Luo, L.; Wang, S.; Wang, Y.; Sharma, S.; Shimadera, H.; Wang, X.; Bressi, M.; de Miranda, R.M.; Jiang, J.; et al. Status and characteristics of ambient PM2.5 pollution in global megacities. Environ. Int. 2016, 89, 212–221. [Google Scholar] [CrossRef]
  3. Choi, T.-Y.; Moon, H.-G.; Kang, D.-I.; Cha, J.-G. Analysis of the Seasonal Concentration Differences of Particulate Matter According to Land Cover of Seoul-Focusing on Forest and Urbanized Area. J. Environ. Impact Assess 2018, 27, 635–646. [Google Scholar]
  4. Escobedo, F.J.; Nowak, D.J. Spatial heterogeneity and air pollution removal by an urban forest. Landsc. Urban Plan. 2009, 90, 102–110. [Google Scholar] [CrossRef]
  5. Irga, P.J.; Burchett, M.D.; Torpy, F.R. Does urban forestry have a quantitative effect on ambient air quality in an urban environment? Atmos. Environ. 2015, 120, 173–181. [Google Scholar] [CrossRef] [Green Version]
  6. Livesley, S.J.; McPherson, E.G.; Calfapietra, C. The Urban Forest and Ecosystem Services: Impacts on Urban Water, Heat, and Pollution Cycles at the Tree, Street, and City Scale. J. Environ. Qual. 2016, 45, 119–124. [Google Scholar] [CrossRef]
  7. Sicard, P.; Agathokleous, E.; Araminiene, V.; Carrari, E.; Hoshika, Y.; De Marco, A.; Paoletti, E. Should we see urban trees as effective solutions to reduce increasing ozone levels in cities? Environ. Pollut. 2018, 243, 163–176. [Google Scholar] [CrossRef]
  8. Khan, F.I.; Abbasi, S.A. Effective design of greenbelts using mathematical models. J. Hazard. Mater. 2001, 81, 33–65. [Google Scholar] [CrossRef]
  9. Janhäll, S. Review on urban vegetation and particle air pollution-Deposition and dispersion. Atmos. Environ. 2015, 105, 130–137. [Google Scholar] [CrossRef]
  10. Escobedo, F.J.; Kroeger, T.; Wagner, J.E. Urban forests and pollution mitigation: Analyzing ecosystem services and disservices. Environ. Pollut. 2011, 159, 2078–2087. [Google Scholar] [CrossRef]
  11. Hofman, J.; Bartholomeus, H.; Janssen, S.; Calders, K.; Wuyts, K.; Van Wittenberghe, S.; Samson, R. Influence of tree crown characteristics on the local PM10 distribution inside an urban street canyon in Antwerp (Belgium): A model and experimental approach. Urban For. Urban Green. 2016, 20, 265–276. [Google Scholar] [CrossRef]
  12. Petroff, A.; Mailliat, A.; Amielh, M.; Anselmet, F. Aerosol dry deposition on vegetative canopies. Part I: Review of present knowledge. Atmos. Environ. 2008, 42, 3625–3653. [Google Scholar] [CrossRef]
  13. Kroeger, T.; Escobedo, F.J.; Hernandez, J.L.; Varela, S.; Delphin, S.; Fisher, J.R.B.; Waldron, J. Reforestation as a novel abatement and compliance measure for ground-level ozone. Proc. Natl. Acad. Sci. USA 2014, 111, E4204–E4213. [Google Scholar] [CrossRef] [Green Version]
  14. Nowak, D.J.; Hirabayashi, S.; Bodine, A.; Greenfield, E. Tree and forest effects on air quality and human health in the United States. Environ. Pollut. 2014, 193, 119–129. [Google Scholar] [CrossRef] [Green Version]
  15. Nowak, D.J.; Hirabayashi, S.; Bodine, A.; Hoehn, R. Modeled PM2.5 removal by trees in ten U.S. cities and associated health effects. Environ. Pollut. 2013, 178, 395–402. [Google Scholar] [CrossRef] [PubMed]
  16. Han, D.; Shen, H.; Duan, W.; Chen, L. A review on particulate matter removal capacity by urban forests at different scales. Urban For. Urban Green. 2020, 48, 126565. [Google Scholar] [CrossRef]
  17. Zhang, L.; Zhang, Z.; Chen, L.; McNulty, S. An investigation on the leaf accumulation-removal efficiency of atmospheric particulate matter for five urban plant species under different rainfall regimes. Atmos. Environ. 2019, 208, 123–132. [Google Scholar] [CrossRef]
  18. Moonen, P.; Gromke, C.; Dorer, V. Performance assessment of Large Eddy Simulation (LES) for modeling dispersion in an urban street canyon with tree planting. Atmos. Environ. 2013, 75, 66–76. [Google Scholar] [CrossRef]
  19. Vos, P.E.J.; Maiheu, B.; Vankerkom, J.; Janssen, S. Improving local air quality in cities: To tree or not to tree? Environ. Pollut. 2013, 183, 113–122. [Google Scholar] [CrossRef] [PubMed]
  20. Jeanjean, A.; Buccolieri, R.; Eddy, J.; Monks, P.; Leigh, R. Air quality affected by trees in real street canyons: The case of Marylebone neighbourhood in central London. Urban For. Urban Green. 2017, 22, 41–53. [Google Scholar] [CrossRef]
  21. Abhijith, K.V.; Kumar, P.; Gallagher, J.; McNabola, A.; Baldauf, R.; Pilla, F.; Broderick, B.; Di Sabatino, S.; Pulvirenti, B. Air pollution abatement performances of green infrastructure in open road and built-up street canyon environments—A review. Atmos. Environ. 2017, 162, 71–86. [Google Scholar] [CrossRef]
  22. Moon, N.; Seo, J.; Ha, J. Calculation of PM2.5 Contribution Concentrations and Early Deaths due to Operation of Major National Industrial Complexes. Environ. Forum 2018, 228, 1–15. [Google Scholar] [CrossRef]
  23. Choi, J.-W. A Study on Vegetation Changes for 11years and Vegetation Structure in the Green Buffer Zone of Sihwa Industrial Complex. J. Korean Soc. Environ. Restor. Technol. 2018, 21, 81–96. [Google Scholar] [CrossRef]
  24. Yoo, S.Y.; Kim, T.; Ham, S.; Choi, S.; Park, C.R. Importance of urban green at reduction of particulate matters in Sihwa Industrial Complex, Korea. Sustainability 2020, 12, 7647. [Google Scholar] [CrossRef]
  25. Chen, J.; Yu, X.; Sun, F.; Lun, X.; Fu, Y.; Jia, G.; Zhang, Z.; Liu, X.; Mo, L.; Bi, H. The concentrations and reduction of airborne particulate matter (PM10, PM2.5, PM1) at shelterbelt site in Beijing. Atmosphere 2015, 6, 650–676. [Google Scholar] [CrossRef] [Green Version]
  26. Wu, Y.; Liu, J.; Zhai, J.; Cong, L.; Wang, Y.; Ma, W.; Zhang, Z.; Li, C. Comparison of dry and wet deposition of particulate matter in near-surface waters during summer. PLoS ONE 2018, 13, e0199241. [Google Scholar] [CrossRef] [PubMed]
  27. McMurry, P.H.; Stolzenburg, M.R. On the sensitivity of particle size to relative humidity for Los Angeles aerosols. Atmos. Environ. 1989, 23, 497–507. [Google Scholar] [CrossRef]
  28. Wallace, L.A.; Wheeler, A.J.; Kearney, J.; Van Ryswyk, K.; You, H.; Kulka, R.H.; Rasmussen, P.E.; Brook, J.R.; Xu, X. Validation of continuous particle monitors for personal, indoor, and outdoor exposures. J. Expo. Sci. Environ. Epidemiol. 2011, 21, 49–64. [Google Scholar] [CrossRef] [PubMed]
  29. Gao, T.; Liu, F.; Wang, Y.; Mu, S.; Qiu, L. Reduction of atmospheric suspended particulate matter concentration and influencing factors of green space in Urban forest park. Forests 2020, 11, 950. [Google Scholar] [CrossRef]
  30. Nowak, D.J.; Hirabayashi, S.; Doyle, M.; McGovern, M.; Pasher, J. Air pollution removal by urban forests in Canada and its effect on air quality and human health. Urban For. Urban Green. 2018, 29, 40–48. [Google Scholar] [CrossRef]
  31. Li, X.; Zhang, T.; Sun, F.; Song, X.; Zhang, Y.; Huang, F.; Yuan, C.; Yu, H.; Zhang, G.; Qi, F.; et al. The relationship between particulate matter retention capacity and leaf surface micromorphology of ten tree species in Hangzhou, China. Sci. Total Environ. 2021, 771, 144812. [Google Scholar] [CrossRef]
  32. Treshow, M.; Bell, J. Historical perspectives. In Air Pollution and Plant Life; United States Department of Energy: Washington, DC, USA, 2002. [Google Scholar]
  33. Thakar, B.; Mishra, P. Dust collection potential and air pollution tolerance index of tree vegetation around Vedanta Aluminium Limited, Jharsuguda. Bioscan 2010, 3, 603–612. [Google Scholar]
  34. Song, Y.; Maher, B.A.; Li, F.; Wang, X.; Sun, X.; Zhang, H. Particulate matter deposited on leaf of five evergreen species in Beijing, China: Source identification and size distribution. Atmos. Environ. 2015, 105, 53–60. [Google Scholar] [CrossRef]
  35. Qiu, Y.; Guan, D.; Song, W.; Huang, K. Capture of heavy metals and sulfur by foliar dust in urban Huizhou, Guangdong Province, China. Chemosphere 2009, 75, 447–452. [Google Scholar] [CrossRef] [PubMed]
  36. Yin, S.; Shen, Z.; Zhou, P.; Zou, X.; Che, S.; Wang, W. Quantifying air pollution attenuation within urban parks: An experimental approach in Shanghai, China. Environ. Pollut. 2011, 159, 2155–2163. [Google Scholar] [CrossRef]
  37. Gratani, L.; Crescente, M.F.; Varone, L. Long-term monitoring of metal pollution by urban trees. Atmos. Environ. 2008, 42, 8273–8277. [Google Scholar] [CrossRef]
  38. Jin, E.J.; Yoon, J.H.; Bae, E.J.; Jeong, B.R.; Yong, S.H. Particulate Matter Removal Ability of Ten Evergreen Trees Planted in Korea Urban Greening. Forests 2021, 12, 438. [Google Scholar] [CrossRef]
  39. Ottosen, T.B.; Kumar, P. The influence of the vegetation cycle on the mitigation of air pollution by a deciduous roadside hedge. Sustain. Cities Soc. 2020, 53, 101919. [Google Scholar] [CrossRef]
  40. Qin, H.; Hong, B.; Huang, B.; Cui, X.; Zhang, T. How dynamic growth of avenue trees affects particulate matter dispersion: CFD simulations in street canyons. Sustain. Cities Soc. 2020, 61, 102331. [Google Scholar] [CrossRef]
  41. Hofman, J.; Bartholomeus, H.; Calders, K.; Van Wittenberghe, S.; Wuyts, K.; Samson, R. On the relation between tree crown morphology and particulate matter deposition on urban tree leaves: A ground-based LiDAR approach. Atmos. Environ. 2014, 99, 130–139. [Google Scholar] [CrossRef]
  42. Yan, L.; Yu-lan, B.L.; Wei-wei, W.G. Relationship between meteorological conditions and particle size distribution of atmospheric aerosols. J. Meteorol. Environ. 2009, 1. Available online: https://en.cnki.com.cn/Article_en/CJFDTotal-LNQX200901001.htm (accessed on 15 May 2021).
  43. Liu, X.; Yu, X.; Zhang, Z. PM2.5 concentration differences between various forest types and its correlation with forest structure. Atmosphere 2015, 6, 1801–1815. [Google Scholar] [CrossRef] [Green Version]
  44. Hu, M.; Liu, S.; Wu, Z.-J.; Zhang, J.; Zhao, Y.-L.; Wehner, B.; Wiedensolher, A. Effects of high temperature, high relative humidity and rain process on particle size distributions in the summer of Beijing. Huan Jing Ke Xue = Huanjing Kexue 2006, 27, 2293–2298. [Google Scholar] [PubMed]
  45. Seinfeld, J.H.; Pandis, S.N. Atmospheric Chemistry and Physics: From Air Pollution to Climate Change, 3rd ed.; John Wiley & Sons: Hoboken, NJ, USA, 2016. [Google Scholar]
  46. Xu, X.; Kim, J.-O. Planting Design Strategies and Green Space Planning to Mitigate Respirable Particulate Matters-Case Studies in Beijing, China. J. Korean Inst. Landsc. Archit. 2017, 45, 40–49. [Google Scholar]
  47. Kim, H.C.; Kim, E.; Bae, C.; Cho, J.H.; Kim, B.U.; Kim, S. Regional contributions to particulate matter concentration in the Seoul metropolitan area, South Korea: Seasonal variation and sensitivity to meteorology and emissions inventory. Atmos. Chem. Phys. 2017, 17, 10315–10332. [Google Scholar] [CrossRef] [Green Version]
  48. Kim, M.J. Changes in the relationship between particulate matter and surface temperature in Seoul from 2002–2017. Atmosphere 2019, 10, 238. [Google Scholar] [CrossRef] [Green Version]
  49. Liu, L.; Guan, D.; Peart, M.R.; Wang, G.; Zhang, H.; Li, Z. The dust retention capacities of urban vegetation-A case study of Guangzhou, South China. Environ. Sci. Pollut. Res. 2013, 20, 6601–6610. [Google Scholar] [CrossRef]
  50. Gromke, C.; Ruck, B. Influence of trees on the dispersion of pollutants in an urban street canyon-Experimental investigation of the flow and concentration field. Atmos. Environ. 2007, 41, 3287–3302. [Google Scholar] [CrossRef] [Green Version]
  51. Grant, P.F.; Nickling, W.G. Direct field measurement of wind drag on vegetation for application to windbreak design and modelling. Land Degrad. Dev. 1998, 9, 57–66. [Google Scholar] [CrossRef]
  52. Frank, C.; Ruck, B. Double-arranged mound-mounted shelterbelts: Influence of porosity on wind reduction between the shelters. Environ. Fluid Mech. 2005, 5, 267–292. [Google Scholar] [CrossRef]
  53. Kim, K.H.; Kim, M.Y. The effects of Asian Dust on particulate matter fractionation in Seoul, Korea during spring 2001. Chemosphere 2003, 51, 707–721. [Google Scholar] [CrossRef]
  54. Sharma, A.P.; Kim, K.H.; Ahn, J.W.; Shon, Z.H.; Sohn, J.R.; Lee, J.H.; Ma, C.J.; Brown, R.J.C. Ambient particulate matter (PM10) concentrations in major urban areas of Korea during 1996–2010. Atmos. Pollut. Res. 2014, 5, 161–169. [Google Scholar] [CrossRef] [Green Version]
  55. Jung, M.I.; Son, S.W.; Kim, H.C.; Kim, S.W.; Park, R.J.; Chen, D. Contrasting synoptic weather patterns between non-dust high particulate matter events and Asian dust events in Seoul, South Korea. Atmos. Environ. 2019, 214, 116864. [Google Scholar] [CrossRef]
  56. Lee, B.K.; Hieu, N.T. Seasonal Variation and Sources of Heavy Metals in Atmospheric Aerosols in a esidential Area of Ulsan, Korea. Aerosol Air Qual. Res. 2011, 11, 679–688. [Google Scholar] [CrossRef]
  57. Huang, C.-H.; Tai, C.-Y. Relative humidity effect on PM2.5 readings recorded by collocated beta attenuation monitors. Environ. Eng. Sci. 2008, 25, 1079–1090. [Google Scholar] [CrossRef]
  58. Lou, C.; Liu, H.; Li, Y.; Peng, Y.; Wang, J.; Dai, L. Relationships of relative humidity with PM2.5 and PM10 in the Yangtze River Delta, China. Environ. Monit. Assess. 2017, 189. [Google Scholar] [CrossRef]
  59. Crilley, L.R.; Shaw, M.; Pound, R.; Kramer, L.J.; Price, R.; Young, S.; Lewis, A.C.; Pope, F.D. Evaluation of a low-cost optical particle counter (Alphasense OPC-N2) for ambient air monitoring. Atmos. Meas. Tech. 2018, 11, 709–720. [Google Scholar] [CrossRef] [Green Version]
  60. Gugamsetty, B.; Wei, H.; Liu, C.; Awasthi, A.; Hsu, S.; Tsai, C.; Roam, G.; Wu, Y.; Chen, C. Source Characterization and Apportionment of PM10, PM2.5 and PM0.1 by Using Positive Matrix Factorization. Aerosol Air Qual. Res. 2012, 12, 476–491. [Google Scholar] [CrossRef]
Figure 1. (a) Before the implementation of green buffer (GB) in 1995; (b) after the implementation of green buffer (GB) in 2016; (c) wind rose during study period; (d) cross-section of green buffer (GB).
Sustainability 13 05538 g001
Figure 2. The location of the national atmospheric environmental research station (NAERS) and observed points (OPs) nearby the industrial complex (IC) residential area (RA), and west coast area (WCA), Gyeonggi-do, Korea.
Sustainability 13 05538 g002
Figure 3. (a) The average annual PM10 concentration (µg/m3) in the NAERS-RA (National atmospheric environmental research station nearby residential area), NAERS-IC (National atmospheric environmental research station nearby industrial complex) and WCA (west coast area); (b) PM10 reduction rate (%) of green buffer (GB).
Sustainability 13 05538 g003
Figure 4. The number of high PM pollution days in the NAERS-RA (National atmospheric environmental research station nearby residential area) and NAERS-IC (National atmospheric environmental research station nearby industrial complex) during and after the implementation of the green buffer (GB).
Sustainability 13 05538 g004
Figure 5. (a) Monthly PM10 concentration (µg/m3) in the OP-RA (Dustmate observed point nearby residential area) and OP-IC (Dustmate observed point nearby industrial complex); (b) monthly PM2.5 concentration (µg/m3) in the OP-RA (Dustmate observed point nearby residential area) and OP-IC (Dustmate observed point nearby industrial complex); (c) PM reduction rate (%) of green buffer (GB).
Sustainability 13 05538 g005
Table 1. Correlation coefficients between PM reduction rate, air pollutant emissions, weather factors and NDVI.
Correlation
Coefficient
PM10 Reduction RatePM10 Reduction Rate
During GB Implementation
(2006~2012)
After GB Implementation
(2013~2017)
NOx−0.080.096
SOx−0.85 **−0.80 **
Temperature−0.97 ****0.39
Wind Speed0.88 ***0.94 ***
Annual Precipitation0.86 **−0.49
NDVI0.69 *0.56
* p < 0.1, ** p < 0.05, *** p < 0.01, **** p < 0.001.
Publisher’s Note: MDPI stays neutral with regard to jurisdictional claims in published maps and institutional affiliations.

