Article

The Relationship between Neighborhood Characteristics and Homicide in Karachi, Pakistan

1
Department of Earth and Environmental Sciences, Bahria University Karachi Campus, Karachi 75300, Pakistan
2
Department of Geography, University of Karachi, Karachi 75300, Pakistan
3
Key Laboratory of Digital Earth Science, Aerospace Information Research Institute, Chinese Academy of Sciences, Beijing 100094, China
4
Department of Political Science and Geography, Old Dominion University, Norfolk, VA 23529, USA
5
Dawn GIS, Geospatial Statistical Research & Analysis Division, Karachi 75300, Pakistan
6
State Key Laboratory of Information Engineering in Surveying, Mapping and Remote Sensing (LIESMARS), Wuhan University, Wuhan 430079, China
*
Author to whom correspondence should be addressed.
Sustainability 2021, 13(10), 5520; https://doi.org/10.3390/su13105520
Submission received: 19 March 2021 / Revised: 3 May 2021 / Accepted: 11 May 2021 / Published: 14 May 2021
(This article belongs to the Collection Social Sustainability and New Urban Residential Spaces)

Abstract

:
The geographical concentration of criminal violence is closely associated with the social, demographic, and economic structural characteristics of neighborhoods. However, few studies have investigated homicide patterns and their relationships with neighborhoods in South Asian cities. In this study, the spatial and temporal patterns of homicide incidences in Karachi from 2009 to 2018 were analyzed using the local indicators of spatial association (LISA) method. Generalized linear modeling (GLM) and geographically weighted Poisson regression (GWPR) methods were implemented to examine the relationship between influential factors and the number of homicides during the 2009–2018 period. The results demonstrate that the homicide hotspot or clustered areas with high homicide counts expanded from 2009 to 2013 and decreased from 2013 to 2018. The number of homicides in the 2017–2018 period had a positive relationship with the percentage of the population speaking Balochi. The unplanned areas with low-density residential land use were associated with low homicide counts, and the areas patrolled by police forces had a significant negative relationship with the occurrence of homicide. The GWPR models effectively characterized the varying relationships between homicide and explanatory variables across the study area. The spatio-temporal analysis methods can be adapted to explore violent crime in other cities with a similar social context.

1. Introduction

In September, 2015, the United Nations adopted the “2030 Agenda for Sustainable Development,” which contains 17 sustainable development goals (SDGs). The 2030 Agenda for Sustainable Development affirms that “there can be no sustainable development without peace and no peace without sustainable development” [1]. Unsustainable communities and human settlements are usually characterized by poverty, homelessness, and increasing levels of crime. Monitoring and analyzing criminal activity can be considered a direct or indirect contribution to achieving sustainable development goals and, in particular, to the implementation of SDG11 (Sustainable Cities and Communities) and SDG 16 (Peace, Justice, and Strong Institutions). Violent crime can result in severe socio-emotional impacts on individual victims and neighborhoods [2]. Violent crimes, such as homicides and assaults, have been studied from the perspective of criminology, policing, law, public health, and the natural environment [3,4,5]. In particular, the geographical concentration of criminal violence is strongly associated with the social, demographic, and economic structural features of neighborhoods [6]. Numerous studies have found that violent crimes such as homicide, robbery, and assault tend to increase where income inequality is high [7]. An empirical cross-country analysis by the World Bank also reported the positive relationship between income inequality and homicide and robbery rates [8]. The uneven distribution of homicide incidences among Latin American countries was attributed to factors such as social inequality, lack of employment opportunities, urban segregation, a culture of masculinity, and local drug markets [4]. McCall et al. conducted a study based on a systematic empirical assessment across different geographic units and reported that homicide rates were associated with social structural characteristics such as higher population size and density and higher unemployment rates in the United States [5]. Despite the wealth of criminology studies on the linkage between social, demographic, and economic factors and homicide rates, the majority of these works have focused on cities in developed countries. The spatio-temporal variation in crime and its association with neighborhood characteristics has been less explored and documented in the context of South Asian cities.
Spatio-temporal analysis approaches have been widely used in crime pattern analysis and forecasting and in connecting spatial and temporal crime factors, particularly in high-density crime areas [9,10]. The spatial pattern and concentration of criminal events have been measured using various geospatial technologies [11,12]. The generalized linear modeling (GLM) method is a commonly used statistical approach for exploring crime determinants and modeling the relationship between the number of crimes and potential explanatory variables. However, theories about the crime–population link suggest that their relationship may differ depending on the space in which crime takes place [13]. Since global models assume that relationships are the same for all areas, they may fail to capture the effects of key factors on neighborhood crime. Spatially non-stationary regression models have been used to detect spatial heterogeneity in the linkage between crime levels and the socioeconomic context [14]. Geographically weighted regression provides a useful method for analyzing the spatial variation in relationships for different locations by producing local coefficients and capturing the spatial variability of the relationships across space. Moreover, the method improves modeling performance by reducing spatial autocorrelation [15]. In recent studies, geographically weighted Poisson regression (GWPR) has been effectively employed to explore the relationship between the number of crimes and influential factors. In these cases, the GWPR method was observed to outperform the GLM method [16,17].
This study sought to examine the spatio-temporal patterns of homicide and how neighborhood contextual variables contribute to homicide in the urban setting of a South Asian city. Geographically weighted regression modeling (GWR) techniques were implemented due to the inhomogeneous relationship between neighborhoods and crime in the study area. Homicide and census data were obtained from Karachi, Pakistan, which is a highly populated city in South Asia. The current study can improve our understanding of the influence of neighborhood features on homicide. It can also provide policy implications for decision-makers to curb violence and improve public safety. The results suggest that spatio-temporal analysis can be effectively adapted to study violent crime in other cities with a similar social context.

2. Background Theories

Among criminology theories, routine activity theory argues that criminal offenses have three main elements that are based on geo-demographic characteristics, including a suitable target, the presence of offenders, and the absence of a guardian [18]. The geographical distribution of crime is generally seen as a function of the supply of motivated offenders, target availability, and the presence of guardians and can be measured using indirect estimates of the three elements [19]. Due to their impact on targets and guardianship, empirical analyses using routine activity theory have found that neighborhood characteristics such as age composition, ethnic diversity, marital status, population measures and characteristics, employment status, income levels, and dwelling values are influential predictors of crime [20,21].
Routine activity theory suggests that spatial heterogeneity is important for studying the relationship between crime and land use. The theory states that urban crime (e.g., violent offenses) is more likely to occur in mixed-use and high-density areas where contact between victims and their potential offenders is facilitated [22]. A high correlation between the amount of violent crime and non-residential land use was identified in Indianapolis, Indiana, United States [23]. Anderson, MacDonald, Bluthenthal, and Ashwood [24] found that residential districts were associated with less crime compared to areas with mixed land use and that commercial land use was associated with substantially more crime compared to mixed and residential land use in Los Angeles, California, United States. The theory also proposes that areas with mixed land use have an “eyes on the street” effect and a greater number of capable guardians, which results in less crime [25]. Some literature has found that mixed land use was associated with a decrease in homicide and aggravated assault [26]. Twinam [27] revealed that commercial land use led to higher street robbery and assault rates, while dense mixed land use exhibited lower crime rates due to the presence of more vigilant eyes.
Social disorganization theory argues that a high degree of social and economic deprivation, population turnover, and ethnic heterogeneity in a neighborhood is associated with social disorganization. An empirical analysis based on social disorganization theory relates demographic, economic, and social factors to criminal events. The positive relationship between neighborhoods with social disadvantages and violence has been revealed in several studies on social disorganization theory [28]. Cahill and Mulligan [29] used ethnic composition, education, population density, and variables measuring a neighborhood’s stability to test the applicability of social disorganization theory in Tucson, Arizona. The variables representing relationships in social disorganization theory and routine activity theory can be integrated into empirical analysis. Andresen [11,30] combined social disorganization theory and routine activity theory and highlighted the positive correlation between ethnic heterogeneity, unemployment, single-parent families, population changes, rented houses, and crime. Moreover, the study revealed that a reverse correlation existed between crime and enhanced education, income, and home ownership.
This study was built upon the concepts of routine activity theory and social disorganization theory. We assumed that homicide rates have an association with contextual variables such as population density, ethnicity, education status, economic level, land use, and guardianship within a neighborhood. The relationship between homicide and neighborhood characteristics was examined using several sets of influential variables.

3. Materials and Methods
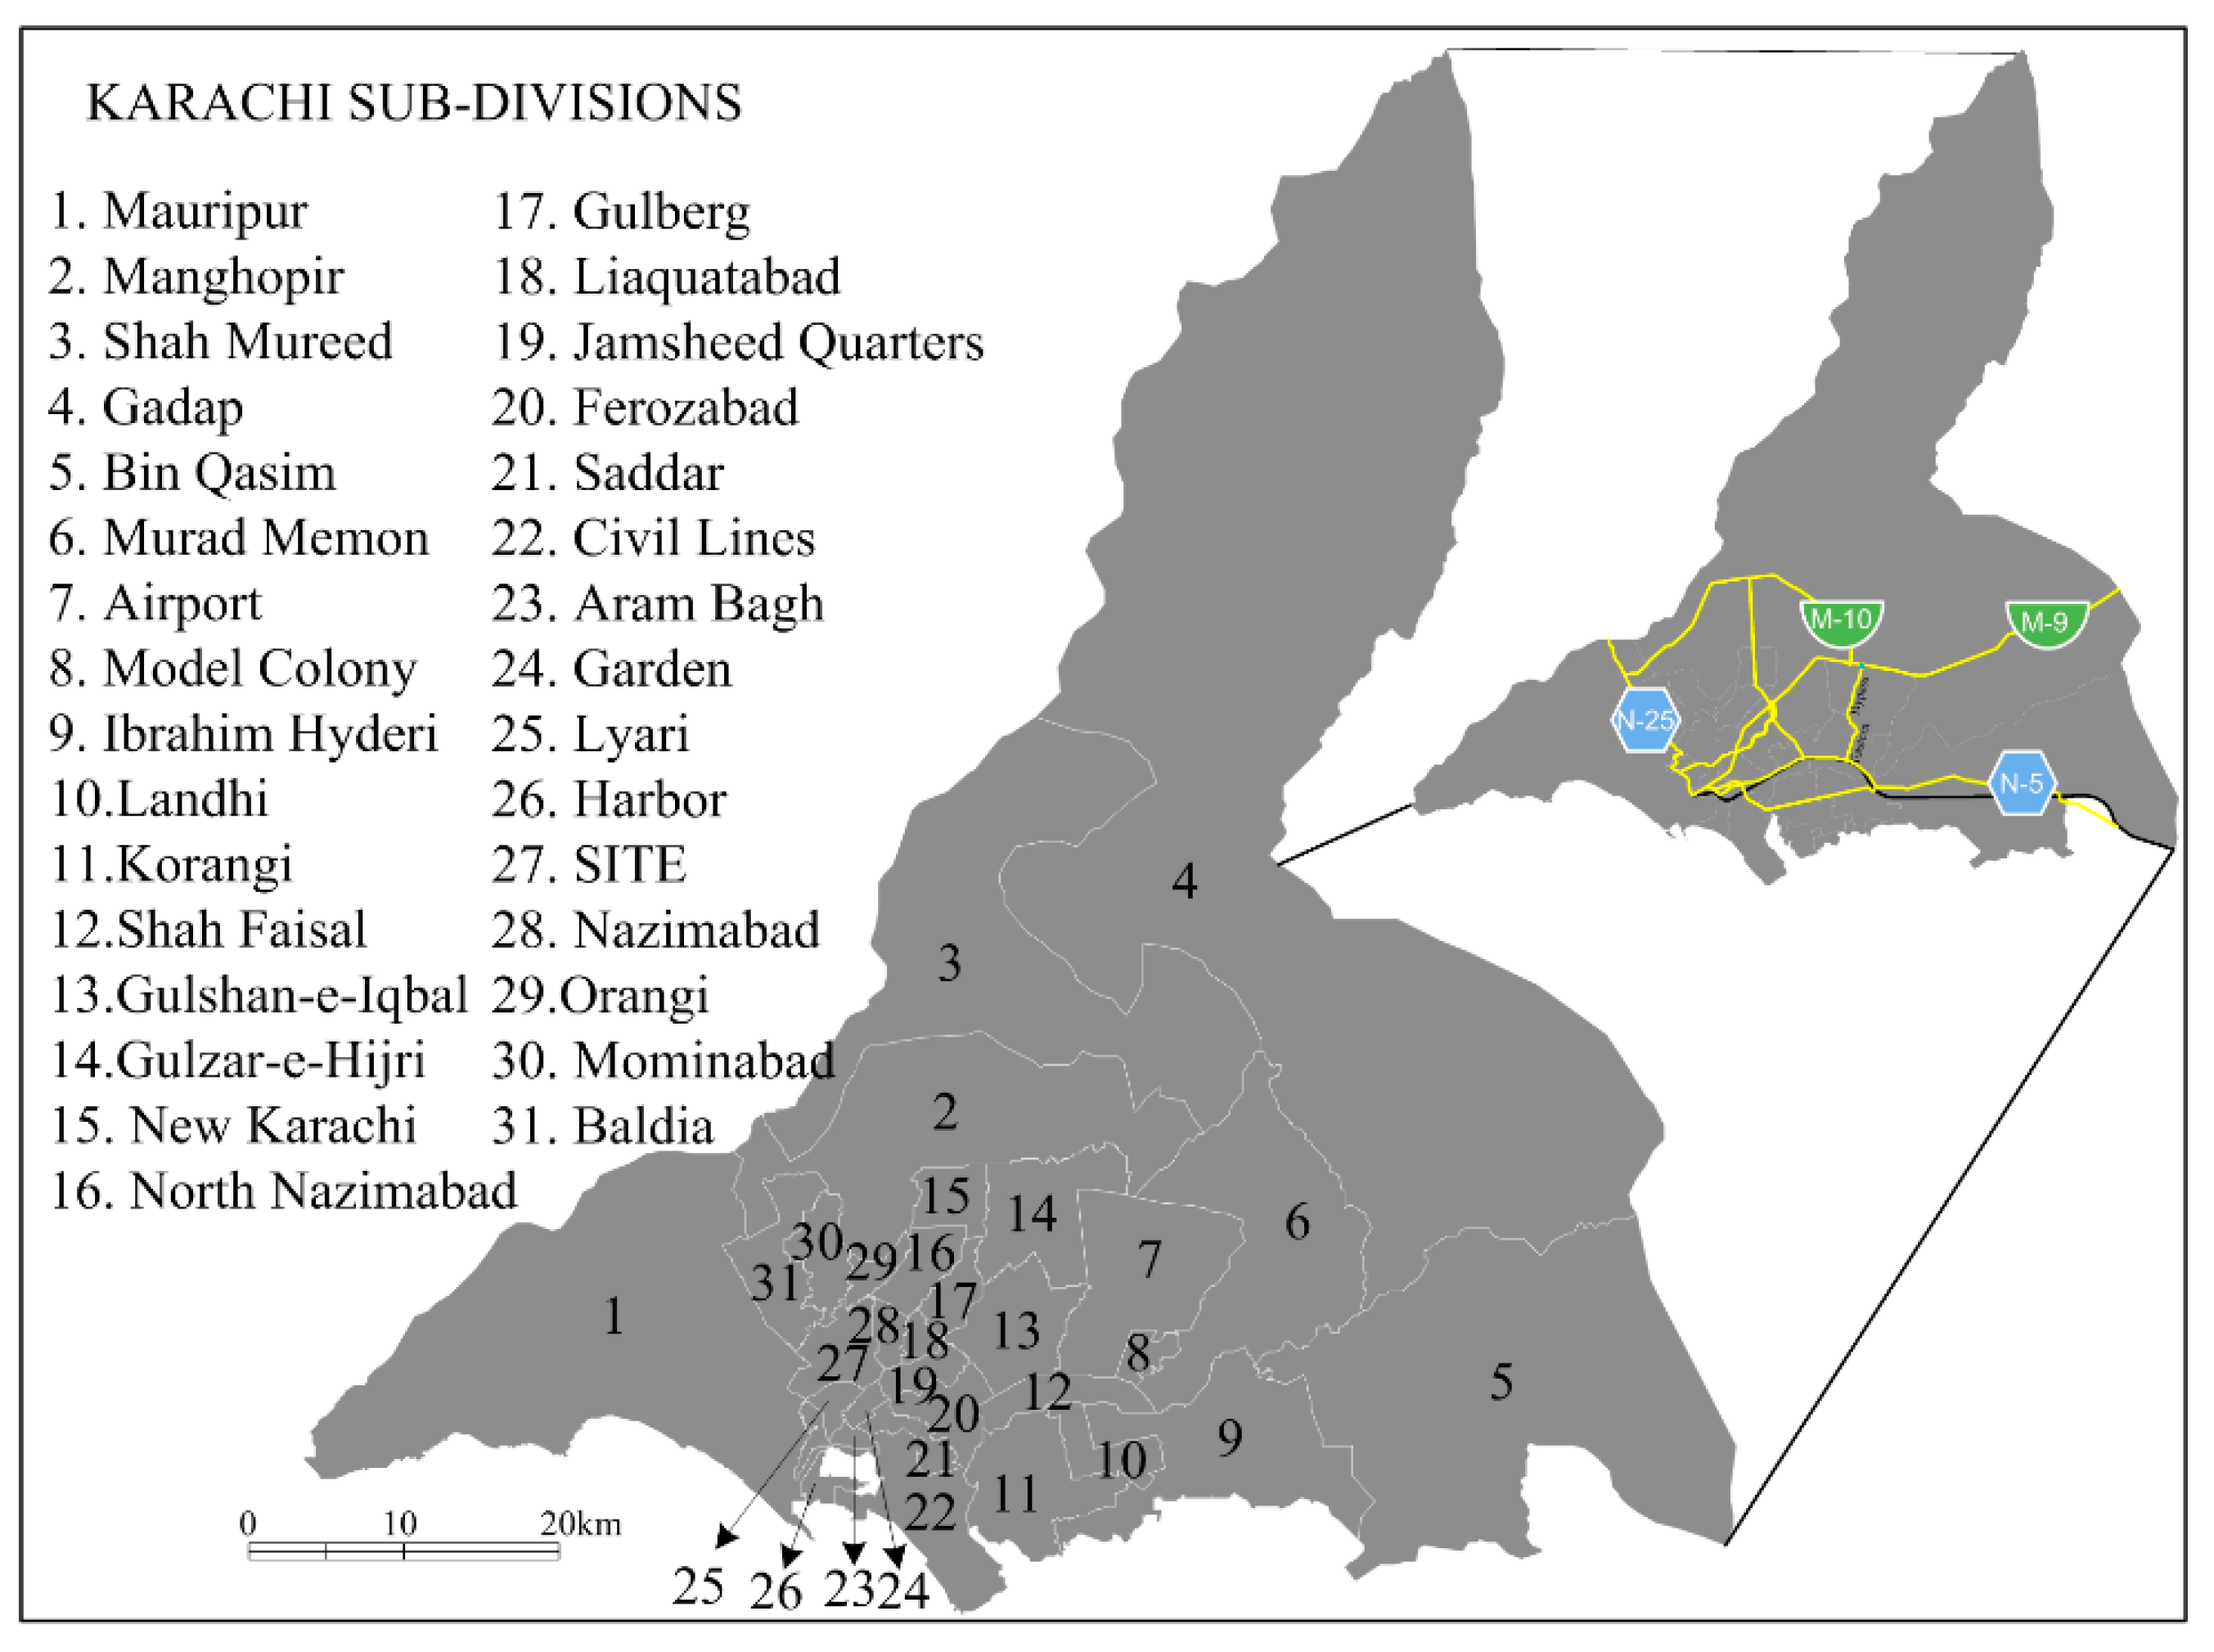
3.1. Study Area

This study was conducted in Karachi, the capital city of Sindh Province, Pakistan. It is located between 24°45′ N to 25°37′ N and 66°42′ E to 67°34′ N. It is the most urbanized, industrialized, and affluent city in Pakistan and the largest port in the country. The city is the most densely populated megapolis in Pakistan with a population of 20 million residents spread out over an area of 3530 km2 [31]. Karachi is composed of six administrative districts, including West, East, South, Malir, Korangi, and Central. They are further divided into 31 subdivisions, as shown in Figure 1. The topography can be broadly divided into two parts: the hilly areas in the north and west and the undulating plain and coastal areas in the southeast. The urban areas are mainly distributed in the plains near coastal areas. The Commissioners of Karachi, the heads of the subdivisions, are aided by Deputy Commissioners in strengthening the administration of public security.
Since the founding of Pakistan in 1947, Karachi has become the center for industry and business in the country. Population shift from rural to urban areas has been noticed due to job opportunities in this city since the 1980s. The population increased from 5 million to 10 million in the last two decades of the 20th century [32]. About one-third of these new arrivals were forced to take up residence in urban shantytowns, which lacked power, running water, or sanitation. The large number of immigrants also caused significant changes in the social structure, such as in population growth trajectories, the emigration and immigration in proportion to housing stocks, levels of well-being, and, subsequently, socioeconomic inequalities prevalent among residents. Since the end of the 20th century, the city has become a prominent area for criminals and crime. Karachi is one of the most cosmopolitan cities in Pakistan [32]. With more than two million foreign immigrants, mostly from Afghanistan, Bangladesh, Myanmar, and Sri Lanka, it has communities representing almost every ethnic group in Pakistan. An investigation of the impact of neighborhood features on crime is valuable for controlling criminal activities in the study area and cities with a similar social context in South Asia.

3.2. Data

The socio-demographic and socio-economic data used in this article to represent social disorganization theory and routine activity theory were obtained from the Pakistan Bureau of Statistics provided by the Government of Pakistan. Subdivision is the smallest census area that covers the entire Karachi. Data aggregated at the census dissemination area level have been considered appropriate for understanding the environmental determinants of crimes in previous studies using neighborhood theories [33,34]. Thus, subdivisions were selected as analysis units in this study. The jurisdiction of subdivision boundaries was delineated from census maps provided by the Pakistan Bureau of Statistics with the assistance of high-resolution satellite images from Google Earth Pro software. Homicide records were collected from the Central Police Office and Citizens-Police Liaison Committee. The crime data were geo-coded using a GPS survey based on a list of homicide incidents provided by the Karachi Police. A substantial data survey was conducted to accurately confirm the geographic location of homicide incidents over a period of 13 months from November 2017 to February 2019. Subsequent to collection of homicide data in accordance to their addresses provided by the Central Police Office, the researchers visited these locations, collected coordinate data using Global Positioning System (GPS) devices, and created the geo-coded crime dataset.
Multiple variables relating to neighborhood characteristics were obtained to reflect neighborhood differences in poverty, race and ethnicity, immigration, family structure, homeownership, and residential stability. These variables were selected based on previous studies on violent crimes using social disorganization theory and routine activity theory, and consideration of data availability [14,34,35]. Specifically, a total of 20 variables were selected to explore the relationships between neighborhood features and homicide in the study area (Table 1). The variables were further grouped into six dimensions, namely, population density, linguistic distribution, education level, economic status, land use, and police performance.
Various studies have reported that the majority of violent crimes are recorded in racially and ethnically homogenous clusters within large heterogeneous population clusters or blocks [30]. Since all of the people in the study area belonged to the Aryan race, the percentages of residents speaking various languages, such as Balochi, Urdu, Pashtu, Punjabi, and others, were included to represent different culture groups as alternatives for racial groups. The city is characterized by a significant degree of cultural diversity since the immigrants are from all over Pakistan. This includes different traditions, lifestyles, and education levels, which justifies the use of the language distribution as a proxy for examining crimes in relation to ethnicity. People in a linguistic group are obliged to the same tribal culture and values in Karachi [36]. Since the mid-1960s, Karachi has suffered endemic political conflict and criminal violence, which revolved around control of the city on a lingual basis [37].
The third indicator includes variables on literacy and its various standards among males and females. According to the 2017 census, literacy was defined as the capability to read and comprehend materials from newspapers or magazines, to write a simple letter, and to perform basic calculations. With 84.1% of the population having reading and writing skills, Karachi has previously topped Pakistan’s list of the most literate districts. However, the city has deteriorated due to social circumstances, such as the large influx of illiterate migrants searching for employment. Illiteracy was reported to have a significant association with honor killing and honor-related violence in Pakistan [38]. The linkage between low literacy and crime rates in neighborhoods has been revealed in a study examining neighborhood structural characteristics and offending in Karachi [39]. Moreover, access to educational resources provides opportunities for youth to get literate and socialize with their peers, which may have a positive impact on the development of social networks that contribute to community social organization [40].
Since crime is related to economic activity, the economic indicator in this study includes two variables pertaining to unemployment and the average livelihood or average household income in planned areas. Previous studies have revealed significant positive relationships between economic factors, unemployment, and criminal activity. Stacy et al. [9] noted that an increase in the unemployment rate leads to an increase in total violent crime. Furthermore, according to Jane Jacob’s “eyes on the street” theory [25], there may be a connection between crime and economic activity. The land-use indicator variable accounts for the factors pertaining to both planned and unplanned areas. Land encroachments are protected on a political basis in Karachi, resulting in the existence of unplanned settlements within extents of planned areas and their peripheries. Planned areas are usually existing commercial centers in the form of shopping malls, trade markets, banquets, and offices, etc. The unplanned areas are mainly composed of residential areas. Thus, land use was used as an indicator representing planned and unplanned settlements based on attractions for offenders [22]. The inclusion of police performance measures is necessary as a step toward eliminating crime. Variables representing efficient protective services were used as indicators, including police surveillance areas, accused persons, arrested persons, and the number of police personnel.

3.3. Methodology

3.3.1. Spatio-Temporal Analysis

The study area was divided into 0.5 km2 geographic grid cells, and the exact number of homicides was recorded in each grid cell. Since the administrative boundaries may change during the study period, the grid cells allow us to analyze the spatio-temporal changes of homicide incidents over time with a consistent framework [41]. In this study, the Local Indicators of Spatial Association (LISA) method proposed by Anselin [42] was further used to identify local crime clusters. The local crime clusters can be detected using LISA when considering the crime counts for the analysis unit and its spatial neighbors. Four types of local clusters may be identified by calculating local Moran’s I values, including: high-high, low-low, low-high, and high-low. High-high clusters represent hot spots with high crime numbers that are surrounded by areas with high crime numbers. Low-low clusters represent cold spots with low crime rates that are surrounded by areas with low crime rates. High-low clusters refer to areas with high crime that are surrounded by areas with low crime, while low-high clusters are areas with low crime surrounded by areas with high crime. There are also areas with statistically insignificant clustering patterns. LISA was calculated for three time periods, 1999–2000, 2013–2014, and 2017–2018, using ArcGIS 10.5 software. Maps were created to depict the temporal variation of homicide clustering patterns in the study area from 1999 to 2018.

3.3.2. Regression Analysis

The total number of homicide incidences between 2017 and 2018 was aggregated as the dependent variable. The variables that had an impact on the incidence of homicide were used as potential explanatory variables. Since the socio-economic data reflecting neighborhood characteristics were provided at subdivision level, the homicide data were aggregated to the same level based on subdivision-level boundaries. It was possible for the explanatory variables to be correlated, especially for those variables in the same dimension. Multicollinearity detection was performed before regression analysis. The variables with a variance inflation factor (VIF) greater than 10 were excluded from the regression analysis. The multicollinearity problem was addressed by removing some of the correlated variables after evaluating the importance of each variable [14]. If two variables were highly correlated, the one that was less important was dropped from the regression model [14,35]. The importance of each variable was assessed based on the significance of the regression coefficient and the model fit. After accounting for multicollinearity, seven explanatory variables were kept for subsequent regression analysis (Table 2).
The GLM method with a Poisson distribution and log-based link function was used to model the relationship between the number of homicides and explanatory variables as a global model. The GWPR model was implemented to explore the spatial variation of coefficients. The bandwidth of the GWPR model was optimized using the corrected Akaike information criteria (AICc) during model calibration. Several model measures, including AICc, mean absolute deviation (MAD), and the percent deviance explained, were used to compare the performance of the GLM and GWPR models [43]. The local deviation percentage explained (local_pdev) was used for depicting the spatial variation of the GWPR model’s explanatory power. A higher local_pdev value represented a better model fitting result. The GLM and GWPR methods were implemented using GWR 4.0 software.

4. Results and Discussion

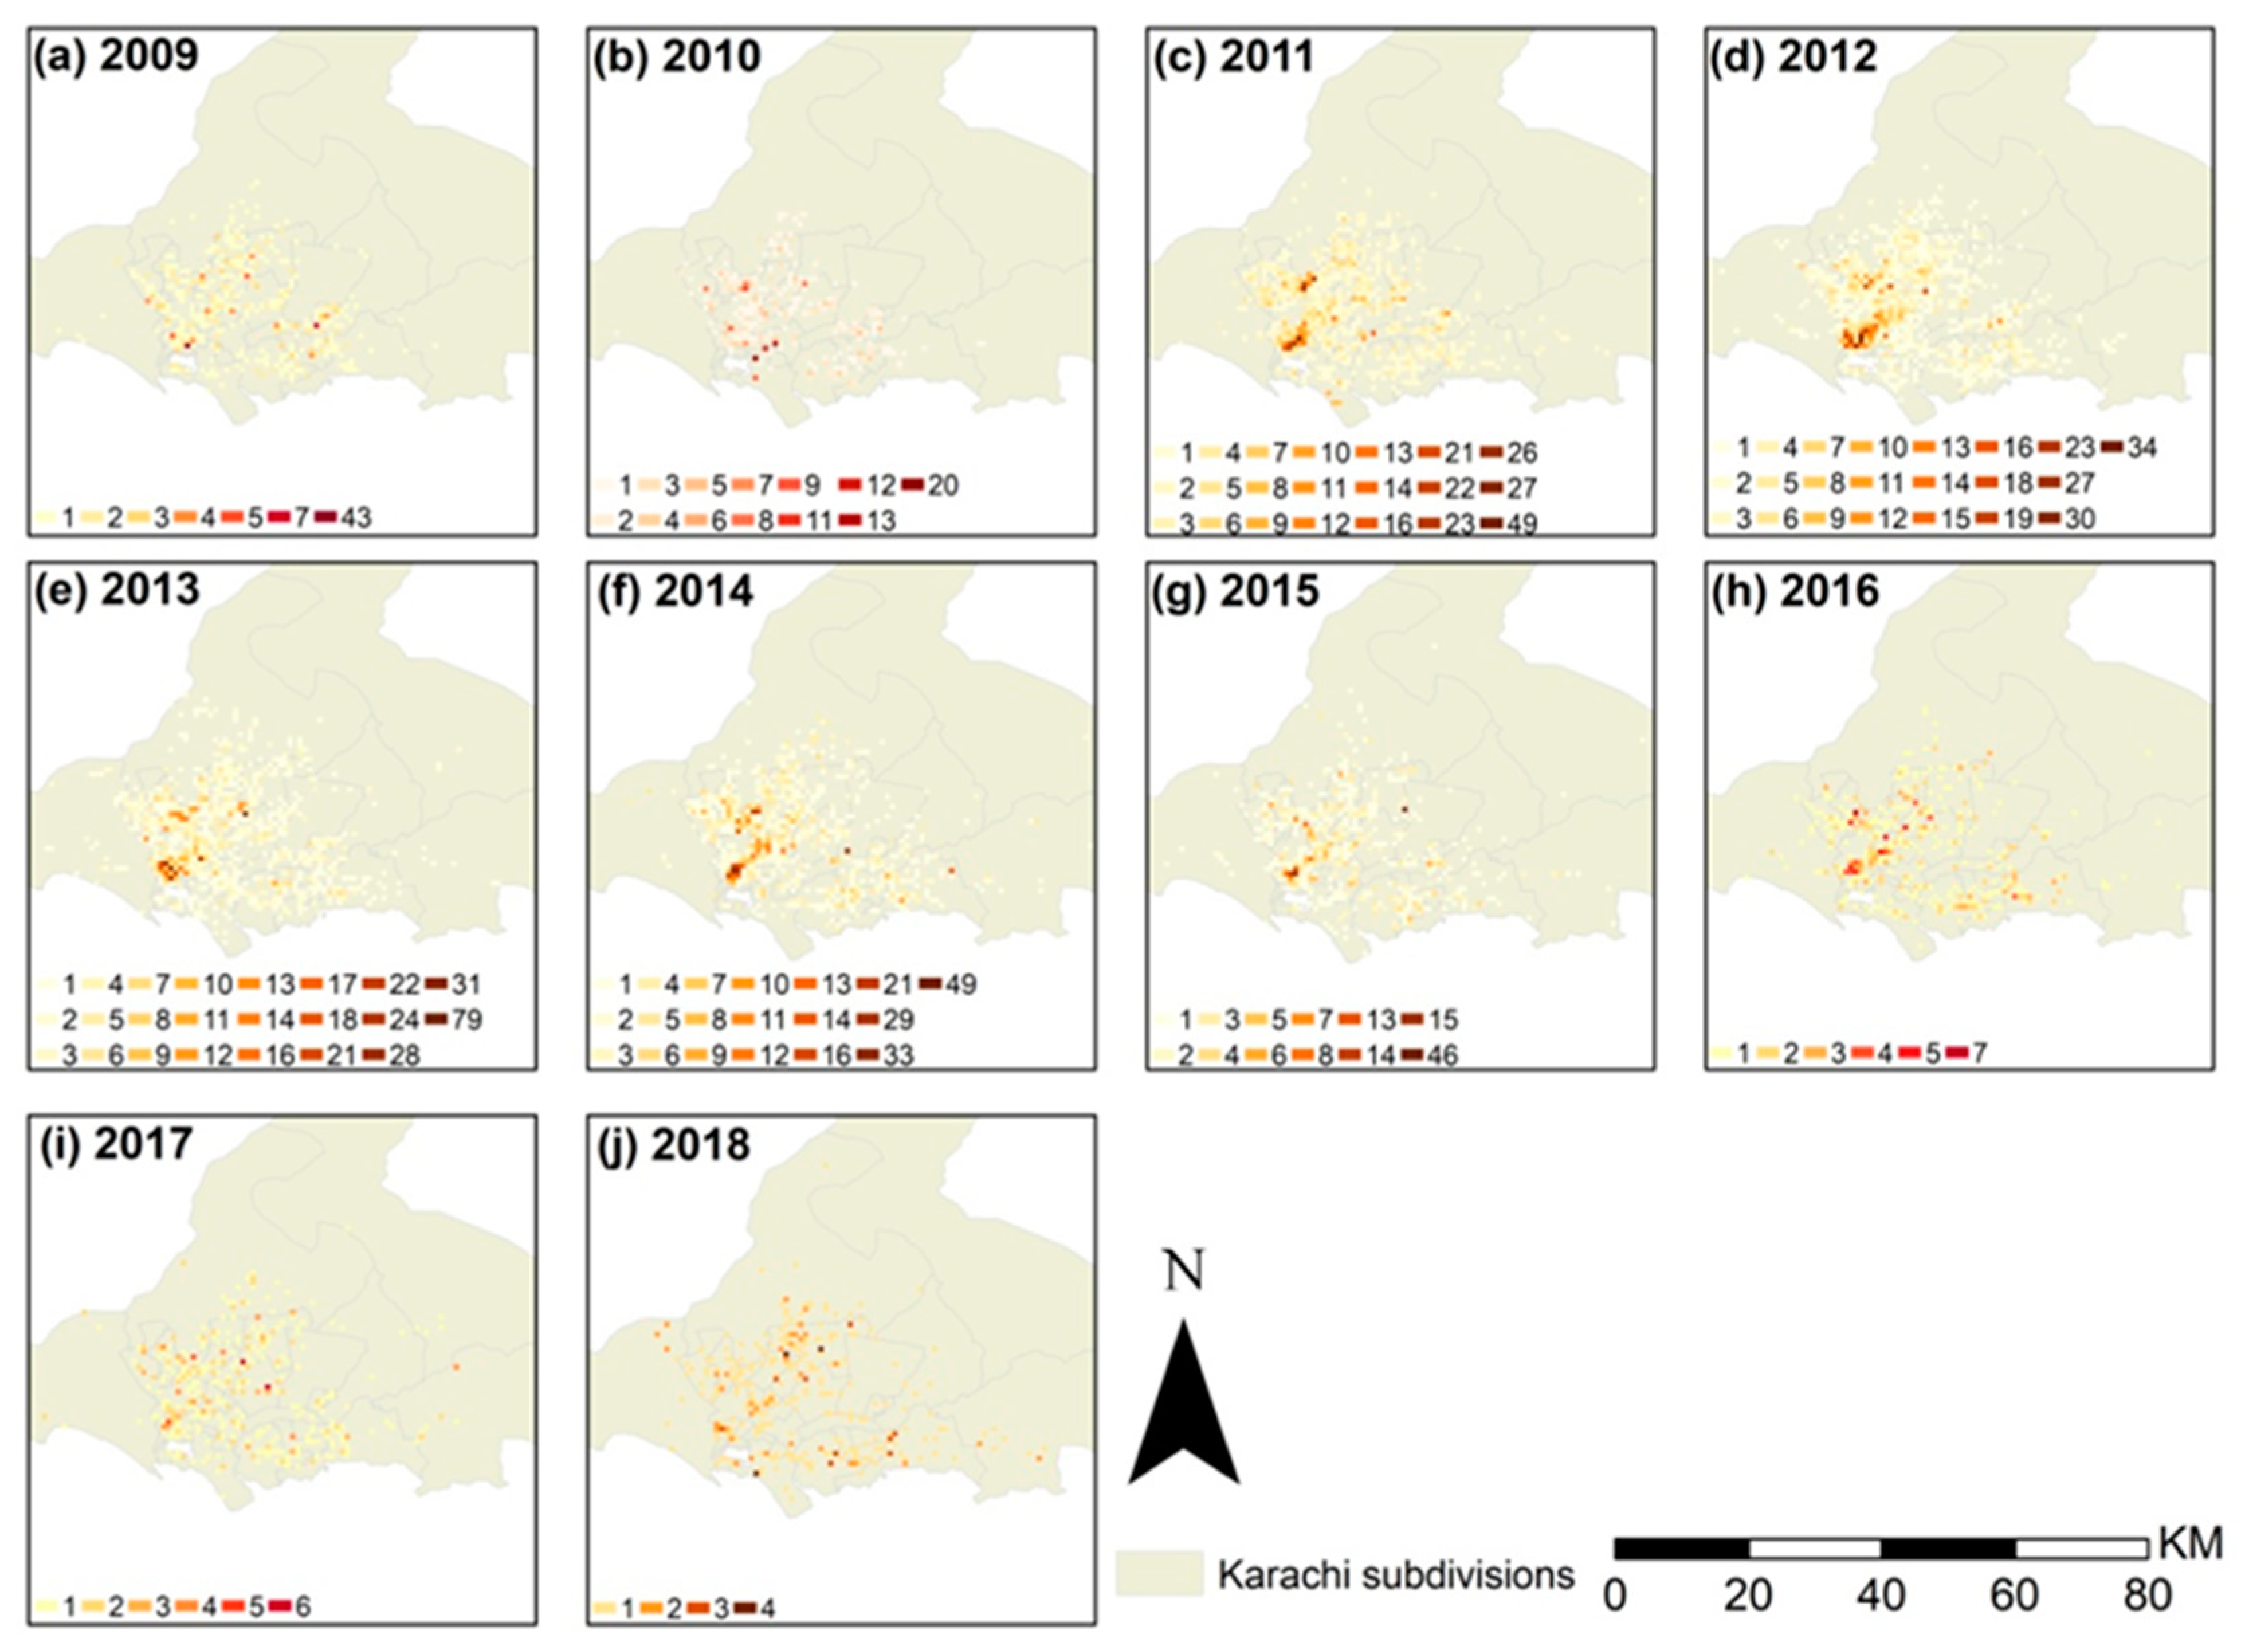
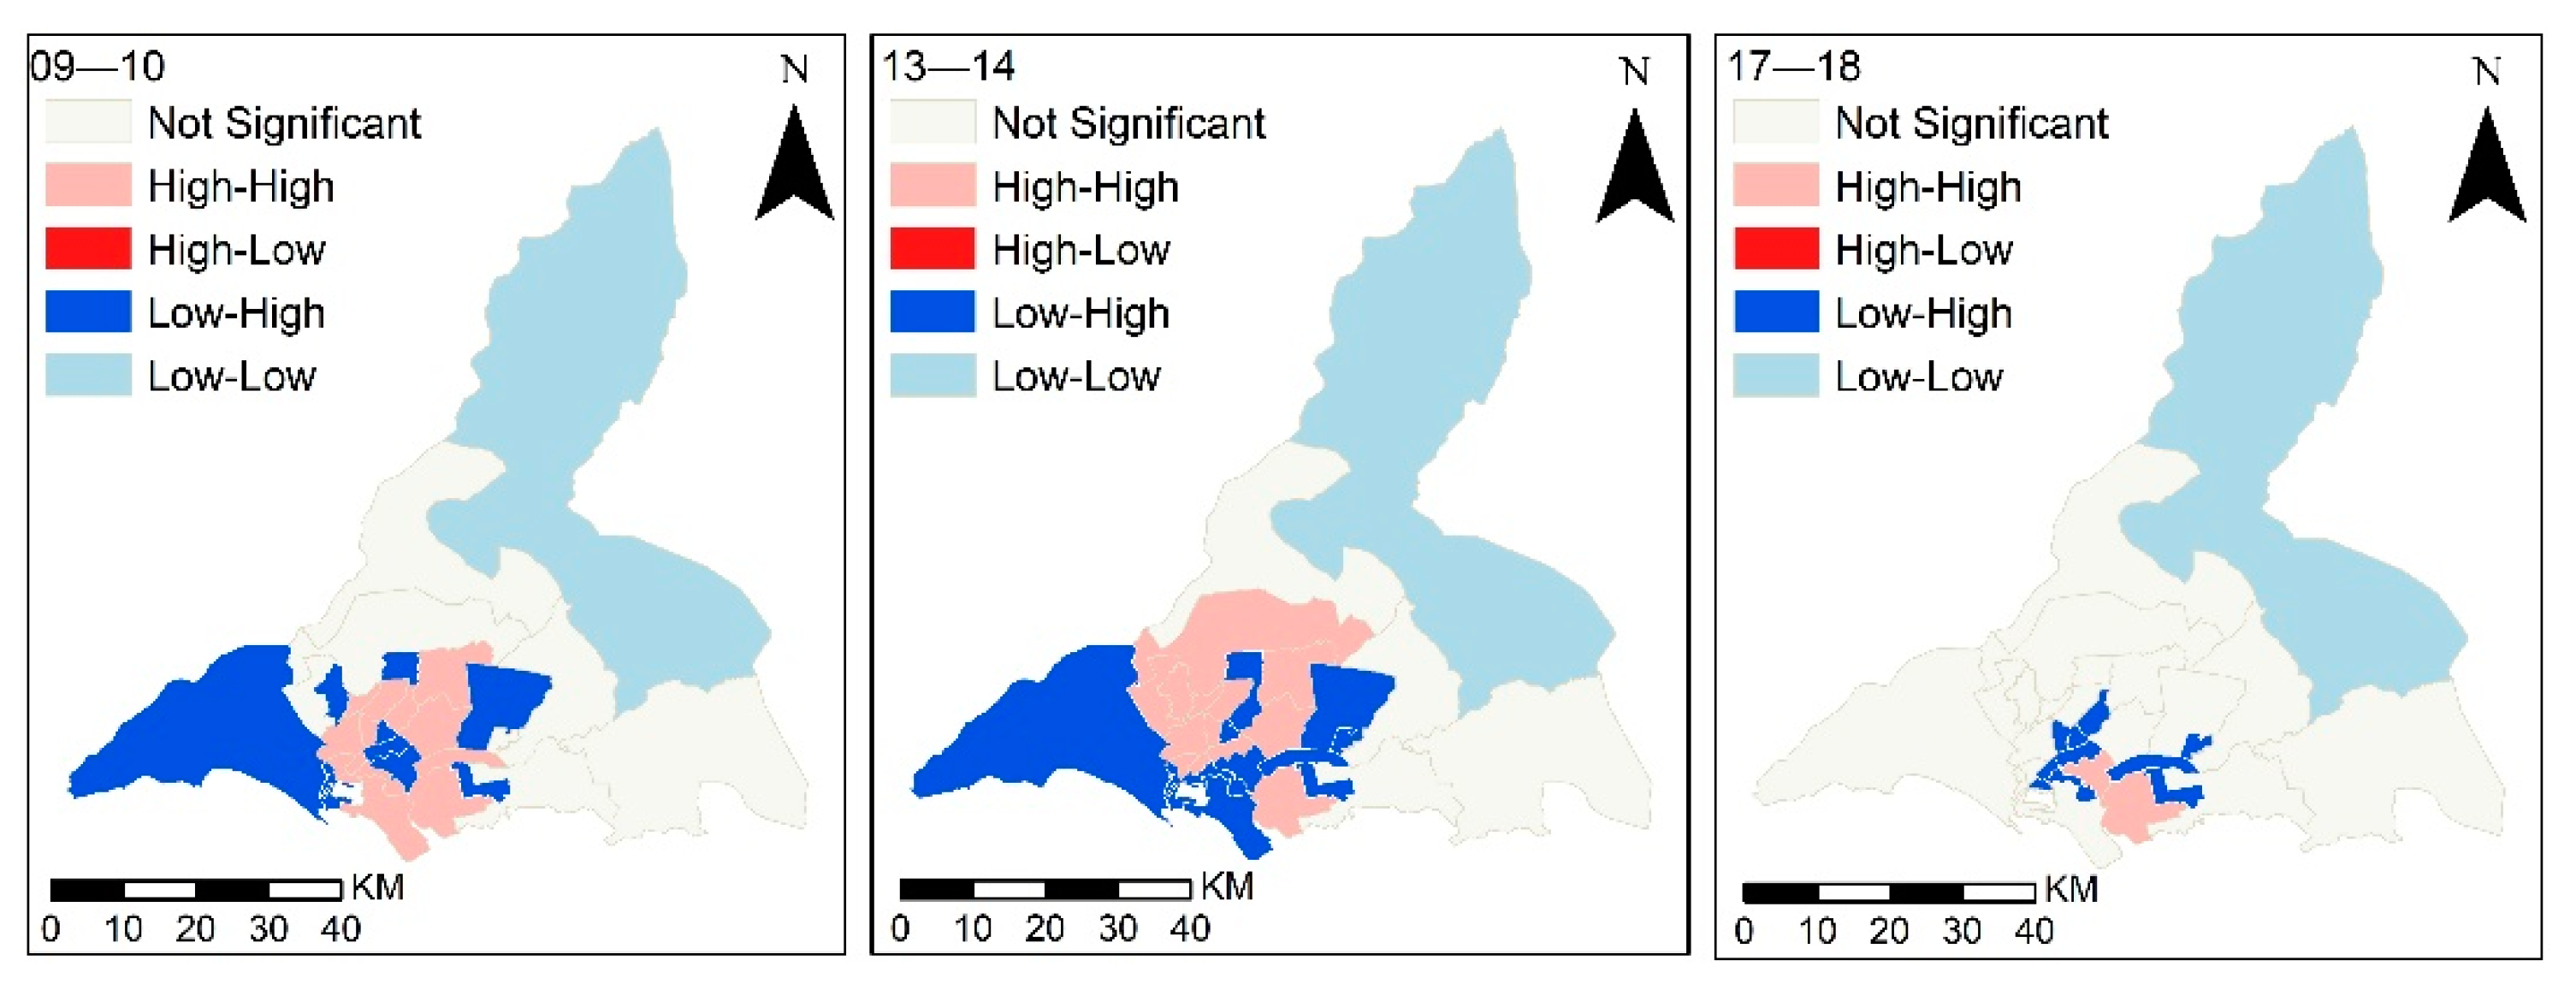
4.1. Spatio-Temporal Analysis

The homicide incidents from 2009 to 2018 were summarized with a spatial unit of grid cells, as shown in Figure 2. In the study area, 259 cells were recorded with 1 homicide, 72 cells with 2, 18 cells with 3, 9 cells with 4, 2 cells with 5, 1 cell with 7, and 1 cell with 43 deaths in 2009 (Figure 2a). The border areas in the Shah Faisal and Model Colony subdivisions emerged as the most sensitive in the study area. In 2010, the cells affected by homicide incidents were concentrated in several subdivisions compared to the previous year (Figure 2b). The number of homicides increased by 244% from 2010 to 2011 (Figure 2c). The overall number of killings increased by 32% in 2012 compared to 2011 (Figure 2d). In 2013, a slight change in crime was observed due to a change in policy enacted by the Government of Pakistan (GoP) in 2013. The GoP announced a military-assisted operation against crime in Karachi in September 2013, which led to a decline in crime numbers (Figure 2e). The killings decreased by 12% and the number of cells decreased by 16% compared to the previous year in 2014, which suggests an improvement in law and order (Figure 2f). The number of homicides was reduced by 50% in 2015 compared to 2014 (Figure 2g). Law and order further improved in 2016, when there was a further 42% decline in homicides (Figure 2h). In years 2017 and 2018, there was a de-escalation not only in numbers of homicide cases but also in terms of the affected area (Figure 2i,j).
Figure 3 displays the spatial pattern of local homicide clusters and their temporal changes in the study area. In 2009, 14 of the 31 subdivisions, mainly located in central and coastal areas, were classified as high-high clusters. The total area of high-high homicide clusters expanded to a larger extent in 2013. After that, only two districts, Korangi and Ferozabad, were classified as high-high homicide clusters in 2018. In particular, the Korangi subdivision remains a hotspot for homicide crime across the study period. The main characteristic of this area is that it was a stronghold of Karachi’s major opposition party. The political parties used threats, physical damage to property, kidnapping in political strikes which often led to armed conflicts with police and caused the concentration of the greatest number of violent episodes in this neighborhood and the increase in violence on strike days [44].

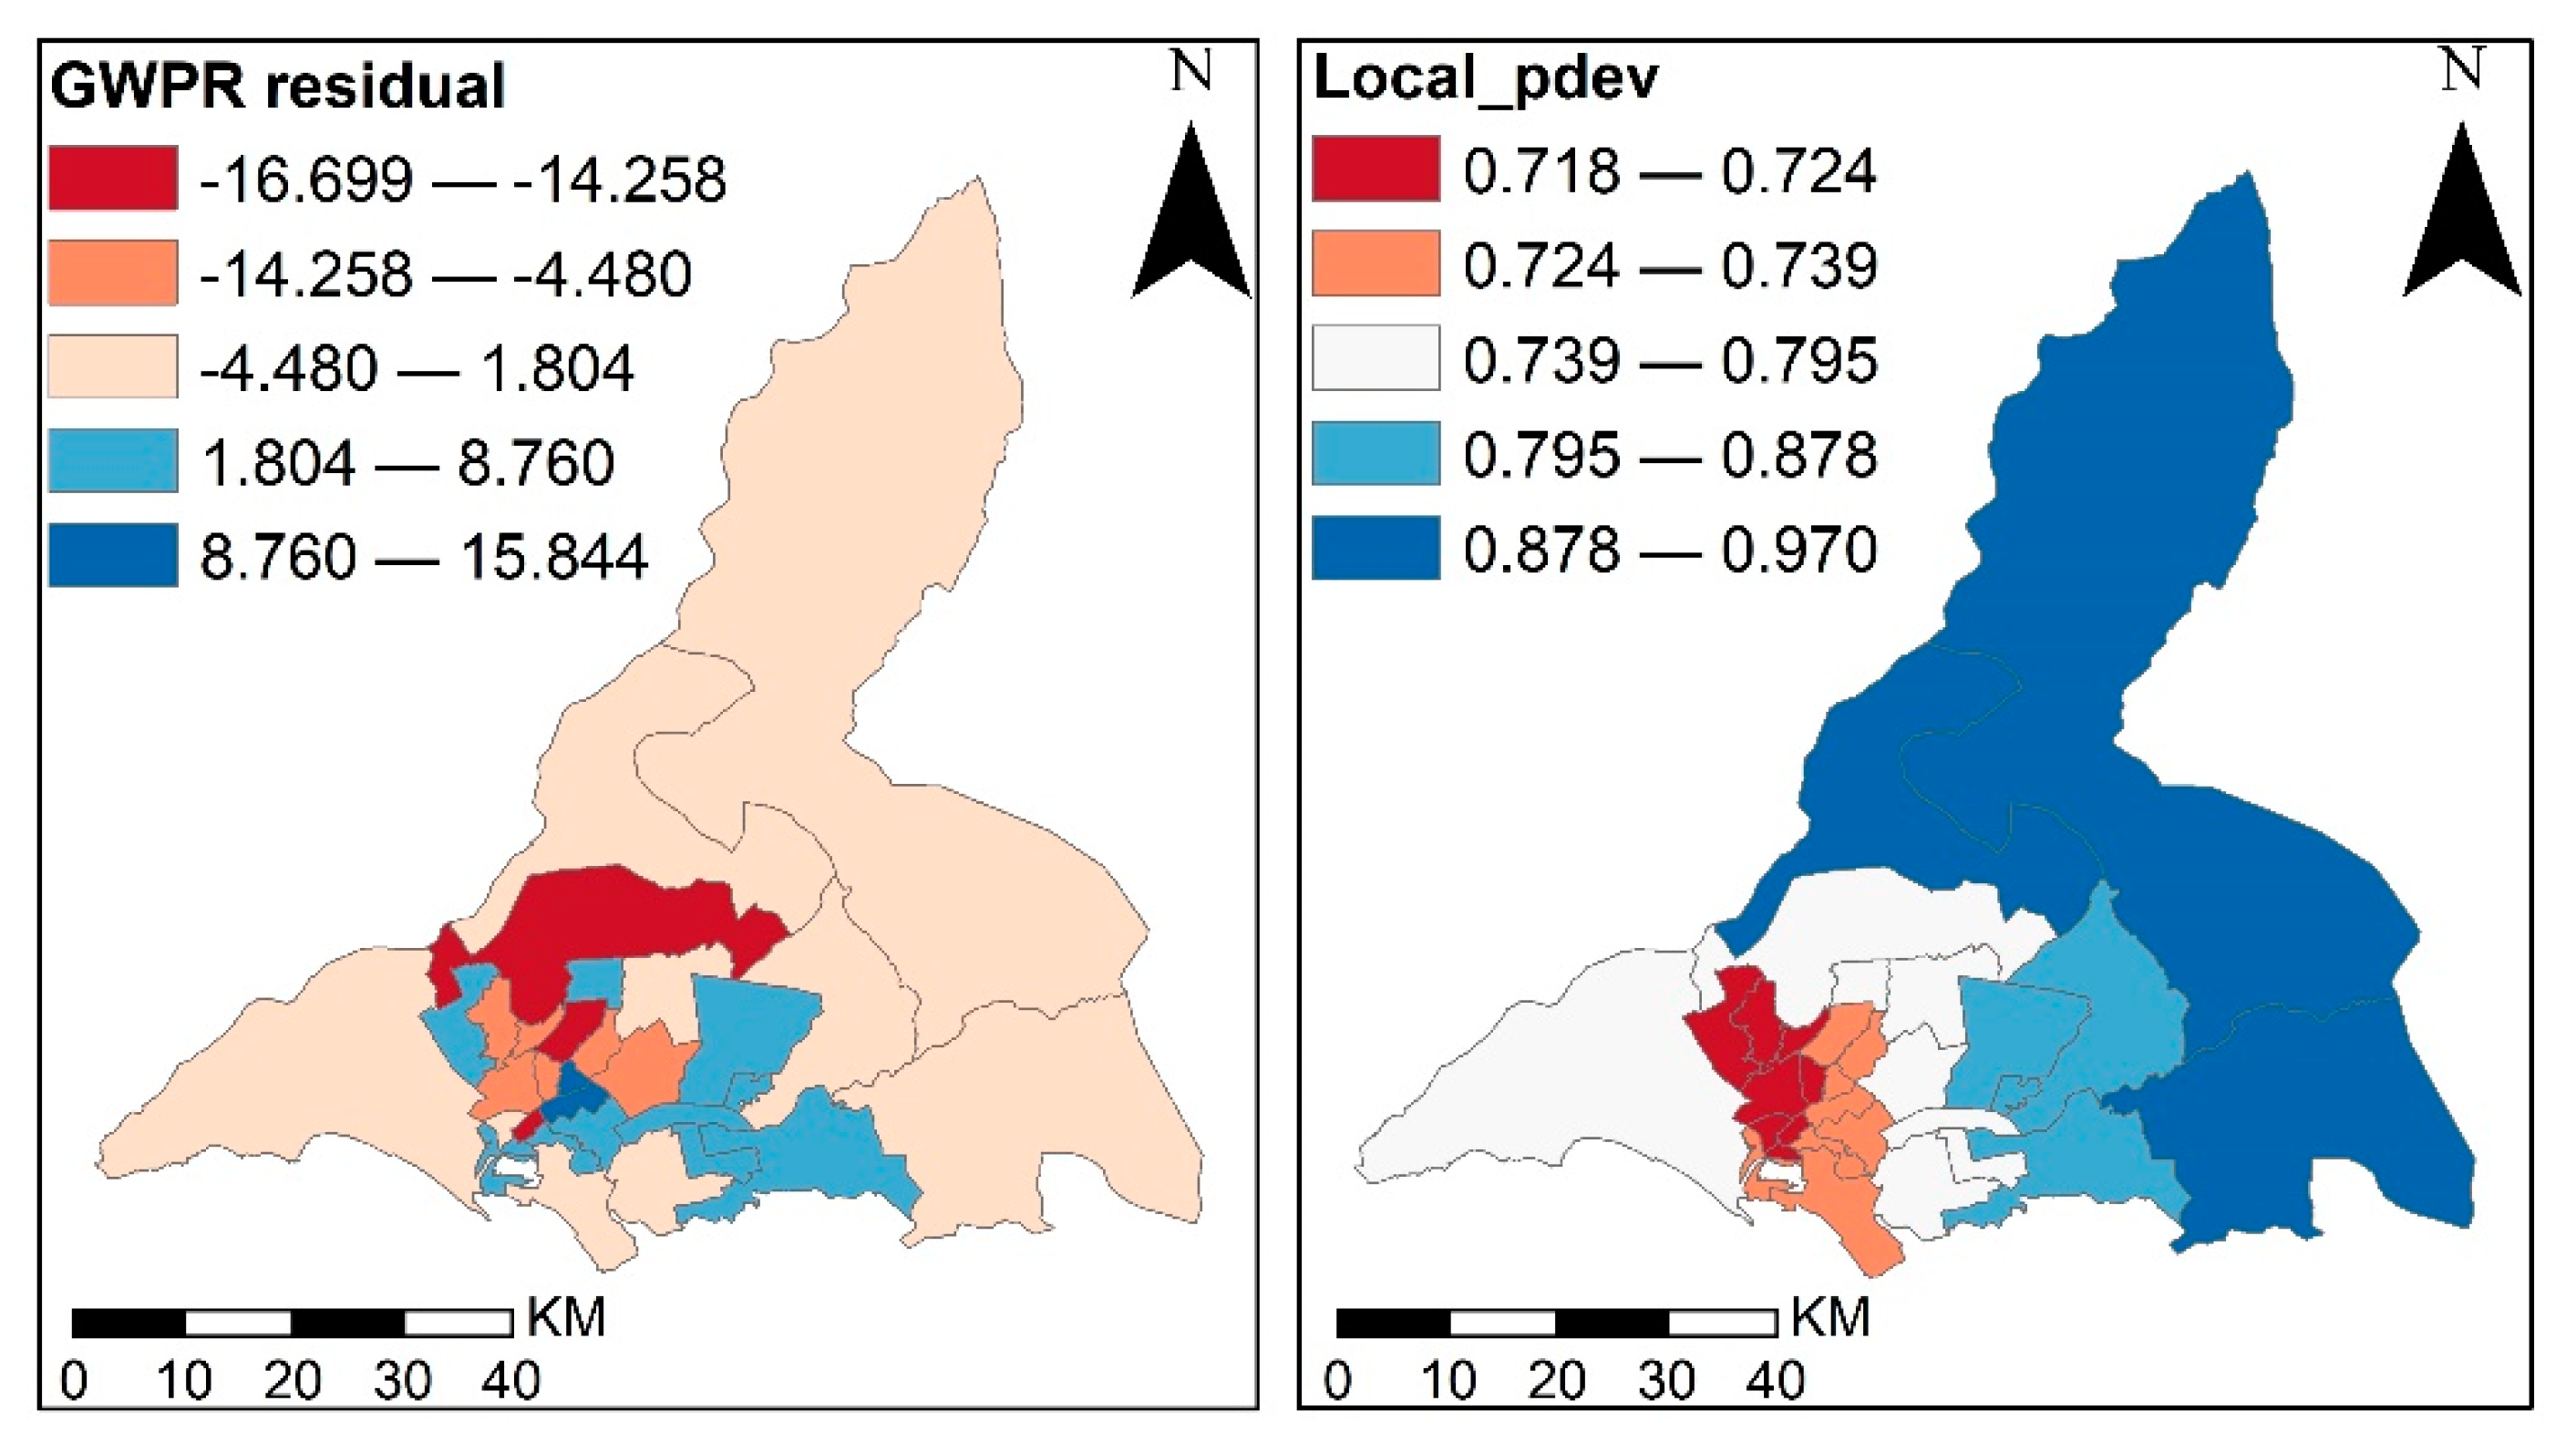
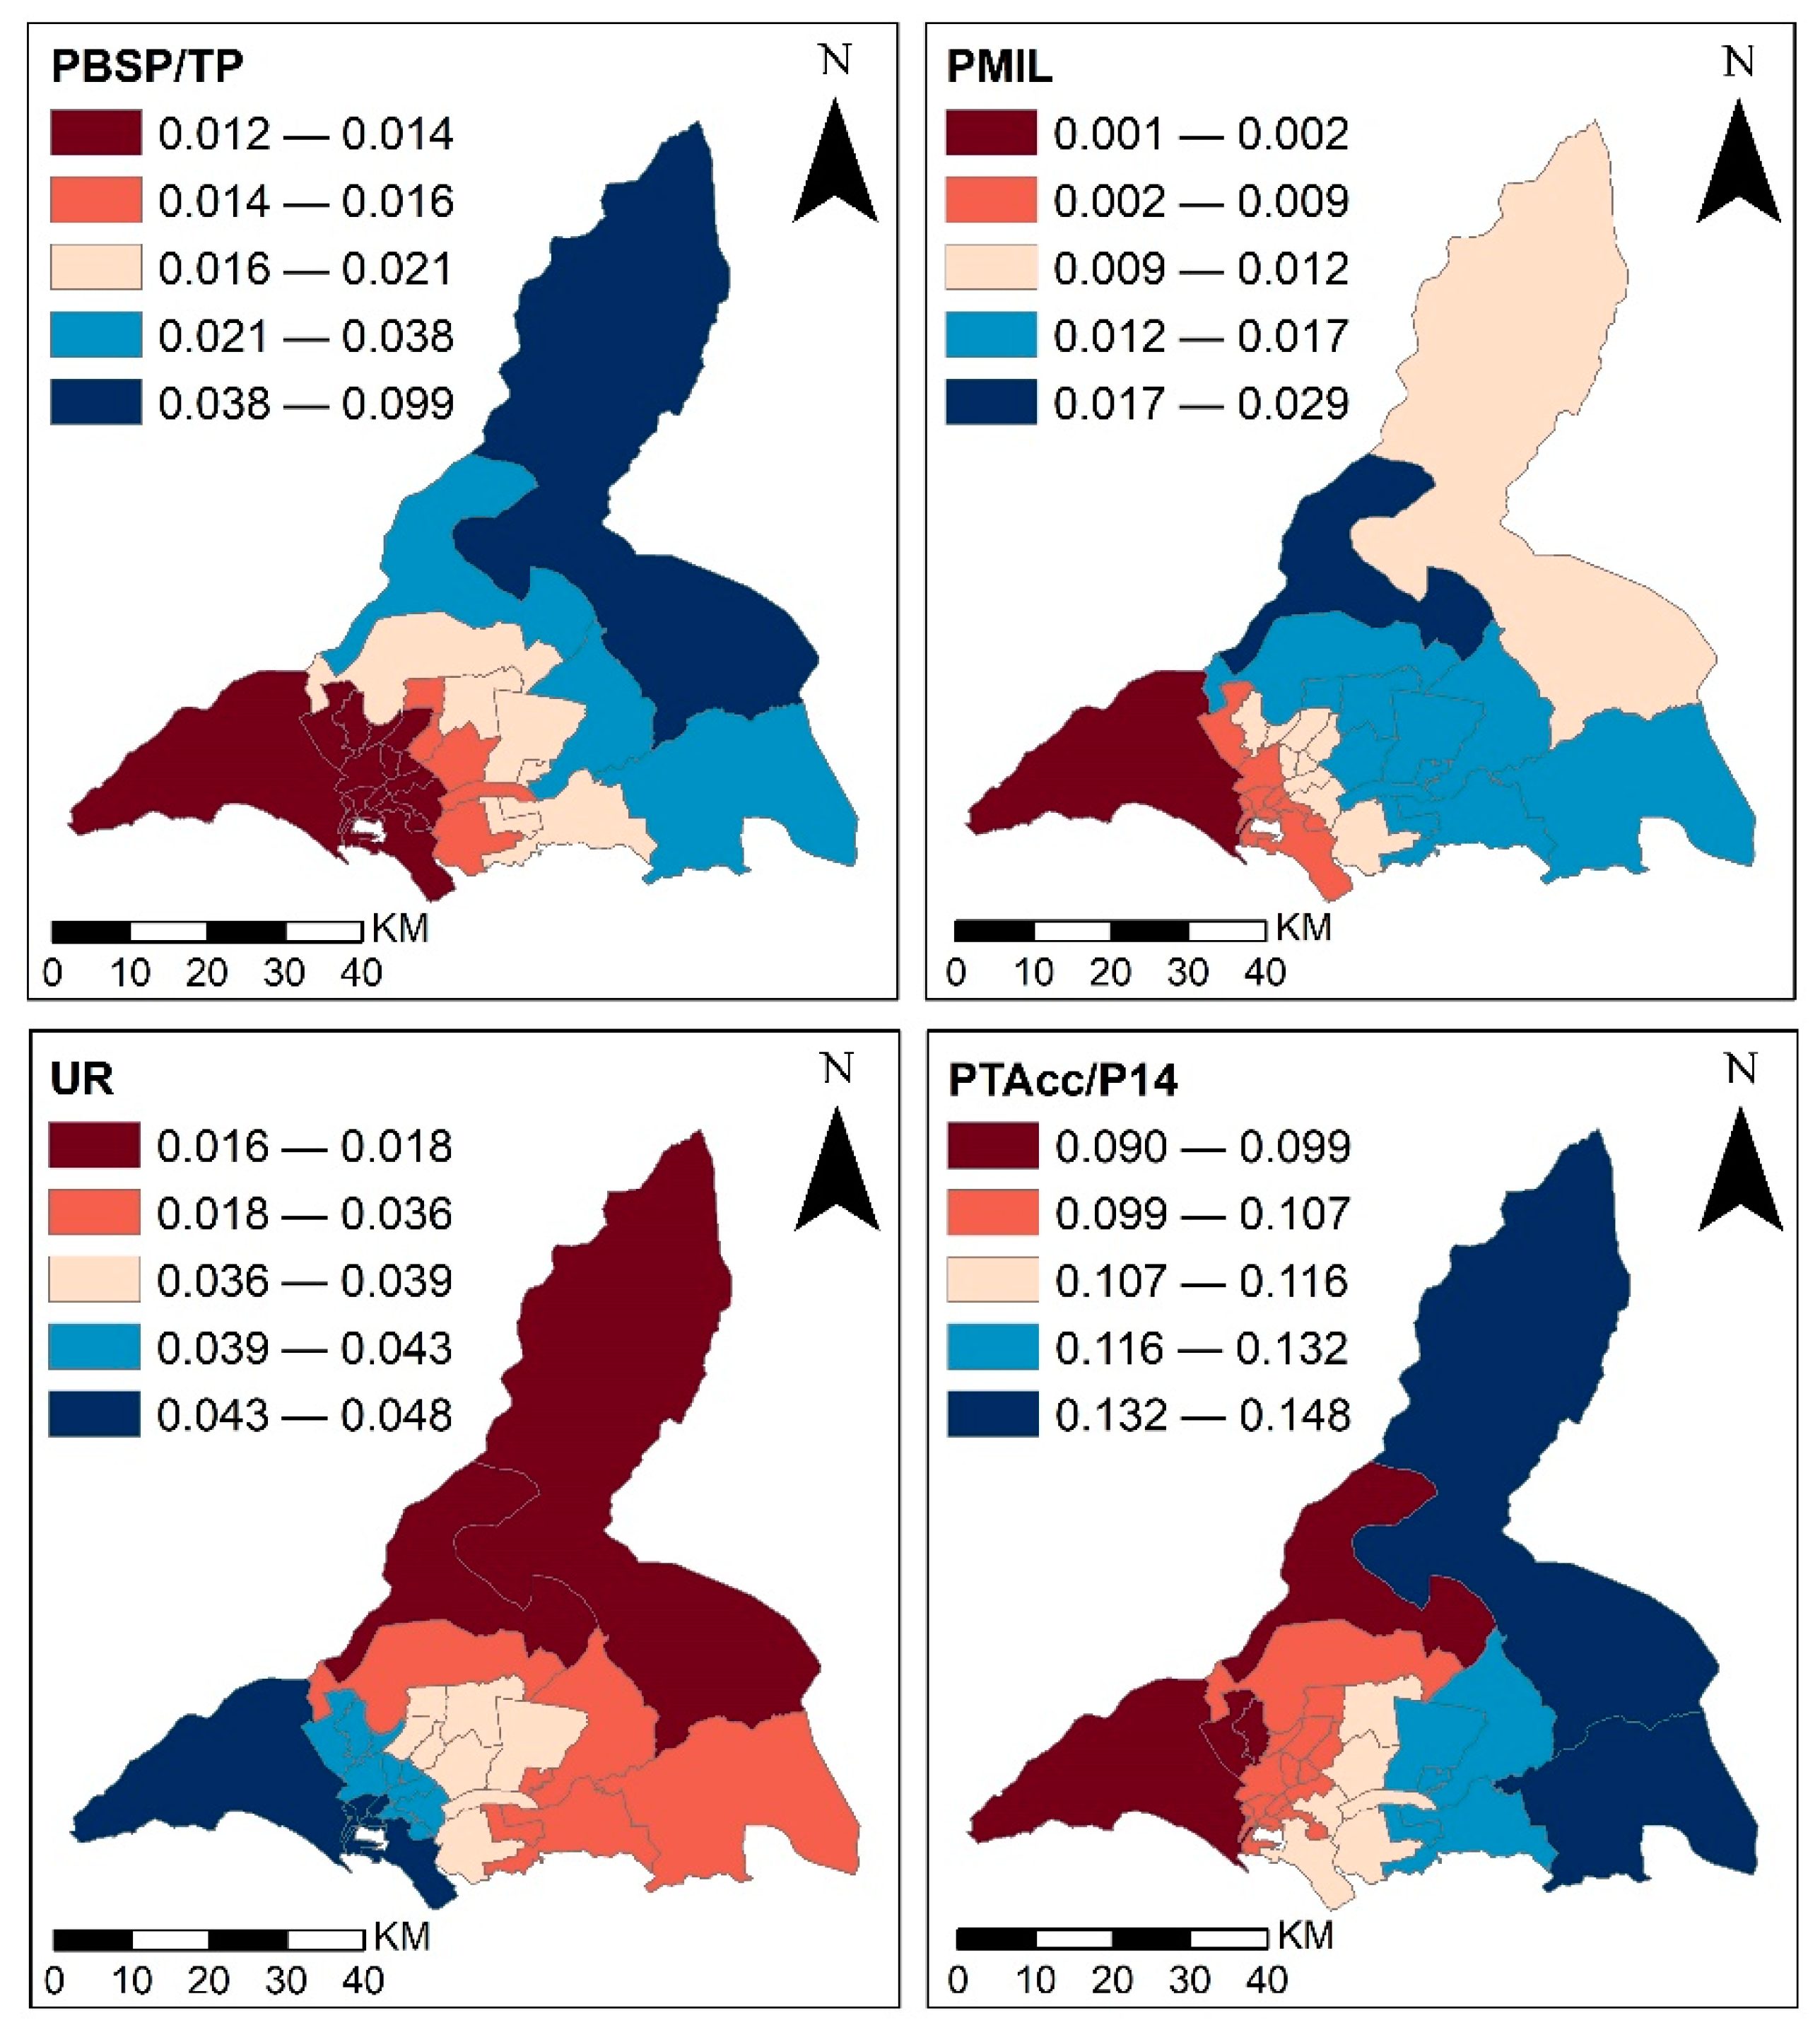
4.2. Regression Analysis

The redundant dependent variables were removed based on the collinearity diagnostic, and only seven variables remained for the following regression analysis. The results of the GLM and GWPR models are shown in Table 2. The MAD and AICc values for GWPR were lower than GLM, while the percent deviance explained for GWPR was higher than for GLM. These results indicate that the GWPR model outperformed GLM in homicide occurrence modeling.
Figure 4 shows the residuals and local_pdev values produced by the GWPR model. The local_pdev values reveal the spatial variation of the model’s explanatory power. The best fits (high and medium local_pdev values) were mainly observed in the eastern part of the study area. Figure 5 and Figure 6 illustrate the spatial patterns of the local coefficients for each variable, which characterize the intensity of the relationship between the explanatory variable and homicide. The explanatory variables generally featured different spatial patterns.
As shown in Figure 5, three variables (SDPAAHI, PUA/TSdA, and PSdA/TA) had a negative impact on the number of homicides. It is not surprising that subdivisions with a high-income level (SDPAAHI) tended to have a lower number of homicides. The GWPR models highlighted the low homicide rates in Karachi’s unplanned residential areas (PUA/TSdA), which mainly consisted of neighborhoods for low-income citizens. It also identified the linkage between areas patrolled by police (PSdA/TA) and the prevention of homicides.
According to Figure 6, four variables (PBSP/TP, PMIL, UR, and PTAcc/P14+) were positively associated with homicide. The portion of people speaking Balochi (PBSP/TP) had a positive impact on homicide levels. In Karachi, linguistic minority groups such as Memons, Parsi, Ismailis, Bohris, and so on were most affected by crime. Several researchers have reported that crimes in Karachi caused by personal enmity and cultural disputes mainly occurred in minority areas [45,46]. The male illiteracy rate (PMIL) and unemployment rate (UR) were both positively associated with homicide in the study area. The percentage of the total accused persons (PTAcc/P14+) was positively associated with high homicide incidents.

4.3. Implications and Limitations

Our results reveal that different levels of homicide were documented in different ethnic groups in Karachi. The portion of linguistic groups speaking Balochi had a positive link with homicide levels, with a significant income gap existing between different ethnic groups. The Urdu-speaking population accounted for about 45% of the city’s population, followed by Punjabi and Pashto. The Urdu-speaking and Punjabi-speaking populations had better education and job opportunities and were more affluent groups, while Pashtuns and Baloch were among the poorest groups. One possible explanation for this is that the disparities present amongst ethnic groups have resulted in an increase in robberies and other crimes [37]. This result provides support for social disorganization theory in the context of Pakistan. The low-income Balochi-speaking group can be considered an economically and socially deprived community. Neighborhoods with a high proportion of Balochi-speaking people may endure high social disorganization with more homicide counts.
The strongest positive correlation was observed between the unemployment rate and homicide, which is consistent with empirical generalizations in U.S. cities [5]. The continual migration of low-skill labor from Pakistan’s rural areas resulted in higher levels of urban joblessness. The average unemployment rate in Karachi was 18.34% in 2018. As much as 70% of all workers are known to subsist on daily wages in the main industrial hub of the Sindh Industrial Trading Estate (SITE) [47]. This finding is in line with routine activity theory and social disorganization theory. Since their routine activities are less supervised, unemployed people are more likely to be victims or perpetrators of criminal activity. On the other hand, unemployment is indicative of detachment from regular work connections to economic institutions and may be associated with higher levels of deprivation. A higher unemployment rate for neighborhood residents may produce more homicide cases. Khan et al. [48] analyzed the social and economic crime determinants in Pakistan between 1972 and 2011. An examination of the correlation between crime rates and a multiplicity of factors, such as poverty, education, and economic growth, revealed a positive correlation between unemployment rate and crime.
The results suggest that unplanned areas with residential districts exhibited low homicide rates in the study area. The unplanned areas in Karachi are known as katchi abadis or non-permanent settlements. The creation and expansion of katchi abadis mainly took place in the western and northern parts of Karachi. They were established through the unorganized invasion of state land. The planned and commercial areas of the city were characterized by a high population density, high male and female illiteracy, and high levels of unemployment. While first-degree murder is a form of criminal homicide where killings are pre-meditated or planned, there are other crimes such as street robbery and kidnapping for ransom that can result in victims’ death in commercial areas. Compared to commercial and planned residential areas, the unplanned residential areas have fewer potential offenders and available targets, which is consistent with routine activity theory.
Routine activity theory supports the statement that informal guardianship provided by citizens and formal guardianship provided by police can negatively affect crime rates. In this study, guardianship was measured using five variables, including: the percentage of the area patrolled by police relative to the total area, the percentage of persons accused of being involved in a homicide relative to the total population, the percentage of arrested persons to accused persons, and the number of police per square kilometer. The results suggest that the police surveillance area was significantly related to the decline in homicide incidents. The expansion of police surveillance areas provides better guardianship and may lead to a decline in crime activity. The efforts in the form of the Karachi Operation have produced a notable reduction in homicide incidence and significantly improved security in the city. Similar efforts are necessary to reduce violence in the city. The percentage of people accused of being involved in a homicide relative to the total population was found to have a positive relationship with the number of homicides. This may be attributed to their reciprocal effect, which means that crime incidence can also influence guardianship [49]. The number of persons accused of crime also increased in areas with more homicide cases. Some analysts argue that punishment prevents criminal behavior since it makes it costly for the offenders. However, a review study suggested that the variations in sentence severity do not affect the severity of crime in society [3]. It argued that this may be because most offenders do not think about the legal consequences of their actions. The police force is operated under the British colonial system, and investigations are carried out under the 1861 and 1698 Acts in Karachi. As a colonial remnant, the criminal justice system in Pakistan is unable to meet the challenges of the rising crime rate and the associated complexities involved in the dispensation of justice [50]. A previous analysis revealed that the criminal justice system of Pakistan suffered from deficiencies and weaknesses such as inaccurate reporting of crime to the police, malpractices during litigation, delayed submission of challans to the courts by public prosecutor, and overcrowding of jails due to a large number of under-trial prisoners [51]. The overall low efficiency of police force may lead to the ineffectiveness of police activity in reducing homicide incidence.
Despite the above findings, there are some limitations in the current study. Measurements of forces contributing to social disorganization such as poverty, unemployment rates, neighborhood stability, and ethnic composition were related to criminal events in studies employing social disorganization theory [34]. Variables quantifying economic status, linguistic composition, population density, and education level were used to test the applicability of social disorganization theory due to the availability of data and the distinct society norms in Karachi. Besides census and statistical data, interviews and survey-based approaches can be conducted to assess neighborhood-level social ties and associations in future studies [6]. Moreover, seven explanatory variables were selected for regression analysis to reduce the multicollinearity among explanatory variables in our study. As an alternative, data reduction techniques such as factor analysis can be used to combine the variables into composite indices to preserve the information on neighborhood context drawn from census data. Although traditional crime analysis mainly focused on macro- and meso-geographic units of analysis such as counties, neighborhoods, and census tracts, the spatial aggregation of crime information using existing spatial units in this study may obscure the detailed spatial patterns of crime and produce misleading results [52]. The availability of extensive data at detailed spatial and temporal levels makes it possible to examine spatial distribution and developmental pattern of homicides at the micro level [53]. The number of homicide events used in the regression analysis was limited and the findings were restricted to one city and to the 2009–2018 period due to limited data availability.

5. Conclusions

In Pakistan’s post-independence history, socioeconomic and geopolitical conditions have triggered a substantial migration of cohorts from middle and lower socio-economic groups into the city of Karachi. This inward migration has led to the creation of strains and imbalances, thereby instigating criminal activity in the city. The results of this study suggest that the area of high-high homicide clusters expanded from 2009 to 2013 and decreased from 2013 to 2018. The neighborhood determinants of homicide were consistent with routine activity theory and social disorganization theory. The number of homicides has a positive relationship with the percentage of the Balochi-speaking population and economic and social deprivation. The percentage of unplanned areas in a subdivision was significantly associated with low homicide counts. The unplanned areas consisting of low-density residential land use had less suitable targets and motivated offenders compared to commercial and planned areas. The methodology used in the study can be adapted to study violent crime in other localities with similar social characteristics. Our results show that the expansion and enhancement of police forces was an effective measure for reducing violence and homicide cases and thus improving public safety for the city of Karachi. However, the overall law enforcement and police system are flawed with political manipulation, the lack of forensic services, inadequate training and equipment, and corruption in Pakistan [54]. An efficient, well-resourced, and competent police force is critical to control the rising crimes and violence in Karachi. In addition to the variables considered in this study, more factors can be considered to examine their spatial association with different types of crime, especially violent offenses in Karachi. Moreover, the spatial pattern of crime and its relationship with influential factors can vary in space and time. Regression analysis should be performed in different cities and multiple years to enhance the generalizability of these findings.

Author Contributions

Conceptualization, I.K. and F.B.; Methodology, S.H.; Software, H.L.; Validation, S.H.; Formal Analysis, S.N.-u.-H.; Investigation, S.H.; Resources, I.K.; Data Curation, S.N.-u.-H.; Writing—Original Draft Preparation, S.N.-u.-H.; Writing—Review and Editing, L.L. and A.T.; Visualization, Writing—Review and Editing, M.F.B.; Supervision, F.B.; Project Administration, L.L.; Funding Acquisition, L.L. All authors have read and agreed to the published version of the manuscript.

Funding

This research was funded by the National Key Research and Development Program of China (No. 2019YFD1100803).

Institutional Review Board Statement

Not applicable.

Informed Consent Statement

Informed consent was obtained from all subjects involved in the study.

Data Availability Statement

The data presented in this study are available on request from the corresponding author.

Acknowledgments

The authors would like to thank the anonymous reviewers and the editors for their insightful comments and suggestions.

Conflicts of Interest

The authors declare no conflict of interest.

References

  1. United Nations. Transforming Our World: The 2030 Agenda for Sustainable Development; United Nations: San Francisco, CA, USA, 2015.
  2. Sharkey, P.S.; Sampson, R.J. Violence, Cognition, and Neighborhood Inequality in America. In Social Neuroscience: Brain, Mind, and Society; Schutt, R.K., Seidman, L.J., Keshavan, M.S., Eds.; Harvard University Press: Cambridge, MA, USA, 2015. [Google Scholar]
  3. Doob, A.N.; Webster, C.M. Sentence Severity and Crime: Accepting the Null Hypothesis. Crime Justice 2003, 30, 143–195. [Google Scholar] [CrossRef]
  4. Briceño-León, R.; Villaveces, A.; Concha-Eastman, A. Understanding the uneven distribution of the incidence of homicide in Latin America. Int. J. Epidemiol. 2008, 37, 751–757. [Google Scholar] [CrossRef] [PubMed] [Green Version]
  5. McCall, P.L.; Land, K.C.; Parker, K.F. An Empirical Assessment of What We Know About Structural Covariates of Homicide Rates: A Return to a Classic 20 Years Later. Homicide Stud. 2010, 14, 219–243. [Google Scholar] [CrossRef]
  6. Sampson, R.J.; Raudenbush, S.W.; Earls, F. Neighborhoods and Violent Crime: A Multilevel Study of Collective Efficacy. Science 1997, 277, 918–924. [Google Scholar] [CrossRef]
  7. Choe, J. Income inequality and crime in the United States. Econ. Lett. 2008, 101, 31–33. [Google Scholar] [CrossRef]
  8. Fajnzylber, P.; Lederman, D.; Loayza, N. Inequality and Violent Crime. J. Law Econ. 2002, 45, 1–39. [Google Scholar] [CrossRef] [Green Version]
  9. Stacy, C.P.; Ho, H.; Pendall, R. Neighborhood-Level Economic Activity and Crime. J. Urban Aff. 2016. [Google Scholar] [CrossRef]
  10. Hasisi, B.; Perry, S.; Ilan, Y.; Wolfowicz, M. Concentrated and Close to Home: The Spatial Clustering and Distance Decay of Lone Terrorist Vehicular Attacks. J. Quant. Criminol. 2020, 36, 607–645. [Google Scholar] [CrossRef]
  11. Andresen, M.A. Estimating the probability of local crime clusters: The impact of immediate spatial neighbors. J. Crim. Justice 2011, 39, 394–404. [Google Scholar] [CrossRef]
  12. de Melo, S.N.; Matias, L.F.; Andresen, M.A. Crime concentrations and similarities in spatial crime patterns in a Brazilian context. Appl. Geogr. 2015, 62, 314–324. [Google Scholar] [CrossRef]
  13. Boivin, R. Routine activity, population(s) and crime: Spatial heterogeneity and conflicting Propositions about the neighborhood crime-population link. Appl. Geogr. 2018, 95, 79–87. [Google Scholar] [CrossRef]
  14. Law, J.; Quick, M. Exploring links between juvenile offenders and social disorganization at a large map scale: A Bayesian spatial modeling approach. J. Geogr. Syst. 2013, 15, 89–113. [Google Scholar] [CrossRef]
  15. McMillen, D.P. Geographically Weighted Regression: The Analysis of Spatially Varying Relationships. Am. J. Agric. Econ. 2004, 86, 554–556. [Google Scholar] [CrossRef]
  16. Murillo, F.H.S.; Chica-Olmo, J.; de Cortázar, A.R.G. The spatial heterogeneity of factors of feminicide: The case of Antioquia-Colombia. Appl. Geogr. 2018, 92, 63–73. [Google Scholar] [CrossRef]
  17. Chen, J.; Liu, L.; Liu, H.; Long, D.; Xu, C.; Zhou, H. The Spatial Heterogeneity of Factors of Drug Dealing: A Case Study from ZG, China. ISPRS Int. J. Geo-Inf. 2020, 9, 205. [Google Scholar] [CrossRef] [Green Version]
  18. Cohen, L.; Felson, M. Social Change and Crime Rate Trends: A Routine Activity Approach. Am. Sociol. Rev. 1979, 44, 588–608. [Google Scholar] [CrossRef]
  19. Roth, J.J. Gender Differences in Acquisitive Delinquency: A Macro-Level Routine Activities Analysis. Am. J. Crim. Justice 2016, 41, 796–813. [Google Scholar] [CrossRef]
  20. Fisher, B.; Wilkes, A. A Tale of Two Ivory Towers. A Comparative Analysis of Victimization Rates and Risks between University Students in the United States and England. Br. J. Criminol. 2003, 45, 526–545. [Google Scholar] [CrossRef]
  21. Tseloni, A.; Wittebrood, K.; Farrell, G.; Pease, K. Burglary Victimization in England and Wales, the United States and the Netherlands: A Cross-National Comparative Test of Routine Activities and Lifestyle Theories. Br. J. Criminol. 2004, 44, 66–91. [Google Scholar] [CrossRef]
  22. Sypion-Dutkowska, N.; Leitner, M. Land Use Influencing the Spatial Distribution of Urban Crime: A Case Study of Szczecin, Poland. ISPRS Int. J. Geo-Inf. 2017, 6, 74. [Google Scholar] [CrossRef] [Green Version]
  23. Stucky, T.D.; Ottensmann, J.R. Land Use and Violent Crime. Criminology 2009, 47, 1223–1264. [Google Scholar] [CrossRef] [Green Version]
  24. Anderson, J.M.; MacDonald, J.; Bluthenthal, R.; Ashwood, J. Reducing Crime by Shaping the Built Environment with Zoning: An Empirical Study of Los Angeles. Univ. Pa. Law Rev. 2013, 161, 699–757. [Google Scholar] [CrossRef] [Green Version]
  25. Jacobs, J. The Death and Life of Great American Cities; Random House: New York, NY, USA, 1961. [Google Scholar]
  26. MacDonald, J. Community Design and Crime: The Impact of Housing and the Built Environment. Crime Justice 2015, 44, 333–383. [Google Scholar] [CrossRef]
  27. Twinam, T. Danger zone: Land use and the geography of neighborhood crime. J. Urban Econ. 2017, 100, 104–119. [Google Scholar] [CrossRef]
  28. Pinchevsky, G.M.; Wright, E.M. The impact of neighborhoods on intimate partner violence and victimization. Trauma Violence Abus. 2012, 13, 112–132. [Google Scholar] [CrossRef]
  29. Cahill, M.E.; Mulligan, G.F. The Determinants of Crime in Tucson, Arizona1. Urban Geogr. 2003, 24, 582–610. [Google Scholar] [CrossRef]
  30. Andresen, M.A. Crime Measures and the Spatial Analysis of Criminal Activity. Br. J. Criminol. 2006, 46, 258–285. [Google Scholar] [CrossRef]
  31. Lu, L.; Weng, Q.; Guo, H.; Feng, S.; Li, Q. Assessment of urban environmental change using multi-source remote sensing time series (2000–2016): A comparative analysis in selected megacities in Eurasia. Sci. Total Environ. 2019, 684, 567–577. [Google Scholar] [CrossRef]
  32. Mangi, M.Y.; Yue, Z.; Kalwar, S.; Lashari, Z.A. Comparative Analysis of Urban Development Trends of Beijing and Karachi Metropolitan Areas. Sustainability 2020, 12, 451. [Google Scholar] [CrossRef] [Green Version]
  33. Schulenberg, J.L.; Jacob, J.C.; Carrington, P.J. Ecological Analysis of Crime Rates and Police Discretion with Young Persons: A Replication. Can. J. Criminol. Crim. Justice 2007, 49, 261–277. [Google Scholar] [CrossRef]
  34. Andresen, M.A. A spatial analysis of crime in Vancouver, British Columbia: A synthesis of social disorganization and routine activity theory. Can. Geogr./Le Géographe Can. 2006, 50, 487–502. [Google Scholar] [CrossRef]
  35. Osgood, D.W.; Chambers, J.M. Social disorganization outside the metropolis: An analysis of rural youth violence. Criminology 2000, 38, 81–116. [Google Scholar] [CrossRef] [Green Version]
  36. Khan, I.; Hamza, S.; Burke, F.; Nawaz-ul-Huda, S. Application of GIS for evaluation of ethnic fault lines of Karachi. Malays. J. Soc. Space 2020, 16, 15–29. [Google Scholar] [CrossRef]
  37. Khan, I.; Hamza, S.; Burke, P.D.F.; Nawaz-Ul-Huda, S.; Miandad, M. Mapping homicide motives and contributory factors in Karachi. Pak. Geogr. Rev. 2020, 75, 200–218. [Google Scholar]
  38. Bangash, A.K.; Khan, R.; Marwat, F.U.R. Illiteracy and its Relation with Honour Killing in Federally Administered Tribal Areas (FATA) Of Pakistan. Pak. J. Criminol. 2018, 10, 107–121. [Google Scholar]
  39. Latif, Z. Offending in Karachi’s Neighborhoods: An Empirical Test of the Systemic Model of Social Disorganization; City University of New York: New York, NY, USA, 2012. [Google Scholar]
  40. Kingston, B.; Huizinga, D.; Elliott, D.S. A test of social disorganization theory in high-risk urban neighborhoods. Youth Soc. 2009, 41, 53–79. [Google Scholar] [CrossRef]
  41. Jendryke, M.; McClure, S.C. Mapping crime—Hate crimes and hate groups in the USA: A spatial analysis with gridded data. Appl. Geogr. 2019, 111, 102072. [Google Scholar] [CrossRef]
  42. Anselin, L. Local Indicators of Spatial Association—LISA. Geogr. Anal. 1995, 27, 93–115. [Google Scholar] [CrossRef]
  43. Oshan, T.M.; Li, Z.; Kang, W.; Wolf, L.J.; Fotheringham, A.S. mgwr: A Python Implementation of Multiscale Geographically Weighted Regression for Investigating Process Spatial Heterogeneity and Scale. ISPRS Int. Geo-Inf. 2019, 8, 269. [Google Scholar] [CrossRef] [Green Version]
  44. Chotani, H.A.; Razzak, J.A.; Luby, S.P. Patterns of violence in Karachi, Pakistan. Inj. Prev. 2002, 8, 57–59. [Google Scholar] [CrossRef] [Green Version]
  45. Mian, A.; Mahmood, S.; Chotani, H.; Luby, S. Vulnerability to Homicide in Karachi: Political Activity as a Risk Factor. Int. J. Epidemiol. 2002, 31, 581–585. [Google Scholar] [CrossRef] [PubMed] [Green Version]
  46. Benson, B.L.; Siddiqui, Z.R. Pashtunwali—Law for the lawless, defense for the stateless. Int. Rev. Law Econ. 2014, 37, 108–120. [Google Scholar] [CrossRef]
  47. Yusuf, H. Conflict Dynamics in Karachi; United States Institute of Peace: Washington, DC, USA, 2012.
  48. Khan, N.; Ahmed, J.; Nawaz, M.; Zaman, K. The Socio-Economic Determinants of Crime in Pakistan: New Evidence on an Old Debate. Arab Econ. Bus. J. 2015, 10, 73–81. [Google Scholar] [CrossRef] [Green Version]
  49. Stahura, J.; Sloan, J. Urban Stratification of Places, Routine Activities and Suburban Crime Rates. Soc. Forces 1988, 66, 1102–1118. [Google Scholar] [CrossRef]
  50. Fasihuddin. Criminology and Criminal Justice System in Pakistan. In Handbook of Asian Criminology; Springer: New York, NY, USA, 2013; pp. 247–281. [Google Scholar] [CrossRef]
  51. Arshad, S.J. Criminal Justice System in Pakistan: A Critical Analysis. Available online: https://courtingthelaw.com/2017/02/15/commentary/criminal-justice-system-in-pakistan-a-critical-analysis/ (accessed on 19 March 2021).
  52. Brantingham, P.L.; Brantingham, P.L.; Vajihollahi, M.; Wuschke, K. Crime Analysis at Multiple Scales of Aggregation: A Topological Approach. In Putting Crime in Its Place; Weisburd, D., Bernasco, W., Bruinsma, G.J.N., Eds.; Springer: New York, NY, USA, 2009; pp. 87–107. [Google Scholar] [CrossRef]
  53. Harinam, V. Examining micro-level homicide patterns in toronto, 1967 through 2003. Can. J. Criminol. Crim. Justice 2020, 62, 44–63. [Google Scholar] [CrossRef]
  54. Abbas, H. Reforming Pakistan‘s Police and Law Enforcement Infrastructure; United States Institute of Peace: Washington, DC, USA, 2011.
Figure 1. The study area: Karachi, the capital city of Sindh Province.
Sustainability 13 05520 g001
Figure 2. Number of homicides in affected cells in the study area from 2009 to 2018.
Sustainability 13 05520 g002
Figure 3. Spatial clustering of administrative divisions in the study area for different periods from 2009 to 2018.
Sustainability 13 05520 g003
Figure 4. Residuals and goodness of fit (local_pdev) of the GWPR models.
Sustainability 13 05520 g004
Figure 5. Local coefficients of negative explanatory variables in the study area.
Sustainability 13 05520 g005
Figure 6. Local coefficients for positive explanatory variables in the study area.
Sustainability 13 05520 g006
Table 1. Explanatory variables used in this study.
GroupVariableAbbreviation
Population densitypopulation density at the subdivision levelPD
Lingual distribution% Urdu-speaking population/total populationPUSP/TP
% Punjabi-speaking population/total populationPPUSP/TP
% Sindhi-speaking population/total populationPSPP/TP
% Pashtu-speaking population/total populationPPASP/TP
% Balochi-speaking population/total populationPBSP/TP
% other language-speaking population/total populationPOLSP/TP
Education level% literate population/population aged 10 and abovePLP
% male illiterates/total male population aged 10 and abovePMIL
% female illiterates/total female population aged 10 and abovePFIL
Economic statusunemployment rateUR
average household income at subdivision planned settlementsSDPAAHI
Land use% planned area/total subdivision built-up areaPPA/TSDBA
% unplanned area/total subdivision built-up areaPUA/TSDA
% commercial area/total subdivision built-up areaPCA/TSDA
Police performance% police personnel/total population of subdivisionsRPP/TPSD
% police surveillance area/total areaPSDA/TA
% total accused persons/population aged 14 and abovePTAcc/P14+
% total arrested persons/total accused personsPTArr/TAcc
% police posted/sq. km. subdivisionRPP/SSD
Table 2. Results for the GLM and GWPR models.
VariableGLMGWPR
Min.MedianMax.
Intercept2.317 **2.1262.4664.017
% Balochi-speaking population/total population (PBSP/TP)0.014 **0.0120.0140.099
% Male illiterates/total male population aged 10 and above (PMIL)0.012 **0.0020.0110.029
% Unemployment rate (UR)0.041 **0.0160.0390.048
Average household income at subdivision planned settlements (SDPAAHI)−0.024 **−0.074−0.0190.007
% Unplanned area/total subdivision built-up area (PUA/TSdA)−0.017 **−0.071−0.0080.008
% Police surveillance area/total area (PSdA/TA)−0.072 **−0.135−0.073−0.010
% Total accused persons/population aged 14 and above (subdivision) (PTAcc/P14+)0.123 **0.0900.1060.148
MAD89.88753.320
AICC112.433100.845
Percent deviance explained0.7640.860
Note: ** Significant at the 0.001 level.
Publisher’s Note: MDPI stays neutral with regard to jurisdictional claims in published maps and institutional affiliations.

