Abstract
The COVID-19 pandemic has spread rapidly all over the world, affecting many countries to varying degrees. In this study, an in-depth analysis of the factors influencing the spread of COVID-19 is offered mainly through big data in the European Union (EU) context. In doing so, the data of the first wave of the pandemic are assessed. Afterward, we evaluate the impacts of the COVID-19 spread in specific countries and regions. Based on the existing literature, mobility is recognized as a significant direct factor affecting disease transmission. The same applies to the case of COVID-19. However, compared with the analysis of mobility itself, this paper explores more profound reasons that affect mobility, ranging from policy and economy to geographical and transportation factors. Specifically, this paper studies nine EU countries based on their population density and the degree of impact of the epidemic in the first six months (February to July 2020) of the pandemic. Our study aims to illustrate how policies, economies, and geographical locations (including transportation factors) directly or indirectly affect the spread of the novel coronavirus by applying the SEIR model to analyze all selected countries’ big data. The key findings of this research are: (1) the timeliness of relevant policies and the effectiveness of government implementation indirectly limit the spread of the epidemic by reducing population mobility; (2) a better medical level would contribute to detect, isolate, and treat patients, and help control the epidemic; and (3) the large land borders and developed transportation between countries exacerbate the spread of the COVID-19. The paper contributes to ongoing research on COVID-19 by addressing the above points.
1. Introduction
In late December 2019, the first human index case for the novel coronavirus was reported in the City of Wuhan, Hubei Province, Central China. The Hubei health authorities launched a survey on 8 January 2020; and by 20 January 2020, the outbreak was officially announced. The new coronavirus (known as the severe acute respiratory syndrome coronavirus 2, or SARS-CoV-2) was confirmed as the cause of the outbreak [1]. By early February 2020, the outbreak had already spread across the world, including parts of Europe. The spread and the impacts of the pandemic were unprecedented; as of 4 February 2021, the number of infections COVID-19 claimed have already surpassed 103 million [1,2]. More than 14 months into the pandemic, most countries across the world are still struggling to cope with a growing number of COVID-19 cases. For example, several countries, including the United States of America, Brazil, and countries in the European Union (EU) like Spain and Italy, were severely affected in the third round of epidemic centers globally [3]. To be more specifically, in that round, the total number of infected people in these countries was among the world’s highest. Furthermore, the pandemic caused the world economy to shrink by 6% in 2020, and the number of flights worldwide fell by 80% compared to 2019 [4].
Emerging evidence shows that the virus can be transmitted by droplet transmission, contact transmission, and respiratory transmission, which means it has the characters of high infectivity and high transmitting speed [5,6,7]. In addition, the fatality rate of this virus is relatively high in the early stages of the outbreak [8]. Therefore, given the concern of governments worldwide about the virus, relevant measures have been introduced one after another. On 16 March 2020, the Schengen Agreement announced non-essential travel restrictions from other countries into the EU+ countries. This decision came to an agreement with the Schengen Associated States to prevent further spreading of COVID-19 in the pandemic’s early months [9]
As shown in Figure 1, since April 2020, the number of new cases per day in the EU was generally on a downward trend until July 2020. This fact means that many European countries effectively controlled the pandemic during that specific period. At this turning point, some research suggests that mobility played a significant role in the control of the spread [3,10,11,12,13,14]. In terms of geographic transportation, the process of new travel habits under the COVID-19 epidemic may lead to long-term changes in mobility behavior [15]. To be more specific, less mobility could be useful for stalling and stemming the spread of COVID-19 [16]. In this case, mobility could be divided into two parts, (1) international and (2) domestic movements. By delving into more details of the global aspect, it is evident that the number of international visitors has dropped dramatically, since most passengers have canceled their international travel plan actively or passively. On the other hand, data on population movement between and within cities have also fallen sharply. For instance, on the 15th of April 2020, across Spain, the mobility to and from grocery and pharmacy stores, workplace, parks, transit stations, and retail and recreation areas dropped by 60.86%, 73.71%, 82.43%, 85.43%, and 91.43% respectively [17]. As for individual mobility patterns, they accelerate the risk of a global spread of the virus [18]. The general belief is that the reduction of population mobility in these different aspects contributes to effectively controlling the epidemic. In other words, by adjusting the distance between people, mobility control has reduced the widespread transmission of the COVID-19 within the same region and between regions as well [16]. In addition, the spatial distribution of COVID-19 cases can be explained by population movement data, but the accuracy decreases with the implementation of control measures [19].
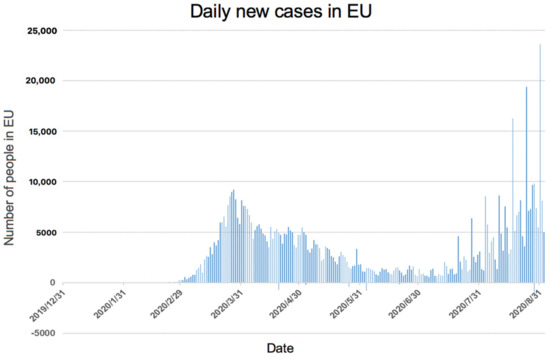
Figure 1.
Daily new cases in EU (extracted from available data by the European Centre for Disease Prevention and Control (Data extracted from [20] for the presentation of daily new cases in EU).
It is worth noting that, although some scholars analyzed the factors affecting the decline of population mobility, most of them, such as Jacobsen and Jacobsen [21], focused on aspects such as the contents of the government’s travel ban, which only involved isolated aspects of mobility management. In this case, Chinazzi et al. [22] used a global population disease transmission model to predict the impact of domestic and foreign travel restrictions on the China mainland and international spread of the epidemic. Taking southern Italy as an example, Campisi et al. investigated sustainable tourism patterns under COVID-19 and pointed out that there were significant changes in the pattern of population movement, especially in the modes of public transport, during the pandemic [23]. Additionally, as highlighted by Cheshmehzangi [24], the regional border closures in the small Oceanian countries help them keep away from the pandemic from the inception. However, they only focused on this individual aspect. Therefore, based on the research gap in this field, this study is devoted to analyzing some other factors affecting population mobility from three overarching aspects of policy, economy, and geography. It is hoped that the effective simulation and control of these factors will contribute to the prevention and control of infectious diseases in the future. Based on this aim, and to make the analysis more specific through a factual basis, we selected nine EU countries as examples for mobility analysis in this paper. Figure 2 presents a map of the cumulative number of confirmed cases in Europe as estimated on the 28th of August 2020. It is evident that the global and regional distribution of the COVID-19 is unbalanced, and our analysis also reflects on this critical fact. The criteria to select the countries is twofold: (1) the number of infections per 100,000 people in each country and (2) the population density in each country.
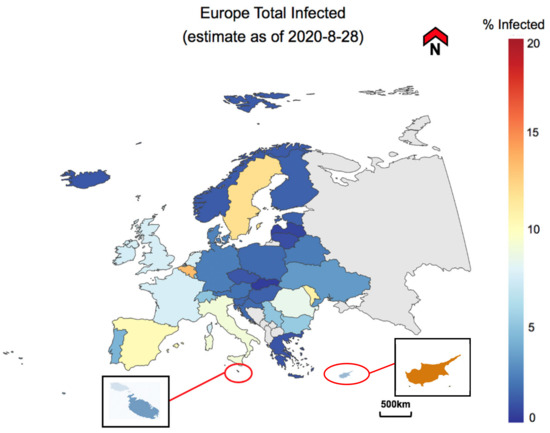
Figure 2.
Europe map of infected population (adapted from COVID-19 Europe Maps [25]).
As mentioned earlier, the research contributes to the analysis of complex factors affecting the spread of COVID-19. This paper analyzes policy, economic, and geographical aspects while taking ‘mobility’ as the core indicator. One noteworthy fact is that the outbreak is now further spread across the globe, and as of July of 2020, there is an increasing number of cases across the world. However, this study focuses on a specific timeline that could suggest the role of mobility in the early spread of the disease across the borders. Therefore, this study’s results will be applied to optimize earlier efforts to control COVID-19 and have far-reaching implications for future prevention and control of similar infectious diseases. The applications are likely to be more for future epidemics than the ongoing case of the COVID-19. Furthermore, this study contributes to scientific research, primarily through the following the aim of assessing factors affecting population mobility in parts of the European Union in order to achieve simulations and future projections of COVID-19 spreading. Simultaneously, three key objectives are given: (a) analyzing and comparing the changes in the number of cases in each selected country and affected extent by COVID-19, (b) investigating various factors affecting the spread of COVID-19, and (c) forecasting the trend of COVID-19 in the next phases.
In the following section, this study first explains some useful theories, then highlights the methodological framework and its contents. The methodologies are divided into three steps: (1) case study selection, (2) introduction of the modified SEIR model to simulate the epidemic situation, and (3) data analysis. Afterward, the results are highlighted based on the three primary aspects of the study: policy, economy, and geographical and transportation factors. These are then led to further discussion and concluding remarks of the paper.
2. Methodology
At first, the study is focused on the case study selection. As a result, nine European Union (EU) countries were selected to analyze the general situation of the COVID-19 spread in the context of the EU. This context is selected based on shared economies, shared land, and shared values. The type of data required is then determined based on the selected countries. The economic impact is likely to have a profound impact on social mobility in the longer term during COVID-19 pandemic [26]. In addition, differences in geographic mobility are also influenced by different economic classes or levels [27]. Based on data from all mobile phone users in a major mobile phone network in Sweden, they also conclude that moderate government policies can force people to adopt socially distancing behaviors. Thus, economic, policy, and geographical factors are interactive and interlaced, influencing intra-regional mobility together. As a result, when processing the data, we defined three parameters related to mobility and collect the data accordingly. To ensure the validity of the results is maintained, accurate data are used to analyze the epidemic situation, and the findings are cross-checked between the research members. The results then draw conclusions about the epidemic situation based on the impact of parameters on mobility. Finally, the study summarizes the findings and tries to find recommendations beneficial to future epidemics events. Figure 3 summarizes the study’s structure of research.
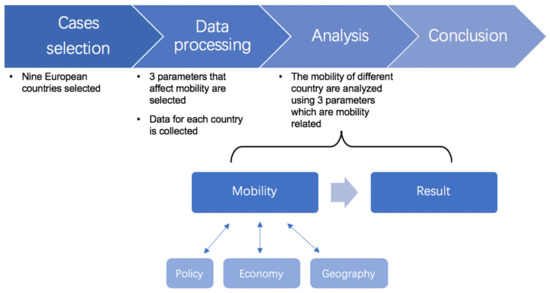
Figure 3.
Research conceptual framework: three mobility related parameters as the core elements.
2.1. Case Study Selection
This report selects nine EU countries to conduct a multi-angle comparative analysis of the virus distribution and mobility. It also explores the relationship between the control effect of the new coronavirus and different aspects. The 28 (27 + 1, including the UK) countries of the EU are divided into three levels: high, middle, and low. This categorization is conducted according to the number of cases per million by the end of August 2020 (Figure 4). In doing so, the selection is then based on multiple levels to ensure variability in case studies.
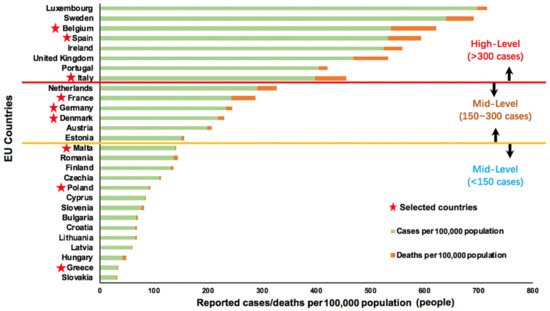
Figure 4.
Three categorized levels of the EU epidemic situation by the end of August 2020, based on the available data on reported cases/deaths per 100,000 population in the EU.
By considering the countries’ situation and land area comprehensively, three countries are selected with similar population densities at each level. This is done to ensure the comparability of cases within and across the three categorized levels. Therefore, in each level of the epidemic situation, we end up with three cases of multiple densities, i.e., high density, medium density, and low density. Table 1 below summarizes this case study selection in a matrix. The selected countries are then categorized based on the degree of the pandemic and their population density. The selected cases are:

Table 1.
Nine selected countries with data (data extracted from Worldometer [28]).
- Belgium: high-level and high density;
- The Netherlands: mid-level and high density;
- Malta: low-level and high-density;
- Italy: high-level and medium density;
- Germany: mid-level and medium density;
- Poland: low-level and medium density;
- Spain: high-level and low density;
- France: mid-level and low density;
- Greece: low-level and low density.
It is important to note that the selected countries’ situation of the pandemic now differs from the study’s selected timeframe. Hence, the focus is mainly on the selected period of the first six-eight months of the pandemic to evaluate in-depth the effect of the mobility from multiple perspectives during the early months.
2.2. Using the Modified SEIR Model to Simulate the Epidemic Situation
According to the World Health Organization (WHO) report, COVID-19 may spread from exposed cases before the onset of symptoms [29]. The SEIR (i.e., S for susceptible, E for exposed, I for infectious, R for recovered) basic model [30] does not consider exposed individuals infectious. Therefore, the infection probability (β) that the latent person contaminates a healthy susceptible person into a latent person and the number of healthy susceptible persons that the latent person contacts each day, re, are added to ensure that the SEIR model is appropriate for COVID-19. The below formula summarizes the model.
where N is the number of people in target area (population); S is the number of susceptible individuals; E is the number of exposed individuals; I is the number of infected individuals; R is the number of recovered individuals; r is the number of susceptible individuals exposure to infected individuals; β is the probability of infection after exposure to infected individuals; re is the number of susceptible individuals exposed to exposed individuals; βe is the rate of infection after exposure to exposed individuals; α is the rate at which an exposed person becomes infected; γ is the rate at which an infected person becomes recovered.
The study uses MATLAB to build the model code. First of all, basic parameters were set to simulate the natural conditions without policies, and five simulations were carried out to obtain accurate results. After that, parameters related to the imposed policy are changed to simulate the impact of the policy after it is implemented. Most of the parameters applied in this paper are estimated or assumed. Some of the estimations are derived from other simulation reports. However, since countries (regions) and the development degree (time) of the epidemic may differ for different contexts and time periods, specific parameters depend on specific analysis objects for further investigation.
The differential equation applied by the model is the ‘Markov Chain’, a random process in the state space through the transition from one state to another. The process requires the property that the current state can only determine the probability distribution of the next state, and that events preceding it in the time series are irrelevant to it.
Policies can be simulated by modifying the parameters at a specific time. For example, after the particular date when the country ordered a lockdown policy, the number of exposed people (r) is significantly reduced. Countries with better economies have higher medical standards, and the recovery rate (h) increases accordingly. In this paper, this model is mainly used to compare the epidemic situation in different countries and compare the impact of implementing policies at other times. We could then prove how policies ultimately affect the state of the epidemic in each country by affecting population mobility.
The SEIR model has been widely used and proved to be effective. In this paper, the model is only used for simple simulations to obtain evidence of the policy impact. The conclusion has limitations, which means it cannot simulate the exact situation but can closely enough to generate a debate about the impacts on specific regions/countries, particularly for the first phase of the pandemic. Thus, the simulation is fast and intuitive to analyze trends and the impact of measures. The findings will be useful for future pandemics and methods of identifying disease spread from the contextual point of view.
2.3. Data Analysis
In the data analysis section, the following two points need to be noted. The first thing to note is the data analysis aspect of the model. The new coronavirus’s incubation period is 5–6 days on average, but it can reach 14 days or longer [31]. In the analysis of many cases in this report, the average incubation period is six days. Before the lockdown, people who entered the country may only be diagnosed after the lockdown, which might cause data flotations for less or more. For example, the number of cases may not be significantly reduced until 5–6 days after the lockdown. Therefore, to avoid such issues when analyzing data related to the number of cases and time, an additional incubation period is added to ensure the analysis’s accuracy. Secondly, as the development of the epidemic changes with time, and the data in this paper involves multiple aspects of multiple countries, the study mainly focuses on analyzing and comparing the data through control variables, especially related to time. Nevertheless, the timeframe is limited to the first eight months of the pandemic to ensure focusing on the study’s main aim, i.e., to analyze mobility effects through regional (and country-level) differences.
3. Results
3.1. Policy
At the bottom of Table 1, there are three countries with low population densities but different levels of impact from the epidemic: Spain, France, and Greece. According to surveys, there are some similarities between the three countries. For example, all three countries have a high level of connectivity with Italy (via water and/or land), which is the country with the highest level of cases during the earliest phase of the outbreak in Europe. This also means they all faced an increased risk of infection in the early months. Furthermore, in terms of population mobility, Spain and France are among the EU’s major economies, while Greece has tourism as its mainstay industry. Thus, all three countries originally had relatively high levels of movement of population in the EU. However, the initial severity of the epidemic in the three countries varied widely. For instance, Spain had the highest number of cases per 100,000 population, with more than 500, followed by France and Greece with fewer than 100. From a comprehensive analysis, the main reason for this result is the significant impact of population mobility policies’ timeliness and execution.
To be more specific, an epidemic policy can be roughly divided into blockade policies to reduce population mobility, social policies to reduce the chance of spread the virus, and medical/health policies to reduce mortality. This paper focuses on blockade policies, including closing public places, school closures, closing borders, and nationwide lockdown. Social policies (e.g., maintaining social distance and wearing masks) and medical/health policies (e.g., financial allocation and provision of intensive care unit capacity) were not highlighted. One measure of a blockade policy’s timeliness is the time lag between its introduction and the first case and the first death. Figure 5 represents the first case’s timeline, the first death case, and several similar policies in each country. From the timeline, France and Spain had no effective policies in place between the first confirmed case and the first death. Additionally, it took both countries up to a month from the first death case to introduce high-level restriction measures. For example, France recorded its first death case on the 24th of February 2020, but schools across the country closed only on the 16th of March 2020. Furthermore, the stricter national ban was introduced even later than that date. This considerable time gap gave the virus enough time to spread. During that time gap, the population movement index in France and Spain changed slightly compared with regular times. This led to the spread of the virus from the original cities to all parts of the country, which was fatal for the fight against the pandemic.
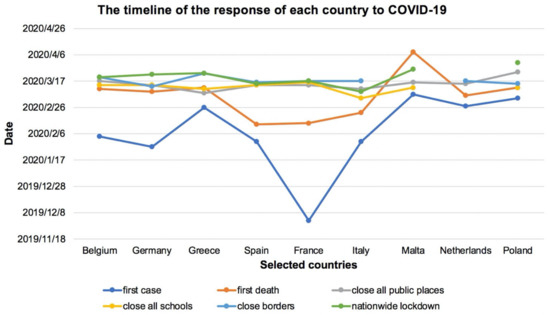
Figure 5.
The timeline of the first cases, first death, and policies for France, Spain, and Greece (Note: Three data for specific dates are not available for two EU countries of Malta and The Netherlands in the first phase of the COVID-19 pandemic).
However, the Greek policy has been much timelier. After the first confirmed cases, the Greek government took timely and effective measures in potentially high-risk areas. More specifically, on 4 March 2020, three high-risk Greek cities were under lockdown, where the flow of people with other areas was almost cut off. This immediate action effectively stopped the spread of the virus at that time. Therefore, among the three countries, although Greece is the last country to experience a nationwide lockdown (i.e., on 23 March 2020), its anti-epidemic efforts are the most successful. This was similar to China’s situation, where the timely closure of the epicenter or the source city was more important than the subsequent national closure. Additionally, as showed in Figure 5, the Greek government has also taken a series of other effective measures in a timely manner before the first death case. These timely measures include closing all public places on 8 March 2020, and closing all schools on 11 March 2020. As per the parliamentary statement by the prime minister of Greece, Kyriakos Mitsotakis, the epidemic’s control was largely due to the ban’s timely implementation, indicating that their schools were closed even before the first death case (i.e., on 12 March 2020). As per records [32], most countries did not close schools until two or three weeks after the first death case, when dozens of patients may have died. Furthermore, the Spanish government’s slower response might be partly influenced by the country’s geographical factors. The Spanish borders are within 400 miles of the first European epicenter, i.e., Italy. However, geographically, there are no land borders with Italy, which has caused the delay by the Spanish authorities to propose an immediate response.
In addition to its policies’ timeliness, which suggests that the Greek government responded faster than France or Spain, we can see significant gaps in the government’s executive power in each country. For instance, in Spain, the government responded slowly and clumsily to the outbreak. Before the emergency policy was implemented, part of the population of Madrid and other cities had dispersed across the country. The movement of this population was the leading cause of the spread of the epidemic. Moreover, the policies of the Spanish government were poorly coordinated. The Madrid municipal government closed schools early but did nothing else, creating a holiday atmosphere that led to crowded bars, parks, and public spaces. This resulted in an increased influx of tourism and many families even going to the seaside. The other main reason for the rapid spread of the virus in Spain is related to the country’s climatic conditions. For instance, in late February and early March, with temperatures above 20 ℃, Madrid’s pavement cafes and bars were heaving with happy folk, doing what Madrileños like best: being sociable. That means hugging, kissing, and animated chatter just a few inches from someone else’s face [33]. Fortunately, though, the lockdown that began on 14 March 2020, was efficiently enforced with police fines and nationwide pressure. However, by then, the virus had spread far and wide already, which then led to a complex situation of the outbreak control. By the end of March 2020, Spain had already become one of the worst-hit EU countries (Figure 6). However, Spanish health official Maria Jose Sierra said the daily infections trend had changed since taking the lockdown measures. Compared to 20% of new infections that occurred per day before 25 March 2020, the figures were roughly down to 12% by the end of Summer 2020 [34].
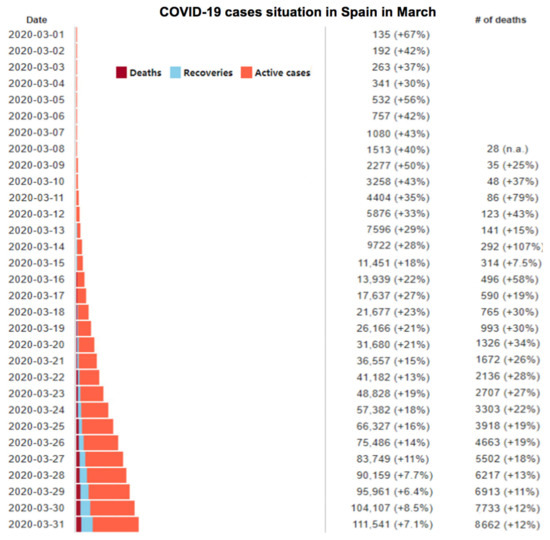
Figure 6.
COVID-19 data for death cases, recovery cases, and active infected cases in Spain during the month of March 2020, adapted and data is extracted from [34].
Compared with France and Spain, Greece was not initially expected to prevent and control the epidemic. On the contrary, it was believed that Greece, as a country that suffered the worst economic crisis and several years of recession, would be affected significantly. There are a variety of reasons. On the one hand, at the end of February 2020, the disease outbreak began in Italy, and Greece, which is not far from Italy, was considered the riskiest destination for the disease to spread. On the other hand, the Greek health system was considered more vulnerable due to more than a decade of spending cuts. Greece currently has 560 intensive care beds for a population of 11 million, equivalent to 5.2 beds per 100,000 people [35]. Compared with 29.2 beds per 100,000 people in Germany, the Greek healthcare facilities are deficient.
Despite the odds, Greece managed to contain the outbreak in the first wave of the epidemic. In addition to the timely policies mentioned above, both the government and people made many efforts. According to the analysis, Greece had a high level of population mobility before the outbreak. People over the age of 60 made up 25 percent of the population, putting the country at increased risk of an epidemic. Therefore, the Greek government attaches great importance to epidemic prevention. After the outbreak in China at the end of January, the Greek Ministry of Health set up an emergency treatment mechanism, followed the epidemic situation in China closely, and kept communicating with China on the COVID-19 information. This Greek epidemic prevention work gained precious golden time. The day after the first case of COVID-19 was confirmed in Thessaloniki, Greece’s second-largest city, the government canceled the annual carnival and banned any large gatherings. Schools and universities across the country were closed as early as the 10th of March 2020. Just three days after the country had only 89 confirmed cases, the government announced the closure of cafés, restaurants, and tourist attractions. They also promptly introduced a rent-free subsidy policy for small and medium-sized private businesses. Tourism is the primary industry of the Greek national economy. At an early stage, the government decisively chose to close the border and stop international flights due to the epidemic.
In addition to its people-oriented and scientific policy from the very beginning, the Greek government cannot do without the support from all walks of life and the Greek people’s code of solidarity. If the epidemic situation becomes more severe, the impacts on the economy will also be more severe, making the Greek who has just experienced an economic crisis have a strong sense of crisis toward the virus. Coupled with the novel coronavirus high risk for the elderly group, it became a consensus to give priority to protecting the elderly and vulnerable groups. With the government’s joint efforts and its people, Greece has become a successful example of the European response in the first wave of the COVID-19 outbreak.
3.2. Economy
Since the economy covers many aspects, this paper mainly explores the medical level’s impact on the spread of COVID-19 in Europe, taking Germany, Italy, Spain, and France as examples. As of 15 August 2020, Germany’s mortality rate was approximately 4.1%, in Italy 13.9%, in Spain 7.4%, and in France 13.5%. There are two main reasons why Germany’s death rate is much lower than that of the other three and also in comparison to its neighbors. The first is the overall level of the medical system. The prevailing medical level includes the level of medical equipment, medical staff, and medical collaboration. Since isolation is an integral part of the prevention and control of COVID-19, a highly infectious virus, higher numbers of beds and staff are significant, which means the hospitals can isolate and treat more patients at the same time. According to data released by Eurostat in 2017 (Figure 7), Germany has one of the highest numbers of medical beds in Europe, especially critical beds. All of them show Germany’s huge spending and emphasis on national healthcare services. In 2017, there were 800 beds for every 100,000 residents in Germany. By comparison, France has 598 beds for the same number of residents, Italy has 318, and Spain 297. The EU average figure is approximately 500, which means that Italy and Spain’s medical levels are well below the European average. The reality of the situation also illustrates this problem. Taking Italy as an example, where the number of cases far exceeds hospitals’ capacity, people with mild illness had to choose to self-isolate themselves at home, even though they were highly contagious. It also means that isolation is not mandatory and is not strict enough to prevent the virus from spreading to those around them. As for intensive care unit (ICU), Germany has 29.2 intensive care beds per 100,000 inhabitants, again well ahead of Italy (12.5), France (11.6), Spain (9.7), and the EU average (14.3) [36].
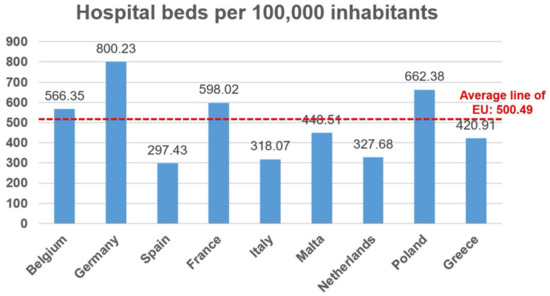
Figure 7.
The hospital beds per 100,000 inhabitants (data extracted from EUROstat 2017).
In addition to the number of medical beds per capita, Germany also has a better healthcare system than its neighbors. As a result of the large number of laboratories established in Germany, early daily testing was also relatively high. The high detection capacity allowed Germany to seize the opportunity to conduct better screening in the early stages of the epidemic. By contrast, France, Italy, and Spain had to leave testing to suspected cases who have symptoms and meet various conditions. In France, for mild cases, people could only be isolated at home for 14 days, rather than having access to professional care. Just because more people were tested in Germany than in other countries (i.e., even for those with less severe symptoms), they could better overview the outbreak progression. Hence, Germany’s death rate was relatively low.
Moreover, a high level of medical cooperation, of which the advantage is the high efficiency of utilizing existing medical resources, is important as well. At the height of the first wave of the COVID-19 epidemic, medical and nursing staff seemed to be the critical limiting factor, stressed and exhausted, with a marked lack of good rotation or replacement arrangements. Most notably, in Italy, the health workforce has long been on the brink of collapse, with extreme cases of suicide and stress among staff. Therefore, it is necessary for governments to systematically develop coordinated preparedness plans for managing surges, whether in terms of hospital capacity or medical supplies, such as ventilators.
3.3. Geographical and Transportation Factors
These factors assess the impact of geographical context and transportation on the prevalence of COVID-19 in Europe. The direct medium of COVID-19 transmission is population mobility, which is heavily influenced by geographic and transportation factors [3]. Therefore, this indicator is a critical one when assessing the population mobility domain. This indicator mainly studies the geographical context throughout Europe and the European Union’s transport network to analyze the nine target countries’ specific situations. To summarize, compared with other continents, the whole of Europe is relatively low-lying. Within the target area, the central mountain range is the Alps, covering northern Italy, southeastern France, Switzerland, Liechtenstein, Austria, and southern Germany. This geographical separation forms natural boundaries that also played parts in the regional distribution of the COVID-19 outbreak in its early days.
Due to the development of roads, railways, and air traffic, the geographical barrier has been minimal in modern times. In particular, the Gotthard tunnel through Switzerland, opened in 2016, has broken through the bottleneck of the north–south traffic in Europe. It makes railway traffic in Germany, France, Austria, Switzerland, and Italy very smooth. As a result, the region of Lombardy in northern Italy was hit the most in the first wave of the outbreak. This was mainly due to the region bordering Germany, France, Austria, and Slovenia, with also at least nine cross-border railways. Due to the implementation of the EU integration policy, people’s flow across the borders was relatively smooth before the restrictions on COVID-19 were introduced. Based on Eurostat’s relevant data in 2015, the map of border exchanges in Europe is drawn up. This study also utilizes a real-time authoritative map of epidemic data from the COVID-19 section of the HealthMap website. This is used for the comparison analysis to find the impact of geographically traffic-affected population movements on the pandemic. Figure 8 shows the Lombardy (Lombardia) region’s location and illustrates cross-border commuting in the form of the percentage of respondents in each country’s border regions.
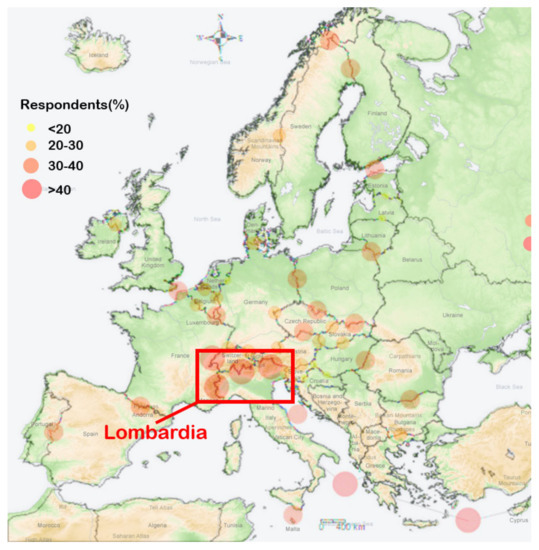
Figure 8.
The extent of commuting across borders in parts of the EU (the percentage of respondents), highlighting also the first European epicenter of the COVID-19 pandemic during the first phase of the disease outbreak in the EU context, i.e., Lombardia, North Italy.
It is not difficult to find that Italy’s northern part is a central transportation hub that connects many countries. It is one of the regions with the most frequent social exchanges on the European border. Moreover, the Lombardy region was at first the most affected area in Italy and Europe. This was because Italy’s border restraint policy in the early period of the COVID-19 pandemic was not timely.
A second example is another highly infected region in western Europe. Figure 9 demonstrates a data map of 2015 from Eurostat, showing the direction and flow of traffic across borders in Europe. According to Figure 9, it can be observed that there is a massive flow of personnel exchanges in the border area between The Netherlands, Belgium, France, and Germany. Additionally, The Netherlands and Belgium are small in size and have high population density. This fact was also one of the main reasons they became one of the hardest-hit areas in Europe. This is more detailed in the right image in Figure 9, which demonstrates the map of the epidemic situation near The Netherlands and Belgium as of 31 July 2020. It shows that the actual problem is consistent with the theory. Belgium’s southern border with France and Germany and its northeastern border with The Netherlands have all been hit the hardest during the first wave of the COVID-19 outbreak in Europe. At first, the worst affected areas in The Netherlands were not Amsterdam or any other major cities, but the southern registered bordering with Belgium and Germany.
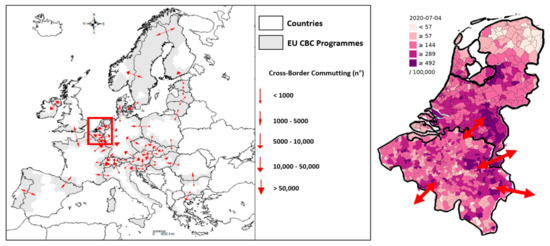
Figure 9.
The cross-border communing map based on EUROstat 2017/COVID-19 map near The Netherlands and Belgium.
Reference data show that cities with a European liquidity index above 50% include Brussels, Lyon, and Paris. All of these cities have both rail and air hub standards. At the same time, these cities are also associated with other areas that are not bordering or even far away because of the relevant air routes (especially before the large-scale blockade). This supports the fact that air transport is the largest possible source of transmission apart from other transportation modes like rail transport. The combined air and rail systems that exist in some areas may exacerbate this effect, so lifting restrictions must be done with great care. In terms of road transport, the lack of public transport and the tendency of private cars in Europe have reduced this potential risk.
Moreover, Greece, and notably Malta as a typical island state, rely almost entirely on air travel for people’s movement with other countries. In this regard, policies related to domestic and overseas aviation in the wake of the outbreak have been a significant factor. In fact, both Greece and Malta imposed earlier cross-border movement controls and strict restrictions on people’s movement within their borders, and because both countries are small in size with small populations, they are far less affected by COVID-19 than those in continental Europe.
In addition, water transportation is one of the less common modes of population mobility. Although their proportion has become smaller at present, some countries still do have a larger body of population mobility over water bodies. Objectively speaking, the travel time of water transportation is relatively long, and the space in the voyage is relatively tight. In particular, the outbreak of mass epidemic on some large passenger ships around the world in the early stage of the epidemic has further hit the passenger flow market of water transport. Therefore, the impact of water transport on mobility is almost negligible.
4. Discussion
4.1. Simulation of Policy Impact through a Pilot Case
According to the findings, a country’s public health policy could significantly impact its population’s mobility, and in turn, affecting the country’s control and management of the COVID-19 pandemic. The SEIR model is a reliable model that has been widely used to visualize the impact of policy. The real situation will have a wide range of specific parameters presented, and many studies have improved the SEIR model to make it closer to the real situation. However, a simulation cannot fully reflect the real situation, and the simulation and prediction of the real situation is not the core expression of this paper. The simulation is based on the ideal case of a closed sample country, meaning that mobility between countries is ignored. In subsequent studies, other parameters may be explored to explore the extent to which more factors influence policy, mobility, and the pandemic.
At of the end of January 2021, the ratio of active cases to the Belgium population deteriorated and became the top place in Europe, with 4154 infections per million people [37]. Data in Belgium were used to simulate policy implementation’s impact on the epidemic using the SEIR model. The case of Belgium is selected due to its high-level ratio of active cases. The simulation is conducted to verify the arguments of the study. The first step is data collection, and the second step is simulation and analysis.
4.1.1. Data Collection
As shown in Section 2.2, the parameters required for simulation include population (N), recovery rate (y), infection rate (B), exposed number (r), mortality, number of infected individuals (I), exposed individuals (E), and recovered individuals (R). Since Belgium’s testing ability in February 2020 was inefficient, data from April to July 2020 were chosen for more accurate simulation. The simulation data come from websites that update the epidemic data in real-time, as shown in official data by EPISTAT [38]. To estimate the infection rate, a calculation model is established by comparing the number of daily new cases and yesterday’s active cases. The infection rate for six months can be estimated as 0.016. Under the latest data update in Belgium, the mortality and recovery rates during this period are 3% and 6%, respectively. The conversion rate between exposed and infected individuals cannot be accurately obtained from the data, so the reciprocal expression of the incubation period is used, which is 1/5.8 [39]. The daily exposed number of infected individuals was estimated to be 10 in the initial situation [40]. The infection rate and the number of exposed persons are assumed to be the same as infected individuals. According to the Belgian epidemic information published on 1 April 2020 [38], the initial epidemic situation was I = 13,964 ppl, E = 1396 ppl, and R = 2132 ppl, with the population of Belgium estimated to be 11 million.
The degree to which policies are implemented varies widely between countries, meaning that the resulting interventions are reflected in different parameters. When changing the parameters, the implementation degree of the policy is divided into five levels, and the impact on parameters are 10%, 30%, 50%, 70%, and 90%, respectively. Through social media, reports, and other information sources, the study estimates the implementation of the policy and finally determines the appropriate parameter changes.
4.1.2. Simulation and Analysis
According to Figure 10, considering the ideal situation without policy influence, the number of infected people reached a peak within two months, during which time about 3 million people were infected in these regions. At the end of July 2020, almost all the infected people disappeared, but according to the mortality data, the disappeared numbers resurfaced in the form of mortality numbers—about 330,000 deaths in the country.
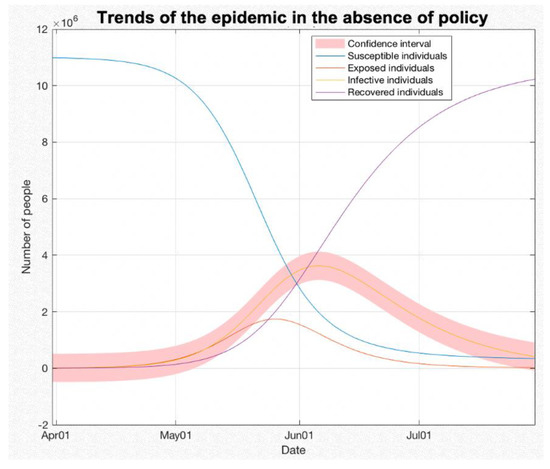
Figure 10.
SEIR model with no policy, using the trends of the epidemic in the absence of policy.
Compared with the ‘no policy’ situation, the simulation with lockdown policy (restrictions on mobility) is presented in Figure 11. The estimated daily exposed number of infected individuals (r) dropped by half after the wide-scale lockdown was implemented (1 May 2020). The figures verify the drop was from 10 cases per day to five per day. The range of change of ‘r’ value depends on the degree of policy implementation and should be estimated in combination with the specific implementation situation of different countries. The peak number of infected people was delayed by about 30 days, which means that the government and people have more time to respond to the pandemic. Additionally, the daily number of infected people dropped by about 50% in the same period. Hence, the outbreak of the epidemic was delayed, and its severity was mitigated.
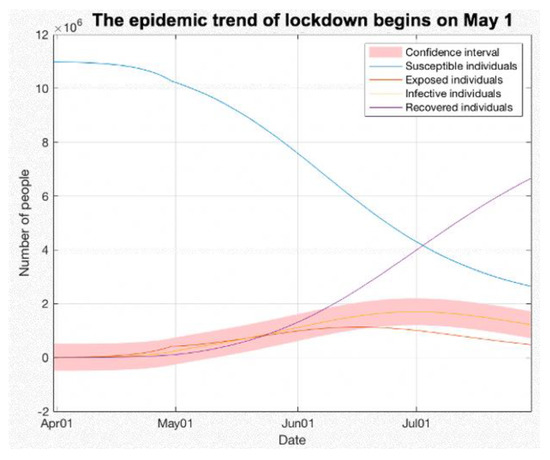
Figure 11.
SEIR model with lockdown policy, using the epidemic trend of lockdown started on 1st of May 2020.
Other aspects, such as the quarantine policy, wearing a mask, and reducing aggregation, are characterized by lower infection rates (B). Assuming that 50% of people wear masks correctly, the infection rate can be estimated to be 50% of the original, from 0.016 to 0.008. However, exposed individuals may not be aware of their disease and wear masks less often, so the estimated impact on exposed individuals is only 25%, i.e., from 0.016 to 0.012. As shown in Figure 12, the simulation data with the mask strategy is similar to the mobility restriction strategy, but the impact is relatively small.
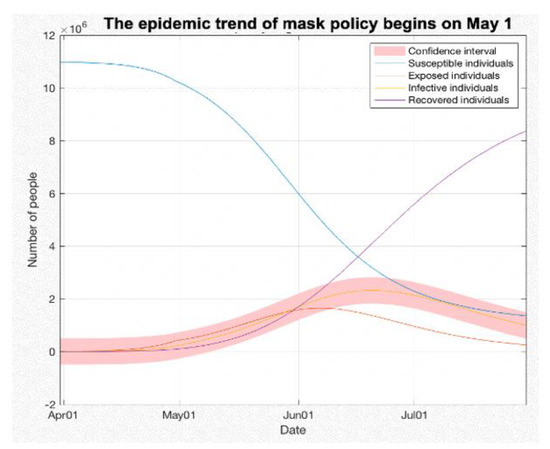
Figure 12.
SEIR model with mask policy, using the trend of mask policy started on 1st of May 2020.
The simulation of the simultaneous use of different policies is shown in Figure 13 and Figure 14 at two different times with 10 days difference. The sharp turn in the curve (the peak) shows how quickly the effective policies can have an impact on the epidemic. However, in reality, the implementation of policies is often gradual, and the performance is often lagging. It will depend on the ability of the government and the efficiency of virus detection. Under the same changed parameters as before, the daily number of infected individuals (I) remains extremely low throughout the year, and the total number of infected individuals (I) nationwide is 3,979,000 people by the end of July 2020. Compared with the ‘no policy’ situation, the number of death cases was reduced by 63.8%. According to the simulation, if the policies are implemented well, the pandemic will be basically under control by December.
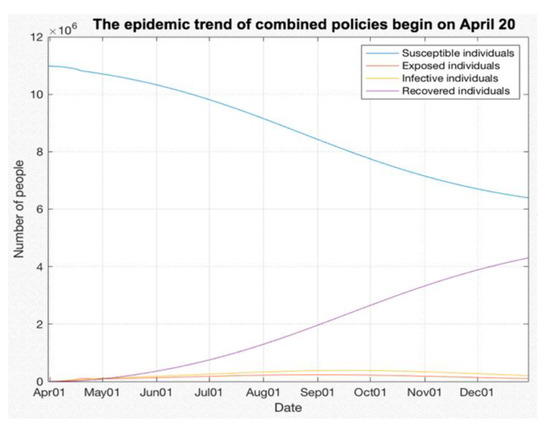
Figure 13.
SEIR model with combined policies, using the epidemic trend of combined policies started on 1st of May 2020.
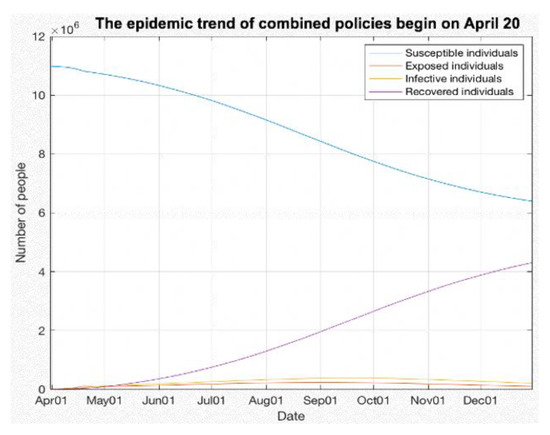
Figure 14.
SEIR model with combined policies 10 days in advance, relative to time in Figure 13, using the epidemic trend of combined policies started on 20th of April 2020.
Figure 14 simulates the combined policy’s implementation 10 days in advance, relative to the policy implementation time in Figure 13. On 31 July 2020, the number of infections dropped from 3,979,000 to 1,800,200, or a 45% reduction in caseloads. These findings indicate that, in the long run, the 10-day advance policy can substantially slow the spread of the epidemic.
Overall, the SEIR model proved that the mobility restriction public health policies can stall and stem the spread of the virus, and in turn, delay the outbreak time and reduce the severity of the pandemic. In sum, earlier implementation of the policy proved to be very effective in mitigating the pandemic.
4.2. Discussion on Mobility and Urban Development
In general, multiple factors suggest the impact of population mobility on the spread of the pandemic. The first is that changes induced by the studied strategies considerably overlap with the government’s introduction of new national policies, highlighting the importance of government action in changing population behavior. Following the blockade imposed by the government, the mobility pattern quickly entered a new equilibrium, marking the end of the transitional period. Pullano et al. [41] made qualitative and quantitative analyses of people’s mobility in France using the travel-related big data published by France Telecom. Their findings show that the blockade has reduced travel by 65% for residents and 85% for non-residents. Our study found that long-distance domestic transportation in all countries is almost completely disrupted through case studies of nine countries, and the reduction of traffic flow in different regions is not uniform. Through further exploration, it is found that the degree of mobility reduction is related to regional economic differences. Although there has been a movement out of the most populous cities, it has not been significant. This is mainly because the economic decline during the epidemic has forced people to move to larger cities, searching for more employment opportunities. Therefore, more policy guidance is needed to reduce the prevalence of mass gatherings (rallies, marches, holiday celebrations, etc.). For some purposes of flow/travel, for instance, strategies such as cancellations, postponements, and moving gatherings online could help bring down potential high-impact mobility.
As for some small-scale flows, such as shopping, approaches such as centralized time-sharing and targeted delivery can be adopted to reduce the flow of personnel. In addition to the movement caused by employment, reasons for mobility between cities vary. They include the need to return to school and company after holidays, which often occurs in larger cities. Additionally, the presence of developed railway and subway systems in big cities, such as the early stages of the Wuhan epidemic, is closely linked to the number of positive cases [42]. Therefore, the control of inter-city mobility in large cities, especially difficult-to-avoid mobility abilities (e.g., the Spring Festival travel), could benefit from special research and policy attention [43].
As the study shows, the deficiencies in control and prevention of the pandemic also appeared in well-developed urban regions. In this regard, urban structure plays a vital role in epidemic prevention. The division of responsibilities brought by reasonable structure provides more immense possibilities for timely response measures. There is this global movement towards metropolitans and mega-cities, the impact of which needs to be thoroughly examined. Urban centers like Paris, with more than 10 million population, are mushrooming across the world. Therefore, managing epidemics in an increasingly urbanized world is essential, but it is also complicated by contemporary urbanism’s peculiarities, as the COVID-19 crisis fatally demonstrated [44]. For example, in urbanizing regions, institutional roles and responsibilities overlap, raising questions about who is responsible for preventing and controlling epidemics [45,46]. The failure of responsibility allocation may lead to chaos in the epidemic prevention work. As a multi-party country, Italy has contradictions and differences among regions, making it challenging to coordinate its epidemic prevention endeavors, resulting in the ineffective implementation of critical epidemic prevention measures and compromised epidemic control attempts. Through the case study of nine EU countries, it is found that the rational division of urban structure is also essential. For cities with high infection rates, we identify various factors instrumental in curbing COVID-19 transmissions, such as the lack of people-centered urban design. The allocation of medical areas, for instance, is often in remote areas and away from the residential areas, which, in turn, could result in long public transportation in terms of distance and time, not to mention that the lack of medical institutions could further compound the situation. Therefore, in the process of urbanization, more people-centered functional zoning and allocation of medical institutions (community hospitals, etc.) may be necessary in light of the infectious disease control and prevention imperatives. These findings combined underscore the importance of critical infrastructures [3] in preventing and controlling pandemics like COVID-19.
4.3. Further Discussion: New Social Spaces?
The analysis presented in this paper highlights three aspects of COVID-19 prevention in nine EU countries concerning mobility: policy, economy, and geography. Mobility plays a significant role in shaping the progression of the COVID-19 pandemic, as increased mobility could translate into greater chances of contact between individuals (e.g., in confined trains, buses, and planes) and more pronounced infection rates. As shown in Section 4.1, the SEIR model is an effective method to simulate multiple scenarios. It is important to note that the ratio between infected and recovered patients must be at a rate that is compatible with available healthcare resources (e.g., the number of hospital beds) to ensure proper and prompt care and treatment of COVID-19 patients. In this regard, the COVID-19 prevalence might be treated in self-isolation, but not in severe cases.
As shown in the findings, the government timeframe to respond to the pandemic was limited since the virus spread fast; thus, evidence-based swift measures paid off, such as clear and coherent control of mobility and social gatherings. One key advantage of these measures is that they can be adjusted relatively easily—countries can update their policies as their COVID-19 prevention realities change. However, one important caveat is that these measures are difficult to establish and enforce in countries where the governments lack the ability or authority to propose or impose them. Examples are regions like the USA and Brazil, which in turn, could lead to catastrophic consequences (e.g., skyrocketing COVID-19 infection and death rates). It is also important to note that one key aim of mobility regulations is to avoid overloading the healthcare systems, a goal that is often difficult to achieve [3], even for Germany, a country known for its highly developed healthcare standards and capability.
This study focuses on the context of the European Continent, with selected cases of individual countries. We acknowledge that Europe has its distinctive characteristics globally due to its open-border policies, short distances between membership countries, and well-connected transportation systems, all of which are hallmarks of EU countries’ economies. These distinctive characteristics should also factor in COVID-19 control and prevention. As is well-acknowledged in the literature and this study, commuting to work across country borders is common in Europe. Areas with high connectivity in transport, such as in the north of Italy and the Dutch border, may face more pronounced difficulties in curbing the virus’s spread. In turn, they could implement tailored measures to offset their vulnerabilities. Some of the effective examples are using the system to transport essential goods but not people [3], implementing adequate lockdowns [47] to stabilize the infection rate, or even adopting passenger control with temperature check and facial mask use, etc. From a shared mobility services study [48] to evaluation of transmission dynamics [49] and various policies [50], we ought to consider policy, scale, and mobility patterns during the lockdown period [51,52,53]. Therefore, it is important to evaluate mobility trends in correlation with specific factors [54] and understand the wider implications of mobility restrictions on society [55]. To achieve these, spatiotemporal analysis is inevitable [56] and other aspects or perspectives [57,58,59,60] should be taken into consideration as well.
Regarding the economy, EU countries could energetically expand healthcare capabilities (e.g., the number of hospital beds), as China did while building temporary hospitals and healthcare facilities in its first months combating the pandemic. That said, avoiding hospitalizations should be an unwavering priority for all countries around the world in the fight against COVID-19. Ideally, if mobility-centered public health policies are properly and promptly established and enforced, with the last-mile virus transmission issues curbed by the public’s compliance with safety measures such as face masking, severe COVID-19 cases that could lead to hospitalizations should be avoided in the first place. At present, though high hopes have been put on vaccination, due to issues such as vaccine equity, its efficacy in controlling the pandemic in a timely manner remains debatable [43]. Virulent COVID-19 mutations have already been found across the world, including Europe, South Africa, and the Americas, with data suggesting that these variants are more transmissible (i.e., up to 70%), deadly [61], and make existing vaccines less effective [62,63,64]. More social distancing and fewer commuting measures lead to new exchange forms, where virtual space dominates over real space and different strategies for interactions are necessary. Although still debatable [65], even the exchange of goods could benefit from new modes that require less physical contact, digitalized tools, and clear and coherent actions to ensure safety. Nevertheless, we recommend focusing on effective measures instead.
As evident in existing literature, the urban space will also adapt to new living modalities, communicating, moving, or other new modes of communications and social interactions. Thus, there are evident shortcomings regarding the nexus between urban space, mobility, and social interplays in places. While the communications in online platforms gained a new boost, the need for public space shifted. Gehl [66] reported many transformations in Copenhagen during the city’s lockdowns; it was observed that the city was being utilized more for recreation and exercise purposes, while public space remained intact amid the mandates. New life choices regarding outdoor spaces create new ideas of urban life and contemporary realities of urban interactions. For instance, in some countries, demand for bicycle movement and pedestrian activity is reduced in the city center but increased in the outskirts [66]. The consequences of these changes for cities will stimulate novel and innovative forms of urban space utilization and organizations.
4.4. Limitations
In addition to the research findings discussed above, there are some limitations related to the data source and the SEIR model of this paper. Firstly, the imported cases are ignored when the SEIR model is used to simulate the impact of different policy dates on the epidemic’s status in other countries. Secondly, the recovery rate is updated in real-time. However, the data used in this model are from the end of July 2020, and the recovery rate in Belgium by January 2021 should be 0.69. Thirdly, since the data used in this paper are concentrated in the first six months of the COVID-19 pandemic, there are some limitations to the government’s statistics and release of data. Specifically, there is no unified statistical standard for various data in different countries. Therefore, the number of daily contacts of each infected person (r) and patients’ data in the incubation period cannot be accurately obtained. Although the results may differ from reality, the model shows the impact of mobility policies under ideal conditions through reasonable data estimates or assumptions. This is the reason why the simulation is conducted for a selected pilot case. In the future, when the rate of transmission of a patient in the incubation period is determined, the simulation would be more accurate by modifying the corresponding parameters. Fourthly, the possibility of transmission of the virus by an asymptomatic infected person is ignored [67]. However, these research limitations do not have a significant impact on the aims and objectives of the study.
5. Conclusions
Overall, based on the above data analysis and comparison, four key results could be summarized. First, the critical importance of mobility on the spread of the COVID-19 is undeniable. Second, the role of policy in controlling the epidemic cannot be ignored. Timely and effective public health policies, such as closing all public places, nationwide lockdowns, and social distancing mandates, could reduce population mobility, therefore slowing the epidemic’s spread. Meanwhile, as aforementioned, governments’ implementation and enforcement of these policies are indispensable to COVID-19 control and prevention. Third, the level of medical care also greatly affects the number of people infected in a country. Better medical resources mean faster case screening and better disease treatment; simultaneously, more efficient use of resources also contributes to mitigating the pandemic. Finally, in terms of geographical analysis, while convenient geographical location and well-developed transportation could make the disease spread faster, at the same time, reducing transportation is also one of the most effective ways to control the disease.
Overall, these measures contribute to the current management of the COVID-19 pandemic. In light of their proven effectiveness, they play an instrumental role in controlling the current pandemic. They can also be utilized as models to control and prevent emerging infectious diseases in the future [68]. Although these strategies are proven to be effective, compelling evidence is needed to verify their universality across research contexts. Our study’s findings contribute substantially to the evidence base, since this paper’s data sources are from nine European countries. Nevertheless, we urge future studies to factor in the specific conditions and considerations of their research contexts when applying these strategies in specific social or pandemic control scenarios.
Author Contributions
Conceptualization, A.C., J.R., D.K., and Y.S.; data curation, M.S., J.R, D.K., Y.S., S.B., and J.X.; formal analysis, A.C., D.K., Y.S., S.B., J.X., Z.S., and A.D.; funding acquisition, A.C.; investigation, A.C., M.S., S.B., and J.X.; methodology, A.C., M.S., Y.S., and J.X.; project administration, A.C.; supervision, A.C., M.S., and A.D.; validation, S.B. and Z.S.; visualization, D.K.; writing—original draft, M.S., J.R., and D.K.; writing—review and editing, A.C., J.X., Z.S., and A.D. All authors have read and agreed to the published version of the manuscript.
Funding
This research was funded by the National Natural Science Foundation of China (NSFC), grant number 71950410760. We also acknowledge the Ministry of Education, Culture, Sports, Science and Technology (MEXT), Japan for providing the support to the corresponding author under the NERPS, Hiroshima, Japan, and the Faculty of Science and Engineering (FoSE) at the University of Nottingham Ningbo China (UNNC) for funding the summer internship positions. The APC was funded by the National Natural Science Foundation of China (NSFC).
Institutional Review Board Statement
Not Applicable.
Informed Consent Statement
Not Applicable.
Data Availability Statement
All data used in this study are openly available to the public. All data and original sources are cited and provided in the reference list.
Conflicts of Interest
The authors declare no conflict of interest.
References
- World Health Organization. Novel Coronavirus—China. 2020. Available online: https://www.who.int/csr/don/12-january-2020-novel-coronavirus-china/en/ (accessed on 26 August 2020).
- Johns Hopkins University. Coronavirus Global Map. 2021. Available online: https://coronavirus.jhu.edu/map.html (accessed on 12 April 2021).
- Cheshmehzangi, A. The City in Need: Urban Resilience and City Management in Disruptive Disease Outbreak Events; Springer Nature: Singapore, 2020. [Google Scholar]
- Iata.org. COVID-19 Puts Over Half of 2020 Passenger Revenues at Risk. 2020. Available online: https://www.iata.org/en/pressroom/pr/2020-04-14-01/ (accessed on 26 August 2020).
- Hindson, J. COVID-19: Faecal-oral transmission? Nat. Rev. Gastroenterol. Hepatol. 2020, 17, 259. [Google Scholar] [CrossRef]
- World Health Organization. Modes of Transmission of Virus Causing COVID-19: Implications for IPC Precaution Recommendations. Available online: https://www.who.int/news-room/commentaries/detail/modes-of-transmission-of-virus-causing-covid-19-implications-for-ipc-precaution-recommendations (accessed on 9 September 2020).
- Coşkun, H.; Yıldırım, N.; Gündüz, S. The spread of COVID-19 virus through population density and wind in Turkey cities. Sci. Total Environ. 2021, 751, 141663. [Google Scholar] [CrossRef] [PubMed]
- Johns Hopkins University. Mortality Analysis. 2021. Available online: https://coronavirus.jhu.edu/data/mortality (accessed on 12 April 2021).
- European Commission. Coronavirus: Commission Invites Member States To Prolong Restriction On Non-Essential Travel To The EU Until 15 May. 2020. Available online: https://ec.europa.eu/commission/presscorner/detail/en/ip_20_616\ (accessed on 22 August 2020).
- Badr, H.S.; Du, H.; Marshall, M.; Dong, E.; Squire, M.M.; Gardner, L.M. Association between mobility patterns and COVID-19 transmission in the USA: A mathematical modelling study. Lancet Infect. Dis. 2020, 20, 1247–1254. [Google Scholar] [CrossRef]
- Cartenì, A.; Di Francesco, L.; Martino, M. How mobility habits influenced the spread of the COVID-19 pandemic: Results from the Italian case study. Sci. Total Environ. 2020, 741, 140489. [Google Scholar] [CrossRef] [PubMed]
- Gatto, M.; Bertuzzo, E.; Mari, L.; Miccoli, S.; Carraro, L.; Casagrandi, R.; Rinaldo, A. Spread and dynamics of the COVID-19 epidemic in Italy: Effects of emergency containment measures. Proc. Natl. Acad. Sci. USA 2020, 117, 10484–10491. [Google Scholar] [CrossRef]
- Djidemetriou, G.M.; Sasidharan, M.; Kouyialis, G.; Parlikad, A.K. The impact of government measures and human mobility trend on COVID-19 related deaths in the UK. Transp. Res. Interdiscip. Perspect. 2020, 6, 100167. [Google Scholar]
- Mu, X.; Yeh, A.G.O.; Zhang, X. The interplay of spatial spread of COVID-19 and human mobility in the urban system of China during the Chinese New Year. Environ. Plan. B Urban Anal. City Sci. 2020. [Google Scholar] [CrossRef]
- Toger, M.; Kourtit, K.; Nijkamp, P.; Östh, J. Mobility during the COVID-19 Pandemic: A Data-Driven Time-Geographic Analysis of Health-Induced Mobility Changes. Sustainability 2021, 13, 4027. [Google Scholar] [CrossRef]
- Saha, J.; Barman, B.; Chouhan, P. Lockdown for COVID-19 and Its Impact on Community Mobility in India: An analysis of the COVID-19 Community Mobility Reports. 2020. Available online: https://doi.org/10.1016/j.childyouth.2020.105160 (accessed on 2 September 2020).
- Ritchie, H. Google Mobility Trends: How Has The Pandemic Changed The Movement Of People Around The World? 2020. Available online: https://ourworldindata.org/covid-mobility-trends (accessed on 30 August 2020).
- Nicolaides, C.; Avraam, D.; Cueto-Felgueroso, L.; González, M.C.; Juanes, R. Hand-hygiene mitigation strategies against global disease spreading through the air transportation network. Risk Anal. 2020, 40, 723–740. [Google Scholar] [CrossRef]
- Kraemer, M.U.; Yang, C.H.; Gutierrez, B.; Wu, C.H.; Klein, B.; Pigott, D.M.; Scarpino, S.V. The effect of human mobility and control measures on the COVID-19 epidemic in China. Science 2020, 368, 493–497. [Google Scholar] [CrossRef]
- European Centre for Disease Prevention and Control. 2020. Available online: https://www.ecdc.europa.eu/en/publications-data/download-todays-data-geographic-distribution-covid-19-cases-worldwide (accessed on 19 July 2020).
- Jacobsen, G.D.; Jacobsen, K.H. Statewide COVID-19 Stay-at-Home Orders and Population Mobility in the United States. World Med. Health Policy 2020, 12, 347–356. [Google Scholar] [CrossRef]
- Chinazzi, M.; Davis, J.T.; Ajelli, M.; Gioannini, C.; Litvinova, M.; Merler, S.; Vespignani, A. The effect of travel restrictions on the spread of the 2019 novel coronavirus (COVID-19) outbreak. Science 2020, 368, 395–400. [Google Scholar] [CrossRef] [PubMed]
- Campisi, T.; Basbas, S.; Skoufas, A.; Akgün, N.; Ticali, D.; Tesoriere, G. The Impact of COVID-19 Pandemic on the Resilience of Sustainable Mobility in Sicily. Sustainability 2020, 12, 8829. [Google Scholar] [CrossRef]
- Cheshmehzangi, A. COVID-19 and the small Commonwealth Oceania countries: Promising regional co-ordination. Round Table 2020, 109, 466–467. [Google Scholar] [CrossRef]
- COVID-19 Europe Maps. COVID-19 Projections Using Machine Learning. 2020. Available online: https://covid19-projections.com/maps-europe/ (accessed on 30 August 2020).
- Montacute, R. Social Mobility and Covid-19. Implications of the Covid-19 Crisis for Educational Inequality; The Sutton Trust: London, UK, 2020. [Google Scholar]
- Dahlberg, M.; Edin, P.A.; Grönqvist, E.; Lyhagen, J.; Östh, J.; Siretskiy, A.; Toger, M. Effects of the COVID-19 pandemic on population mobility under mild policies: Causal evidence from Sweden. arXiv 2020, arXiv:2004.09087. [Google Scholar]
- Worldometers.info. Coronavirus Graphs: Worldwide Cases and Deaths—Worldometer. 2020. Available online: https://www.worldometers.info/coronavirus/worldwide-graphs/ (accessed on 27 August 2020).
- Who.int. 2020. Available online: https://www.who.int/docs/default-source/coronaviruse/situation-reports/20200402-sitrep-73-Covid-19.pdf (accessed on 26 August 2020).
- Yang, Z.; Zeng, Z.; Wang, K.; Wong, S.; Liang, W.; Zanin, M.; Liu, P.; Cao, X.; Gao, Z.; Mai, Z.; et al. Modified SEIR and AI prediction of the epidemics trend of COVID-19 in China under public interventions. J. Thorac. Dis. 2020, 12, 165–174. [Google Scholar] [CrossRef] [PubMed]
- Who.int. Coronavirus Disease (COVID-19) Situation Reports. 2020. Available online: https://www.who.int/emergencies/diseases/novel-coronavirus-2019/situation-reports (accessed on 26 August 2020).
- Carassava, A. 2020. Available online: https://www.thetimes.co.uk/article/greeks-rein-in-rebellious-streak-as-draconian-measures-earn-them-a-reprieve-tznc0bn6s (accessed on 29 August 2020).
- Tremlett, G. How Did Spain Get Its Coronavirus Response So Wrong? 2020. Available online: https://www.theguardian.com/world/2020/mar/26/spain-coronavirus-response-analysis (accessed on 29 August 2020).
- Sierra, M. In Daily News Conference. 30 March 2020. Available online: https://www.reuters.com/article/us-health-coronavirus-spain-official-idUSKBN21H1ER (accessed on 29 August 2020).
- Yu, S. Spotlight: Greece’s new COVID-19 cases drop below 10 per day, but challenge remains. Xinhua 2020. Available online: http://www.xinhuanet.com/english/2020-04/23/c_139001650.htm (accessed on 26 August 2020).
- Ec.europa.eu. 2020. Available online: https://ec.europa.eu/eurostat/databrowser/view/tps00046/default/bar?lang=en (accessed on 26 August 2020).
- Worldometers.info. Reported Cases and Deaths by Country or Territory. 2021. Available online: https://www.worldometers.info/coronavirus/#countries (accessed on 26 January 2021).
- Epistat—COVID-19 Belgian Dashboard. Available online: https://epistat.wiv-isp.be/covid/covid-19.html (accessed on 28 April 2021).
- Wei, Y.; Wei, L.; Liu, Y.; Huang, L.; Shen, S.; Zhang, R.; Chen, J.; Zhao, Y.; Shen, H.; Chen, F. A systematic review and Meta-analysis reveals long and dispersive incubation period of COVID-19. medRxiv 2020. [Google Scholar] [CrossRef]
- Geng, H.; Xu, A.; Wang, X.; Zhang, Y.; Yin, X.; Mao, M.A. Analysis of the role of current prevention and control measures in the epidemic of new coronavirus based on SEIR model. J. Jinan Univ. Nat. Sci. Med. Ed. 2020, 41, 1–7. [Google Scholar]
- Pullano, G.; Valdano, E.; Scarpa, N.; Rubrichi, S.; Colizza, V. Evaluating the effect of demographic factors, socioeconomic factors, and risk aversion on mobility during the COVID-19 epidemic in France under lockdown: A population-based study. Lancet Dig. Health 2020, 2, e638–e649. [Google Scholar] [CrossRef]
- Sharifi, A.; Khavarian-Garmsir, A.R. The COVID-19 pandemic: Impacts on cities and major lessons for urban planning, design, and management. Sci. Total Environ. 2020, 142391. [Google Scholar] [CrossRef]
- Su, Z.; Wen, J.; McDonnell, D.; Goh, E.; Li, X.; Šegalo, S.; Ahmad, J.; Cheshmehzangi, A.; Xiang, Y.T. Vaccines are not yet a silver bullet: The imperative of continued communication about the importance of COVID-19 safety measures. Brain Behav. Immun. Health 2021, 100204. [Google Scholar] [CrossRef] [PubMed]
- Acuto, M. COVID-19: Lessons for an Urban(izing) World. One Earth 2020, 2, 317–319. [Google Scholar] [CrossRef]
- Coker, R.; Hunter, B.; Rudge, J.; Liverani, M.; Hanvoravongchai, P. Emerging infectious diseases in southeast Asia: Regional challenges to control. Lancet 2011, 377, 599–609. [Google Scholar] [CrossRef]
- Connolly, C.; Keil, R.; Ali, S.H. Extended urbanisation and the spatialities of infectious disease: Demographic change, infrastructure and governance. Urban Stud. 2020. [Google Scholar] [CrossRef]
- Atalan, A. Is the lockdown important to prevent the COVID-9 pandemic? Effects on psychology, environment and economy-perspecyive. Annal. Med. Surg. 2020, 56, 38–42. [Google Scholar] [CrossRef] [PubMed]
- Turoń, K.; Kubik, A.; Chen, F. Electric Shared Mobility Services during the Pandemic: Modeling Aspects of Transportation. Energies 2021, 14, 2622. [Google Scholar] [CrossRef]
- Shah, N.H.H.; Suthar, A.H.H.; Jayswal, E.N.N.; Sikarwar, A. Fractional SIR-Model for Estimating Transmission Dynamics of COVID-19 in India. Multidiscipl. Sci. J. 2021, 4, 8. [Google Scholar] [CrossRef]
- Herrera, M.; Godoy-Faúndez, A. Exploring the Roles of Local Mobility Patterns, Socioeconomic Conditions, and Lockdown Policies in Shaping the Patterns of COVID-19 Spread. Future Internet 2021, 13, 112. [Google Scholar] [CrossRef]
- Cartenì, A.; Cascetta, F.; Di Francesco, L.; Palermo, F. Particulate Matter Short-Term Exposition, Mobility Trips and COVID-19 Diffusion: A Correlation Analyses for the Italian Case Study at Urban Scale. Sustainability 2021, 13, 4553. [Google Scholar] [CrossRef]
- Pérez-Arnal, R.; Conesa, D.; Alvarez-Napagao, S.; Suzumura, T.; Català, M.; Alvarez-Lacalle, E.; Garcia-Gasulla, D. Comparative Analysis of Geolocation Information through Mobile-Devices under Different COVID-19 Mobility Restriction Patterns in Spain. ISPRS Int. J. Geo Inf. 2021, 10, 73. [Google Scholar] [CrossRef]
- Chen, Y.; Qin, R.; Zhang, G.; Albanwan, H. Spatial Temporal Analysis of Traffic Patterns during the COVID-19 Epidemic by Vehicle Detection Using Planet Remote-Sensing Satellite Images. Remote Sens. 2021, 13, 208. [Google Scholar] [CrossRef]
- Munir, S.; Coskuner, G.; Jassim, M.S.; Aina, Y.A.; Ali, A.; Mayfield, M. Changes in Air Quality Associated with Mobility Trends and Meteorological Conditions during COVID-19 Lockdown in Northern England, UK. Atmosphere 2021, 12, 504. [Google Scholar] [CrossRef]
- Villa, R.; Monzón, A. Mobility Restrictions and E-Commerce: Holistic Balance in Madrid Centre during COVID-19 Lockdown. Economies 2021, 9, 57. [Google Scholar] [CrossRef]
- Spassiani, I.; Sebastiani, G.; Palù, G. Spatiotemporal Analysis of COVID-19 Incidence Data. Viruses 2021, 13, 463. [Google Scholar] [CrossRef] [PubMed]
- Skirienė, A.F.; Stasiškienė, Ž. COVID-19 and Air Pollution: Measuring Pandemic Impact to Air Quality in Five European Countries. Atmosphere 2021, 12, 290. [Google Scholar] [CrossRef]
- Cheshmehzangi, A. COVID-19 and household energy implications: What are the main impacts on energy use? Heliyon 2020, 6, e05202. [Google Scholar] [CrossRef] [PubMed]
- Munawar, H.S.; Khan, S.I.; Qadir, Z.; Kouzani, A.Z.; Mahmud, M.A.P. Insight into the Impact of COVID-19 on Australian Transportation Sector: An Economic and Community-Based Perspective. Sustainability 2021, 13, 1276. [Google Scholar] [CrossRef]
- Cheshmehzangi, A. Revisiting the built environment: 10 potential development changes and paradigm shifts due to COVID-19. J. Urban Manag. 2021, in press. [Google Scholar] [CrossRef]
- Mahase, E. Covid-19: What have we learnt about the new variant in the UK? BMJ 2020, 371, m4944. [Google Scholar] [CrossRef]
- Reardon, S. The U.K. Coronavirus Mutation Is Worrying but Not Terrifying. 2020. Available online: https://www.scientificamerican.com/article/the-u-k-coronavirus-mutation-is-worrying-but-not-terrifying/ (accessed on 21 October 2020).
- Su, Z.; Wen, J.; Abbas, J.; McDonnell, D.; Cheshmehzangi, A.; Li, X.; Ahmad, J.; Šegalo, S.; Maestro, D.; Cai, Y. A race for a better understanding of COVID-19 vaccine non-adopters. Brain Behav. Immun. Health 2020, 9, 100159. [Google Scholar] [CrossRef] [PubMed]
- Zimmer, C. The Virus Variant Spreading in Britain May Make Vaccines Less Effective. 2020. Available online: https://www.nytimes.com/2021/02/01/health/covid-variants.html#:~:text=A%20fast%2Dspreading%20coronavirus%20variant,Health%20England%20reported%20on%20Monday (accessed on 4 October 2020).
- Lewis, D. COVID-19 rarely spreads through surfaces. So why are we still deep cleaning? Nature 2021, 590, 26–28. [Google Scholar] [CrossRef] [PubMed]
- Ghel, J. Public Space and Public Life during COVID 19. 2020. Available online: https://covid19.gehlpeople.com/ (accessed on 28 December 2020).
- Kai, D.; Goldstein, G.P.; Morgunov, A.; Nangalia, V.; Rotkirch, A. Universal masking is urgent in the covid-19 pandemic: Seir and agent based models, empirical validation, policy recommendations. arXiv 2020, arXiv:2004.13553. [Google Scholar]
- Gostin Lawrence, O.; Wiley Lindsay, F. Governmental Public Health Powers During the COVID-19 Pandemi Stay-At-Home Orders, Business Closures, and Travel Restrictions. JAMA 2020, 323, 2137–2138. [Google Scholar] [CrossRef] [PubMed]


Publisher’s Note: MDPI stays neutral with regard to jurisdictional claims in published maps and institutional affiliations. |
© 2021 by the authors. Licensee MDPI, Basel, Switzerland. This article is an open access article distributed under the terms and conditions of the Creative Commons Attribution (CC BY) license (https://creativecommons.org/licenses/by/4.0/).