Abstract
As one of the main grain-producing areas in China, urban agglomeration in the middle reaches of the Yangtze River plays an important role in the development of agricultural production for China’s grain supply. The existing studies about agricultural production efficiency lack of regional coordination analysis at both macro and micro levels, and only few studies consider the impact of agricultural production environment pollution and other undesirable outputs. Based on the input–output index system of agricultural green production, Slacks-based model (SBM) was adopted to measure the agricultural green production efficiency of 31 prefecture level cities in the middle reaches of the Yangtze River from 2008 to 2018, and the Tobit model of panel fixed effect was used to analyze the driving effect of external factors that affect the agricultural green production efficiency of urban agglomeration in the middle reaches of the Yangtze River. At the same time, the research methods at both macro and micro levels provide ideas for the research of transregional production efficiency. The results showed that: (1) the agricultural green production efficiency of urban agglomeration in the middle reaches of the Yangtze river is relatively low, with 2009 and 2013 as the inflection points, showing a stable trend of rise and decline; (2) The green agricultural production efficiency of urban agglomeration in the middle reaches of the Yangtze River presents the spatial distribution characteristics of “high in the west and low in the east”. The regional efficiency difference is obvious, the gap gradually expands, develops from the equilibrium to the polarization; (3) Urbanization development and government intervention has a significant restraining effect on the improvement of agricultural green production efficiency, and opening to the outside world produces a remarkable influence on the improvement of agricultural green production efficiency, however, economic development and industrial structure have little impact on the improvement of agricultural green production efficiency. Therefore, it is necessary to increase investment in technological innovation, promote agricultural transformation and upgrading, promote rational factors allocation and promote coordinated development of agriculture based on regional production differences.
1. Introduction
The State Council of China approved the implementation of “Development plan of urban agglomerations in the middle reaches of the Yangtze River” in April of 2015 [1], and the urban agglomerations in the middle reaches of the Yangtze River was officially positioned as a new growth pole for China economic development, which made great contribution to promoting the development of China’s economy in a stable and coordinated direction. Meanwhile, as an important agricultural production area, the middle reaches of the Yangtze River plays an important role in ensuring China’s food security [2]. However, compared with the rapid economic growth in recent years, the agricultural development in this region is rather weak, there exists massive loss of rural labor force and the encroachment of urban development and construction on agricultural land [3]. Taking the secondary urban agglomeration in the middle reaches of the Yangtze River, that is, the urban agglomeration around Changsha-Zhutan, as an example, the rural labor force decreased by about 188,000 and the total cultivated land resources decreased by about 4300 hectares in 2018. The massive loss of agricultural production factors has threatened the stability of the production of the regional agriculture, which is detrimental to the food security of China [4]. By studying the agricultural green production efficiency and its driving factors, this paper aimed to promote the improvement of regional agricultural production efficiency, improve the quality and efficiency of agricultural economic growth in urban agglomerates in the middle reaches of the Yangtze River, to realize the green development of agriculture in urban agglomerates in the middle reaches of the Yangtze River, and, thus, guarantee China’s food security.
For the level of agricultural production efficiency, it has been analyzed qualitatively and quantitatively by building an evaluation index system. Sun studied the quantitative evaluation index system for the level of agricultural development in China. The study pointed that the evaluation index system for the level of agricultural production and development should reflect the coordination of economy and ecology [5]. This paper put forward a set of evaluation index system and the evaluation method is applicable to the green development of agriculture in different regions of the country, but it can only make an overall evaluation of the green development of agriculture, and experts should be invited to determine the weight, and the analysis and evaluation process is relatively complex. After that, Gong developed an evaluation index system with low-carbon production, economic growth, and safety supply as dimensions to analyze and evaluate the level of China’s agricultural development [6]. They also mentioned some relevant suggestions from the perspectives of optimizing land use and promoting the reform of agricultural production market. It can quantitatively evaluate the level of agricultural green development in China and analyze the status quo and weaknesses of agricultural green development. However, the constructed conventional evaluation index system can only evaluate the overall situation. In addition, it cannot well reflect the actual input–output efficiency of regional agricultural production. Therefore, the Data Envelopment Analysis model (DEA) has been gradually applied to the research of agricultural production efficiency [7]. The DEA model was formally proposed by Charnes, then Restuccia and Vollrath used this model to study the agricultural green production efficiency of many countries in the world [8,9,10]. After that, Ruttan went further to measure the regional agricultural production efficiency under the constraints of environment, resources, technological innovation, and other factors [11]. In recent years, many researchers have introduced the DEA model into the measurement of the domestic agricultural production efficiency. Li used this method to measure China’s interprovincial agricultural total factor productivity, and proposed policies from the perspective of spatial heterogeneity [12]. Xing used the Tobit model to further discuss its influencing factors on the basis of the efficiency measurement [13]. The DEA model is divided into radial and nonradial models. Traditional radial models tend to underestimate the directional distance function of the model when evaluating the input–output efficiency of agricultural production, which is not conductive to reflecting the actual efficiency of each decision-making unit [14]. In order to overcome this problem, the nonradial data envelopment model is gradually applied in the evaluation of agricultural green production efficiency. Li used this method to study the green production efficiency of county agriculture in the Hebei Province [15], and Guo further used the FGLS model to analyze the influencing factors while evaluating the agricultural production efficiency of Heilongjiang reclamation area [16].
The most commonly used methods to measure the efficiency of agricultural green production are data envelopment analysis (DEA) and stochastic frontier analysis (SFA). Compared with the SFA model, the nonparametric DEA model can effectively deal with the problems of multiple inputs and multiple outputs [17]. However, the traditional radial DEA model may overestimate the efficiency of the evaluation unit when the input is too much or the output is insufficient, and the angle DEA method cannot consider input and output at the same time, which may result in efficiency inconsistent with reality. In order to overcome this deficiency, Tone proposed that SBM model could solve nonradial and non-angle problems in 2001 [18]. It analyzes efficiency from two perspectives to obtain more accurate efficiency measurement, which has been widely recognized by the academic community. Deng used the SBM model to estimate the water efficiency of 31 provinces and cities in China from 2004 to 2013 [19]. Cheng used SBM model to calculate the Total-Factor Energy Efficiency (TFEE) of each prefecture-level city of three northeastern provinces with and without considering undesired output [20] and Shang also used the SBM model to measure the total factor energy efficiency of eight economic regions in China [21].
At present, there are many studies on agricultural production efficiency in China, but there are still the following shortcomings: firstly, the existing research on the green production efficiency of agricultural production is mostly concentrated on the national or provincial level to large extent, and the practical guiding significance of conclusions and recommendations has certain limitations. Secondly, research that is based on the micro level of the city is relatively lacking, and a majority of them are limited to a specific region, lacking cross-regional coordination analysis. In addition, the existing evaluation of agricultural green production efficiency mainly considers production factors such as capital, labor, and land [22], lacking the consideration of undesired output such as environmental pollution in agricultural production, which leads to that the efficiency level is not conductive to reflecting the real agricultural green production efficiency of the region. This paper aims to fill those gaps from the following aspects: (1) this paper focuses on using the relevant knowledge of the undesired output SBM model and Tobit model to measure, meanwhile, using the relevant knowledge of agricultural carbon emissions to build an agricultural green production efficiency evaluation system. (2) This paper took both the macro and micro levels into account and used the undesirable output SBM model to study the agricultural green production efficiency of 31 prefecture-level cities in the middle reaches of the Yangtze River from 2008 to 2018. (3) This paper applied the panel fixed effect Tobit model to analyze and discuss the driving effects of external factors that affect the agricultural green production efficiency of the urban agglomeration in the middle reaches of the Yangtze River [23], which could provide new ideas for improving the efficiency of agricultural green production of urban agglomeration in the middle reaches of the Yangtze River, and can also guide the transformation and upgrading of regional agricultural production [24].
2. Methodology
2.1. Agricultural Green Production Efficiency Measurement Model
Assuming that the input of each decision-making unit is m, expected output is s1, and unexpected output is s2, the matrix form can be expressed as: , , and , while , and . Thus, the production possibility P of the decision-making unit can be expressed as:
where, is intensity vector. In order to assign the weight to each observation value when constructing the production set, the return to scale is assumed to be constant since no constraint is imposed on its sum. To make the efficiency of the decision-making unit () reach the optimal frontier under the condition of undesired output, its input and output items need to meet the following conditions: , , , and . Based on this, the unexpected output SBM model developed in this paper is as follows:
where vector and indicates the excess amount of input items and unexpected output items of the decision-making unit, respectively. is insufficient amount of expected output of decision-making unit, while . Under the condition of unexpected output, when the conditions of ,, , and are met simultaneously, the production efficiency of the decision-making unit reaches the optimal frontier. When , the optimal frontier has not been reached. At this time, the input–output structure of the decision-making unit can be optimized to improve its own production efficiency [25].
2.2. Analysis Model of External Driving Factors of Agricultural Green Production Efficiency
Since the agricultural green production efficiency value calculation in this paper is truncated data with a value of 0–1, if the efficiency value measured by the undesired output SBM model is directly used as a regression explanatory variable to establish a least squares model, a consistent estimator may not be obtained [26]. Hence, it is more appropriate to utilize the Tobit model that is suitable for the cut value or segment value of the dependent variable when studying the green production efficiency of agriculture to conduct empirical testing of its external driving factors [27].
The Tobit model is a censored model in which the dependent variable satisfies certain constraints, also called a review model, a restricted dependent variable model, etc. [28,29]. It is a restricted dependent variable estimation method proposed by Tobit in 1958, that is, the maximum likelihood estimation method is used to estimate sample restricted data. The Tobit model is different from discrete model or continuous variable model; the dependent variable in Tobit model is restricted variable. The construction of the Tobit model in this paper is shown in formula 4, where is dependent variable vector with censored data at 0. is independent variable vector. is coefficient vector. is an error term.
Before using the panel data, we need to further test the data, using f-value test, Hausmann test, and other methods to determine whether the model should apply random effect, mixed effect, or fixed effect. So, before panel regression, this paper first tested the mixed effects and fixed effects models, the results showed that the hypothesis of the mixed effects model was strongly rejected. After that, the Hausman test was used to test the fixed effects and random effects models, and the fixed effects model was finally selected to perform the Tobit panel regression. The concrete construction of Tobit model is shown in formula 5, where is the agricultural green production efficiency value of city in the middle reaches of the Yangtze River in year . is a constant term. is the per capita GDP (ten thousand yuan of city in year . isthe urbanization rate (%) of city in year . is the amount of foreign capital (100 million US dollars) actually utilized by city in year . is the proportion of the secondary industry in city in year . is the proportion of the tertiary industry in city in year . is the expenditure (100 million yuan) on agriculture, forestry and water affairs in city in year . are the estimated coefficient of related variables. is the random error term of the model.
2.3. Index Selection and Data Sources
2.3.1. Explanation of Agricultural Green Production Efficiency Evaluation System
Scholars have made relevant studies on the selection of input–output indicators in the field of agriculture. Some scholars have selected crop acreage, agricultural fertilizer use, and total power of agricultural machinery as input variables, and selected total agricultural output value and total grain output value as output variables [30]. Some other scholars added agricultural film, agricultural chemicals, agricultural water resources, and other indicators as input variables, while considering nonpoint source pollution and carbon dioxide as two undesirable outputs [31]. Based on the comprehensive comparison of the index system constructed by existing research institutes, this article fully considers the availability of data, the labor input in agriculture, forestry, animal husbandry and fishery (unit in 10,000 people), effective irrigation area (unit in 1000 hectares), and the amount of agricultural fertilizer used (converted to scalar, unit in 10,000 tons), the degree of agricultural electrification (rural electricity consumption, unit in 10,000 kWh) are selected as input variables, the total agricultural output value of each city is taken as the expected output variable, and agricultural carbon emissions (unit in tons) is used as the undesired output variable [24].
Due to the diversification and complexity of agricultural carbon emission sources, this paper combined the selection of input indicators when measuring agricultural carbon emissions in each city, and calculated the carbon emissions directly produced by three types of factors: agricultural farming and irrigation, agricultural fertilizer use, and agricultural electrification with reference to Li [15]. The equation for calculating the total agricultural carbon emissions developed in this work is shown in Formula (6), where is the total carbon emission from production. represents the carbon emissions of the th carbon source in city . represents the input amount of the th carbon source in city . represents the carbon emission factor of the th carbon source [32]. The carbon emission coefficients of various carbon sources are shown in Table 1. To facilitate analysis, CO2 and N2O are unified converted into standard carbon [33].

Table 1.
Main carbon source carbon emission factor.
2.3.2. Explanation of External Driving Factors of Agricultural Green Production Efficiency
Based on the availability of data and related literature, this paper assumes that the external driving factors for the agricultural green production efficiency of the urban agglomeration in the middle reaches of the Yangtze River are mainly concentrated in the following five aspects:
- (1)
- Economic development factors. The level of economic development will affect the industrial structure, technological innovation and application as well as the intensity of environmental protection of a region, and further affect the agricultural green production efficiency of the region [36].
- (2)
- Urbanization development. In the process of urbanization, agricultural land is often transferred to urban construction land, agricultural resources such as farmland are gradually reduced during this process. In the same time, people tend to use agricultural science and technology for agricultural production, which will pose impact on the regional agricultural green production efficiency [37].
- (3)
- Opening up. The amount of foreign capital actually utilized by each city is used to measure the level of city’s opening up. With the deepening of reform and opening up, the utilization of foreign capital in China has shown an upward trend year by year. Agriculture, as one of the earliest industries in China to utilize foreign capital, is a key area of foreign investment. The involvement of foreign capital will affect the input elements of agricultural production technology and management, which is also an important factor affecting the green production efficiency of regional agriculture [38]. On the other hand, opening to the outside world has accelerated the domestic and foreign trade exchanges, and frequent trade is also one of the reasons to promote the development of green production in agriculture.
- (4)
- Industrial structure. In this paper, the proportion of the secondary industry and the proportion of the tertiary industry represents the regional industrial structure factors. A great many of the existing studies believe that industrial structure is an important factor affecting resource utilization. Studies have shown that the industrial structure has a negative impact on the efficiency of resource utilization, and the optimization of industrial structure will improve the allocation of labor and capital [39,40]. Due to the lack of technology and the neglect of the industrial sector on pollution control, it is difficult for the sewage sector to eradicate industrial pollution [41]. The regional industrial development stage and development mode, whether it is the type of high-water-consuming and high-pollution industry, all affect the green production efficiency of regional agriculture. The tertiary industry is closely related to the level of perfection of the regional market mechanism, its activity will have some impact on the green production efficiency of regional agriculture.
- (5)
- Government influence. The government’s expenditure budget for agriculture, forestry and water is used to measure the influence of regional governments. The government’s investment in the construction of agricultural infrastructure, the guidance of industrial transformation, the extension of science and technology, and related environmental policies all play an important role in the green production efficiency of regional agriculture [42,43,44,45].
2.3.3. Data Source Description
This paper takes 31 cities in the “Development Plan for Urban Agglomerations in the Middle Reaches of the Yangtze River” as the research objects, which can also be divided into three suburban agglomerations: (1) Wuhan City Circle: Wuhan, Huangshi, Jingzhou, Yichang, Xiangyang, Ezhou, Jingmen, Xiaogan, Huanggang, Xianning, Xiantao, Tianmen, and Qianjiang; (2) Changsha-Zhutan City Group: Changsha, Zhuzhou, Xiangtan, Hengyang, Yueyang, Changde, Yiyang, and Loudi; (3) City Group around Poyang Lake: Nanchang, Jingdezhen, Pingxiang, Jiujiang, Xinyu, Yingtan, Ji′an, Yichun, Fuzhou, and Shangrao, as shown in Figure 1 and Figure 2. Data on input–output variables and external factors affecting agricultural production in this work are derived from the 2009–2019 “Statistical Yearbook of Hubei Province”, “Statistical Yearbook of Hunan Province”, “Statistical Yearbook of Jiangxi Province”, and statistical yearbooks and statistical bulletins of each city. For individual missing data, the quadratic exponential smoothing method is implemented to supplement to eliminate the failure of model operation caused by the 0 value in the original data [46].
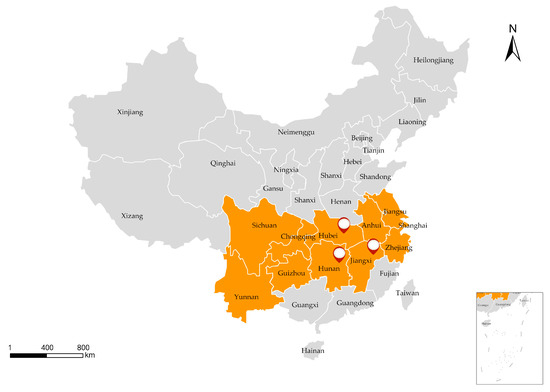
Figure 1.
Schematic diagram of 11 provinces and cities of the Yangtze River Economic Belt.
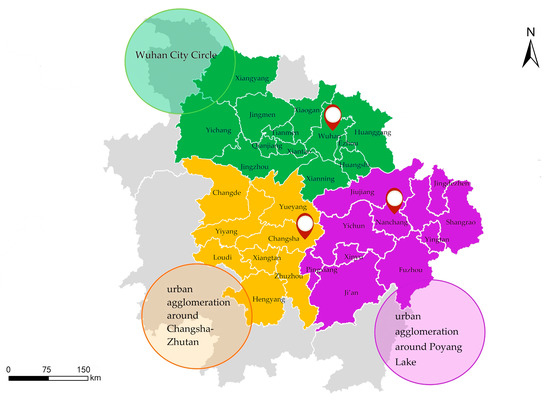
Figure 2.
Schematic diagram of city clusters in the middle Reaches of the Yangtze River.
3. Empirical Results and Analysis
3.1. Temporal and Spatial Distribution Characteristics of Agricultural Green Production Efficiency
3.1.1. Time Evolution Characteristics of Agricultural Green Production Efficiency
Based on the undesirable output SBM model developed in this paper, the measurement results of the agricultural green production efficiency value and time change characteristics of the urban agglomeration in the middle reaches of the Yangtze River are shown in Figure 3.
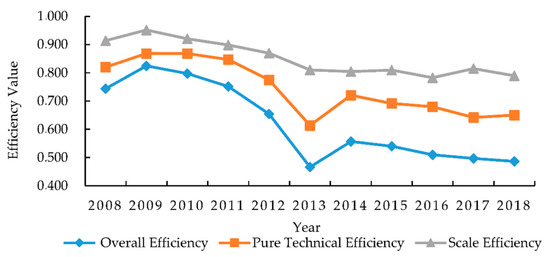
Figure 3.
Decomposition of agricultural green production efficiency and time characteristics of urban agglomeration in the middle reaches of the Yangtze River.
From 2008 to 2018, the average green production efficiency of agricultural in the urban agglomeration in the middle reaches of the Yangtze River showed an upward-decreasing-steady trend. The agricultural green production efficiency dropped from 0.744 to 0.487 in 2018, which is a significant decrease. The first turning point occurred in 2009, the agricultural green production efficiency of the urban agglomeration in the middle reaches of the Yangtze River reached the highest point, at 0.825, and then decreased year by year. The second turning point occurred in 2013, when the green production efficiency of agricultural fell to a relatively low point of 0.466. The H7N9 influenza epidemic in 2013 has brought unprecedented impact to the poultry industry. China′s poultry farming industry is an important part for the agricultural production. Since the outbreak of avian flu, poultry sales have dropped significantly in various regions, there was a large backlog in the market so the product prices dropped simultaneously [47]. A large number of farmers had suffered heavy losses and lost confidence in the market, thus, reducing the scale of production, and a series of agricultural production vibrations and chain reactions caused by the epidemic have restricted the green production efficiency of agriculture, and finally led to a sharp drop in agricultural production efficiency in 2013. After 2013, the agricultural production efficiency of the urban agglomeration in the middle reaches of the Yangtze River has shown a relatively stable development trend, but still faces downward pressure.
In general, the average agricultural green production efficiency level of the city clusters in the middle reaches of the Yangtze River from 2008 to 2018 is 0.621, the overall level is not high. The average level of scale efficiency is 0.851, and the average level of pure technical efficiency is 0.743, indicating that the input scale of production factors such as agricultural land in the middle reaches of the Yangtze River is relatively reasonable. Overall, it has a good agricultural production scale, but at the same time, its pure technical efficiency level is relatively low, the output under the same factor input is relatively insufficient, and there is a phenomenon of inefficient use of factor resources, which has become the main factor restricting the improvement of the overall efficiency of regional agricultural green production.
Therefore, the adjustment of agricultural production in the urban agglomeration in the middle reaches of the Yangtze River should be oriented towards improving technical efficiency and technological progress. On the basis of the existing scale of production, strengthen the reasonable planning of agricultural production factor input, guide the rational allocation of resource elements, reduce the invalid input of production factors, and promote the improvement of agricultural production technology efficiency. At the same time, make efforts to promote the transformation and upgrading of the agricultural industry, actively promote the popularization and application of high-efficiency agricultural production technology and management models, strengthen the leading and supporting role of science and technology in the development of agricultural production, and help the overall technological progress of regional agricultural production.
3.1.2. The Spatial Distribution of Agricultural Green Production Efficiency
The agricultural green production efficiency of the urban agglomeration in the middle reaches of the Yangtze River presents a distribution of “high in the west and low in the east”. The agricultural green production efficiency of the urban agglomeration in the middle reaches of the Yangtze River decreased from the west to the east. As shown in Figure 4, the average green production efficiency level of agricultural in the Wuhan urban agglomeration is the highest of 0.747, followed by the average green production efficiency level of the urban agglomeration around Changsha-Zhutan of 0.567, and the average green production efficiency level of agriculture in the urban agglomeration around Poyang Lake is the lowest of 0.499. The changes in the average green production efficiency level of agriculture in the three suburban clusters are roughly the same, showing an overall downward trend. Whereas the agricultural production scale efficiency difference of the three major urban agglomerations is relatively small and the change trend is relatively stable, all fluctuating at a relatively high level of about 0.800. This leads to changes in the agricultural green production efficiency of urban agglomerations mainly from the pure technical efficiency changes of agricultural production. Closely related to the level of regional economic development or the stage of regional agricultural development, the Wuhan city circle has a developed economy, a complete crop trading market mechanism, early transformation of agricultural modernization, and intensive development of agricultural resources, which has made high-efficiency agricultural production and management models such as water-saving agriculture widely promoted, and makes the efficiency of agricultural green production relatively high [48]. However, the economic development level of the city cluster around Poyang Lake is relatively low, and the construction of agricultural infrastructure is relatively backward. The limited promotion of new agricultural production technologies is not conducive to the improvement of agricultural green production efficiency [49].
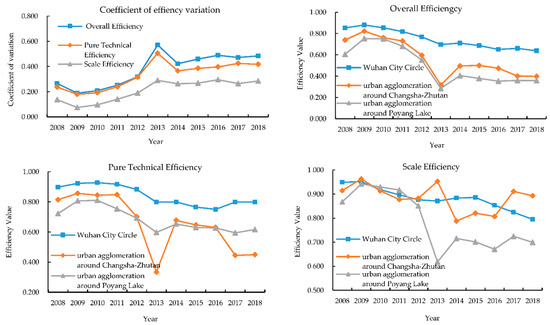
Figure 4.
The coefficient of variation and efficiency decomposition of agricultural green production efficiency in urban agglomeration in the middle reaches of the Yangtze.
With reference to Zhu [50], as shown in Figure 3, the comprehensive efficiency of agricultural green production in the urban agglomeration in the middle reaches of the Yangtze River was clustered by using ArcGIS into high efficiency level (0.8 < E ≤ 1), medium and high efficiency level (0.6 < E ≤ 0.8), medium low efficiency level (0.4 < E ≤ 0.6) and low efficiency level (0.4 ≤ E) and visually displayed. The temporal and spatial evolution of efficiency is shown in Figure 5. From the micro level, the cities with higher agricultural green production efficiency are mainly concentrated in the Wuhan urban circle. Among them, Wuhan, Yichang, Xianning, and other places have relatively high agricultural green production efficiency, always maintaining a high efficiency level above 0.9, with a high efficiency “continuation effect” in agricultural green production [51]. Moreover, the low-efficiency cities in agricultural production are mainly concentrated in the urban agglomeration around Changsha-Zhutan and the urban agglomeration around Poyang Lake. The agricultural green production efficiency of most cities in this area is at a low efficiency level of around 0.4. The agricultural green production efficiency of Jiujiang City and Shangrao City has been maintained at a low level of around 0.25 since 2013, and there are serious agricultural production inefficiencies. In 2007, Wuhan Urban circle was approved by the State Council as a national comprehensive reform experimental area for building a resource-conserving and environment-friendly society. The overall competitiveness of Wuhan city circle has been greatly improved, and agricultural added value has been significantly increased [52]. At the same time, Jiujiang, Xinyu, Ganzhou, Yichun, and other cities exist in different degrees of excess input, output insufficient phenomenon. As time goes by, high-efficiency areas for agricultural green production gradually gather in Wuhan city circle, and the area and distribution area of high-efficiency areas gradually decrease.
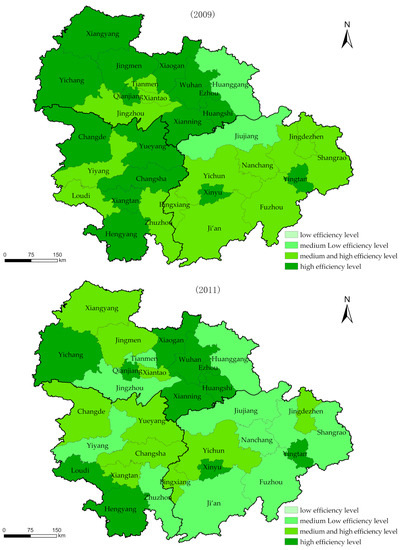
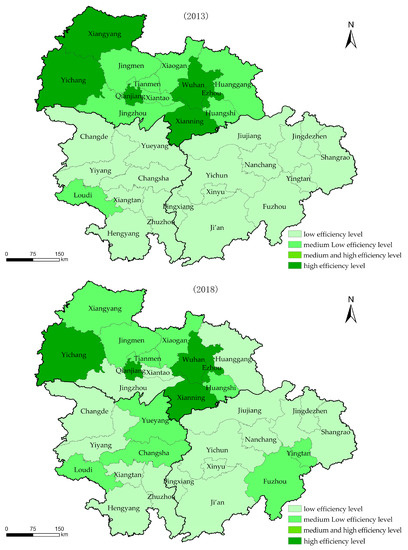
Figure 5.
Spatio-temporal evolution of agricultural green production efficiency in urban agglomeration in the middle reaches of the Yangtze River.
In view of the regional differences in the agricultural green production efficiency of the urban agglomeration in the middle reaches of the Yangtze River, it is necessary to formulate measures to improve the agricultural green production efficiency according to local conditions and avoid implementing a “one size fits all” policy. Specifically, the Wuhan city circle should aim to improve technical efficiency, further promote the rational allocation of production factors in the use of existing agricultural technology and avoid redundant input. The urban agglomerations around Changzhutan and Poyang Lake should be guided by the advancement of agricultural production technology, improve the original agricultural production organization model and apply high-efficiency agricultural production management techniques. At the same time, the agricultural green production efficiency of the urban agglomeration in the middle reaches of the Yangtze River shows a trend from equilibrium to polarization. In the future, cities should break down administrative barriers, break agricultural fragmentation and local protectionism, expand exchanges and cooperation in the field of high-efficiency agricultural production, and achieve advance sharing of agricultural production technology.
3.2. Analysis of External Driving Factors of Agricultural Green Production Efficiency
In order to explore the external factors that have impact on the green production efficiency of agriculture, based on data availability, this paper studied the agricultural green production efficiency and its influencing factors of 27 prefecture-level cities in the three suburban agglomerations in the middle reaches of the Yangtze River from 2008 to 2018 and Tobit panel regression analysis was conducted using Stata 15.1 software. The regression results are shown in Table 2 [53].
Table 2.
The panel fixed effect Tobit regression results of external driving factors of agricultural green production efficiency.
- (1)
- The impact of economic development on agricultural green production efficiency is not significant. Economic development has a certain promoting effect on the improvement of agricultural green production efficiency. As the economic development of the urban agglomeration in the middle reaches of the Yangtze River crossed the Lewis turning point, the endowment of agricultural factors has undergone tremendous changes. The phenomenon of machines replacing humans in agricultural production has become more and more common, which has promoted the improvement of agricultural green production efficiency [54]. Meanwhile, rapid economic development is often accompanied by the occupation of agricultural land and other resources, so that the supply of farmland and other agricultural production factor resources cannot be guaranteed [55].
- (2)
- The development of urbanization hinders the improvement of agricultural green production efficiency. The development of urbanization is mainly manifested in population urbanization and land urbanization. With the gradual advancement of population urbanization, a large number of rural young and middle-aged laborers are gradually moving to urban areas, making the direct labor force in rural areas appear “aging” and other characteristics, agricultural development is greatly affected, resulting in a decline in agricultural production efficiency, due to the loss of young and middle-aged labor force, the popularization of agricultural science and technology has become more difficult [56]. At the same time, in the process of land urbanization, a large amount of agricultural land and ecological land are gradually transformed into urban construction land, which hinders the improvement of the agricultural green production efficiency of the urban agglomeration in the middle reaches of the Yangtze River. This is similar to the research results of He [57], that the development of land urbanization is not conducive to the improvement of technical efficiency of grain production, economic urbanization will change the consumption pattern, thus, affecting the agricultural planting structure, and the discharge of industrial wastewater is not conducive to the improvement of technical efficiency of grain production.
- (3)
- Opening to the outside world promotes the improvement of agricultural green production efficiency. China’s integration into the global economy will lead to continued improvements in the green production efficiency of Chinese agriculture. Foreign capital entering the agricultural sector could provide a large amount of funds for production development. Because foreign capital is usually a collection of production factors such as management experience, marketing channels, and advanced technology, the technology spillover effect it brings will often provide more efficient production for agricultural development. It is beneficial for improving the original production organization and promoting the improvement of regional agricultural green production efficiency [58]. At the same time, the overall level of economic development and cultural education in the urban agglomeration in the middle reaches of the Yangtze River is relatively high. It would provide a think tank guarantee for the digestion and utilization of foreign capital technology spillovers, which also boosts the agricultural green production efficiency of the urban agglomeration.
- (4)
- The impact of industrial structure changes on agricultural green production efficiency is not significant. The industry in city clusters in the middle reaches of the Yangtze River accounts for the highest proportion among the three industries. The increase of investment in industrial development drives the demand for agricultural raw materials, and the feedback effect of industry is good. Industrial development indirectly drives the prosperity of agriculture. However, since China’s industry began to nurture agriculture at the beginning of the 21st century, compared with the first industrialized countries, China is also accompanied by the lag phenomenon of employment structure transformation and urbanization, the input of various industrial factors has no significant elastic effect on the growth of agricultural efficiency [59,60]. Similarly, due to problems in system and mechanism, regional differences, technology application, and other aspects, the coupling development between agriculture and service industry is faced with great difficulties. Therefore, the impact of the difference in industrial structure on the green production efficiency of regional agriculture is more uncertain and does not have significant impact [61].
- (5)
- Government intervention hinders the improvement of agricultural green production efficiency. China′s agricultural production is affected by factors such as complex natural conditions and the “small and weak” business entities, the resulting production are often more uncertain than other industries. In order to promote the development of agricultural production, the government often implements greater intervention and subsidies [62]. However, with the continuous development of the market economy, the improvement of agricultural production efficiency in the urban agglomerations in the middle reaches of the Yangtze River is more and more closed to price leverage. Excessive government subsidies will make agricultural development a strong dependence, inhibit the increase in production enthusiasm and even appear the vicious circle of rising production cost “floor” and upside down domestic and foreign agricultural product prices, which is not conducive to urban agglomerations to improve agricultural green production efficiency. This is generally consistent with the research conclusions of Liu and Li [63,64], that government intervention presents a changing trend of first promoting and then hindering the growth of agricultural green production efficiency, the marketization process of city clusters in the middle reaches of the Yangtze River is rapid, the coupling degree between government intervention and marketization process is low, which hinders the improvement of agricultural green production efficiency.
The regression results show that the development of urbanization has had a negative impact on the improvement of the agricultural green production efficiency of the urban agglomeration in the middle reaches of the Yangtze River. In the future, we need to encourage urban migrant workers to return to their hometowns to start their own businesses and reduce the loss of labor factors in the development of population urbanization through the promotion of weak labor and the cultivation of new labor. In the process of land urbanization, strict examination and approval of urban construction land should be carried out, efforts should be made to ensure the quality of cultivated land is balanced and reduce the loss of agricultural land production factors. At the same time, the urban agglomeration in the middle reaches of the Yangtze River should further increase the agricultural FDI support policies in the future, encourage and guide foreign capital into the agricultural industry, strengthen the training of new agricultural talents, promote the digestion and absorption of high-efficiency agricultural production technology and management experience, and continuously improve the market competitiveness of regional agricultural production in the context of openness [65]. The development of agriculture production in the urban agglomeration in the middle reaches of the Yangtze River should also promote the reform of agriculture industry management system, give full play to the fundamental role of market price levers and reduce the negative impact of excessive government intervention on the improvement of agricultural green production efficiency.
4. Conclusions
At present, domestic and foreign research conclusions on agricultural production efficiency are mainly concentrated on the national level, while this paper took into account both the macro and micro levels and measured the agricultural green production efficiency of 31 prefecture-level cities in the middle reaches of the Yangtze River from 2008 to 2018 based on the undesired output SBM model. This paper also used the panel fixed effect Tobit model to analyze the external driving factors that affect the agricultural green production efficiency of the urban agglomeration in the middle reaches of the Yangtze River. On this basis, the impact of urbanization, opening-up level and government intervention on the green production efficiency of agriculture are further discussed. The conclusions are listed below:
- (1)
- Agricultural green production efficiency is low and is mainly affected by the level of technical efficiency. The agricultural green production efficiency of the urban agglomeration in the middle reaches of the Yangtze River is relatively low. Taking 2009 and 2013 as the turning points, the agricultural green production efficiency has shown an upward-decreasing-stable phase trend. At the same time, the input scale of agricultural land and other factors of production is relatively reasonable, and the scale efficiency of agricultural green production is relatively good. The decline of agricultural green production efficiency mainly comes from the fluctuation of pure technical efficiency, and there is low efficiency in the utilization of factor resources. Pure technical efficiency is the key factor affecting the green production efficiency of agriculture.
- (2)
- Regional differences in agricultural green production efficiency is obvious and the gap is gradually increasing. The spatial distribution of agricultural green production efficiency in the urban agglomeration in the middle reaches of the Yangtze River presents the characteristics of “high in the west and low in the east”, with obvious differences in efficiency among regions and gradually increasing gaps. Due to the developed economy and improved crop trading market mechanism, Wuhan city circle underwent agricultural modernization transformation earlier, and the green agricultural production efficiency was higher than that of Changsha-Zhutan city group and the Poyang Lake city group, which had relatively low economic development level. At the same time, as time goes by, the high-efficiency areas of agricultural production gradually converge to the Wuhan city circle and have the “continuation effect” of high-efficiency agricultural production. The area and distribution of high-efficiency areas gradually decrease and develop from equilibrium to polarization.
- (3)
- The role of external drivers of agricultural green production efficiency is heterogeneous. The estimation results of the panel fixed effects Tobit model show that the driving effects of external factors influencing the agricultural green production efficiency of the urban agglomeration in the middle reaches of the Yangtze River are significantly different. The development of urbanization hinders the improvement of green production efficiency of agriculture. Among them, the gradual development of population urbanization makes a large number of rural young and middle-aged labor force gradually transferred to urban areas, leading to the decline of agricultural production efficiency. In the process of land urbanization, a large amount of agricultural and ecological land is gradually transformed into urban construction land, which hinders the improvement of agricultural green production efficiency in urban agglomeration in the middle reaches of the Yangtze River. At the same time, due to that excessive government subsidies can make agricultural development form strong dependence, inhibit the production enthusiasm, appear even agricultural production costs “floor” vicious cycle up and down prices for agricultural products at home and abroad, so the government intervention to promote the efficiency of urban agglomeration in the middle reach of Yangtze river green agricultural production also has significant inhibitory effect. On the other hand, the entry of foreign capital into the agricultural field provides a large amount of capital, management experience, marketing channels and advanced technologies for production development, and the technology spillover effect it brings is often conducive to improving the original production organization form and promoting the improvement of regional agricultural green production efficiency. Economic development plays a certain role in promoting the improvement of agricultural green production efficiency, but at the same time, rapid economic development is often accompanied by the occupation of agricultural land and other resources, and the supply of agricultural production factors such as farmland cannot be guaranteed. Therefore, economic development has no significant impact on agricultural green production efficiency. Similarly, due to problems in system and mechanism, regional differences, technology application and other aspects, the coupling development of agriculture and service industry is faced with great difficulties, and the impact of industrial structure differences on regional agricultural green production efficiency is highly uncertain and does not have significant impact.
Furthermore, the undesirable output SBM-Tobit method used in this article can not only be used in the field of agriculture, but can also be used to measure the green production efficiency and analyze its external driving factors in other industries. In addition, it can also be further applied to evaluate the efficiency of regional carbon emission, industrial energy, innovation efficiency, and so on. However, there are still some deficiencies in this paper. This study had carried on the beneficial exploration to the agricultural green production efficiency measurement, but there are many places that have not been considered and should be further explored and discussed in future research. Agricultural production depends on climatic conditions such as soil, water resources, and air temperature, while the geographical environment of adjacent areas is similar, so that agricultural production will show an obvious spatial correlation. On the other hand, agricultural labor force, technology, capital, and other factors display a spatial mobility, which will further strengthen the relationship between regional agricultural productions. Therefore, in the future research, not only the differences between regions should be analyzed, but also the correlation between regions should be considered, so as to provide more practical policy suggestions for improving regional agricultural production efficiency and promoting the coordinated development of regions.
Author Contributions
Conceptualization, L.W. and Z.Q.; Formal analysis, Q.P., Z.Q. and Y.X.; Resources, Y.X. and Q.P.; Writing—original draft preparation, L.W., Z.Q. and Y.X.; Writing—review & editing, L.W. and Y.S.; Investigation, L.W. and Y.X. All authors have read and agreed to the published version of the manuscript.
Funding
This research was supported by National Natural Science Foundation of China (41501126); the Fundamental Research Funds for the Central Universities (B200202233); Ministry of Education Humanities and Social Science Fund planning project (20YJA790052); the Ministry of Education of China: Grant-in-aid for Humanity and social Science Research (19YJAZH068); the National Training Program of Innovation and Entrepreneurship for Undergraduates (201910294101Z).
Conflicts of Interest
The authors declare no conflict of interest.
References
- Wang, J.; Luo, C. The outline of China’s regional coordinated development strategy in new era. Reform 2017, 12, 52–67. [Google Scholar]
- Wu, W.; Tang, H.; Yang, P.; You, L.; Zhou, Q.; Chen, Z.; Shibasaki, R. Scenario-based assessment of future food security. J. Geogr. Sci. 2011, 21, 3–17. [Google Scholar] [CrossRef]
- Wu, Q.; Ma, H.; Wu, L.; Lu, J. Spatial-temporal pattern evolution of agricultural economy of urban agglomeration in the middle reaches of the Yangtze River. Guangdong Agric. Sci. 2016, 43, 152–158,193. [Google Scholar] [CrossRef]
- Yin, P.; Fang, X.; Yun, Y. Regional differences of vulnerability of food security in China. J. Geogr. Sci. 2009, 19, 532. [Google Scholar] [CrossRef]
- Sun, W.; Wang, R.; Qian, J.; Shengnan, H. Study on connotation and evaluation of the agricultural green development. Chin. J. Agric. Resour. Reg. Plan. 2019, 40, 14–21. [Google Scholar] [CrossRef]
- Gong, Q.; Li, X. Construction and measurement of agricultural green development index: 2005–2018. Reform 2020, 311, 133–145. [Google Scholar]
- Sun, W.; Li, Y.; Wang, D.; Fan, J. The efficiencies and their changes of China’s resources-based cities employing DEA and Malmquist index models. J. Geogr. Sci. 2012, 22, 509–520. [Google Scholar] [CrossRef]
- Charnes, A.; Cooper, W.W.; Rhodes, E. Measuring the efficiency of decision making units. Eur. J. Oper. Res. 1978, 2, 429–444. [Google Scholar] [CrossRef]
- Restuccia, D.; Yang, D.T.; Zhu, X. Agriculture and aggregate productivity: A quantitative cross-country analysis. J. Monet. Econ. 2008, 55, 234–250. [Google Scholar] [CrossRef]
- Vollrath, D. Land distribution and international agricultural productivity. Am. J. Agric. Econ. 2007, 89, 202–216. [Google Scholar] [CrossRef]
- Ruttan, V.W. Productivity growth in world agriculture: Sources and constraints. J. Econ. Perspect. 2002, 16, 161–184. [Google Scholar] [CrossRef]
- Li, X. A study of the driving factors of agricultural production efficiency in China. J. Chongqing Univ. 2015, 21, 37–46. [Google Scholar] [CrossRef]
- Xing, H.; Zhang, X.; Deng, Y. Empirical analysis on the relationship between agricultural production efficiency and its influencing factors—based on the data of Hubei province. Chin. J. Agric. Resour. Reg. Plan. 2016, 37, 198–203. [Google Scholar] [CrossRef]
- Zhang, S.; Jiang, W. Energy efficiency measures: Evolution, Controversy, and the Future. J. Quant. Tech. Econ. 2016, 33, 3–24. [Google Scholar]
- Li, Q.; Li, G.; Yin, C.; Liu, F. Spatial characteristics of agricultural green total factor productivity at county level in Hebei province. J. Ecol. Rural Environ. 2019, 35, 845–852. [Google Scholar] [CrossRef]
- Guo, S.; Zhang, M.; Wu, G. Study on agricultural production efficiency and its influencing factors in Heilongjiang reclamation area. J. Northeast Agric. Univ. 2019, 50, 68–75. [Google Scholar]
- Wu, Q.; Wu, C. Research on evaluation model of energy efficiency based on DEA. J. Manag. Sci. 2009, 22, 103–112. [Google Scholar] [CrossRef]
- Tone, K. A slacks-based measure of efficiency in data envelopment analysis. Eur. J. Oper. Res. 2001, 130, 498–509. [Google Scholar] [CrossRef]
- Deng, G.; Li, L.; Song, Y. Provincial water use efficiency measurement and factor analysis in China: Based on SBM-DEA model. Ecol. Indic. 2016, 69, 12–18. [Google Scholar] [CrossRef]
- Cheng, X.; Li, N.; Mu, H.; Guo, Y.; Jiang, Y. Study on total-factor energy efficiency in three provinces of northeast China based on SBM model. Energy Procedia 2018, 152, 131–136. [Google Scholar] [CrossRef]
- Shang, Y.; Liu, H.; Lv, Y. Total factor energy efficiency in regions of China: An empirical analysis on SBM-DEA model with undesired generation. J. King Saud Univ. Sci. 2020, 32, 1925–1931. [Google Scholar] [CrossRef]
- Liu, Y.; Zou, L.; Wang, Y. Spatial-temporal characteristics and influencing factors of agricultural eco-efficiency in China in recent 40 years. Land Use Policy 2020, 97, 104794. [Google Scholar] [CrossRef]
- Çelen, A. Efficiency and productivity (TFP) of the Turkish electricity distribution companies: An application of two-stage (DEA&Tobit) analysis. Energy Policy 2013, 63, 300–310. [Google Scholar] [CrossRef]
- Ding, X.; Fu, Z.; Jia, H. Study on Urbanization Level, Urban Primacy and Industrial Water Utilization Efficiency in the Yangtze River Economic Belt. Sustainability 2019. [Google Scholar] [CrossRef]
- Wu, J.; Yin, P.; Sun, J.; Chu, J.; Liang, L. Evaluating the environmental efficiency of a two-stage system with undesired outputs by a DEA approach: An interest preference perspective. Eur. J. Oper. Res. 2016, 254, 1047–1062. [Google Scholar] [CrossRef]
- Ding, X.; He, J.; Wang, L. Inter-provincial water resource utilization efficiency and Its Driving Factors considering undesirable outputs—Based on SE-SBM and Tobit models. Chin. J. Popul. Resour. Environ. 2017, 28, 157–164. [Google Scholar]
- Guo, Y.; Sayed, T.; Essa, M. Real-time conflict-based Bayesian Tobit models for safety evaluation of signalized intersections. Accid. Anal. Prev. 2020, 144, 105660. [Google Scholar] [CrossRef]
- Dalei, N.N.; Joshi, J.M. Estimating technical efficiency of petroleum refineries using DEA and tobit model: An India perspective. Comput. Chem. Eng. 2020, 142, 107047. [Google Scholar] [CrossRef]
- Selim, S.; Bursalioglu, S.A. Analysis of the determinants of universities efficiency in Turkey: Application of the data envelopment analysis and panel tobit model. Procedia Soc. Behav. Sci. 2013, 89, 895–900. [Google Scholar] [CrossRef]
- Wu, M.; Zhao, M. Measurement of agricultural efficiency in China and its influencing factors—Perspective of discrepancy. J. Econ. Water Resour. 2017, 35, 63–68. [Google Scholar] [CrossRef]
- Yang, Q.; Wang, J.; Li, C.; Liu, X. The spatial differentiation of agricultural green total factor productivity and its driving factor recognition in China. J. Quant. Tech. Econ. 2019, 21–37. [Google Scholar]
- Escobar, N.; Tizado, E.J.; zu Ermgassen, E.K.H.J.; Löfgren, P.; Börner, J.; Godar, J. Spatially-explicit footprints of agricultural commodities: Mapping carbon emissions embodied in Brazil’s soy exports. Glob. Environ. Chang. 2020, 62, 102067. [Google Scholar] [CrossRef]
- Shen, L.; Sun, Y. Review on carbon emissions, energy consumption and low-carbon economy in China from a perspective of global climate change. J. Geogr. Sci. 2016, 26, 855–870. [Google Scholar] [CrossRef]
- Duan, H.; Zhang, Y.; Zhao, J. Carbon Footprint analysis of Farmland Ecosystems in China. J. Soil Water Conserv. 2017, 25, 203–208. [Google Scholar]
- Wang, Y.; Gu, S. Analysis on Carbon Footprint and Ecological Pressure of China’s electric Power industry from 2006 to 2015. Acta Sci. Circumstantiae 2018, 38, 4873–4878. [Google Scholar]
- Fei, R.; Lin, B. The integrated efficiency of inputs–outputs and energy—CO2 emissions performance of China’s agricultural sector. Renew. Sustain. Energy Rev. 2017, 75, 668–676. [Google Scholar] [CrossRef]
- Gras, C.; Cáceres, D.M. Technology, nature’s appropriation and capital accumulation in modern agriculture. Curr. Opin. Environ. Sustain. 2020, 45, 1–9. [Google Scholar] [CrossRef]
- Ma, S.; Feng, H. Will the decline of efficiency in China’s agriculture come to an end? An analysis based on opening and convergence. China Econ. Rev. 2013, 27, 179–190. [Google Scholar] [CrossRef]
- Xu, L.; Tan, J. Financial development, industrial structure and natural resource utilization efficiency in China. Resour. Policy 2020, 66, 101642. [Google Scholar] [CrossRef]
- Qin, B.; Liu, J.; Ge, L. Environmental regulation intensity, industrial structure upgrade and improvement of China’s resource allocation. J. Chongqing Technol. Bus. Univ. Soc. Sci. Ed. 2020, 9, 1–10. [Google Scholar]
- Hu, J. Negative effects of industry pollution on agriculture in China. Ecol. Econ. 1998, 5, 3–5. [Google Scholar]
- Adom, P.K.; Adams, S. Decomposition of technical efficiency in agricultural production in Africa into transient and persistent technical efficiency under heterogeneous technologies. World Dev. 2020, 129, 104907. [Google Scholar] [CrossRef]
- Yang, J.; Lin, Y. Driving factors of total-factor substitution efficiency of chemical fertilizer input and related environmental regulation policy: A case study of Zhejiang Province. Environ. Pollut. 2020, 263, 114541. [Google Scholar] [CrossRef] [PubMed]
- Xia, M.; Zhang, Y.; Zhang, Z.; Liu, J.; Ou, W.; Zou, W. Modeling agricultural land use change in a rapid urbanizing town: Linking the decisions of government, peasant households and enterprises. Land Use Policy 2020, 90, 104266. [Google Scholar] [CrossRef]
- Gao, P.; Wang, X. Fiscal input, environmental regulation and efficiency of green technological innovation: Based on the data of large industrial enterprises from 2008 to 2015. Ecol. Econ. 2018, 34, 93–99. [Google Scholar]
- Huang, S.-L.; Yeh, C.-T.; Chang, L.-F. The transition to an urbanizing world and the demand for natural resources. Curr. Opin. Environ. Sustain. 2010, 2, 136–143. [Google Scholar] [CrossRef]
- Sun, M.; Zhang, M. The impact of bird flu on agriculture and related industries. World Surv. Res. 2004, 4, 5–6. [Google Scholar]
- Liu, X. The development of modern agriculture in Wuhan urban circle under the background of “Two-oriented Society” construction. Bus. China 2010, 191, 193. [Google Scholar]
- Xie, Z.; Ren, S.; Li, Y.; Jingyu, L. Study on efficiency of agricultural production in Jiangxi province based on DEA model. Acta Agric. Jiangxi 2015, 27, 142–145. [Google Scholar] [CrossRef]
- Zhu, L.; He, R.; Zheng, W. Spatial and temporal pattern and driving factors of urban innovation efficiency in city clusters in the middle Reaches of Yangtze River. Resour. Environ. Yangtze Basin 2019, 28, 2279–2288. [Google Scholar]
- Tamilselvi, R.; Ramesh, M.; Lekshmi, G.S.; Bazaka, O.; Levchenko, I.; Bazaka, K.; Mandhakini, M. Graphene oxide—Based supercapacitors from agricultural wastes: A step to mass production of highly efficient electrodes for electrical transportation systems. Renew. Energy 2020, 151, 731–739. [Google Scholar] [CrossRef]
- Zhang, J.; Zhang, A. Study on relationship between spatial heterogeneity of land resources and economic development: A case study of Wuhan urban agglomeration. J. Nat. Resour. 2015, 30, 725–735. [Google Scholar] [CrossRef]
- Kuersteiner, G.M. Invariance principles for dependent processes indexed by Besov classes with an application to a Hausman test for linearity. J. Econom. 2019, 211, 243–261. [Google Scholar] [CrossRef]
- Panagopoulos, Y.; Dimitriou, E. A large-scale nature-based solution in agriculture for sustainable water management: The Lake Karla case. Sustainability 2020, 12, 6761. [Google Scholar] [CrossRef]
- Guo, B.; He, D.; Zhao, X.; Zhang, Z.; Dong, Y. Analysis on the spatiotemporal patterns and driving mechanisms of China’s agricultural production efficiency from 2000 to 2015. Phys. Chem. Earthparts A/B/C 2020, 102909. [Google Scholar] [CrossRef]
- Ariken, M.; Zhang, F.; Liu, K.; Fang, C.; Kung, H.-T. Coupling coordination analysis of urbanization and eco-environment in Yanqi Basin based on multi-source remote sensing data. Ecol. Indic. 2020, 114, 106331. [Google Scholar] [CrossRef]
- He, Y.; Qi, Y. Study on the influence of urbanization development on the technical efficiency of grain production—Based on the panel data of 13 major grain-producing areas in China. Chin. J. Agric. Resour. Reg. Plan. 2019, 40, 101–110. [Google Scholar] [CrossRef]
- Wu, H.; Ren, S.; Yan, G.; Hao, Y. Does China’s outward direct investment improve green total factor productivity in the “Belt and Road” countries? Evidence from dynamic threshold panel model analysis. J. Environ. Manag. 2020, 275, 111295. [Google Scholar] [CrossRef]
- Liu, M.; Lu, F. Agricultural and industrial sector: Feeding each other or back-feeding—A study based on spatial durbin model. Rev. Econ. Manag. 2017, 33, 153–160,167. [Google Scholar] [CrossRef]
- Chen, S. The stages of industry and industry nurturing agriculture. J. Chongqing Technol. Bus. Univ. (West Forum) 2015, 25, 1–10. [Google Scholar] [CrossRef]
- Luo, M. The dilemma and realization path of the coupling development of modern agriculture and modern service industry. Agric. Econ. 2020, 8, 15–17. [Google Scholar]
- Zheng, Y. Reasons for the strong dependence on the government for agricultural transformation and upgrading and the countermeasures—On the optimization and transformation of the realization form of agricultural organization. Issues Agric. Econ. 2016, 10, 4–8. [Google Scholar]
- Liu, Z. Government intervention, marketization process and agricultural production efficiency. North. Hortic. 2019, 148–157. [Google Scholar] [CrossRef]
- Li, H.; Ma, C. The impact of government support, marketization on innovation efficiency of agricultural techniques: A case study of six provinces in the middle of China. J. China Agric. Univ. 2017, 22, 189–198. [Google Scholar] [CrossRef]
- Ding, X.H.; Tang, N.; He, J.H. The threshold effect of environmental regulation, FDI agglomeration and water utilization efficiency under “Double Control Actions”—An empirical test based on Yangtze River Economic Belt. Water 2019, 11, 452. [Google Scholar] [CrossRef]


Publisher’s Note: MDPI stays neutral with regard to jurisdictional claims in published maps and institutional affiliations. |
© 2020 by the authors. Licensee MDPI, Basel, Switzerland. This article is an open access article distributed under the terms and conditions of the Creative Commons Attribution (CC BY) license (http://creativecommons.org/licenses/by/4.0/).