Abstract
Self Service Technology (SST] refers to technological interfaces that enable customers to produce a service independently, without service employees’ direct involvement. Because of the recent technological evolution and rising labor costs, most companies in the retail and service industries tend to use more technology-based SST options. This study tried to investigate the effects of technology readiness and consumer readiness on SST service quality, attitude toward using SST, and intention to use SST in the restaurants. This study verified that consumer readiness as well as technology readiness is a significant leading variable that influences perceived SST service quality that previous studies have not dealt with. The results of this study can provide various suggestions regarding the recent technology-based customer services from the practical point of view.
1. Introduction
Technological advances are increasingly detaching the purchase decision from a physical outlet, and smart retailers are trying to leverage technology to make more efficient shopping and attract more customers while tapping into the innate curiosity to see, feel, and experience specific products and services [1]. Due to the technological advances of the fourth Industrial Revolution, firms in the retail and service industries tend to select technology-based self-service options, and using new technology is becoming one of the important success factors, even in the restaurant industry.
As new technology-based products and services are rapidly supplied in the market, technology is playing a more important role in the relationship between customers and firms [2]. Such products and services are beneficial to customers, not only because they are fast and convenient [3], but also because they provide diversified useful information. For most retail and service companies, since the self-service option allows customers to do some work that would otherwise be handled by the employees, they are able to reduce labor costs and attract more customers. Customers also can make the role of partial employees contributing service quality, value, and service satisfaction by using SST during the service process.
Self Service Technology (SST] refers to technological interfaces that enable customers to produce a service independently, without service employees’ direct involvement [4]. Meuter et al. [4] suggest the need for expansion of technology-based interaction rather than face-to-face interaction. They cite examples of banking transactions without the help of a bank teller, online shopping that requires no trip to the mall or service employee, divorce filings or tenant eviction via automatic kiosk, electronic self-ordering at fast-food restaurants, and self-scanning at retail stores [4]. Depending on the service site, SST can be classified into on-site SST, which occurs on the service site, and off-site SST, which occurs online. As technology-based interactions have potential to determine a business’ long-term success [5], the importance of SST in customer interaction is growing rapidly. Kelly et al.’s study [6] also argues that the practice of SST usage in the tourism and hospitality industry is becoming one of the most representative factors of successful service strategy.
Reflecting such trends, many researchers have conducted studies on SST. In 1989, Davis [7] developed the Technology Acceptance Model (TAM], based on the rational behavior theory [8], to explain that perceived ease-of-use and perceived usefulness influence individuals’ acceptance of a new technology. Later, many studies have focused on how perceived ease-of-use, usefulness, and fun affect customers’ attitude and intention toward SST.
Parasuraman’s [9] research significantly influenced the research on the adoption of new technology. Using a four-dimensional framework (optimism, innovativeness, insecurity, and discomfort] that investigated people’s attitudes toward technology, he developed five types of technology consumer groups that included the Technology Readiness Index (TRI], as well as other corresponding groups. Studies conducted in the United Kingdom have supported the four-dimensional five groups [10].
Interestingly, there have been only a few TRI-applied studies in the field of commerce that use SST. Lijander et al. [11] studied the attitudes on using SST during airline check-ins. Research results confirmed that, among TR, only optimism and innovativeness affected customers’ attitudes, behavior adoption, and SST evaluation. Lin and Hsieh [12] expanded on the research of Meuter et al. [5] and emphasized that the use of SST increased consumer satisfaction.
The overall flow of previous studies related to SST conveys that there has not been enough research investigating the effects of TRI on the SST core attitude model, which is useful for on-site SST. Furthermore, it can be predicted that attitude toward the acceptance of and intention to use SST can be changed depending on the level of consumer readiness index, as well as TRI. However, Meuter et al. [13] were the only ones to conduct research on consumer readiness index. This research argues that individual characteristics affect consumer readiness index and that consumer readiness index leads to the adoption of SST, emphasizing the mediating role of consumer readiness index. Shim and Han [14] used TRI and consumer readiness index as leading variables in their research and investigated the variables’ influence on consumers’ motivation, attitude, and intention toward using SST. They confirmed that consumer readiness index is a variable that plays a major role in determining consumers’ motivations for using SST.
While several studies focus on the use of SST within service delivery, no research explores the role of perceived SST service quality with regards to the availability of SST and consumers’ evaluation. In addition, there has been almost no research that investigates the individual roles of SST-Qual criterion elements. Although Lin and Hsieh [12] developed the SST-Qual criteria and investigated the influence they have on service satisfaction and loyalty, no research focuses on consumers’ attitudes and intention toward using SST. Moreover, there have not been any SST-Qual criteria applied researches. As a result, it seems academically beneficial to use consumer readiness index, in addition to TRI, as leading variables and investigate the effects that these variables have on SST-Qual perception, attitudes, and intention toward using SST.
Self-service technologies strongly influence customers’ interaction with service companies to foster positive outcomes. Hassan et al.’s study [15] tried to investigate the impact of SSTs’ service quality on customer loyalty and behavioral intention. They also confirmed that there is a mediation effect of technology trust between SSTs service quality and behavioral intention. Sedighimanesh and his colleagues [16] analyzed the expectation–confirmation model, and their study results revealed a strong positive effect of SST on consumer online shopping behavior.
While ordering at the restaurant, if customers use the installed touch screen (SST] instead of ordering directly from an employee, the restaurant is able to reduce not only the amount of waiting time for customers, but also the labor cost by substituting the service employee with the ordering system. This, in turn, will increase the efficiency of management performance and the amount of customer experience. When utilizing such SST, customer perception of service quality, attitude, and intention toward using SST will be different according to the customer’s level of technology readiness (TR]. Additionally, the perceived service quality, attitude, and intention will also be changed depending on customer’s individual readiness. Accordingly, this research aims to investigate the effects that TR and consumer readiness have on perceived SST service quality within the restaurant setting. Furthermore, in looking at how perceived SST service quality affects customers’ attitudes and intention toward using SST, this research seeks to verify the moderating effects of customer traits and situational factors.
2. Conceptual Background and Research Hypotheses
2.1. Technology Readiness and Perceived SST Service Quality
2.1.1. Technology Readiness (TR]
Technology readiness (TR] can be defined as people’s tendency to adopt or use new technology in order to accomplish their goals at home or in the work place [12]. Parasuraman [9] states that the TR construct is used to measure not the customers’ ability to utilize a technology, but their conscious tendency to use technology; thus, the TR construct determines the individual predisposition toward technology. According to Parasuraman [9], the technology readiness index (TRI] is composed of four-dimensions: optimism, innovativeness, discomfort, and insecurity. As positive factors among the dimensions, optimism and innovativeness encourage customers to use technology products or services and, also, help customers form a positive attitude toward the technology. In contrast, discomfort and insecurity, as negative factors of TR, make customers reluctant to use the technology. TR plays a very significant role in determining customers’ recognition and behavior, and it has become an important concept in evaluating customers’ SST diffusion [12]. In other words, TR is a construct that plays a major role in forming customer attitude toward SST and carrying out actual behavior.
Many studies using TRI followed the research of Parasuraman [9]’s study [11,17,18]. However, each study shows a different effect on SST depending on the TR sub-dimensions. In Liljander et al.’s [11] research of the TR dimensions, only optimism and innovativeness influenced attitude, behavior, and evaluation using SST. In other words, the negative TR dimensions, discomfort and insecurity, did not have any effect on attitude, behavior, and evaluation. Similarly, Zhu et al. [19] found that discomfort and insecurity did not have an effect on attitude and intention toward using SST. Based on the results of prior studies, Shim and Han [14] used optimism and innovativeness as variables and verified the effects these two dimensions had on the motivations, attitudes, and intention toward SST. Berger [20] also applied only optimism and innovativeness to his research model. Accordingly, we suggest selecting only optimism and innovativeness as TR dimensions in our research. As an extension study of TR, Son and Han [21] focused on postadoption behavior and investigated how TR affects the continued use intention of new technology. Iqbal et al.’s study [22] also showed the effect of SST quality on brand loyalty and customer intention.
2.1.2. SST-Service Quality
Perceived service quality is the overall judgment of service that contributes to customer satisfaction, purchasing intention, and firm performance [23,24]. Because it is related to using SST, service quality should be evaluated in the context of how technological interaction and the resulting customer recognition and behavior affect a firm’s success.
In 2006, Lin and Hsieh developed a 20-item SST-QUAL scale that is applicable to general SST service quality [12]. These items are divided into seven dimensions. Specifically, these dimensions are functionality, enjoyment, security/privacy, assurance, design, convenience, and customization. It is necessary to evaluate whether it is possible to generalize this scale in order to assess customer usage and behavior toward SST. Furthermore, Lin and Hsieh [12] used the SST-Qual scale they developed in 2005 to verify the effects of TR on SST-Qual satisfaction, behavioral intentions on SST, and the relationships between these factors. They found that, as the perceived SST-Qual rises, consumers’ satisfaction and their behavioral intentions also increase.
Thus, we tried to use Lin and Hsieh’s [12] scale to measure SST-Qual. Unlike Lin and Hsieh’s [12] research, which includes general TR self-service, the SST in our research is limited to fast food restaurant touch screens. As a result, within the SST-Qual scale, it was difficult to apply the design dimension, which evaluates the actual SST design, to our research. Thus, the research applied the other six dimensions (i.e., functionality, enjoyment, security and privacy, assurance, convenience, and customization).
2.1.3. TR and Perceived SST Service Quality
TR is also known as the precedent of e-service quality [25]. Meuter et al. [5] stated that there is a link between consumers’ evaluation of SST and technology anxiety. Moreover, Liljander et al. [11] and Zeithaml et al. [25] found that consumers’ TR can positively influence e-service quality evaluations.
Research that deals with TR and motivations to use SST found that TR impacts perceived usefulness, perceived ease of use, and perceived enjoyment. Shim and Han [14] verified that optimism and innovativeness influence motivations to use SST, ease-of-use, performance, and fun. Son and Han [21] also showed that TR affects SST’s perceived usefulness, perceived ease-of-use, and enjoyment. Perceived usefulness, usability, fun, and performance are similar in concept to the following SST service quality factors: functionality, convenience, enjoyment, and assurance. Considering the results of these previous studies, we presumed that optimism and innovativeness will positively influence perceived SST service-quality and, thus, established the following hypotheses:
H1-1.:
Optimism will positively influence perceived service quality of SST.
H1-2.:
Innovativeness will positively influence perceived service quality of SST.
2.2. Consumer Readiness and Perceived SST Service Quality
2.2.1. Consumer Readiness
Consumer readiness was referenced in Meuter et al.’s [13] research. They studied the impact that customers’ innovative traits (e.g., compatibility, complexity] and personal traits (e.g., inertia, technology anxiety, need for interaction, demographics] have on the consumer readiness parameter (role clarity, extrinsic and intrinsic motivation, ability], as well as their effects on usage intention during the process of SST adoption. In this case, consumer readiness refers to the first time a consumer uses an innovative product or the consumer’s state of readiness [13] (p. 64). Meuter et al. [13] conceptualized consumer readiness as role clarity, motivation, and ability. Role clarity, here, is defined as the consumers’ knowledge and understanding of what they are going to do. Motivation signifies the desire to receive compensation in connection with the use of SST. Ability refers to the confidence associated with handling the skills required when using SST and completing a task [13]. Their research revealed that only role clarity and ability retained statistically noticeable significance. Baker [26] investigated the significant relationship between consumer readiness and technology in terms of different environmental situations.
2.2.2. Consumer Readiness and Perceived SST Service Quality
Meuter et al. [13] studied the influence consumer readiness has on SST usage intentions. They confirmed that role clarity and ability are core variables that affect SST usage intentions. Shim and Han [14] utilized Dabholkar and Bagozzi’s [27] SST core attitudinal model to verify that consumer readiness impacts motivation to use SST. Motivation factors consist of ease-of-use, performance, and fun. SST service quality is composed of functionality, enjoyment, security and privacy, assurance, convenience, and customization. Of these factors, convenience, assurance, and enjoyment are analogous in concept to SST motivation factors. Accordingly, we postulated that consumer readiness will have a positive impact on SST service quality perception. Thus, we have set up the following hypothesis:
H2.:
Consumer readiness will positively influence perceived service quality of SST.
2.3. Perceived SST Service Quality, Attitude, and Intention toward Using SST
Perceived service quality is defined as the general judgment of services that play a role in customer satisfaction, purchase intentions, and firm performance [24]. Specifically, recognition of SST service quality can lead to attitude and intention toward using SST. So far, many have researched the connection between motivation to use SST and attitude toward using SST [14,27]. Previous studies have found that ease-of-use, performance, fun, and perceived usefulness have a positive impact on attitude and intention toward using SST. Sedighimanesh and his colleagues [16] showed that, based on the expectation–confirmation model, there is a strong positive effect of SST on customer satisfaction even in the online shopping.
Lin and Hsieh [12] verified that the higher the perceived SST-Qual, the higher the customer satisfaction and behavioral intentions toward SST. Therefore, we can presume that perceived SST service quality has an influence on attitude toward using and intent to use SST.
H3.:
Perceived SST service quality will positively influence attitude toward using SST.
H4.:
Perceived SST service quality will positively influence intention to use SST.
Studies on attitude [28] suggest that attitude has a direct, strong, and positive impact on intention. The connection between attitude and intention plays a major role in research on attitude and, thus, is supported within a broad field [22,27].
H5.:
Attitude toward using SST will have a positive impact on intention to use SST.
2.4. Consumer Traits
For marketers, disparities among consumer traits are related to demographical factors, psychographic outline, and personal traits. A number of studies on SST investigated the differences among demographical factors [6,11]. These research results revealed that, typically, young and affluent males with high levels of education tended to use SST more than others.
Many SST related studies suggest taking customer traits or situational factors into account [12]; however, in actuality, only a few studies do so. Dabhlokar and Bagozzi [27] established a broad range of customer traits and situational factors and verified the effects of attitudes and intentions toward using SST as moderating variables. For this research, they used self-efficiency, interaction with service employees, and self-consciousness as customer traits; as situational factors, they used perceived waiting time and perceived crowding, which is a concept of social insecurity. They found that, of the customer traits, innovativeness and self-consciousness were significant moderating variables. In their research, Son and Han [21] applied the following three types of personal traits as moderating variables to the TAM model: pursuit of newness, self-monitoring, and self-efficacy. They verified that these three personal traits play moderating roles. Meuter el al. [13] used individual variation as leading variables of Consumer Readiness in their research. They studied the following individual variations: force of habit, technology anxiety, previous experience, and demographic traits.
2.4.1. Self-Consciousness
Self-consciousness is investigating oneself as a social object from the point of view of other people [28]. Self-consciousness can appear to be a social risk when other people are present during use of SST [27] Ruyter et al. [29] discovered that perceived risk can have a negative impact on behavioral intentions during use of e-service. According to these research results, we can predict that, if consumers perceive a social risk, they will be unable to view on-site TBSS favorably and become frustrated. We can also predict that self-consciousness will become a relatively important decision variable when there are other consumers present on-site, especially if the particular consumer is using a technology based service option that he or she is unfamiliar with. Shim and Han [14] used the SST core attitudinal model in their research and confirmed that self-consciousness is a significant moderating variable. There were many similarities between the concepts of the motivation factors used in this research and those of the SST service quality factors. We presumed that, similar to attitude and intention toward using SST, self-consciousness can be used as a moderating variable in our research.
H6-1.:
The degree of impact that perceived SST service quality has on attitude and intention toward using SST will differ according to the level of self-consciousness.
2.4.2. Need for Interaction with Service Employee
The need for interaction with a service employee can be defined as the interaction between customer and employee that appears during service encounter [30]. Dabholkar’s research revealed the need for interaction with a service employee to be a variable related to TBSS. Liljander et al. [11] found that, within a retail setting, customers that prefer interacting with employees tend to avoid machines. Shim and Han [14] confirmed that the attitude toward using SST changes according to the level of need for interaction with a service employee. Hassan et al.’s study [15] also shows that customer’s need for interaction with service provider is an important factor in the formation process of customer satisfaction from the perspective of self-service technology.
H6-2.:
The degree of impact that perceived SST service quality has on attitude and intention toward using SST will differ according to the level of need for interaction with a service employee.
2.4.3. Technology Anxiety
Many researchers have studied technology anxiety related to usage of SST [5,9]. Previous studies have shown that technology anxiety can weaken motivation level. Recently, SST-related research has found technology anxiety to be a variable that influences attitude and intention toward using SST [9,30]. Consumers who have technology anxiety tend not to select the SST option. Similarly, Shim and Han’s [14] research revealed a stronger attitude toward using SST due to the performance effect of technology anxiety resulting from the use of SST in the lower level group.
H6-3.:
The degree of impact that perceived SST service quality has on attitude and intention toward using SST will differ according to the level of technology anxiety.
2.5. Situational Factors
The subject of waiting is often mentioned when discussing service related situational factors [14]. Related research found that consumers dislike waiting time and this, in turn, may lead to customers selecting SST. Another situational factor in regard to on-site service encounter is crowding. Although in certain settings, such as concerts, customers perceive the presence of others in a positive sense, in most situations, customers perceive crowding in a negative sense. In such cases, such negative perception can bring about social anxiety for customers. Our research used the following situational factors: perceived waiting time and perceived crowding as a social risk.
2.5.1. Perceived Waiting Time
Perceived waiting time signifies the customer’s individual perception of whether he or she must wait longer to use the TBSS as opposed to another option [27]. Maister [31] reported that perceived waiting time is more strongly associated with the service than the actual waiting time. Customers are impatient and, thus, have a tendency to seek shorter lines and faster shopping methods [31]. Whether or not the service encounter is technology based, current customers noticeably prefer self-service to voluntary wait for full service.
H7-1.:
The degree of impact that perceived SST service quality has on attitude and intention toward using SST will differ according to the level of perceived waiting time.
2.5.2. Perceived Crowding
Perceived crowding can change depending on different situations. Rapoport [32] mentioned that “perceived crowding is a subjective negative experience” (p. 134). Researchers report that crowding brings about stress and a lack of control within a retail setting [32]. Because consumers exposed to crowded situations are vulnerable to social anxiety, the convenience of using SST can become greatly important during such situations. Therefore, the relationship between perceived convenience of use and attitude toward using SST will strengthen. In a similar way, in order to encourage consumers to favor SST during a state of social anxiety, the effect of enjoyment must be present. In this way, the relationship between enjoyment and attitude toward using SST will also strengthen.
H7-2.:
The degree of impact that perceived SST service quality has on attitude and intention toward using SST will differ according to the level of perceived crowding.
3. Research Model
3.1. Research Model
This research seeks to explore the effects that technology readiness (TR) and consumer readiness have on SST-service quality, attitude toward using SST, and intention to use SST. Furthermore, given that TR and consumer readiness affect SST service-Qual, attitude toward using SST, and intention to use SST, this research aims to verify the moderating effects of customer traits and situational factors. The research model is as follows (Figure 1):
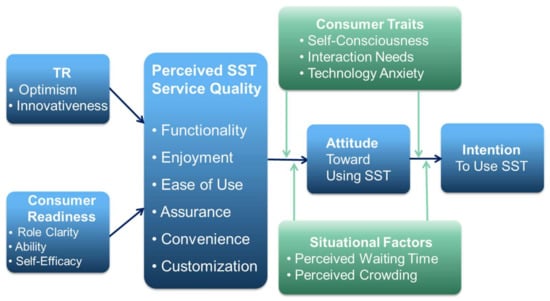
Figure 1.
Research model.
3.2. Samples and Sampling Process
In order to verify the research hypotheses of this research, we used a scenario technique questionnaire. The questionnaire is composed of four sections: scenario 1 or 2, reality-check items, waiting time related items, and variables related items.
The scenario was adjusted to our research purpose based on Dabholkar and Bagozzi’s [27] scenario. We grouped questionnaires into A type and B type based on the level of crowded time while respondents order the menu with touch screen device SST. It is related to self-consciousness, which is one of the important consumer traits that was used as a moderating variable in this study. The second grouping criteria of the questionnaire was customer’s waiting time.
In order to study the consumer attitude toward using SST during the ordering process in restaurants, we selected various people in their ages who have used restaurants as our subjects of study. As a means to evaluate the scenario’s reliability, we inserted two reality-check items below the scenario. We distributed a total of 600 questionnaires considering the balance of four questionnaire types. Excluding those with inadequate answers among collected 557, we used 501 questionnaires for the final analysis. We used AMOS and the structural equation model for the model testing.
4. Results of Hypotheses and Model Testing
4.1. Verification of Reliability and Validity
We utilized Cronbach’s coefficient α, which measures internal consistency, in order to verify the reliability of the measurement items used in this research. The Cronbach’s coefficient α values of variables (Table 1) were very high with values of 0.83~0.96. Since these values were above the 0.70 standard suggested by Nunnally and Berstein [33], we were able to confirm internal consistency and verify reliability.

Table 1.
Measurement items and results of confirmatory factor analysis.
We performed a confirmatory factor analysis in order to verify the convergent validity of the constructs used. All the factor loadings were converged into the appropriate factors. According to the results of the confirmatory factor analysis (Table 1), the research model’s goodness of fit index is as follows: χ2 = 1086.76 (df = 418, p = 0.00), CFI = 0.96, TLI = 0.94, RMSEA = 0.057. These results meet Hu and Bentler’s (1999) standards, and we can say that this is a good model. Thus, we were able to confirm convergent validity of CFA results. In addition, from the CR (construct reliability) values (all above 0.70) and AVE (average variance extracted) values (all above 0.50), we can also confirm convergent validity.
We employed two methods to verify discriminant validity among constructs. First, we performed a confirmatory factor analysis to verify each of the measurement items within the constructs included in the research method [34]. Table 1 shows the results of the CFA. Second, we can verify discriminant validity by the success or failure to dismiss the hypothesis that the constructs are equal (φ = 1). If 1 is not included in the φ ± 2 SE (Standard Error) formula, we can confirm discriminant validity. Of the construct correlation values, the value between privacy and assurance came out to be the highest: 0.822 ± 2SE × 0.088 = 0.646~0.998. Because this value does not include 1, we were able to confirm discriminant validity.
We also tested discriminant validity based on Fornell and Larcker’s method [35]. All the AVE values of the study constructs were bigger than the squared value of correlation between the constructs, and we confirmed the discriminate validity of the measurement.
Before the final model testing, we checked the possibility of the common method bias of the collected data. We followed the Harman’s single factor test suggested by Podsakoff et al. [36]. We used unrotated factor analysis of all the constructs and measurement items and checked whether many items are converged into one single factor. We also checked the percentage of the total variance of the biggest factor. This test showed that there was no common method bias issue in this study.
4.2. Analysis of Structural Equation Model
To verify the research hypotheses, we used AMOS and performed an analysis of structural equation model. The results are presented in Table 2. The fitness indices of the model are as follows: χ2 = 546.18 (df = 243, p = 0.00), CFI = 0.96, TLI = 0.95, RMSEA = 0.06. These values meet Hu and Bentler’s (1999) standards and, thus, we are able to confirm that this is an acceptable model.
Table 2.
Results of the tests of hypotheses.
TR dimension optimism in hypothesis 1 was shown to have a direct positive influence on all six dimensions of service quality (functionality (γ = 0.27), enjoyment (γ = 0.35), security (γ = 0.140, assurance (γ = 0.12), convenience (γ = 0.26), and customization (γ = 0.19)). This supports hypotheses 1-1a~1-1f. TR dimension innovativeness only had a direct positive influence on functionality (γ = 0.6) and assurance (γ = 0.11). Innovativeness had a negative effect on ease of use (γ = −0.08) and customization (γ = −0.09). As a result, we adopted only hypotheses 1-2a and 1-2d.
Hypothesis 2—“Consumer readiness is positively related to perceived service quality of SSTs”—was supported. As the level of consumer readiness increases, customers get an increasingly positive perception of functionality (γ = 0.59), enjoyment (γ = 0.39), ease of use (γ = 0.73), assurance (γ = 0.46), convenience (γ = 0.56), and customization (γ = 0.34).
Hypothesis 3 focuses on the connection between perceived SST service quality and attitude toward using SST. According to results, the higher the perception of enjoyment (γ = 0.36), ease of use (γ = 0.11), assurance (γ = 0.22), and customization (γ = 0.11), the higher the formation of attitudes toward using SST. Accordingly, we were able to support hypotheses 3-2, 3-3, 3-4, and 3-6. In contrast, increases in functionality (γ = 0.06) and convenience (γ = 0.06) did not mean a development of attitude toward using SST. As a result, hypothesis 3 was partially supported.
Hypothesis 4 deals with the relationship between perceived SST service quality and intention to use SST. The higher the perception level of enjoyment (γ = 0.29), ease of use (γ = 0.15), assurance (γ = 0.43), and customization (γ = 0.13), the higher the intentions to use SST. Therefore, hypotheses 4-2, 4-3, 4-4, and 4-6 were supported. However, because perception of functionality and convenience did not signify an increase in intentions to use SST, we were only able to partly support hypothesis 4.
Hypothesis 5 focuses on the link between attitude toward using SST and intention to use SST. Results showed that the higher the development of attitude toward using SST, the higher the intentions to use SST (γ = 0.76). Thus, we supported hypothesis 5.
4.3. Verification of Moderating Effects
Hypotheses 6 and 7 state that the relationships among SST service quality, attitude, and intention to use SST will change depending on consumer traits and situational factors. This research carried out multi-group analyses in order to verify these hypotheses.
4.3.1. Moderating Effects of Consumer Traits
Moderating Effects of Self-Consciousness
Hypothesis 6-1 states that the relationship among SST service quality, attitude, and intention to use SST will change according to the level of self- consciousness.
A multi-group analysis of groups with high and low levels of self-consciousness was implemented to verify this hypothesis. After calculating the average score of self-consciousness, we classified those with scores higher than the average as the group with a high level of self-consciousness and those with scores lower than the average as the group with a low level of self-consciousness. Mean-centering the variables has often been advocated as a means to reduce the multicollinearity issue in the test of moderating effect [37,38].
Under the assumption that the standardized coefficient values of both groups are equal, we analyzed the difference between the χ2 value of the free model and that of the constrained model. As shown in Table 3, this difference between the χ2 values is 110.60, which shows that there is a moderating effect caused by self-consciousness. Table 4 shows the results of the comparison between the two groups’ standardized coefficients. From the two groups’ standardized coefficients, a critical ratio (CR) of over 1.96 acknowledges that a difference exists between the two groups. Research revealed that for the group with a high level of self-consciousness, the higher the perception of enjoyment and convenience, the higher the formation of attitude toward SST. In contrast, for the group with a low level of self-consciousness, the higher the perception of assurance in regard to SST, the stronger the formation of attitude toward use. In addition, for the group with a high level of self-consciousness, the higher the perception of enjoyment, the higher the level of intention to use SST.
Table 3.
Comparison between free model and constrained model to verify the moderating effect of self-consciousness.
Table 4.
Comparison of β-values between two self-consciousness group.
Moderating Effects of the Needs to Interact with Service Employees
To verify the moderating effect according to the level of desire to interact with service employees, we carried out a multi-group analysis of groups with high and low levels of desire for interaction.
The result of the differences between the χ2 value of the free model and constrained model (Table 5) indicate that there is a moderating effect caused by desire for interaction. The results of the comparison between the two groups’ standard coefficients are as shown in Table 6.
Table 5.
Comparison between free model and constrained model to verify the moderating effect of interaction need with employee.
Table 6.
Comparison of β-values between two interaction need groups.
The research revealed that for the group with a high level of needs for interaction, the higher the perception of functionality, assurance, and customization the higher the level of intention to use SST. For the group with a low level of desire for interaction, the higher the perception of enjoyment and convenience the higher the level of intention to use SST.
Moderating Effects of Technology Anxiety
To verify the moderating effect according to the level of desire to technology anxiety, we performed a multi-group analysis of groups with high and low levels of technology anxiety.
The result of the differences between the χ2 value of the free model and constrained model (Table 7) signifies that there is a moderating effect caused by technology anxiety. The results of the comparison between the two groups’ standard coefficients are as shown in Table 8.
Table 7.
Comparison between free model and constrained model to verify the moderating effect of technology anxiety.
Table 8.
Comparison of β-values between two technology anxiety groups.
For the group with a high level of technology anxiety, in regard to the relationship among perceived SST service quality and attitude and intention, the higher the perception of ease of use, the higher the attitude toward using SST and intention to use SST. In comparison, for the group with a low level of technology anxiety, the higher the perception of enjoyment, the higher the level of intention to use SST.
4.3.2. Moderating Effects of Situational Factors
Moderating Effects of Perceived Waiting Time
To verify the moderating effect according to the level of the length of perceived waiting time, we carried out a multi-group analysis of groups with long and short periods of perceived waiting time. The result of the differences between the χ2 value of the free model and constrained model (Table 9) indicates that there is a moderating effect caused by length of perceived waiting time. The results of the comparison between the two groups’ standard coefficients are as shown in Table 10.
Table 9.
Comparison between free model and constrained model to verify the moderating effect of perceived waiting time.
Table 10.
Comparison of β-value between two perceived waiting time groups.
For the group that perceived a short waiting time period, the higher the perception of function and ease of use the higher the level of intention to use SST. For the group that perceived a long waiting time period, the higher the perception of assurance, the higher the level of intention to use SST.
Moderating Effects of Perceived Crowding
To verify the moderating effect according to the degree of perceived crowding, we performed a multi-group analysis of groups that perceive high and low degrees of crowding. The result of the differences between the χ2 value of the free model and constrained model signifies that there is a moderating effect caused by perceived crowding. For the group that perceived a low degree of crowding, the higher the perception of customization, the higher the level of attitude toward using SST and intention to use SST. However, for the group that perceived a high degree of crowding, the higher the perception of assurance, the higher the level of intention to use SST.
5. Conclusions and Discussion
This research studied the effects of technology readiness and consumer readiness on SST service quality, attitude toward using SST, and intention to use SST in the restaurant industry. The first set of results of the research showed that, of the TR, optimism had a significant and positive influence on all six sub-dimensions of SST service quality. Results revealed that, in comparison, the higher the level of innovativeness, the higher the perception levels of only functionality and assurance. We interpreted that when innovativeness is high, customers are able to easily approach SST without anxiety; also, as experiences accumulate, customers have a higher perception of assurance about functionality and ordering performance. Results also revealed that innovativeness does not have statistically significant influences on enjoyment or convenience. These results signified that enjoyment and convenience are not much of a concern for customers with high innovativeness when using SST. Because our results confirmed that TR is an important leading variable of SST service quality, our research supported the works of Lin and Hsieh [12] and Zeithaml et al. [25]. However, their research is different from our study in that we verified the following: the effects on SST service quality changes according to the TR sub-dimensions—optimism and innovativeness.
Next, our research found that consumer readiness has a stronger and statistically more significant influence on all of SST service quality’s six constructs than does TR. Within a setting in which a customer is using SST, consumer readiness is a concept that is composed of the following: customer’s own role clarity, ability to utilize SST, and self-efficacy about using SST. Shim and Han (2012) confirmed that consumer readiness is a strong variable that affects motivation to use SST. However, no research has yet verified the relationship between consumer readiness and SST service quality. This research presents academic significance in that it verified the following: consumer readiness is a major leading variable that influences perceived SST service quality. In a practical sense, when introducing touch screen device ordering systems in restaurants, it is necessary to provide usage instructions in a fun way to customers (e.g., employee demonstrations or user guide boards). In order to vitalize the use of self-service touchscreens, it is important to empower customers with role clarity and ability, giving them the confidence that anyone can easily use SST.
Third, this research revealed that, within the relationship between SST service quality and attitude toward using SST, only enjoyment, ease of use, assurance, and customization had positive effects on attitude toward using SST. The results suggest that the development of attitude will increase if the following are met: SST usage instructions are fun, using SST is easy, there is confidence in SST performance, and SST is able to reflect individual customer’s preferences. On the other hand, functionality and convenience were shown not to have an impact on attitude. These results point out that the proliferation of SST causes consumers to become familiar and well-informed about the system’s functionality and convenience; as a result, SST’s functionality and convenience themselves can no longer act as leading factors of attitude toward using SST.
Fourth, this research found that attitude toward using SST has a great impact on intentions to use SST. This result is consistent with the results of previous studies, such as those carried out using Davis’ TAM model and Dabholkar and Bagozzi’s [27] SST core Attitudinal Model.
Lastly, this research confirmed the moderating effects of consumer traits (self-consciousness, need for interaction, technology anxiety) and situational factors (perceived crowding, perceived waiting time) within the relationship between SST service quality and attitudes and intentions toward using SST. Research results found that all variables have moderating effects.
Attitudes toward using SST changed according to the level of self-consciousness. In developing attitudes and intention to use SST, assurance of using touch screen device affected people with low levels of self-consciousness, and enjoyment and convenience affected those with high levels of self-consciousness.
Function, assurance, and customization had a more statistically significant and stronger impact on forming attitude toward using SST in groups with a high need for interaction than on groups with a low need for interaction. Such results signify that customers with a high need for interaction with service employees prefer to order through a service employee, as they tend to think that they will not be able to properly order using an SST. Giving such customers assurance that they can order properly in their taste using SST will help them realize that they do not need to go through an employee.
Ease of SST use was shown to have a strong influence on developing attitudes and intentions toward using SST in people with high levels of technology anxiety. For people with low levels of technology anxiety, ease or difficulty of SST use did not affect their attitude toward using SST. The expectation of increased enjoyment through SST use had an impact on developing attitudes and intentions toward using SST. This implies that expectation of increased enjoyment does not affect the development of intention toward using SST for people with high technology anxiety, as their technology anxiety is greater than such expectation. In contrast, this expectation of increased enjoyment greatly affects the development of attitude toward using SST for people with low technology anxiety. As a result, when introducing SST, firms should design the system to appeal to people with high technology anxiety; specifically, such a design should make the system seem easy to use and guarantee equivalent performance.
According to the moderating effects of perceived waiting time, function, and ease of using SST greatly affected the development of intention for people who experience a short perceived waiting time. This signifies that, even if the waiting time for ordering from a service employee is not perceived as long, people’s intention toward using SST is greatly affected by these two service quality factors. In contrast, those who experience a long perceived waiting time develop higher intentions to use SST when the enjoyment and assurance of ordering are expected. Firms need to give the feelings of assurance that their orders are finished perfectly through the SST for a longer perceived waiting time, such as demonstrating the process of using touch screen device by a service employee.
Although it differs according to the type of moderating variables such as perceived waiting time, perceive crowding, self-consciousness, need for interaction with service employee, technology anxiety, etc., our research confirmed that perceived SST service quality factor is a major motive in forming attitudes and intentions toward using SST. Among the perceived SST service quality variables, enjoyment, ease of use, and assurance had the greatest impact on attitude and intention toward using SST. These results imply that when developing SST, attitudes and intentions toward using SST will strengthen greatly if firms make SST much easier to use and make sure of ordering process when using SST rather than through the service employees. Adding an enjoyment factor when designing touch screen systems can be also greatly beneficial in various aspects.
5.1. Implications for Practice
This research found that consumer readiness has a stronger and statistically more significant influence on all of SST service quality’s six constructs than TR does. Consumer readiness is composed of customer’s own role clarity, ability to utilize SST, and self-efficacy about using SST. Therefore, when introducing a technology-based service (e.g., a touch screen ordering system in restaurant) to customers, it is necessary to provide usage instructions in an easy way (for example, employees’ demonstrations or user guide boards, etc.). In order to vitalize the use of self-service technology, it is important to empower customers with role clarity and ability, giving them the confidence that anyone can easily use SST. In turn, we can expect this to bring about the effects of shortening waiting time and reducing the number of service employees, as well as increasing profits in the long term.
Enjoyment among perceived SST service quality factors had the greatest impact on attitude and intention toward using SST. Ultimately, it will be key to success to add an enjoyment factor or customer’s own experience when designing a technology-based customer service system. In a practical sense, in order to actively encourage customers to use SST, it is not enough to simply consider the ease of use and performance aspects. Firms must find ways to allow customers to feel enjoyment when using SST by taking various methods into account. Providing a new customer experience based on SST will be a new way of attracting customers to the restaurant managers. In line with the recent trend of adopting new sophisticated technologies, more advanced technology devices like VR (virtual reality) or AI (artificial intelligence) robots can be used in the future. Our research results can be applied to any other service areas that need to introduce technology-based customer services.
5.2. Limitations and Further Research
This research selected the case of ordering system from a touch screen device in the restaurant as its scenario, and it verified the relationship between customers’ technology readiness and consumer readiness, SST service quality, attitude, and intention toward using SST. Because technology oriented interactions carry the potential to determine the long-term success of a business [5], it is necessary to expand the personal encounters that actively occur during service encounters toward technology oriented encounters. Within this context, this research has limitations in that it only considered restaurant service and touch-screen ordering devices. Additionally, we need to explore some underlying factors of service quality, and attitudes and intentions toward using SST from the perspectives of various service encounters. In the methodology section, the use of interaction terms to test the moderating effect needs to be implemented in future studies.
Author Contributions
Conceptualization, H.-S.S. and S.-L.H.; methodology and formal analysis, H.-S.S.; writing and draft preparation, H.-S.S. and J.H.; supervision, S.-L.H. All authors have read and agreed to the published version of the manuscript.
Funding
This research received no external funding
Conflicts of Interest
The authors declare no conflict of interest
References
- Euromonitor. Commerce 2040: Revolutionary Tech Will Boost Consumer Engagement; Euromonitor International Report; 2018; Available online: https://www.euromonitor.com/commerce-2040-revolutionary-tech-will-boost-consumer-engagement/report (accessed on 23 December 2020).
- Wang, C. Consumer Acceptance of Self-service Technologies: An Ability–Willingness Model. Int. J. Mark. Res. 2017, 59, 787–802. [Google Scholar] [CrossRef]
- Dabholkar, P.A. Incorporating Choice into an Attitudinal Framework: Analyzing Models of Mental Comparison Processes. J. Consum. Res. 1994, 21, 100–118. [Google Scholar] [CrossRef]
- Meuter, M.L.; Ostrom, A.L.; Roundtree, R.I.; Bitner, M.J. Self-Service Technologies: Understanding Customer Satisfaction with Technology-Based Service Encounters. J. Mark. 2000, 64, 50–64. [Google Scholar] [CrossRef]
- Meuter, M.L.; Ostrom, A.L.; Bitner, M.J.; Roundtree, R. The influence of technology anxiety on consumer use and experiences with self-service technologies. J. Bus. Res. 2003, 56, 899–906. [Google Scholar] [CrossRef]
- Kelly, P.; Lawlor, J.; Mulvey, M. Self-service Technologies in the Travel, Tourism, and Hospitality Sectors: Principles and Practice. In Robots, Artificial Intelligence, and Service Automation in Travel, Tourism and Hospitality; Ivanov, S., Webster, C., Eds.; Emerald Publishing Limited: Bingley, UK, 2019; pp. 57–78. [Google Scholar] [CrossRef]
- Davis, F.D. Technology Acceptance Mode for Empirically Testing New End User Information Systems: Theory and Results. Ph.D. Dissertation, Sloan School of Management, Massachusetts Institute of Technology, Cambridge, MS, USA, 1986. [Google Scholar]
- Ajzen, I. Understanding Attitudes and Predicting Social Behavior; Prentice-Hall: Englewood Cliffs, NJ, USA, 1980. [Google Scholar]
- Parasuraman, A. Technology readiness index (TRI]: A multiple-item scale to measure readiness to embrace new technologies. J. Serv. Res. 2000, 2, 307–321. [Google Scholar] [CrossRef]
- Tsikriktsis, N. A Technology Readiness-Based Taxonomy of Customers: A Replication and Extension. J. Serv. Res. 2004, 7, 42–52. [Google Scholar] [CrossRef]
- Liljander, V.; Gillberg, F.; Gummerus, J.; Van Riel, A. Technology readiness and the evaluation and adoption of self-service technologies. J. Retail. Consum. Serv. 2006, 13, 177–191. [Google Scholar] [CrossRef]
- Lin, J.C.; Hsieh, P. The role of technology readiness in customers’ perception and adoption of self-service technologies. Int. J. Serv. Ind. Manag. 2006, 17, 497–517. [Google Scholar] [CrossRef]
- Meuter, M.L.; Bitner, M.J.; Ostrom, A.L.; Brown, S.W. Choosing Among Alternative Service Delivery Modes: And Investigation of Customer Trial of Self-Service Technologies. J. Mark. 2005, 69, 61–83. [Google Scholar] [CrossRef]
- Shim, H.S.; Han, S.L. Effects of TR and Consumer Readiness on SST usage Motivation, Attitude and Intention. Asia Mark. J. 2012, 14, 25–51. [Google Scholar]
- Hassan, M.U.; Iqbal, M.S.; Habibah, U. Self-Service Technology Service Quality: Building Loyalty and Intention Through Technology Trust in Pakistani Service Sector. SAGE Open 2020, 10, 2158244020924412. [Google Scholar] [CrossRef]
- Sedighimanesh, M.; Sedighmanesh, A.; Ashghei, N. The Impact of Self-Service Technology On Customer Satis-faction of Online Stores. Int. J. Sci. Technol. Res. 2017, 6, 172–178. [Google Scholar]
- Elliott, K.M.; Meng, J.; Hall, M.C. Technology Readiness and The Likelihood to use self-service technology: Chinese vs. American consumers. Mark. Manag. J. 2008, 18, 20–31. [Google Scholar]
- Wang, C.; Harris, J.; Patterson, P.G. Customer choice of self-service technology: The roles of situational influences and past experience. J. Serv. Manag. 2012, 23, 54–78. [Google Scholar] [CrossRef]
- Zhu, Z.; Nakata, C.; Sivakumar, K.; Grewal, D. Self-service technology effectiveness: The role of design features and individual traits. J. Acad. Mark. Sci. 2007, 35, 492–506. [Google Scholar] [CrossRef]
- Berger, S.C. Self-service technology for sales purposes in branch banking. Int. J. Bank Mark. 2009, 27, 488–505. [Google Scholar] [CrossRef]
- Son, M.; Han, K. Beyond the technology adoption: Technology readiness effects on post-adoption behavior. J. Bus. Res. 2011, 64, 1178–1182. [Google Scholar] [CrossRef]
- Iqbal, M.S.; Hassan, M.U.; Habibah, U.; TiuWright, L. Impact of self-service technology (SST] service quality on customer loyalty and behavioral intention: The mediating role of customer satisfaction. Cogent Bus. Manag. 2018, 5. [Google Scholar] [CrossRef]
- Cronin, J.J.; Taylor, S.A. Measuring Service Quality: A Reexamination and Extension. J. Mark. 1992, 56, 55. [Google Scholar] [CrossRef]
- Zeithaml, V.A.; Berry, L.L.; Parasuraman, A. The Behavioral Consequences of Service Quality. J. Mark. 1996, 60, 31. [Google Scholar] [CrossRef]
- Zeithaml, V.A.; Parasuraman, A.; Malhotra, A. Service Quality Delivery through Web Sites: A Critical Review of Extant Knowledge. J. Acad. Mark. Sci. 2002, 30, 362–375. [Google Scholar] [CrossRef]
- Baker, J. The Technology–Organization–Environment Framework. In Information Systems Theory; Dwivendi, Y., Wade, M., Schneberger, S., Eds.; Springer: New York, NY, USA, 2012. [Google Scholar]
- Dabholkar, P.A.; Bagozzi, R.P. An attitudinal model of technology-based self-service: Moderating effects of consumer traits and situational factors. J. Acad. Mark. Sci. 2002, 30, 184–201. [Google Scholar] [CrossRef]
- Fishbein, M.; Ajen, I. Belief, Attitude, Intention and Behavior: An Introduction to Theory and Research; Addison-Wesley: Reading, MA, USA, 1975. [Google Scholar]
- De Ruyter, J.K.; Wetzels, M.M.; Kleijnen, M. Customer adoption of e-service: An experimental study. Int. J. Serv. Ind. Manag. 2001, 12, 184–207. [Google Scholar] [CrossRef]
- Dabholkar, P.A. Consumer evaluations of new technology-based self-service options: An investigation of alternative models of service quality. Int. J. Res. Mark. 1996, 13, 29–51. [Google Scholar] [CrossRef]
- Maister, D. The Psychology of Waiting Lines. In The Service Encounter; Czepiel, J., Solomon, M., Suprenant, C., Eds.; Lexington Books: Lanham, MD, USA, 1985. [Google Scholar]
- Rapoport, A. Toward a Redefinition of Density. Environ. Behav. 1975, 7, 133–158. [Google Scholar] [CrossRef]
- Nunnally, J.; Bernstein, I. Psychometric Theory; McGraw Hill: New York, NY, USA, 1994. [Google Scholar]
- Bagozzi, R.; Yi, Y. On the evaluation of structural equation models. J. Acad. Mark. Sci. 1988, 16, 74–94. [Google Scholar] [CrossRef]
- Fornell, C.; Larcker, D. Structuarl Equation Models with Unobservable Variables and measurement Error: Algebra and Statistics. J. Mark. Res. 1981, 18, 382–388. [Google Scholar] [CrossRef]
- Podsakoff, P.M.; MacKenzie, S.B.; Lee, J.-Y.; Podsakoff, N.P. Common method biases in behavioral research: A critical review of the literature and recommended remedies. J. Appl. Psychol. 2003, 88, 879–903. [Google Scholar] [CrossRef]
- Aiken, L.; West, S. Multiple Regression: Testing and Interpreting Interactions; Sage Publications: Thousand Oaks, CA, USA, 1991. [Google Scholar]
- Gatignon, H.; Vosgerau, J. Stochastic Moderated Regression: An Efficient Methodology for Estimating Parameters in Moderated Regression. Mathematics 2006, 17, 1–45. [Google Scholar]

Publisher’s Note: MDPI stays neutral with regard to jurisdictional claims in published maps and institutional affiliations. |
© 2020 by the authors. Licensee MDPI, Basel, Switzerland. This article is an open access article distributed under the terms and conditions of the Creative Commons Attribution (CC BY) license (http://creativecommons.org/licenses/by/4.0/).