Abstract
Although there is a growing interest in identifying the variables that enhance student school adjustment, there is a lack of understanding of the mechanisms involved in it during adolescence. Despite there being works that confirm the positive relationship between school climate and academic performance, it is still unresolved which of the more specific aspects of climate are linked to this performance, as well as the degree to which an individual variable such as resilience can play a mediating role between both; these unknown factors constitute the objective of this study. A total of 731 students (mean age, Mage = 15.20 years; Standard Deviation, SD = 1.62) from the Basque Country participated; they completed the PACE-33 -school climate scale-, the CD-RISC10 -resilience scale- and the EBAE-10 -perceived academic performance subscale-. The full mediation model and the partial mediation model were tested. The results show that the model of choice is that of partial mediation: the resilience mediates the relationship between two specific aspects of the school climate (peer relationship and teachers’ ability to motivate) and perceived academic performance, and a third specific aspect (teachers’ expectations) has a direct relationship with perceived academic performance. These findings highlight the importance of attending to variables specific to the context in which the subject interacts, with the role of the teacher being especially important, in addition to promoting the development of resilience, due to the weight it has on the perception that students have about their school performance.
1. Introduction
Modern-day society is immersed in a process of constant transformation, with numerous social, cultural, economic, political and technological changes taking place in a short space of time. These changes and the needs derived from them constantly generate new challenges and oblige schools to adopt a dynamic of ongoing transformation, assessment and adaptation [1,2,3]. In addition to the classic tasks of transmitting, reconstructing and developing knowledge, schools must now also fulfil other functions. Among these functions are socialising students, instilling in them values and healthy habits, helping them construct their individual awareness and develop the abilities and learning strategies they will need to adapt to and cope with the different situations they will face throughout their lives [4,5]. Although these tasks are not the sole remit of the educational field and are shared also by other social institutions, tradition has always and continues to attach an increasing degree of responsibility to schools in this undertaking [3]. In light of this, among the most pressing concerns today in the field of psychoeducational research is how to gain greater insight into the phenomenon of school adjustment, of which perceived academic performance is a fundamental variable. This is performed by measuring contextual variables such as school climate, paying special attention to adolescent students’ strengths, such as resilience, which help them cope with the school context. Among the principal aims of the research conducted in this field is to improve the current situation of the education system and prevent dropout [6,7,8].
1.1. School Climate and Perceived Academic Performance
Among the indexes of school adjustment that has been studied most widely over the years is academic performance. This construct is usually defined as the level of knowledge demonstrated by the student in a specific area or subject in comparison with the standard for their age and academic level [9,10]. However, performance can also encompass qualitative information based on self-perceived assessments [6,11]. This is the conceptual basis used in the present study. Regardless of the theoretical perspective, performance is considered a multidimensional construct [12] determined by cognitive, motivational, socio-environmental and pedagogic or methodological elements [13].
Furthermore, among the principal contextual variables linked to school adjustment is school climate; many different studies have found that a positive school climate is associated with multiple satisfactory results for students, at both a cognitive and an affective level [14]. Cognitive outcomes include stronger motivation [15] and commitment to academic activities [16]; whereas affective ones include a reduction in both stress [17] and student depression [18], as well as bullying [19,20] and aggression and victimization in love relationships [21]. Although there is no single widely-accepted definition of the school climate construct, many recent studies support that proposed by Cohen et al. [22] and the National School Climate Center [23], who argue that school climate refers to the quality and nature of school life, and is based on individuals’ perception of their school as informed by their experiences in it. According to these authors, school climate reflects the school’s values, aims, rules, habits, interpersonal relationships, teaching and learning practices and organisational structures. Due to the lack of a single, universally-accepted definition of school climate, the internal structure of the construct has yet to be clearly established, and a number of different proposals exist. Nevertheless, recent studies [24,25] have identified the following nine aspects as being the most important: physical safety, rules, student–teacher relationships, peer relationships, group cohesion, environmental–structural aspects, teachers’ ability to motivate, teachers’ expectations and methodological resources. The few studies that have analysed the relationship between school climate and perceived academic performance report a significant positive association between the two variables among secondary school students [26] and those studying for the Spanish Baccalaureate (equivalent to A levels in the UK and the last two years of high school in the USA) [27]. Furthermore, the many studies that have examined the relationship between school climate and academic performance measured in terms of the qualifications obtained by students also corroborate this association [28,29,30]. Nevertheless, it is important to note that some studies which have explored this question in more depth, analysing the relationship between some of the more relevant aspects of school climate and perceived academic performance, report that not all aspects have the same impact on the outcome variable [31,32,33]. To date, however, no study has jointly analysed the relationship between all nine of the principal aspects of school climate [24,25] and perceived academic performance.
1.2. Resilience as a Mediator Variable
The psychological variable resilience has been recognised as a relevant factor in both aspects of adolescents’ psychosocial adjustment, namely, personal wellbeing and school adjustment [34]. Over recent years, this variable has been the object of much interest in the field of educational psychology, since it offers a new constructive, positive vision of human capacity [35]. There is general agreement regarding the affirmation that resilience is a dynamic development process which encompasses the individual’s positive adaptation to a context of significant adversity or crisis [36,37]. Thus, resilient people are defined as those who, despite being immersed in a situation of adversity or exposed to a large number of risk factors, are able to use the protective factors available to them to overcome their circumstances and grow and develop adequately, maturing as competent individuals in spite of an unfavourable prognosis [38]. Previous studies have shown that the ability to react to adversity involves a combination or interaction between the attributes of the subject himself (internal) and those of his social, family and cultural environment (external) that help him to overcome risk and adversity in a constructive manner [39]. The relationship between positive school climate and resilience has been amply documented over the years. Many studies have reported that students with a favourable perception of school climate are more resilient than those who view the climate at their school in a negative light [40,41,42]. Nevertheless, very few studies have explored the relationship between resilience and the specific aspects of school climate [43,44], some of which have been taken into consideration individually, but not jointly.
The relationship between resilience and perceived academic performance has also received very little attention. Of the few studies which have explored this association, one conducted with a population of young immigrants found that those who believed they were doing well at school scored significantly higher for resilience [45], and another [46] found that resilience predicted perceived academic performance among university students, both directly and indirectly through coping. Similarly, Rodríguez-Fernández et al. [47] found a relationship between resilience and perceived academic performance which was mediated by subjective wellbeing and school engagement.
Previous research has also highlighted the fact that resilience is a psychosocial construct that acts as a potential mediator between different variables [48,49,50]. Evidence indicates that resilience mediates the relationship between the psychological variables psychological wellbeing and mental health and academic performance [51], as well as the association between various sociodemographic factors and academic performance [52,53].
1.3. The Present Study
Although, as shown above, there is a large body of evidence indicating a positive pairwise relationship between school climate, resilience and perceived academic performance, the nature of the simultaneous association among all three has yet to be determined. Furthermore, the relationship between the most relevant aspects of school climate and both resilience and perceived academic performance is not yet established. Thus, the aim of the present study is to analyse the relationship between the most important specific aspects of school climate and perceived academic performance, and to explore the mediating role played by resilience in this association. To this end, we tested two mediation models and we compared their fits: a full mediation model (M1) and a partial mediation model (M2) (Figure 1).
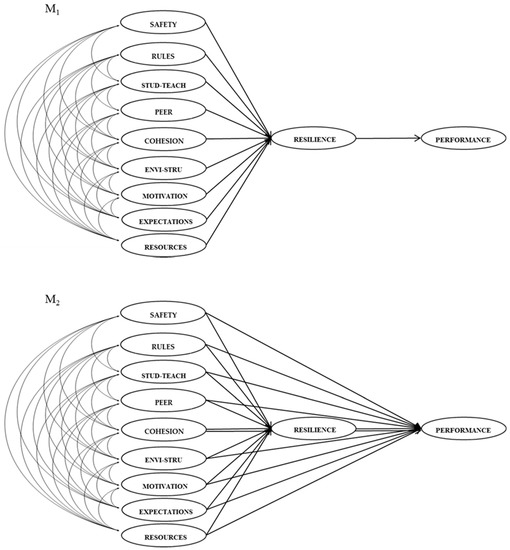
Figure 1.
Conceptual diagrams of the hypothesised models.
2. Materials and Methods
2.1. Participants
The initial sample comprised 756 students from 8 schools in the Basque Country (Spain): 6 of those schools were public and the other 2 were semi-private (private with some state funding). After eliminating those cases in which participants rated less than 10% of the items, along with those giving inconsistent answers and those with an atypical response pattern, the final sample comprised 731 students from compulsory secondary education (known as ESO in Spain) and the Spanish Baccalaureate (equivalent to A-levels in the UK and the final two years of high school in the USA). Participants were aged between 12 and 19 years (Mage = 15.20 years, SD = 1.62). Of the total, 370 (50.62%) were girls and 361 (49.38%) boys, with the groups being considered evenly balanced (χ2 = 0.128, p > 0.05); in terms of school year, 223 (30.51%) were in the first two years of ESO at the time of the study, 360 (49.25%) were in the final two years of ESO and 148 (20.24%) were studying for the Spanish Baccalaureate. A convenience sampling method was used.
2.2. Measurement Instruments
School climate, understood as students’ perception of the climate at their school, was assessed using the PACE-33 scale [24,25]. This scale offers 5 response options ranging from 1 (totally disagree) to 5 (totally agree) and comprises 33 items (29 direct and 4 inverse) grouped into nine subscales: physical safety (e.g., “At my school there are students who get into fights”); rules (e.g., “My school has clear rules”); student–teacher relationships (e.g., ”At my school there are teachers whom I can talk to about any problems I may be having”); peer relationships (e.g., ”I feel comfortable talking to my classmates about my problems”); group cohesion (e.g., “Everyone in my class helps and looks after each other”); environmental–structural aspects (e.g., ”My classroom is well lit”); teachers’ ability to motivate (e.g., ”Our teachers manage to get us interested in classwork”); teachers’ expectations (e.g., ”Our teachers expect us to work hard”); and methodological resources (e.g., ”I think the materials we use in class are interesting”). The confirmatory factor analysis carried out on this instrument reveals that the underlying factor structure is the one of nine correlated factors [25]. In the present study, the nine subscales had adequate internal consistency reliability coefficients: physical safety (α = 0.832, ω = 0.833, ρ = 0.838), rules (α = 0.833, ω = 0.828, ρ = 0.829), student–teacher relationships (α = 0.828, ω = 0.818, ρ = 0.819), peer relationships (α = 0.864, ω = 0.865, ρ = 0.865), group cohesion (α = 0.853, ω = 0.853, ρ = 0.854), environmental–structural aspects (α = 0.701, ω = 0.698, ρ = 0.720), teachers’ ability to motivate (α = 0.913, ω = 0.908, ρ = 0.908), teachers’ expectations (α = 0.790, ω = 0.798, ρ = 0.806) and methodological resources (α = 0.802, ω = 0.806, ρ = 0.808).
Resilience was measured using the Spanish adaptation [54] of the CDRISC-10 [55], which is a reduced version of the 25-item CD-RISC by Connor and Davidson [56] that provides an overall measure of resilience. The CDRISC-10 has a 5-point Likert-type response scale ranging from 1 (totally disagree) to 5 (totally agree) and comprises 10 items from the original scale (numbered as 1, 4, 6, 7, 8, 11, 14, 16, 17 and 19). The internal consistency reliability coefficients for this study were: α = 0.825; ω = 0.816; ρ = 0.826.
Participants’ perceived academic performance was assessed using the academic performance subscale of the Brief School Adjustment Scale (EBAE-10) by Moral-de-la-Rubia et al. [57]. This subscale comprises 3 items (”I think I’m a good student”, ”I enjoy doing my school work” and ”I get good grades”) with 6 response options (totally disagree, disagree, slightly disagree, slightly agree, agree, totally agree) and is designed to measure students’ perceptions about their self-efficacy, enjoyment of school work and grades. The internal consistency reliability coefficients obtained in the present study were adequate: α= 0.700, ω = 0.708, ρ = 0.738.
2.3. Procedure
First, 35 schools were selected by means of a purposive sampling technique based on availability. Of these, 8 agreed to participate in the study. Since the study involved minors, after obtaining authorisation from the participating schools, students’ legal guardians were contacted to request their informed consent using a document specifically compiled for this purpose. To guarantee uniform completion, the measurement instruments were administered simultaneously to all students in each class during class time. Data collection lasted approximately 35 min in each class and was supervised by two of the authors of this paper, who facilitated the process and clarified any doubts. Steps were taken to avoid threats to the validity of the results. Firstly, the single blind criterion was used to prevent students from knowing the purpose of the study; and secondly, with the aim of reducing social desirability bias and insincere responses, respondents were assured that participation was voluntary and that their answers would be completely anonymous.
2.4. Data Analysis
Two statistical programs were used in this study. The SPSS v.25 (IBM Corporation, Armonk, NY, USA) [58] was used for the prior data analyses, as well as for the descriptive and correlational analyses; the EQS v.6.2 (Multivariate Software, Encino, CA, USA) [59] was used in the prior analyses to assess Mardia’s standardised coefficient of kurtosis and to estimate the proposed structural equations models.
First of all, the preliminary analyses identified 23 participants who had failed to respond to at least 10% of the items and/or had strange or inconsistent response patterns. Next, missing values were analysed. Once we had verified that the number of missing values did not exceed 5% of the total data analysed, and that the pattern of missing values was random, said values were imputed using the linear trend point estimation method. Next, two cases with atypical values were identified using the anomaly detection procedure. Finally, before continuing with the analysis procedure, the data were tested for multivariate normal distribution. Since the value obtained for Mardia’s standardised coefficient of kurtosis (37.79) exceeded the cut-off value of 3 suggested by Bentler and Wu [60], it was not possible to assume that the data used in this study approached multivariate normal distribution.
As regards the data analysis process, first, descriptive and correlational analyses were conducted of the different variables using Pearson’s correlation coefficient. Although the items are not continuous variables, they were rated on a 5 point scale and had approximately normal distributions, two conditions necessary for using Pearson’s product-moment correlation matrix [61]. Second, both the measurement model itself and the two proposed mediation models were tested, using in both cases the robust maximum likelihood method, since we had previously found that the data did not have a normal multivariate distribution [60]. The fit of the models was assessed using the following robust indexes: Satorra–Bentler chi-squared (SBχ2); Satorra–Bentler chi-squared/degrees of freedom ratio (SBχ2/df), in which a score of 2.00–3.00 or lower indicates a good fit [62]; Comparative Fit Index (CFI), Non-Normed Fit Index (NNFI) and Normed Fit Index (NFI), in which values of over 0.90 are deemed acceptable [63]; Root Mean Square Error of Approximation (RMSEA) and its respective 90% confidence interval, in which values of under 0.06 indicate optimum fit [64]. We also used the Wald test to check that all the specified relationships were significant, since it is not enough for these models to have adequate fit values; rather, all relationships must also be significant [65].
To compare the proposed mediation models, we used the change value in the Satorra–Bentler chi-squared index (ΔSBχ2) and the Akaike information criterion (AIC). In order for the two models tested to be considered statistically different, the p-valor associated with the differences test between the Satorra–Bentler chi-squared indexes must reveal a value of below 0.05 and the difference between the AIC values must be greater than 10, with the model with the lowest value in this index being deemed to have the best fit [66].
Finally, we assessed the fit of the best fitting mediation model solely with the specific relationships which were found significant, and the regression coefficients of that model were analysed individually.
3. Results
3.1. Descriptive Statistics and Correlations between the Study Variables
Table 1 shows the results obtained in the Pearson correlation analysis and the analysis of means and standard deviations of the study variables.

Table 1.
Bivariate correlations, means and standard deviations of the study variables.
As shown in the Table 1, the vast majority of variables correlated significantly and positively with each other. However, the physical safety variable correlated negatively with rules, teacher-student relationships, peer relationships, teachers’ expectations and perceived academic performance, although these correlations were not significant. Additionally, peer relationships did not correlate significantly with perceived academic performance.
3.2. Measurement Model
The measurement model included 11 latent variables: the nine most relevant aspects of school climate, resilience and perceived academic performance. In all cases, the indicators were the items of the scales administered. The analysis of the measurement model revealed an acceptable fit: SBχ2/df(851) = 1692.464, p < 0.05; SBχ2/df = 1.989; RMSEA(90%) = 0.037(0.034, 0.039); NFI = 0.868; NNFI = 0.921; CFI = 0.929. Moreover, all factor loadings of the indicators pertaining to the latent variables were significant (p < 0.01), implying that all latent factors were correctly represented by their indicators.
3.3. Analysis of the Proposed Theoretical Models
In order to verify the relationships between the variables included in the study, the overall fit was estimated for the two theoretical models tested. First, the full mediation model (M1) was tested, followed by the partial mediation one (M2).
The goodness-of-fit indexes obtained revealed that both models were consistent with the data (Table 2). Nevertheless, the Chi-square independence test (χ²(9) = 39.666, p < 0.05) indicated significant differences between them. This was further corroborated by the AIC index, which indicated a difference of greater than 10 between the two models; consequently, it is possible to conclude that M2 is the most parsimonious model.
Table 2.
Goodness-of-fit indexes for the full and partial mediation models.
An individual analysis of the M2 regression coefficients revealed that many of the nine most relevant aspects of school climate failed to attain significance level (p < 0.01) with resilience and perceived academic performance (Table 3). A third model was, therefore, estimated, taking into consideration only those regressions which were found to be significant: (1) the association between the specific aspects peer relationships and teachers’ ability to motivate and perceived academic performance, mediated by resilience; (2) the direct relationship between teachers’ expectations and perceived academic performance; (3) the associations among three aspects of school climate (peer relationships, teachers’ ability to motivate and teachers’ expectations) (Figure 2). It was then verified that this third model was consistent with the data: SBχ2(182) = 538.299, p < 0.05; SBχ2/df = 2.958; RMSEA(90%) = 0.052(0.047, 0.057); NFI = 0.903; NNFI = 0.923; CFI = 0.933.
Table 3.
Standardised regression coefficients of the partial mediation model (M2).
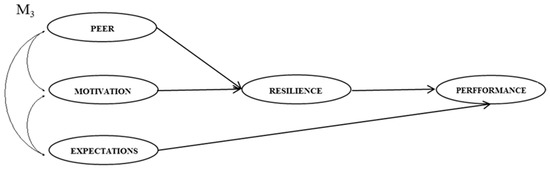
Figure 2.
Conceptual diagram of M3.
3.4. Standardised Regression Coefficients of the Final Model
The M3 regression coefficients revealed that all the proposed pathways, both direct and indirect, attained statistical significance at p < 0.01 (Table 4).
Table 4.
Standardised regression coefficients of the final model (M3).
The specific aspects of peer relationships and teachers’ ability to motivate were found to have an indirect relationship with perceived academic performance through resilience, and this variable and the specific aspect teachers’ expectations had a direct relationship with the outcome variable.
Teachers’ expectations and, alongside resilience as a mediator variable, peer relationships and teachers’ ability to motivate were found to explain 15.3% of perceived academic performance. In turn, peer relationships and teachers’ ability to motivate were found to explain 6.9% of resilience.
4. Discussion
This study sought to explore and determine the relations between the most relevant aspects of school climate and perceived academic performance, and to analyse the mediating role that resilience has in this association, with the aim of filling an existing gap in the literature. The fact that different variables were studied simultaneously reflects the complex personal–contextual interactions that foster wellbeing, and this is the path we should follow if we wish to move towards a more comprehensive explanation of adolescent behaviour [67,68].
Unlike previous studies that confirm the relationship between school climate and perceived academic performance [26,27], this study goes deeper into this relation and details which specific aspect of school climate has a direct relationship with perceived academic performance and which ones maintain an indirect relationship with this resulting variable through resilience. On the one hand, the results obtained reveal that teachers’ expectations of students’ work and interest are not only linked to real academic performance, as demonstrated by previous studies [31,33,69], but are also associated with students’ own perceptions of their academic performance. This confirms the relationship between teachers’ expectations and academic performance, regardless of how the latter variable is measured. On the other hand, they show that resilience mediates the association between two specific aspects of school climate and perceived academic performance. This is consistent with that reported by other studies which found that resilience mediates between diverse sociodemographic variables and academic performance [52,53]. In this study, resilience was found to mediate the association between perceived academic performance and the specific aspects peer relationships and teachers’ ability to motivate. This supports the idea that students who perceive their relationships with their peers as positive are more likely to report greater resilience [43,44,70]. It also corroborates the theory that students who are motivated by their teachers can tap into their own resilience and develop attitudes that foster successful learning [71].
It is interesting to note that the specific aspect of student–teacher relationships was not found to be either directly or indirectly associated with perceived academic performance through resilience. This is surprising since previous studies have observed that the relationships teachers maintain with their students have a strong influence on both resilience [43,44,70] and academic performance [32,72]. This fact may be explained by the use of different types of measuring instruments for the assessment of the same variable; while in this study a self-report was used to assess the students’ perception of their performance, in previous works, they use the grades assigned by the teachers. Wang et al. [73], for example, found that the different types of measurement instruments used (e.g., external observation versus self-report survey) to assess classroom climate influence the strength of associations between climate and adolescent outcomes. The results of this this study should, therefore, be compared with those obtained by future research aiming to analyse the relationship between the most relevant aspects of school climate and academic performance measured through self-reports.
The findings of this study will enable the design and implementation of interventions to improve perceived academic performance focusing on the specific aspects of school climate that have been shown to have a relationship with it, with the ultimate aim of improving school adjustment.
Despite the important contribution made by the present study, it is not without its limitations. First, although the ex post facto research design used enables relational hypotheses to be generated and explored, it does not permit the establishment of causal relationships. In other words, the structural equations analyses carried out in the present study enable the correlations observed between the variables at a single moment in time to be used to determine the statistical feasibility of the hypothesised causal relationships [74], but do not allow causal relationships themselves to be established. Consequently, future research should seek to explore the causal relationships between the study variables, using, for example, longitudinal or experimental designs. Moreover, future research may also wish to verify the results obtained here using complementary data collection methods, such as personal interviews with students or observation scales. It would also be interesting for future studies to replicate this one using other mediator variables which may influence the relationship between the most relevant aspects of school climate and perceived academic performance. On the one hand, school climate has been shown to be associated with, among other things, motivation [15], psychological wellbeing [75,76] and self-esteem [77]. On the other hand, perceived academic performance has been linked to perceived support and school engagement [7] and coping [46]. Thus, motivation, psychological wellbeing, school engagement, perceived support and coping may mediate the relationship between the specific aspects of school climate and perceived academic performance.
5. Conclusions
The present study has both theoretical and practical implications. At a theoretical level, it corroborates other studies which claim that resilience mediates between numerous different variables [48,49,51,52,53], and represents an important step forward in the identification of the specific aspects of school climate that are directly or indirectly related (through resilience) to perceived academic performance, and therefore, to school adjustment. This is important because, although different studies have documented the relationship between school climate and perceived academic performance [26,27], to date, none have clarified which specific aspects of this construct are significantly associated (either directly or indirectly through other variables) with students’ perceptions of their own performance. At a practical level, knowing which specific aspects of school climate are positively associated with perceived academic performance will help schools foster training programmes aimed at raising teachers’ awareness of the importance of motivating and having high expectations of students. It will also encourage them to engage in educational interventions designed to improve students’ peer relationships and resilience, which has been shown to be an ability [78] and, therefore, something which can potentially be developed and improved. These interventions will also enable longitudinal studies to be carried out to analyse the causal relationships which exist between the variables contemplated here (the nine principal aspects of school climate, resilience and perceived academic performance), as opposed to the cross-sectional approach adopted in this study.
Author Contributions
Conceptualization, N.E.M., A.F.-Z. and E.G.P.; methodology, N.E.M. and A.F.-Z.; software, N.E.M. and A.F.-Z.; formal analysis and interpretation of the results, N.E.M., A.F.-Z. and E.G.P.; resources, N.E.M. and I.I.-d.-l.-F.D.-d.-C.; data curation, N.E.M., E.G.P. and I.I.-d.-l.-F.D.-d.-C.; writing—original draft preparation, N.E.M., A.F.-Z. and E.G.P.; writing—review and editing, N.E.M., A.F.-Z., E.G.P. and I.I.-d.-l.-F.D.-d.-C.; visualization, N.E.M., A.F.-Z., E.G.P. and I.I.-d.-l.-F.D.-d.-C.; supervision, A.F.-Z. and E.G.P.; funding acquisition, A.F.-Z. and E.G.P. All authors have read and agreed to the published version of the manuscript.
Funding
This research was funded by the consolidated research group IT1217-19 of the Basque University System and of the project EDU2017-83949-P of the State Subprogram of Knowledge Generation of the Ministry of Economy, Industry and Competitiveness of Spain. Its first and last authors are beneficiaries of the Pre-doctoral Training Programme for Non-Doctoral Research Staff of the Basque Government’s Department of Education.
Institutional Review Board Statement
The study was conducted according to the guidelines of the Declaration of Helsinki, and approved by the Ethics Committee of the University of the Basque Country (protocol code M10_2018_256, 18 December 2018).
Informed Consent Statement
Informed consent was obtained from all subjects involved in the study.
Data Availability Statement
The data presented in this study are available on request from the corresponding author. The data are not publicly available due to them containing information that could compromise research participant privacy/consent.
Acknowledgments
The authors would like to express their gratitude to the reviewers and magazine editors for their efforts to improve the quality of this paper.
Conflicts of Interest
The authors declare no conflict of interest. The funders had no role in the design of the study; in the collection, analyses, or interpretation of data; in the writing of the manuscript, or in the decision to publish the results.
References
- Cáceres-Correa, I. Educación en el escenario actual de pandemia. Utopía y Prax. Latinoam. Rev. Int. Filos. Iberoam. y Teoría Soc. 2020, 25, 11–12. [Google Scholar]
- Coll, C.; Mauri, T.; Colomina, R.; Engel, A.; Oller, J.; Onrubia, J.; Rochera, M.J. Hacia una educación distribuida e interconectada. Algunas implicaciones para la formación de los docentes. In Educación 2018–2020. Retos, Tendencias y Compromisos; LLeixà, T., Gros, B., Mauri, T., Medina, J.L., Eds.; IRE-UB: Barcelona, Spain, 2018; pp. 27–33. [Google Scholar]
- Parody, L.M.; Santos, M.J.; del Olmo, M.J.A.; Isequilla, E. El desafío educativo del siglo XXI: Relevancia de la cooperación entre familia y escuela. Espiral Cuad. Del Profr. 2019, 12, 19–29. [Google Scholar] [CrossRef]
- Bertel, J.C. Una reflexión sobre el ideal de la educación actual. Rev. Bol. Redipe 2016, 4, 86–90. [Google Scholar]
- Martí, Y.; Montero, B.; Sánchez, K. La función social de la educación: Referentes teóricos actuales. Rev. Conrado 2018, 14, 259–267. [Google Scholar]
- Fernández-Lasarte, O.; Ramos-Díaz, E.; Goñi, E.; Rodríguez-Fernández, A. Estudio comparativo entre educación superior y educación secundaria: Efecto del apoyo social percibido, el autoconcepto y la reparación emocional en el rendimiento académico. Educ. XX1 2019, 22, 165–185. [Google Scholar] [CrossRef]
- Fernández-Lasarte, O.; Ramos-Díaz, E.; Goñi, E.; Rodríguez-Fernández, A. The role of social support in school adjustment during secondary education. Psicothema 2020, 32, 100–107. [Google Scholar] [CrossRef]
- Slemp, G.R.; Chin, T.C.; Kern, M.L.; Siokou, C.; Loton, D.; Oades, L.G.; Vella-Brodrick, D.; Waters, L. Positive education in Australia: Practice, measurement, and future directions. In Social and Emotional Learning in Australia and the Asia-Pacific: Perspectives, Programs and Approaches; Frydenberg, E., Martin, A.J., Collie, R.J., Eds.; Springer: Cham, Germany, 2017; pp. 101–122. [Google Scholar] [CrossRef]
- Jiménez, M. Competencia social: Intervención preventiva en la escuela. Infanc. y Soc. 2000, 24, 21–48. [Google Scholar]
- Torres, L.E.; Rodríguez, N.Y. Rendimiento académico y contexto familiar en estudiantes universitarios. Enseñ. e Investig. en Psicol. 2006, 11, 255–270. [Google Scholar]
- Azpiazu, L. El Ajuste Escolar: Un Modelo Explicativo en Función de Variables Contextuales y Personales. Ph.D. Thesis, University of the Basque Country, San Sebastián, Spain, 2016. [Google Scholar]
- Caso, J.; Hernández, L. Variables que inciden en el rendimiento académico de adolescentes mexicanos. Rev. Latinoam. Psicol. 2007, 39, 487–501. [Google Scholar]
- Rubio, M. Nuevas Orientaciones y Metodología Para la Educación a Distancia, 2nd ed.; Technical University of Loja: Loja, Ecuador, 2009. [Google Scholar]
- López, V.; Torres-Vallejos, J.; Ascorra, P.; Villalobos-Parada, B.; Bilbao, M.; Valdés, R. Construction and validation of a classroom climate scale: A mixed methods approach. Learn. Environ. Res. 2018, 21, 407–422. [Google Scholar] [CrossRef]
- Hughes, K.; Coplan, R.J. Why classroom climate matters for children high in anxious solitude: A study of differential susceptibility. Sch. Psychol. Q. 2018, 33, 94–102. [Google Scholar] [CrossRef] [PubMed]
- Wang, M.; Degol, J.L. School climate: A review of the construct, measurement, and impact on student outcomes. Educ. Psychol. Rev. 2016, 28, 315–352. [Google Scholar] [CrossRef]
- Bosworth, K.; Judkins, M. Tapping into the power of school climate to prevent bullying: One application of schoolwide positive behavior interventions and supports. Theory Pr. 2014, 53, 300–307. [Google Scholar] [CrossRef]
- Charalampous, K.; Kokkinos, C.M. The Greek elementary “What Is Happening In this Class?” (G-EWIHIC): A three-phase multi-sample mixed-methods study. Stud. Educ. Eval. 2017, 52, 55–70. [Google Scholar] [CrossRef]
- Farina, K.A. Promoting a culture of bullying: Understanding the role of school climate and school sector. J. Sch. Choice 2019, 13, 94–120. [Google Scholar] [CrossRef]
- Hong, J.S.; Espelage, D.L.; Lee, J.M. School climate and bullying prevention programs. In The Wiley Handbook on Violence in Education: Forms, Factors, and Preventions; Shapiro, H., Ed.; John Wiley & Sons, Inc.: Hoboken, NJ, USA, 2018; pp. 359–374. [Google Scholar] [CrossRef]
- Ruiz-Narezo, M.; Santibáñez, R. School climate and peer victimization. Involvement, affiliation and help perceived in school centers as protective factors against violent behavior in adolescent couples. Sustainability 2020, 12, 4705. [Google Scholar] [CrossRef]
- Cohen, J.; McCabe, E.M.; Michelli, N.M.; Pickeral, T. School climate: Research, policy, teacher education and practice. Teach. Coll. Rec. 2009, 111, 180–213. [Google Scholar]
- School Climate Guidelines. Available online: https://www.schoolclimate.org/about/our-approach/guidelines (accessed on 3 October 2020).
- Escalante, N.; Fernández-Zabala, A.; Goñi, E.; Izar-de-la-Fuente, I. Una nueva versión de la escala Percepción del Alumnado sobre el Clima Escolar (PACE) y análisis de sus propiedades psicométricas. Rev. Psicol. y Educ. J. Psychol. Educ. 2020, 15, 201–224. [Google Scholar] [CrossRef]
- Escalante, N.; Goñi, E.; Fernández-Zabala, A.; Antonio-Agirre, I. Internal structure, reliability and invariance across gender using the multidimensional school climate scale PACE-33. Int. J. Environ. Res. Public Health 2020, 17, 4800. [Google Scholar] [CrossRef]
- O’Malley, M.; Voight, A.; Renshaw, T.L.; Eklund, K. School climate, family structure, and academic achievement: A study of moderation effects. Sch. Psychol. Q. 2015, 30, 142–157. [Google Scholar] [CrossRef]
- Pérez, I.; Zamora, M.R.; Caldera, J.F.; Reynoso, O.; Cadena, A.; Mora, O. Ajuste escolar, clima escolar y apoyo social en bachilleres. Rev. Psicol. y Cienc. del Comport. la Unidad Acad. Cienc. Juríd. y Soc. 2020, 5–18. [Google Scholar] [CrossRef]
- Bhat, M.S.; Mir, S.A. Perceived school climate and academic achievement of secondary school students in relation to their gender and type of school. Int. J. Adv. Educ. Res. 2018, 3, 620–628. [Google Scholar]
- Dulay, S.; Karadağ, E. The effect of school climate on student achievement. In The Factors Effecting Student Achievement: Meta-Analysis of Empirical Studies; Karadağ, E., Ed.; Springer: Cham, Germany, 2017; pp. 199–213. [Google Scholar]
- Maxwell, S.; Reynolds, K.J.; Lee, E.; Subasic, E.; Bromhead, D. The impact of school climate and school identification on academic achievement: Multilevel modeling with student and teacher data. Front. Psychol. 2017, 8, 1–21. [Google Scholar] [CrossRef]
- Gil-del-Pino, C.; García-Segura, S. Influencia de las expectativas de familias y profesorado en el logro educativo y social de los estudiantes. Educ. e Pesqui. 2019, 45, 1–20. [Google Scholar] [CrossRef]
- Tschannen-Moran, M.; Parish, J.; Dipaola, M. School climate: The interplay between interpersonal relationships and student achievement. J. Sch. Leadersh. 2006, 16, 386–415. [Google Scholar] [CrossRef]
- Valle, A.; Núñez, J.C. Las expectativas del profesor y su incidencia en el contexto institucional. Rev. Educ. 2020, 290, 293–319. [Google Scholar]
- Noble, T.; McGrath, H. The PROSPER School Pathways for Student Wellbeing: Policy and Practices; Springer: Cham, Germany, 2016. [Google Scholar] [CrossRef]
- Ramos-Díaz, E.; Rodríguez-Fernández, A.; Fernández-Zabala, A.; Revuelta, L.; Axpe, I. Resiliencia y bienestar subjetivo en función del sexo y del nivel educativo en la adolescencia. Eur. J. Child Dev. Educ. Psychopathol. 2015, 3, 31–42. [Google Scholar] [CrossRef]
- Arratia, N.I.G. Autoestima, optimismo y resiliencia en niños en situación de pobreza. Rev. Int. Psicol. 2018, 16, 1–119. [Google Scholar] [CrossRef]
- Masten, A.S. Invited commentary: Resilience and positive youth development frameworks in developmental science. J. Youth Adolesc. 2014, 43, 1018–1024. [Google Scholar] [CrossRef]
- Noriega, G.; Angulo, B.; Angulo, G. La resiliencia en la educación, la escuela y la vida. Perspect. Docentes 2015, 58, 42–48. [Google Scholar]
- Arratia, N.I.G. Factores Determinantes de la Resiliencia en Niños de la Ciudad de Toluca. Ph.D. Thesis, Iberoamericana University, Ciudad de México, México, 2007. [Google Scholar]
- Benard, B. Resiliency: What We Have Learned? WestEd: San Francisco, CA, USA, 2004. [Google Scholar]
- Cocoradă, E.; Orzea, I.E. Relationships between wellbeing, resilience and school climate. Bull. Transilv. Univ. Bras. 2017, 10, 191–200. [Google Scholar]
- Fleischmann, C. Building Resilience Through A Positive School Climate. Ph.D. Thesis, Duquesne University, Pittsburgh, PA, USA, 2018. [Google Scholar]
- Aldridge, J.M.; Fraser, B.J.; Fozdar, F.; Ala’i, K.; Earnest, J.; Afari, E. Students’ perceptions of school climate as determinants of wellbeing, resilience and identity. Improv. Sch. 2016, 19, 5–26. [Google Scholar] [CrossRef]
- Riekie, H.; Aldridge, J.M.; Afari, E. The role of the school climate in high school students’ mental health and identity formation: A South Australian study. Br. Educ. Res. J. 2017, 43, 95–123. [Google Scholar] [CrossRef]
- Sandín-Esteban, M.-P.; Sánchez-Martí, A. Resilience and school success of young immigrants. Infanc. y Aprendiz. 2015, 38, 175–211. [Google Scholar] [CrossRef]
- Tipismana, O. Factores de resiliencia y afrontamiento como predictores del rendimiento académico de los estudiantes en universidades privadas. REICE Rev. Iberoam. Sobre Calid. Efic. y Cambio en Educ. 2019, 17, 147–185. [Google Scholar] [CrossRef]
- Rodríguez-Fernández, A.; Ramos-Díaz, E.; Axpe-Saez, I. The role of resilience and psychological well-being in school engagement and perceived academic performance: An exploratory model to improve academic achievement. In Health and Academic Achievement; Blandina, B.M., Ed.; IntechOpen: London, UK, 2019; pp. 159–176. [Google Scholar] [CrossRef]
- Liu, Y.; Wang, Z.; Lü, W. Resilience and affect balance as mediators between trait emotional intelligence and life satisfaction. Pers. Individ. Differ. 2013, 54, 850–855. [Google Scholar] [CrossRef]
- Ramos-Díaz, E.; Rodríguez-Fernández, A.; Axpe, I.; Ferrara, M. Perceived emotional intelligence and life satisfaction among adolescent students: The mediating role of resilience. J. Happiness Stud. 2019, 20, 2489–2506. [Google Scholar] [CrossRef]
- Sarrionandia, A.; Ramos-Díaz, E.; Fernández-Lasarte, O. Resilience as a mediator of emotional intelligence and perceived stress: A cross-country study. Front. Psychol. 2018, 9, 2653. [Google Scholar] [CrossRef]
- Khaleghkhah, A. Effect of psychological well-being and mental health on the student’s educational achievement with the mediating role of resiliency. Int. Rev. Manag. Mark. 2017, 7, 42–48. [Google Scholar]
- Novotny, S.; Křeménková, L. The relationship between resilience and academic performance at youth placed at risk. Ceskoslov. Psychol. 2016, 60, 553–566. [Google Scholar]
- Sakız, H.; Aftab, R. Academic achievement and its relationships with psychological resilience and socio-demographic characteristics. Int. J. Sch. Educ. Psychol. 2019, 7, 263–273. [Google Scholar] [CrossRef]
- Notario, B.; Solera, M.; Serrano, M.D.; Bartolomé, R.; García, J.; Martínez, V. Reliability and validity of the Spanish version of the 10-item Connor-Davidson Resilience Scale (10-item CD-RISC) in young adults. Health Qual. Life Outcomes 2011, 12, 3–8. [Google Scholar]
- Campbell-Sills, L.; Stein, M.B. Psychometric analysis and refinement of the Connor-Davidson Resilience Scale (CD-RISC): Validation of a 10-item measure of resilience. J. Trauma. Stress 2007, 20, 1019–1028. [Google Scholar] [CrossRef] [PubMed]
- Connor, K.M.; Davidson, J.R.T. Development of a new resilience scale: The Connor-Davidson Resilience Scale (CD-RISC). Depress. Anxiety 2003, 18, 76–82. [Google Scholar] [CrossRef]
- Moral de la Rubia, J.C.; Sánchez, J.C.; Villareal, M.E. Desarrollo de una escala multidimensional breve de ajuste escolar. Rev. Electrón. Metodol. Apl. 2010, 15, 1–11. [Google Scholar]
- IBM Corporation. IBM SPSS Statistics for Windows. Version 25.0; IBM Corp: Armonk, NY, USA, 2017. [Google Scholar]
- Bentler, P.M. EQS Structural Equations Program. Manual; Multivariate Software: Encino, CA, USA, 2006. [Google Scholar]
- Bentler, P.M.; Wu, E.J.C. EQS for Windows User’s Guide; Multivariate Software: Encino, CA, USA, 2002. [Google Scholar]
- Lloret-Segura, S.; Ferreres-Traver, A.; Hernández-Baeza, A.; Tomás-Marco, I. El análisis factorial exploratorio de los ítems: Una guía práctica, revisada y actualizada. An. Psicol. 2014, 30, 1151–1169. [Google Scholar] [CrossRef]
- Marsh, H.W.; Hau, K.T. Assessing goodness of fit: Is parsimony always desirable? J. Exp. Educ. 1996, 64, 364–390. [Google Scholar] [CrossRef]
- Kline, R. Principles and Practice of Structural Equation Modeling, 4th ed.; Guilford Press: New York, NY, USA, 2015. [Google Scholar]
- Marsh, H.W.; Hau, K.T.; Wen, Z. In search of golden rules: Comment on hypothesis-testing approaches to setting cutoff values for fit indexes and dangers in overgeneralizing Hu and Bentler’s (1999) findings. Struct. Equ. Model. A Multidiscip. J. 2004, 11, 320–341. [Google Scholar] [CrossRef]
- Holmbeck, G.N. Toward terminological, conceptual, and statistical clarity in the study of mediators and moderators: Examples from the child-clinical and pediatric psychology literatures. J. Consult. Clin. Psychol. 1997, 65, 599–610. [Google Scholar] [CrossRef]
- Symonds, M.R.E.; Moussalli, A. A brief guide to model selection, multimodel inference and model averaging in behavioural ecology using Akaike’s information criterion. Behav. Ecol. Sociobiol. 2011, 65, 13–21. [Google Scholar] [CrossRef]
- Casas, F. Subjective social indicators and child and adolescent well-being. Child Indic. Res. 2011, 4, 555–575. [Google Scholar] [CrossRef]
- Rodríguez-Fernández, A.; Droguett, L.; Revuelta, L. School and personal adjustment in adolescence: The role of academic self-concept and perceived social support. Rev. Psicodidact. J. Psychodidact. 2012, 17, 397–414. [Google Scholar] [CrossRef]
- De Boer, H.; Timmermans, A.C.; Van der Werf, M.P.C. The effects of teacher expectation interventions on teachers’ expectations and student achievement: Narrative review and meta-analysis. Educ. Res. Eval. 2018, 24, 180–200. [Google Scholar] [CrossRef]
- Enthoven, M.E.M. The Ability to Bounce Beyond: The Contribution of the School Environment to the Resilience for Dutch Urban Middle-Adolescents from a Low Socio-Economic Background. Ph.D. Thesis, University of Pretoria, Gauteng, South Africa, 2007. [Google Scholar]
- Acevedo, V.; Restrepo, L. De profesores, familias y estudiantes: Fortalecimiento de la resiliencia en la escuela. Rev. Latinoam. Cienc. Soc. Niñez y Juv. 2012, 10, 301–319. [Google Scholar]
- Crosnoe, R.; Johnson, M.K.; Elder, G.H. Intergenerational bonding in school: The behavioral and contextual correlates of student-teacher relationships. Sociol. Educ. 2004, 77, 60–81. [Google Scholar] [CrossRef]
- Wang, M.-T.; Degol, J.L.; Amemiya, J.; Parr, A.; Guo, J. Classroom climate and children’s academic and psychological wellbeing: A systematic review and meta-analysis. Dev. Rev. 2020, 57, 100912. [Google Scholar] [CrossRef]
- Ruíz, M.; Pardo, A.; San Martín, R. Modelos de ecuaciones estructurales. Papeles del Psicól. 2014, 31, 34–45. [Google Scholar]
- Newland, L.A.; De Cino, D.A.; Mourlam, D.J.; Strouse, G.A. School climate, emotions, and relationships: Children’s experiences of well-being in the Midwestern U.S. Int. J. Emot. Educ. 2019, 11, 67–83. [Google Scholar]
- Varela, J.J.; Sirlopú, D.; Melipillán, R.; Espelage, D.; Green, J.; Guzmán, J. Exploring the influence school climate on the relationship between school violence and adolescent subjective well-being. Child Indic. Res. 2019, 12, 2095–2110. [Google Scholar] [CrossRef]
- Estrada, E.G.; Mamani, H.J.; Arrunátegui, R.E. Clima social escolar y autoestima de los estudiantes de educación secundaria de la Institución Educativa “Aplicación Nuestra Señora Del Rosario” de Puerto Maldonado. Rev. Perspect. 2020, 388–397. [Google Scholar] [CrossRef]
- Oshio, A.; Taku, K.; Hirano, M.; Saeed, G. Resilience and big five personality traits: A meta-analysis. Pers. Individ. Differ. 2018, 127, 54–60. [Google Scholar] [CrossRef]


Publisher’s Note: MDPI stays neutral with regard to jurisdictional claims in published maps and institutional affiliations. |
© 2020 by the authors. Licensee MDPI, Basel, Switzerland. This article is an open access article distributed under the terms and conditions of the Creative Commons Attribution (CC BY) license (http://creativecommons.org/licenses/by/4.0/).